Embed Size (px)
Citation preview
“Heating Homes in Britain and
Ireland – is there a long term
future for fossil fuels?”
Mike Foster
CEO Energy and Utilities Alliance
Energy trilemna
Security of supply
Affordability
Greenhouse gas
emissions

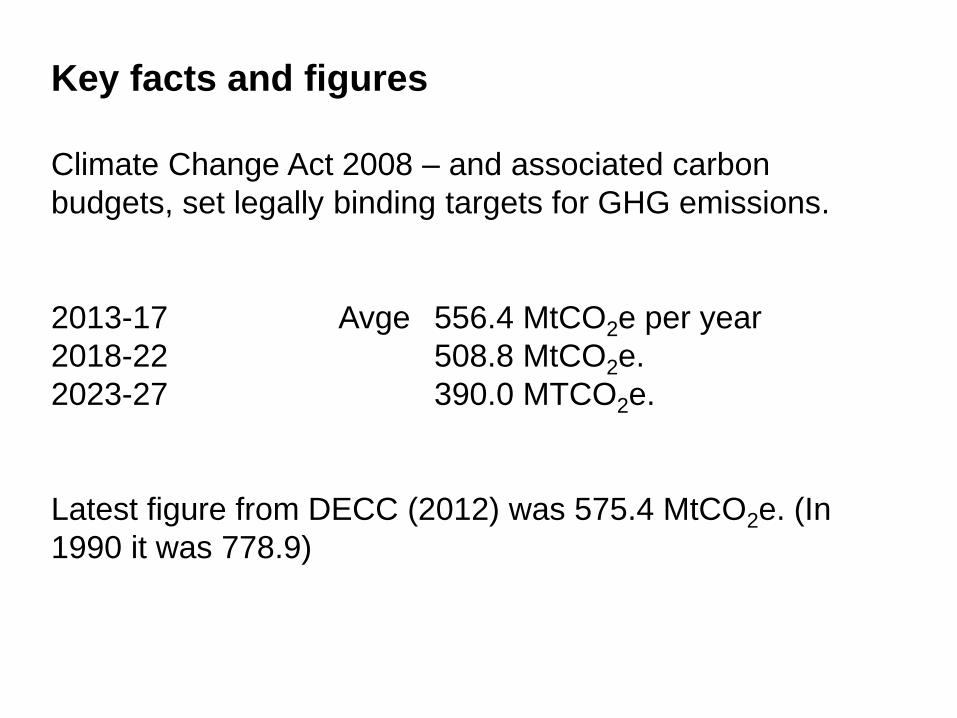
Key facts and figures
Climate Change Act 2008 – and associated carbon
budgets, set legally binding targets for GHG emissions.
2013-17 Avge 556.4 MtCO2e per year
2018-22 508.8 MtCO2e.
2023-27 390.0 MTCO2e.
Latest figure from DECC (2012) was 575.4 MtCO2e. (In
1990 it was 778.9)
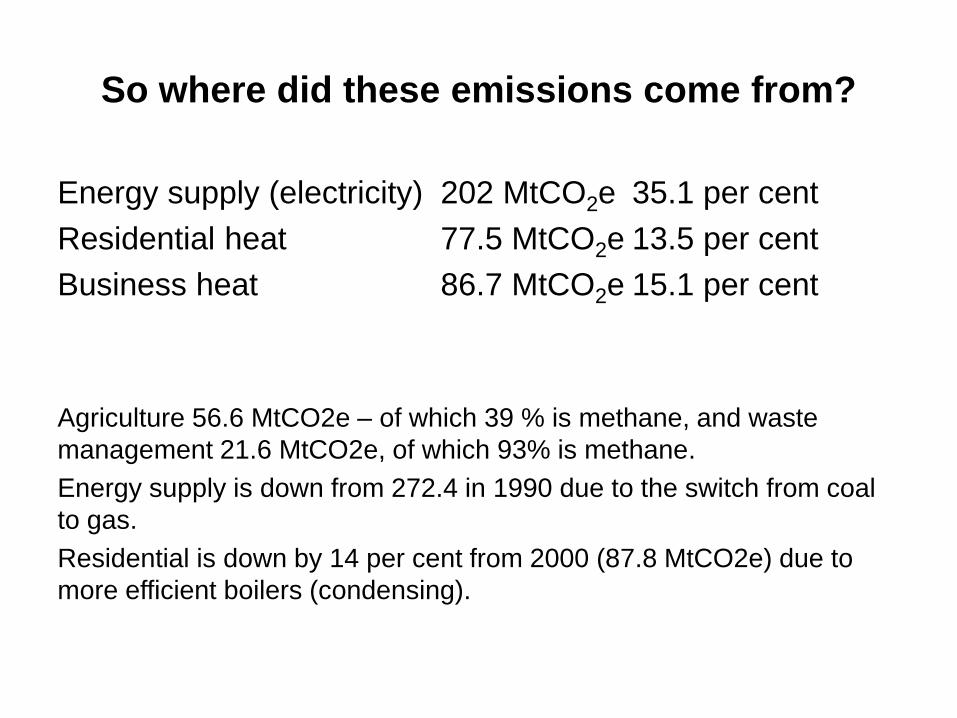
So where did these emissions come from?
Energy supply (electricity) 202 MtCO2e 35.1 per cent
Residential heat 77.5 MtCO2e 13.5 per cent
Business heat 86.7 MtCO2e 15.1 per cent
Agriculture 56.6 MtCO2e – of which 39 % is methane, and waste
management 21.6 MtCO2e, of which 93% is methane.
Energy supply is down from 272.4 in 1990 due to the switch from coal
to gas.
Residential is down by 14 per cent from 2000 (87.8 MtCO2e) due to
more efficient boilers (condensing).
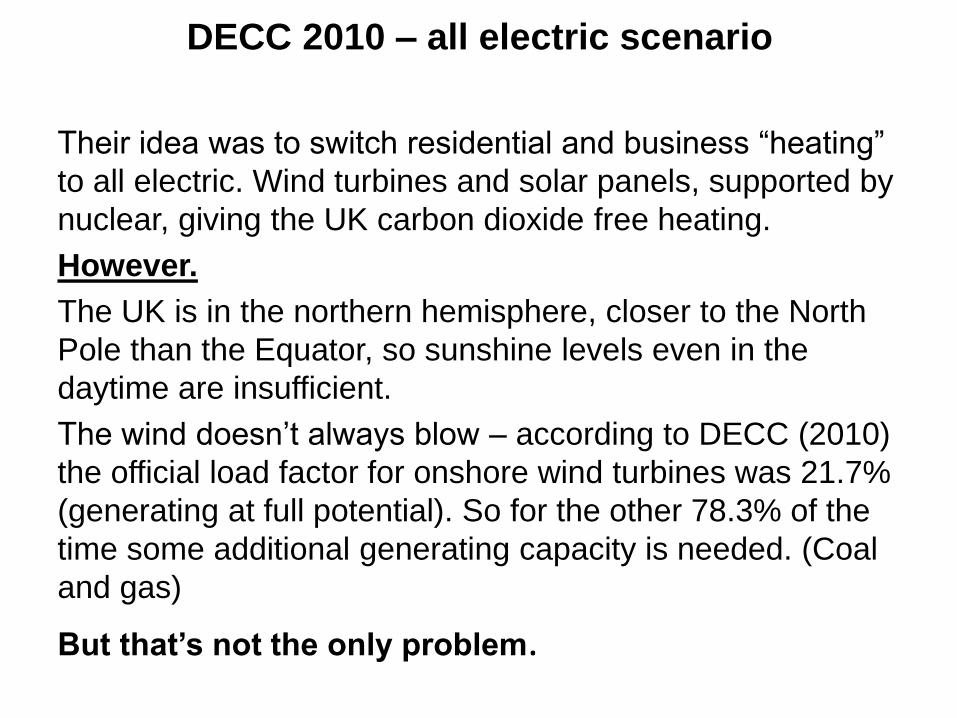
DECC 2010 – all electric scenario
Their idea was to switch residential and business “heating”
to all electric. Wind turbines and solar panels, supported by
nuclear, giving the UK carbon dioxide free heating.
However.
The UK is in the northern hemisphere, closer to the North
Pole than the Equator, so sunshine levels even in the
daytime are insufficient.
The wind doesn’t always blow – according to DECC (2010)
the official load factor for onshore wind turbines was 21.7%
(generating at full potential). So for the other 78.3% of the
time some additional generating capacity is needed. (Coal
and gas)
But that’s not the only problem.
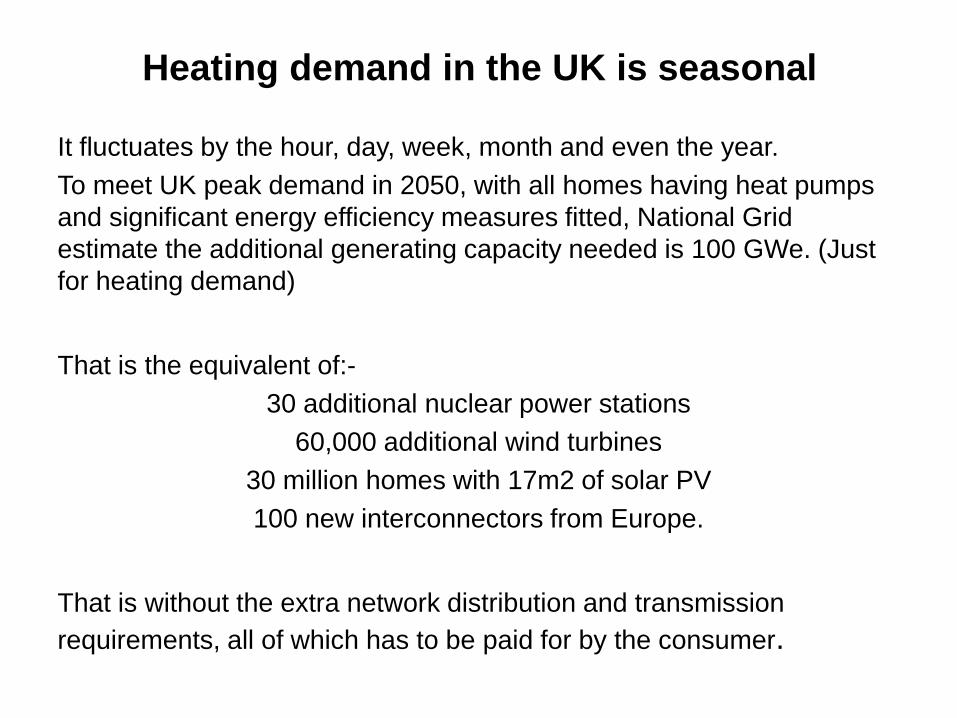
Heating demand in the UK is seasonal
It fluctuates by the hour, day, week, month and even the year.
To meet UK peak demand in 2050, with all homes having heat pumps
and significant energy efficiency measures fitted, National Grid
estimate the additional generating capacity needed is 100 GWe. (Just
for heating demand)
That is the equivalent of:-
30 additional nuclear power stations
60,000 additional wind turbines
30 million homes with 17m2 of solar PV
100 new interconnectors from Europe.
That is without the extra network distribution and transmission
requirements, all of which has to be paid for by the consumer.
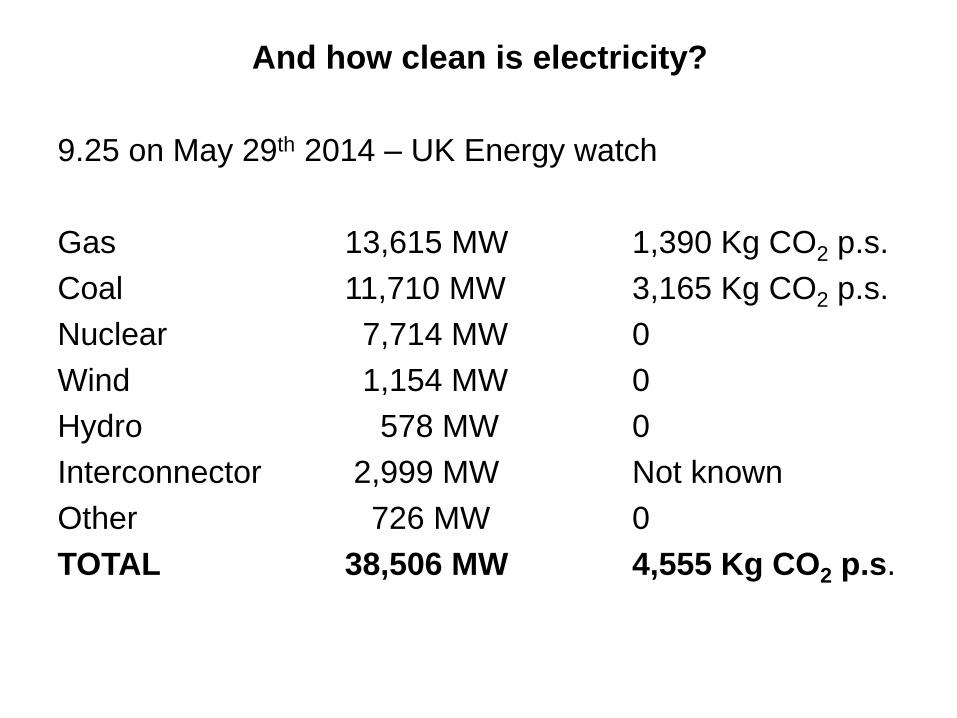
And how clean is electricity?
9.25 on May 29th 2014 – UK Energy watch
Gas 13,615 MW 1,390 Kg CO2 p.s.
Coal 11,710 MW 3,165 Kg CO2 p.s.
Nuclear 7,714 MW 0
Wind 1,154 MW 0
Hydro 578 MW 0
Interconnector 2,999 MW Not known
Other 726 MW 0
TOTAL 38,506 MW 4,555 Kg CO2 p.s.
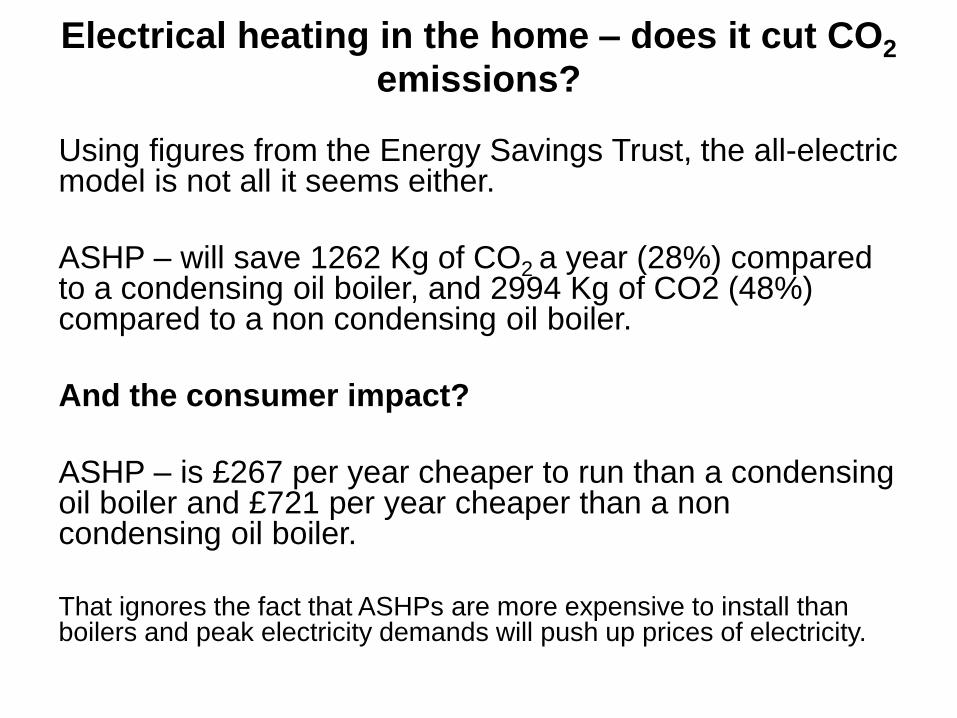
Electrical heating in the home – does it cut CO2
emissions?
Using figures from the Energy Savings Trust, the all-electric model is not all it seems either.
ASHP – will save 1262 Kg of CO2 a year (28%) compared to a condensing oil boiler, and 2994 Kg of CO2 (48%) compared to a non condensing oil boiler.
And the consumer impact?
ASHP – is £267 per year cheaper to run than a condensing oil boiler and £721 per year cheaper than a non condensing oil boiler.
That ignores the fact that ASHPs are more expensive to install than boilers and peak electricity demands will push up prices of electricity.
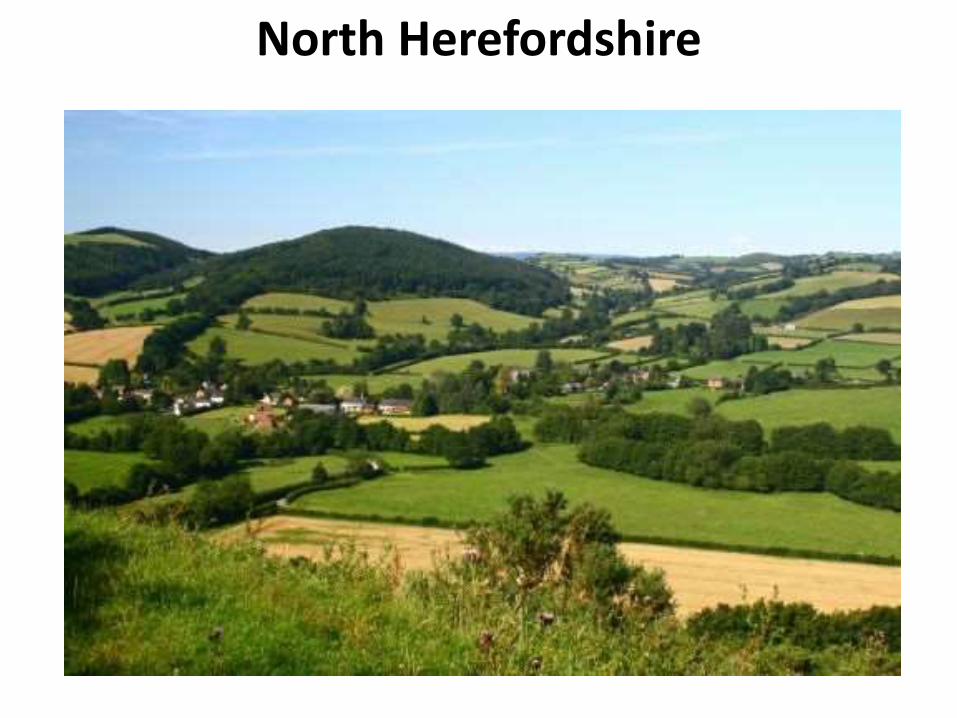
North Herefordshire
Poplar and Limehouse
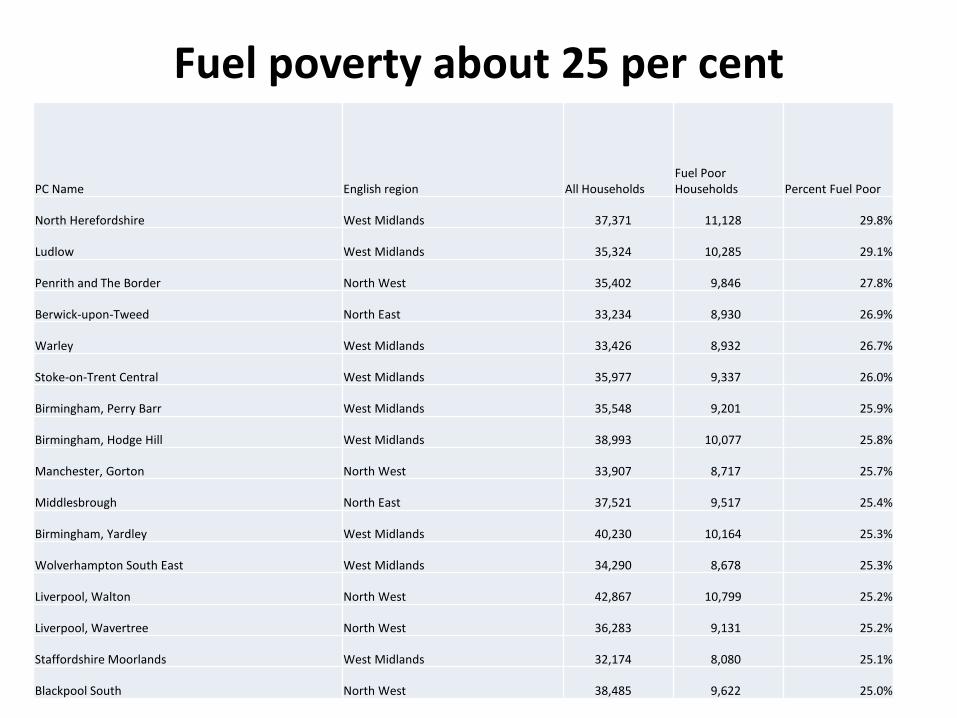
Fuel poverty about 25 per cent
PC Name English region All HouseholdsFuel Poor Households Percent Fuel Poor
North Herefordshire West Midlands 37,371 11,128 29.8%
Ludlow West Midlands 35,324 10,285 29.1%
Penrith and The Border North West 35,402 9,846 27.8%
Berwick-upon-Tweed North East 33,234 8,930 26.9%
Warley West Midlands 33,426 8,932 26.7%
Stoke-on-Trent Central West Midlands 35,977 9,337 26.0%
Birmingham, Perry Barr West Midlands 35,548 9,201 25.9%
Birmingham, Hodge Hill West Midlands 38,993 10,077 25.8%
Manchester, Gorton North West 33,907 8,717 25.7%
Middlesbrough North East 37,521 9,517 25.4%
Birmingham, Yardley West Midlands 40,230 10,164 25.3%
Wolverhampton South East West Midlands 34,290 8,678 25.3%
Liverpool, Walton North West 42,867 10,799 25.2%
Liverpool, Wavertree North West 36,283 9,131 25.2%
Staffordshire Moorlands West Midlands 32,174 8,080 25.1%
Blackpool South North West 38,485 9,622 25.0%
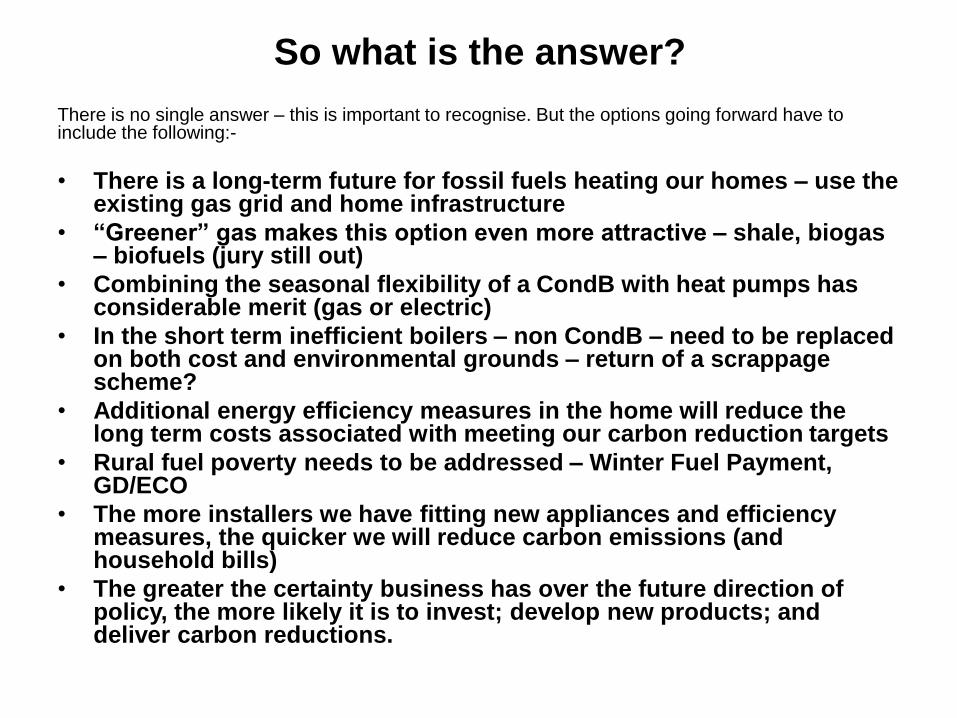
So what is the answer?
There is no single answer – this is important to recognise. But the options going forward have to include the following:-
• There is a long-term future for fossil fuels heating our homes – use the existing gas grid and home infrastructure
• “Greener” gas makes this option even more attractive – shale, biogas – biofuels (jury still out)
• Combining the seasonal flexibility of a CondB with heat pumps has considerable merit (gas or electric)
• In the short term inefficient boilers – non CondB – need to be replaced on both cost and environmental grounds – return of a scrappagescheme?
• Additional energy efficiency measures in the home will reduce the long term costs associated with meeting our carbon reduction targets
• Rural fuel poverty needs to be addressed – Winter Fuel Payment, GD/ECO
• The more installers we have fitting new appliances and efficiency measures, the quicker we will reduce carbon emissions (and household bills)
• The greater the certainty business has over the future direction of policy, the more likely it is to invest; develop new products; and deliver carbon reductions.
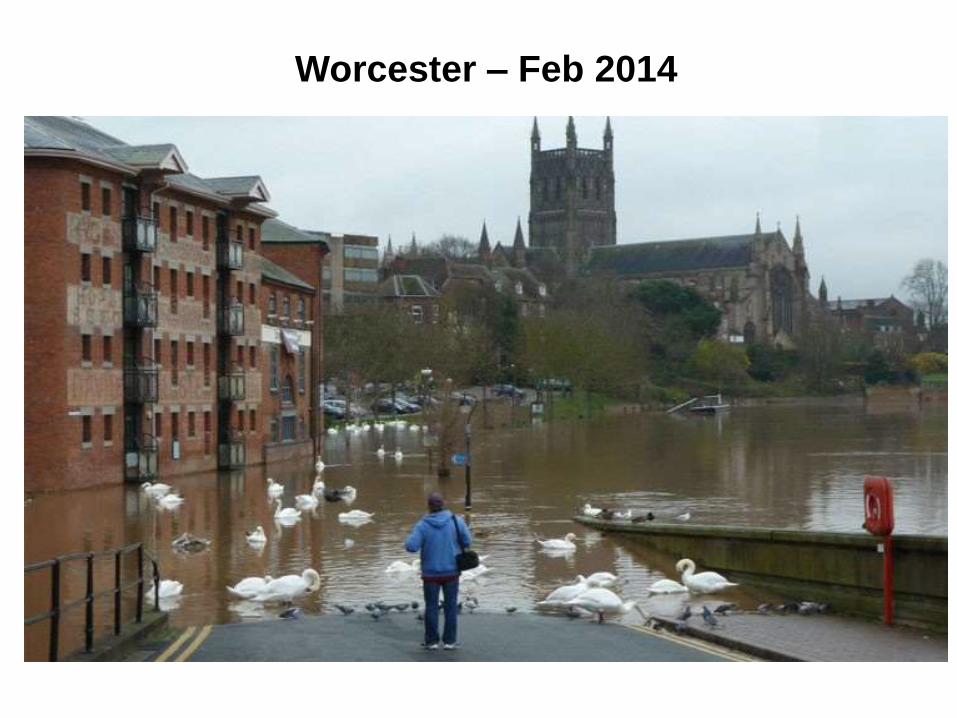
Worcester – Feb 2014
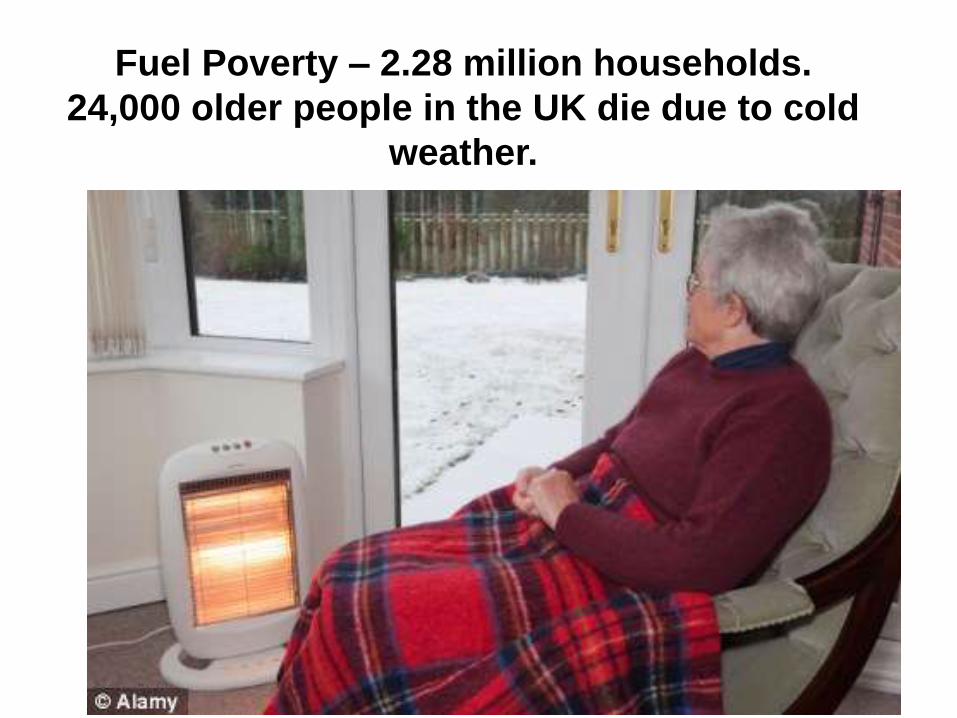
Fuel Poverty – 2.28 million households.
24,000 older people in the UK die due to cold
weather.