Embed Size (px)
Citation preview

An Order-of-Magnitude Estimate of the Relative Sustainability of the Bitcoin
Network
A critical assessment of the Bitcoin mining industry, gold production industry, the legacy banking system, and the
production of physical currency
Hass McCook BE (Hons I) MEngSc (Distinction) MBA (Oxon)
2nd Edition – July 15 2014
@HassMcCook
au.linkedin.com/in/hassmccook/
1GoKNSc3ddhHnYPL4FNbGBG6kdvG5kbm3f
Executive Summary
There has been a lot of uncertainty surrounding the sustainability of the Bitcoin network, with this fascinating nascent technology facing several unsubstantiated claims by uninformed individuals that Bitcoin is highly unsustainable from a social, economic and environmental point of view. This paper aims to disprove or support these claims about the sustainability of the Bitcoin network, and provide an order-of-magnitude comparison of the relative sustainability of Bitcoin when compared with the incumbent banking industry, the gold production industry, and the process of printing and minting of physical currency.
Widely available public information strongly refutes claims that Bitcoin is unsustainable, and shows that the social, environmental and economic impacts are a minuscule fraction of the impacts that the legacy wealth and monetary systems have on our society and environment.
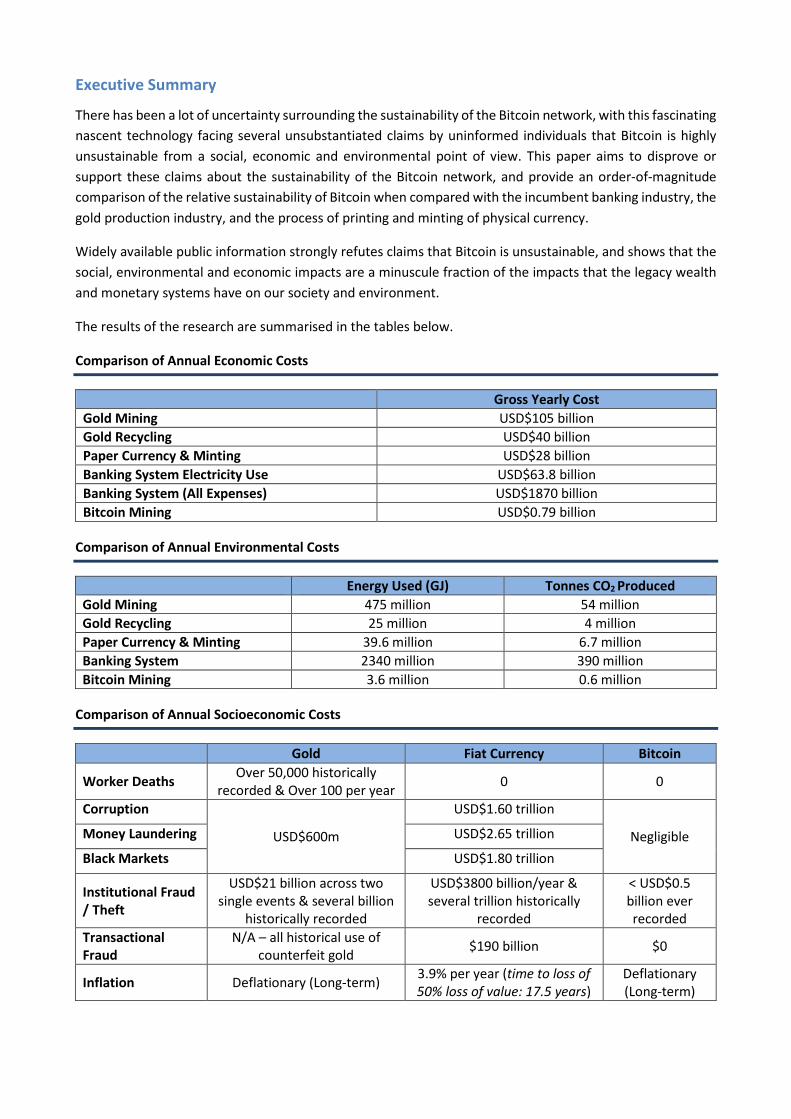
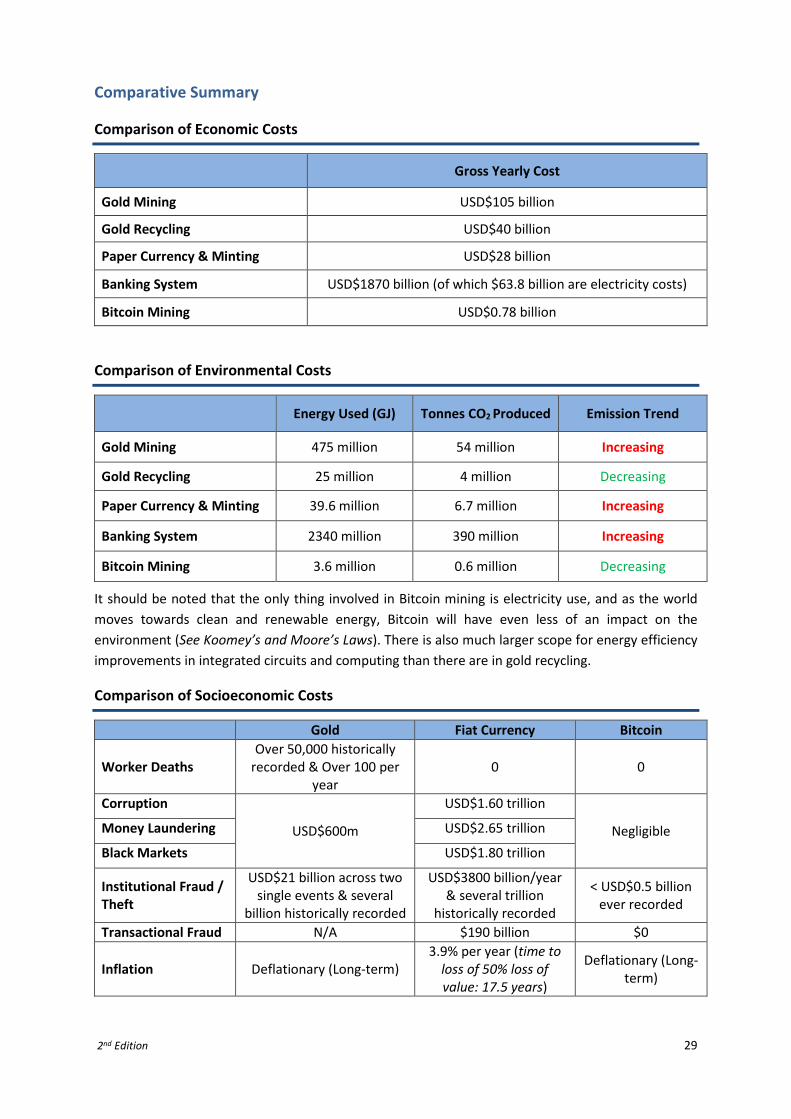
The results of the research are summarised in the tables below.
Comparison of Annual Economic Costs
Gross Yearly Cost Gold Mining USD$105 billion Gold Recycling USD$40 billion Paper Currency & Minting USD$28 billion Banking System Electricity Use USD$63.8 billion Banking System (All Expenses) USD$1870 billion Bitcoin Mining USD$0.79 billion
Comparison of Annual Environmental Costs
Energy Used (GJ) Tonnes CO2 Produced Gold Mining 475 million 54 million Gold Recycling 25 million 4 million Paper Currency & Minting 39.6 million 6.7 million Banking System 2340 million 390 million Bitcoin Mining 3.6 million 0.6 million
Comparison of Annual Socioeconomic Costs
Gold Fiat Currency Bitcoin
Worker Deaths Over 50,000 historically recorded & Over 100 per year 0 0
Corruption
USD$600m
USD$1.60 trillion
Negligible Money Laundering USD$2.65 trillion
Black Markets USD$1.80 trillion
Institutional Fraud / Theft
USD$21 billion across two single events & several billion
historically recorded
USD$3800 billion/year & several trillion historically
recorded
< USD$0.5 billion ever recorded
Transactional Fraud
N/A – all historical use of counterfeit gold $190 billion $0
Inflation Deflationary (Long-term) 3.9% per year (time to loss of 50% loss of value: 17.5 years)
Deflationary (Long-term)
Preface to the Second Edition
The first edition of this research paper received valuable constructive feedback, and prompted several legitimate questions from the Bitcoin community through comments on Coindesk.com, Reddit’s r/Bitcoin community and Bitcointalk.org’s forums. The purpose of this 2nd edition is to address these questions and requests for clarification, and incorporate them into this paper.
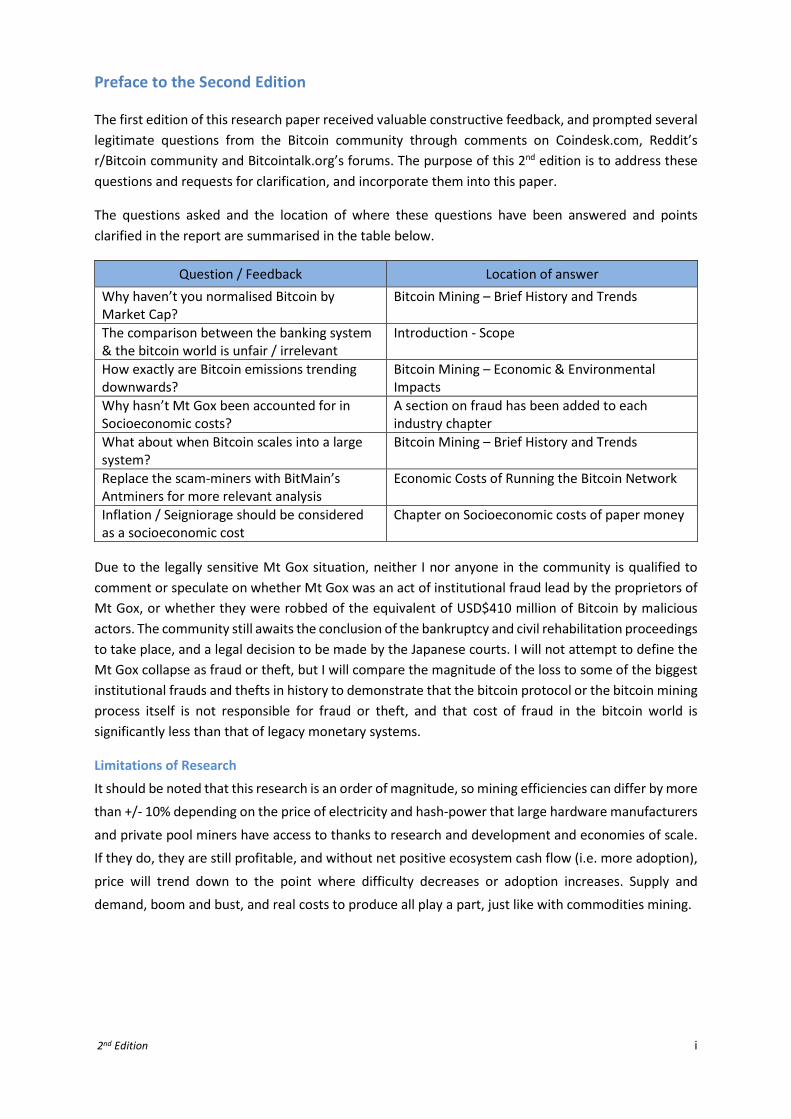
The questions asked and the location of where these questions have been answered and points clarified in the report are summarised in the table below.
Question / Feedback Location of answer Why haven’t you normalised Bitcoin by Market Cap?
Bitcoin Mining – Brief History and Trends
The comparison between the banking system & the bitcoin world is unfair / irrelevant
Introduction - Scope
How exactly are Bitcoin emissions trending downwards?
Bitcoin Mining – Economic & Environmental Impacts
Why hasn’t Mt Gox been accounted for in Socioeconomic costs?
A section on fraud has been added to each industry chapter
What about when Bitcoin scales into a large system?
Bitcoin Mining – Brief History and Trends
Replace the scam-miners with BitMain’s Antminers for more relevant analysis
Economic Costs of Running the Bitcoin Network
Inflation / Seigniorage should be considered as a socioeconomic cost
Chapter on Socioeconomic costs of paper money
Due to the legally sensitive Mt Gox situation, neither I nor anyone in the community is qualified to comment or speculate on whether Mt Gox was an act of institutional fraud lead by the proprietors of Mt Gox, or whether they were robbed of the equivalent of USD$410 million of Bitcoin by malicious actors. The community still awaits the conclusion of the bankruptcy and civil rehabilitation proceedings to take place, and a legal decision to be made by the Japanese courts. I will not attempt to define the Mt Gox collapse as fraud or theft, but I will compare the magnitude of the loss to some of the biggest institutional frauds and thefts in history to demonstrate that the bitcoin protocol or the bitcoin mining process itself is not responsible for fraud or theft, and that cost of fraud in the bitcoin world is significantly less than that of legacy monetary systems.
Limitations of Research It should be noted that this research is an order of magnitude, so mining efficiencies can differ by more than +/- 10% depending on the price of electricity and hash-power that large hardware manufacturers
and private pool miners have access to thanks to research and development and economies of scale. If they do, they are still profitable, and without net positive ecosystem cash flow (i.e. more adoption),
price will trend down to the point where difficulty decreases or adoption increases. Supply and demand, boom and bust, and real costs to produce all play a part, just like with commodities mining.
2nd Edition i
Table of Contents
Introduction ............................................................................................................................................. 1 Scope ................................................................................................................................................... 1
Methodology ....................................................................................................................................... 1
Exclusions ............................................................................................................................................ 1
About the Author ................................................................................................................................ 1
Gold – Mining & Recycling ...................................................................................................................... 2 Introduction ......................................................................................................................................... 2
Future Trends ...................................................................................................................................... 3
Mining Lifecycle ................................................................................................................................... 3
Economic Costs of Mining ................................................................................................................... 5
Environmental Costs of Mining ........................................................................................................... 6
Recycling .............................................................................................................................................. 7
Social Costs of Gold Mining ................................................................................................................. 8
Cash Printing & Coin Minting (Physical Currency)................................................................................... 9 Introduction ......................................................................................................................................... 9
Future Trends ...................................................................................................................................... 9
Physical Currency Lifecycle ................................................................................................................10
Currency in Circulation ......................................................................................................................11
Economic Costs of Physical Currency ................................................................................................14
Environmental Costs of Physical Currency ........................................................................................15
Socioeconomic Costs of Physical Currency .......................................................................................17
Environmental Impact of the Banking System ......................................................................................20 Bank Branches ...................................................................................................................................20
ATMs ..................................................................................................................................................22
Summary ...........................................................................................................................................22
The Bitcoin Network & Bitcoin Mining ..................................................................................................23 Introduction .......................................................................................................................................23
Brief History & Trends .......................................................................................................................23
Economic & Environmental Impact Assumptions .............................................................................25
Environmental Costs of Running the Bitcoin Network ......................................................................26
Economic Costs of Running the Bitcoin Network ..............................................................................26
Social Costs of Bitcoin ........................................................................................................................28
Comparative Summary ..........................................................................................................................29 Comparison of Economic Costs .........................................................................................................29
Comparison of Environmental Costs .................................................................................................29
Comparison of Socioeconomic Costs ................................................................................................29
Conclusion .............................................................................................................................................30 Bibliography ...........................................................................................................................................31 2nd Edition ii

Table of Figures
Figure 1 - Gold - Key Statistics (Sources: World Gold Council (2012), GFMS (2011), Hewitt (2008)) ..... 2 Figure 2 - World Gold Production & Reserves (U.S. Geological Survey, 2014) ....................................... 3 Figure 3 - The Gold Mining Lifecycle (Minerals Council of Australia, 2014)............................................ 4 Figure 4 - Mining Production Process (Minerals Council of Australia, 2014) .......................................... 5 Figure 5 - World M0 Money Supply - 2008 (Hewitt, 2008) ................................................................... 11 Figure 6 - Volume of USD currency in circulation (U.S. Federal Reserve, 2014) ................................... 13 Figure 7 - World Security Printing Market (Smithers Pira, 2013) .......................................................... 14
Table of Tables
Table 1 - Environmental Costs of Gold Mining ........................................................................................ 6 Table 2 - Gold Mining Environmental Impacts - Summary ..................................................................... 6 Table 3 - Economic & Environmental Cost of Electricity Generation - By Source ................................... 7 Table 4 - Select International Gold Mining Fatality Data ........................................................................ 8 Table 5 - Estimated Lifespans of U.S. paper money (U.S. Federal Reserve, 2014) ............................... 10 Table 6 - USD Coins in Circulation (produced 1999 – 2014) (U.S. Mint, 2014) (CoinNews, 2012) ........ 12 Table 7 - Euro Coins in Circulation as at February 2014 (European Central Bank, 2014) ..................... 12 Table 8 - Summary Table - Financial Costs of Physical Currency .......................................................... 15 Table 9 - Summary Table – Environmental Costs of Paper Currency in Circulation ............................. 16 Table 10 - Carbon emissions from select base metal mine sites (Farrell, 2009) ................................... 16 Table 11 - Summary Table – Environmental Costs of Cash (Notes + Coins) ......................................... 17 Table 12 - World's Biggest Corporate Frauds and Ponzi Schemes ........................................................ 18 Table 13 - World's Biggest Theft Events ................................................................................................ 18 Table 14 - World Black Market Value - Top 50 Activities ...................................................................... 19 Table 15 - World Bank Financial Access Data - 2014 (World Bank, 2014) ............................................ 20 Table 16 - Number of People Employed by the World's 30 Largest Banks ........................................... 21 Table 17 - Model Outputs & Sensitivity Analysis - Global Banking Carbon Footprint ........................... 22 Table 18 - Summary of Impact of World's Banking and Finance Access Points .................................... 22 Table 19 - Bitcoin Hashrate vs. Difficulty – Sept 2013 – June 2014 (BitcoinWisdom, 2014) ................ 23 Table 20 - Bitcoin Mining Hardware Comparison (Bitcoin Wiki, 2014) (Bitfury, 2014)......................... 25 Table 21 - Sensitivity Analysis - Less efficient mining equipment ......................................................... 26 Table 22 - Summary of Economic Costs of Bitcoin Mining .................................................................... 27 Table 23 - List of all Bitcoin theft/fraud events larger than USD$50,000 ............................................. 28
2nd Edition iii
Introduction
Scope
The scope of this research is to undertake a critical assessment of the social, environmental and economic impacts of the way we currently transact and transfer wealth, be it through legacy systems like gold and fiat currencies, or through newer digital cryptographic ones.
This research also aims to give readers a much clearer idea of the human and environmental impacts associated with both current and future monetary systems, and allow them to draw their own conclusions on the relative sustainability of the old and new systems when viewed from a holistic “triple-bottom-line” approach. Although it is not necessarily fair to compare Bitcoin to the entire legacy banking system, there was doubt in the community about the impact of the legacy banking system, and thus, it has been quantified for completeness.
Methodology
This research involved a broad and deep literature review of publicly available information, and various extrapolative calculations based on this data. All references have been cited, and calculation steps demonstrated throughout this paper. All extrapolative calculations have been undertaken using two different methods so as to sense-check all results, and sensitivity analyses undertaken where there are data shortfalls.
Exclusions
• Impact assessment of producing gold mining machinery • Impact assessment of storing and transporting gold • Impact assessment of constructing the world’s 600,000 bank branches, but not their ongoing
annual emissions
About the Author
Prior to receiving his MBA from The University of Oxford, Hass was a Chartered Professional Engineer involved in the delivery of over $20 billion of Australian economic civil infrastructure through planning, design, construction, consulting, financing and operations roles – gaining key expertise in project and business administration and risk management. During his time at Oxford, he studied global macroeconomic and demographic trends, as well as the key social, environmental and economic risks that humanity will face over the next hundred years. This research led to a strong understanding and passion for Bitcoin - the economic infrastructure of the digital age - and a key risk-mitigant for several of the threats that humanity will face in the 21st century and beyond.
Academic Qualifications • Master of Business Administration, with Dean’s Commendation – University of Oxford • Master of Engineering Science, with Distinction – University of New South Wales • Bachelor of Civil Engineering, with First Class Honours – University of Technology, Sydney
Professional Qualifications & Licences • Chartered Professional Engineer (CPEng) (2011) • RABQSA-AU/QM/TL Management & Quality Systems Auditing Certifications
2nd Edition 1

Gold – Mining & Recycling
Introduction
Gold has been used for millennia as a means to project and protect wealth. In terms of projection of wealth, as can be seen from the data below, 52% of all gold ever mined is used for jewellery and palatial adornments. In terms of protection of wealth, central banks hold 18% of the world’s gold supply and other investors hold 16% (Hewitt, 2008). It also has practical applications, with 10% of yearly demand coming from industry (World Gold Council, 2012), with almost 12% of the world’s supply of gold held inside technological products, and is lost forever unless recycled – which has its own costs attached to it. For completeness, according to the World Gold Council (2012), over 2700 tonnes of gold were produced and over 1600 tonnes of gold were recycled in 2011.
Figure 1 - Gold - Key Statistics (Sources: World Gold Council (2012), GFMS (2011), Hewitt (2008))
The reason gold is valuable is due to its inherent properties. It is highly durable, malleable and never loses its lustre. Most importantly, it is scarce, and becomes increasingly more difficult and expensive to mine – so it is safe from inflation. It is for these reasons, as well as its applications for industry, that make gold demanded, and hence, valuable. But because of its weight, and the need to rely on special instruments to detect counterfeit gold, it became useless as a prolific day-to-day currency. The following sections discuss the lifecycle of mining, as well as the triple-bottom-line; the economic, environmental and social costs of gold mining.
2nd Edition 2
Future Trends
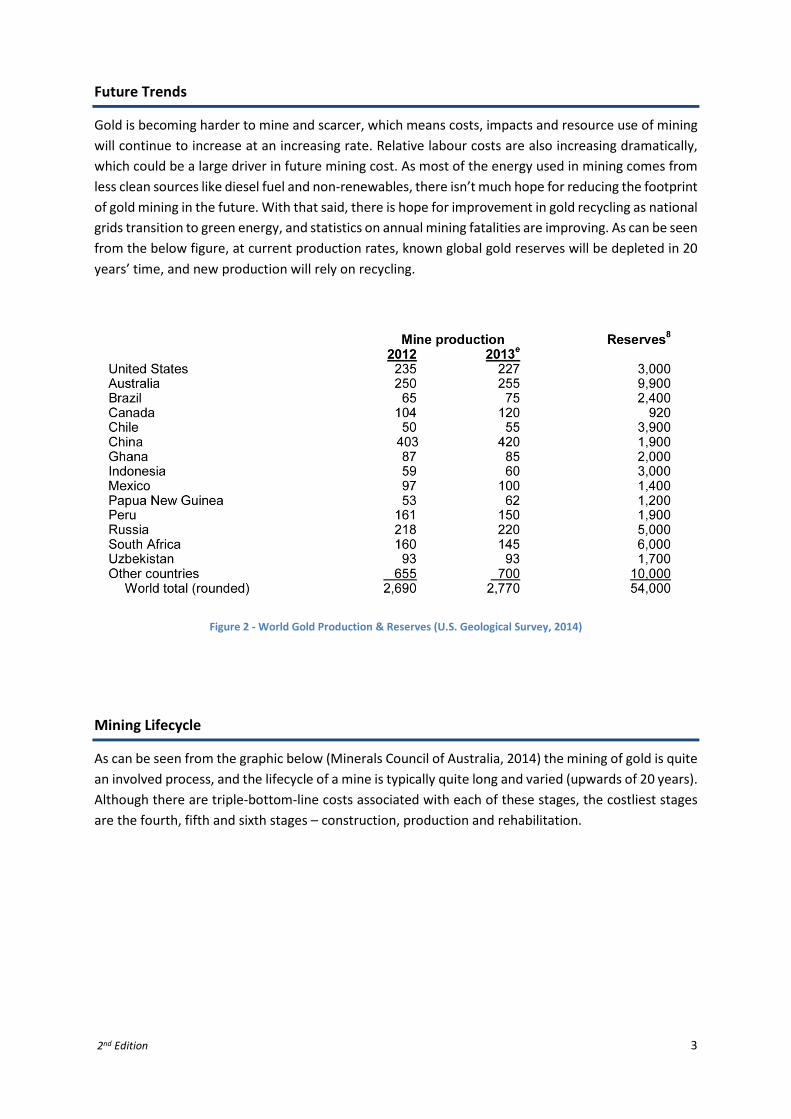
Gold is becoming harder to mine and scarcer, which means costs, impacts and resource use of mining will continue to increase at an increasing rate. Relative labour costs are also increasing dramatically, which could be a large driver in future mining cost. As most of the energy used in mining comes from less clean sources like diesel fuel and non-renewables, there isn’t much hope for reducing the footprint of gold mining in the future. With that said, there is hope for improvement in gold recycling as national grids transition to green energy, and statistics on annual mining fatalities are improving. As can be seen from the below figure, at current production rates, known global gold reserves will be depleted in 20 years’ time, and new production will rely on recycling.
Figure 2 - World Gold Production & Reserves (U.S. Geological Survey, 2014)
Mining Lifecycle
As can be seen from the graphic below (Minerals Council of Australia, 2014) the mining of gold is quite an involved process, and the lifecycle of a mine is typically quite long and varied (upwards of 20 years). Although there are triple-bottom-line costs associated with each of these stages, the costliest stages are the fourth, fifth and sixth stages – construction, production and rehabilitation.
2nd Edition 3
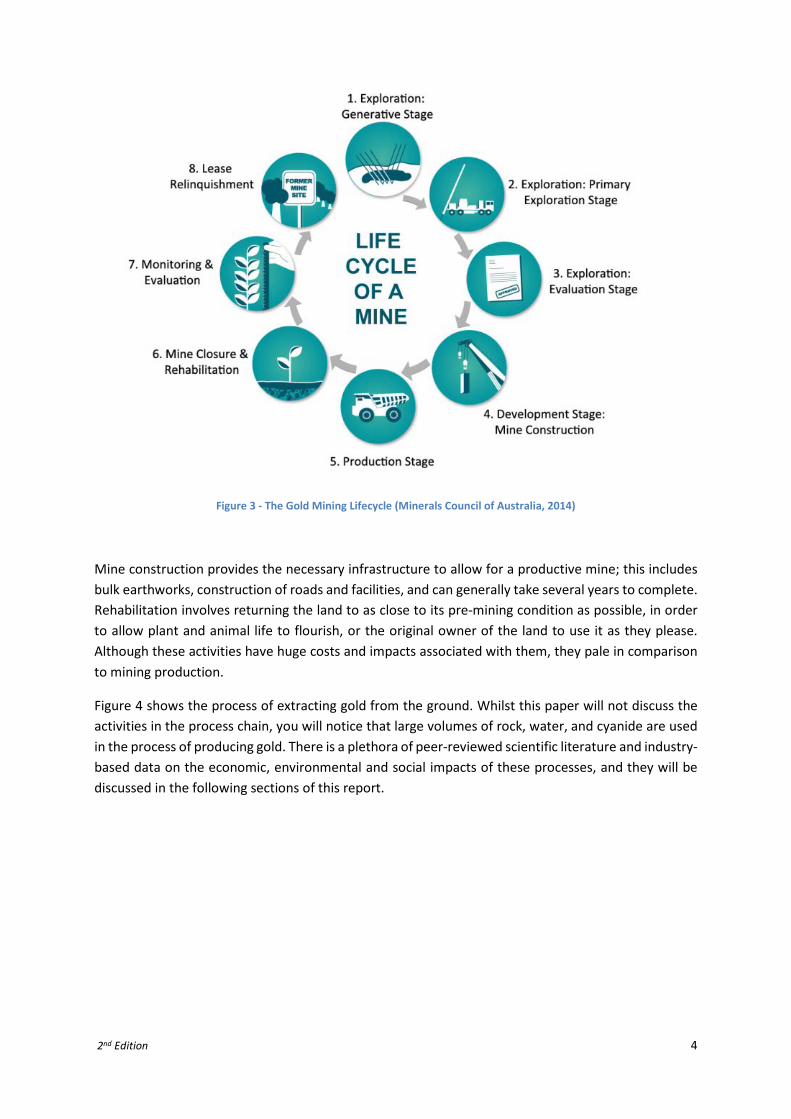
Figure 3 - The Gold Mining Lifecycle (Minerals Council of Australia, 2014)
Mine construction provides the necessary infrastructure to allow for a productive mine; this includes bulk earthworks, construction of roads and facilities, and can generally take several years to complete. Rehabilitation involves returning the land to as close to its pre-mining condition as possible, in order to allow plant and animal life to flourish, or the original owner of the land to use it as they please. Although these activities have huge costs and impacts associated with them, they pale in comparison to mining production.
Figure 4 shows the process of extracting gold from the ground. Whilst this paper will not discuss the activities in the process chain, you will notice that large volumes of rock, water, and cyanide are used in the process of producing gold. There is a plethora of peer-reviewed scientific literature and industry-based data on the economic, environmental and social impacts of these processes, and they will be discussed in the following sections of this report.
2nd Edition 4

Figure 4 - Mining Production Process (Minerals Council of Australia, 2014)
Economic Costs of Mining
At the time of writing, price of gold was approximately USD$1250/ounce. This section of the report will provide industry data on the economic cost to miners to produce an ounce of gold.
In early February 2014, the World Gold Council noted that the average industry cost of production is USD$1200/ounce, with 30% of the industry becoming unprofitable if the gold price drops below that level (Rudarakanchana, 2014).
Barclay’s commodities research provides similar figures, their report from April 2013 shows that the marginal cost of production was USD$1104/ounce (Barclays Commodities Research, 2013).
2nd Edition 5
Andrew Su, CEO at brokerage firm Compass Global Markets concurred, stating that cost of producing gold in Australia had jumped to over USD$1000/ounce in 2013 (Naidu-Ghelani, 2013).
2,700 tonnes, or just over 96 million ounces, of gold were mined in 2012. At an average of $1100/ounce, this puts the economic cost of mining gold at USD$105.6 billion.
Environmental Costs of Mining
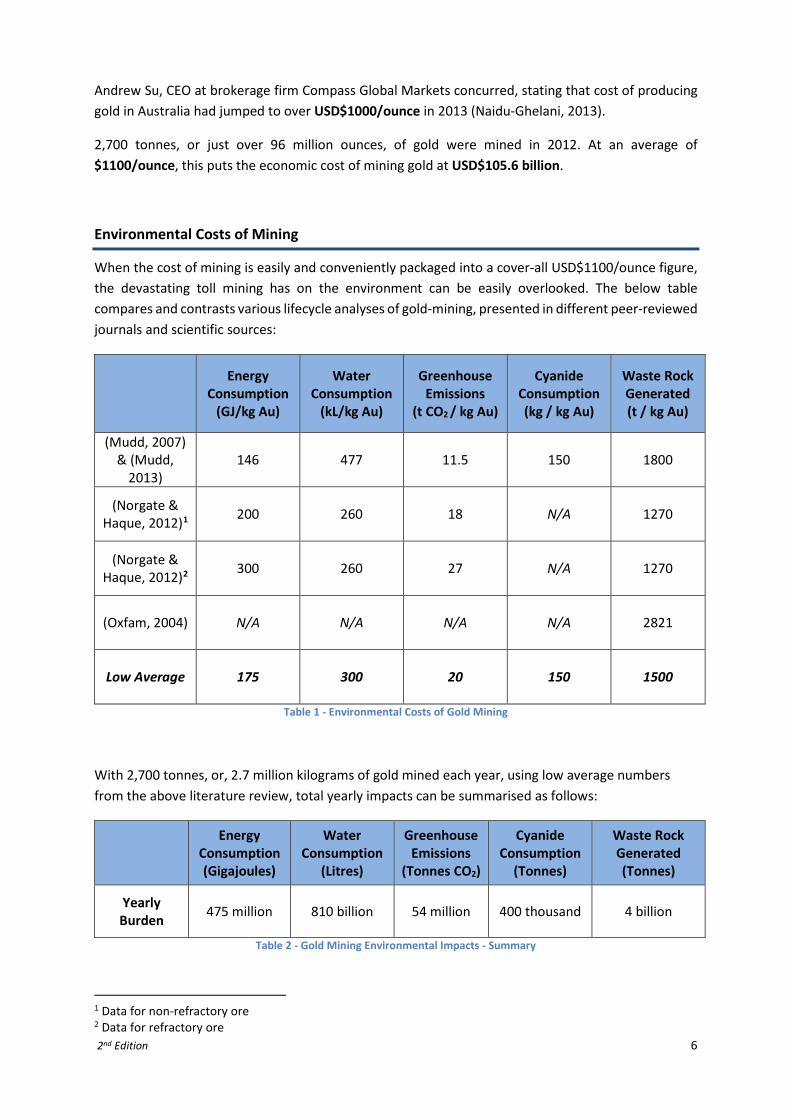
When the cost of mining is easily and conveniently packaged into a cover-all USD$1100/ounce figure, the devastating toll mining has on the environment can be easily overlooked. The below table compares and contrasts various lifecycle analyses of gold-mining, presented in different peer-reviewed journals and scientific sources:
Energy
Consumption (GJ/kg Au)
Water Consumption
(kL/kg Au)
Greenhouse Emissions
(t CO2 / kg Au)
Cyanide Consumption (kg / kg Au)
Waste Rock Generated (t / kg Au)
(Mudd, 2007) & (Mudd,
2013) 146 477 11.5 150 1800
(Norgate & Haque, 2012)1 200 260 18 N/A 1270
(Norgate & Haque, 2012)2 300 260 27 N/A 1270
(Oxfam, 2004) N/A N/A N/A N/A 2821
Low Average 175 300 20 150 1500
Table 1 - Environmental Costs of Gold Mining
With 2,700 tonnes, or, 2.7 million kilograms of gold mined each year, using low average numbers from the above literature review, total yearly impacts can be summarised as follows:
Energy
Consumption (Gigajoules)
Water Consumption
(Litres)
Greenhouse Emissions
(Tonnes CO2)
Cyanide Consumption
(Tonnes)
Waste Rock Generated (Tonnes)
Yearly Burden 475 million 810 billion 54 million 400 thousand 4 billion
Table 2 - Gold Mining Environmental Impacts - Summary
1 Data for non-refractory ore 2 Data for refractory ore 2nd Edition 6
Recycling
Gold can be recycled, and frequently is - Figure 1 showing that just over a third of all gold produced each year is recycled. Recycling is significantly less energy intensive than mining gold, however, definitive data does not exist as to the exact energy savings (US EPA, 2012). As an indication of how much energy is saved recycling, here are statistics for other metals and products (The Economist, 2007):
• Aluminium – 95% saved • Glass – 5-30% • Steel – 60% • Paper – 40% • Plastics – 70%
Assuming optimistic energy savings of 90%, energy used to recycle gold would be 475 million GJ x 0.5 (ratio of recycled to mined gold) x (1 – 90%) (energy saving) = approx. 25 million GJ.
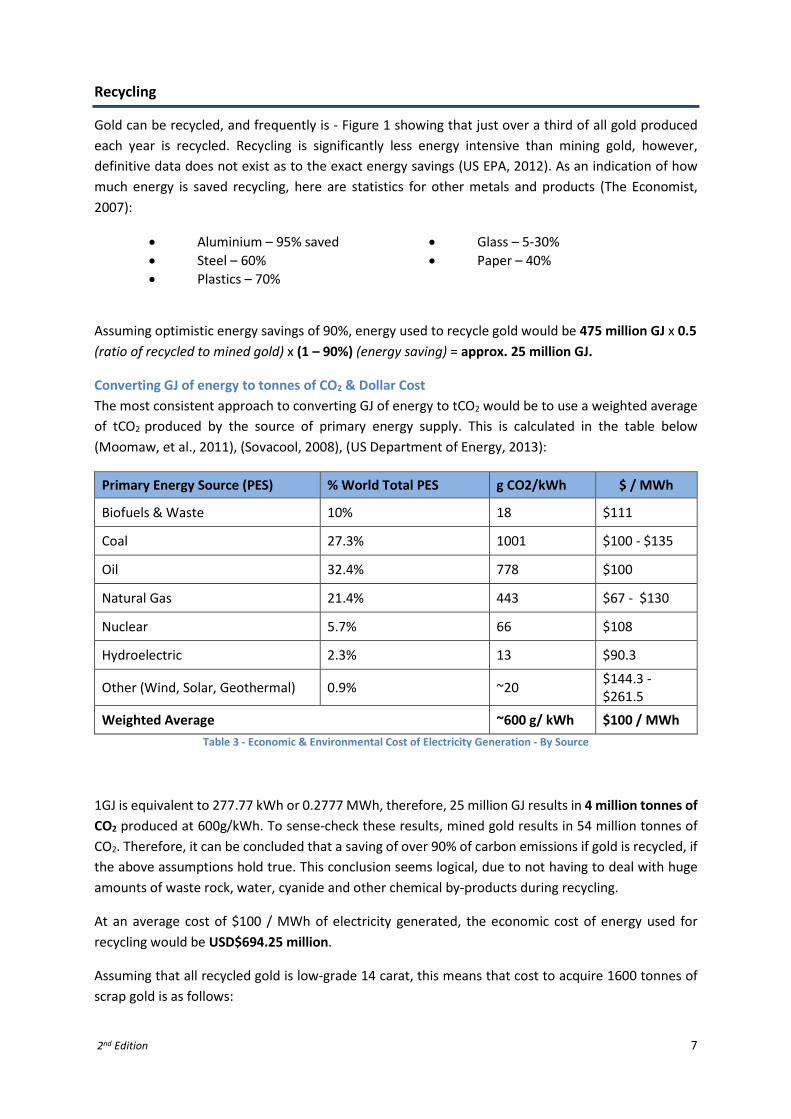
Converting GJ of energy to tonnes of CO2 & Dollar Cost The most consistent approach to converting GJ of energy to tCO2 would be to use a weighted average of tCO2 produced by the source of primary energy supply. This is calculated in the table below (Moomaw, et al., 2011), (Sovacool, 2008), (US Department of Energy, 2013):
Primary Energy Source (PES) % World Total PES g CO2/kWh $ / MWh
Biofuels & Waste 10% 18 $111
Coal 27.3% 1001 $100 - $135
Oil 32.4% 778 $100
Natural Gas 21.4% 443 $67 - $130
Nuclear 5.7% 66 $108
Hydroelectric 2.3% 13 $90.3
Other (Wind, Solar, Geothermal) 0.9% ~20 $144.3 - $261.5
Weighted Average ~600 g/ kWh $100 / MWh Table 3 - Economic & Environmental Cost of Electricity Generation - By Source
1GJ is equivalent to 277.77 kWh or 0.2777 MWh, therefore, 25 million GJ results in 4 million tonnes of CO2 produced at 600g/kWh. To sense-check these results, mined gold results in 54 million tonnes of CO2. Therefore, it can be concluded that a saving of over 90% of carbon emissions if gold is recycled, if the above assumptions hold true. This conclusion seems logical, due to not having to deal with huge amounts of waste rock, water, cyanide and other chemical by-products during recycling.
At an average cost of $100 / MWh of electricity generated, the economic cost of energy used for recycling would be USD$694.25 million.
Assuming that all recycled gold is low-grade 14 carat, this means that cost to acquire 1600 tonnes of scrap gold is as follows:
2nd Edition 7
14 𝑐𝑐𝑐𝑐𝑐𝑐𝑐𝑐𝑐𝑐24 𝑐𝑐𝑐𝑐𝑐𝑐𝑐𝑐𝑐𝑐
×32150 𝑐𝑐𝑐𝑐𝑡𝑡𝑡𝑡 𝑡𝑡𝑜𝑜
1 𝑐𝑐𝑡𝑡𝑡𝑡𝑡𝑡𝑡𝑡×𝑈𝑈𝑈𝑈𝑈𝑈$1300𝑐𝑐𝑐𝑐𝑡𝑡𝑡𝑡 𝑡𝑡𝑜𝑜
× 1600𝑐𝑐𝑡𝑡𝑡𝑡𝑡𝑡𝑡𝑡𝑠𝑠𝑡𝑡𝑡𝑡𝑐𝑐𝑐𝑐
= 𝑼𝑼𝑼𝑼𝑼𝑼$𝟑𝟑𝟑𝟑 𝑩𝑩𝑩𝑩𝑩𝑩𝑩𝑩𝑩𝑩𝑩𝑩𝑩𝑩
The cost to acquire recycling facilities has not been considered, as this is expected to be marginal. After rounding, we can conclude that the recycling of gold costs about USD$40 Billion per year (and rising), or about $780/ounce.
Social Costs of Gold Mining
The obvious major social costs of gold mining are native land-owner rights, human rights abuses to obtain “conflict gold”, and unacceptably high worker fatality rates. According to research by Oxfam (2004), 50% of all newly mined gold is taken from native lands.
Gold is a renowned conflict mineral, with more than USD$600m of gold estimated to leave Congo every year alone – this gold is tainted with physical and sexual violence, and human enslavement. The mining of gold allows local warlords to continue to finance their armies, causing suffering to millions of Africans (Raise Hope for Congo, 2014).
Most striking are the statistics on worker fatalities, which whilst incomplete and incomprehensive due to difficulty in obtaining reliable international data, still paint an ominous picture.
Country Data Period Fatalities Source
USA 1869 - 2010 272 (United States Mine Rescue Association, 2010)
South Africa 1911 - 1984 44214 (Wagner, 1988)
South Africa 2001 - 2011 1277 (Chamber of Mines of South Africa, 2012)
Australia 1970 – 2006 105 (Kahler, 2006)
Table 4 - Select International Gold Mining Fatality Data
As can be seen, statistics from a very small sample of gold producing countries show almost 50,000 fatalities in the last century alone. In addition to this, gold has been mined for centuries, surely causing tens of thousands of more deaths prior to statistics being recorded. Also to be noted, the above data only cover fatality statistics, and overlook injuries and long-term effects on health such as tuberculosis, silicosis and other occupational health diseases.
Gold Investment Fraud In June 2014, China’s chief auditor discovered USD$15 billion worth of loans backed by falsified gold transactions (News, 2014). In another single event, BRE-X, a Canadian gold mining scam, cost investors USD$6.5 billion in the biggest mining scandal of all time (Ro, 2012). Precious metal fraud has cost Americans USD$300 million since 2001 alone (Miedema & Bartz, 2014)), but on a global and historical scale, the damage has been significantly worse. There are several other documented and undocumented large-scale precious metal frauds that have occurred throughout history, which would be impossible to completely quantify.
2nd Edition 8

Cash Printing & Coin Minting (Physical Currency)
Introduction
Money makes the world go round, and for the past several hundred years, paper currency and coins were the physical manifestation of money. Once upon a time, most paper currency in the world was backed by gold and directly exchangeable for it. This system of backing currency with tangible, universally exchangeable reserves was known as The Bretton Woods system, and was used to help the world rebuild economically after World War II (United Nations, 1948). On August 15, 1971, US President Richard Nixon ended the Bretton Woods System (Ghizoni, 1971), in what is now known as “The Nixon Shock”, allowing all currencies to float freely, with only the backing of the faith and credit of their issuing sovereign state. This type of currency is known as “fiat currency”, i.e., currency that is given value by government decree (Keynes, et al., 1978). This report will not discuss the relative merits and drawbacks of gold-backed currency and fiat-money, only the triple-bottom-line impacts of each.
Future Trends
With the built-in “infinite” inflation of fiat money, more and more physical currency will need to be printed and minted every year, unless we move to a completely digital system of transaction.
According to a research report issued by Smithers-Pira (2014) on the world security printing market, “digitisation and convergence are two megatrends that the security printing industry needs to come to terms with. They can be seen as a threat jeopardising the very existence of the industry, or as an opportunity to innovate and evolve in order to address risk in a broader context. In the near foreseeable future, however, security printing will continue to fulfil its critical role of preventing and detecting alterations, forgeries and copies, and support product authenticity”.
In terms of printing trends, countries like Australia and Canada use polymer-based notes which reduces both economic and environmental costs of physical currency significantly, with the United Kingdom poised to go polymer in 2016 (Allen, 2013).
Coins, which have a high environmental impact due to the metal required to produce them, will most likely be phased out over the next 40 years. The reason for this is it currently costs the United States Government 1.83 cents to make a 1 cent coin, and 9.41 cents to make a 10 cent coin (Zielinski, 2014). Ireland has spent €11.8m to produce €7.1m worth of 1 Euro cent coins (Reilly, 2013). Over time, due to increasing metal costs, it will become untenable for governments to make real losses on production of currency. Some jurisdictions, like Australia, discontinued their 1 cent and 2 cent coins in 1990 (Royal Australian Mint, 2014), and as inflation continues on towards infinity, it will be less and less economically viable to produce such low denominations of currency, and therefore we might expect impacts due to minted coins to reduce over time.
2nd Edition 9

Physical Currency Lifecycle
Banknotes According to the US Federal Reserve, the life-span of non-polymer paper money varies based on denomination, as shown below.
Denomination Estimated Life Span
$1 5.9 years
$5 4.9 years
$10 4.2 years
$20 7.7 years
$50 3.7 years
$100 15.0 years Table 5 - Estimated Lifespans of U.S. paper money (U.S. Federal Reserve, 2014)
A report prepared for The Bank of Canada ahead of the implementation of Polymer notes found that they will typically last at least 2.5 to 4 times as long as paper notes (PE Americas; Tryskele, 2011), (Ahlers, et al., 2010).
Once notes have reached the end of their useful life, they are typically pulped, compressed into bricks, and sent to an official government incinerator where they are burned, leading to environmental impact during both creation of new notes and destruction of old ones (Jackson, 2010).
Coins After coins are minted from a typical mix of copper and steel with nickel plating, they are put into circulation where their average life is roughly 25 years (U.S. Mint, 2014).
Once coins have reached their useful life, or are too worn and mutilated for circulation, they are returned to the mint for recycling (U.S. Mint, 2014).
2nd Edition 10
Currency in Circulation
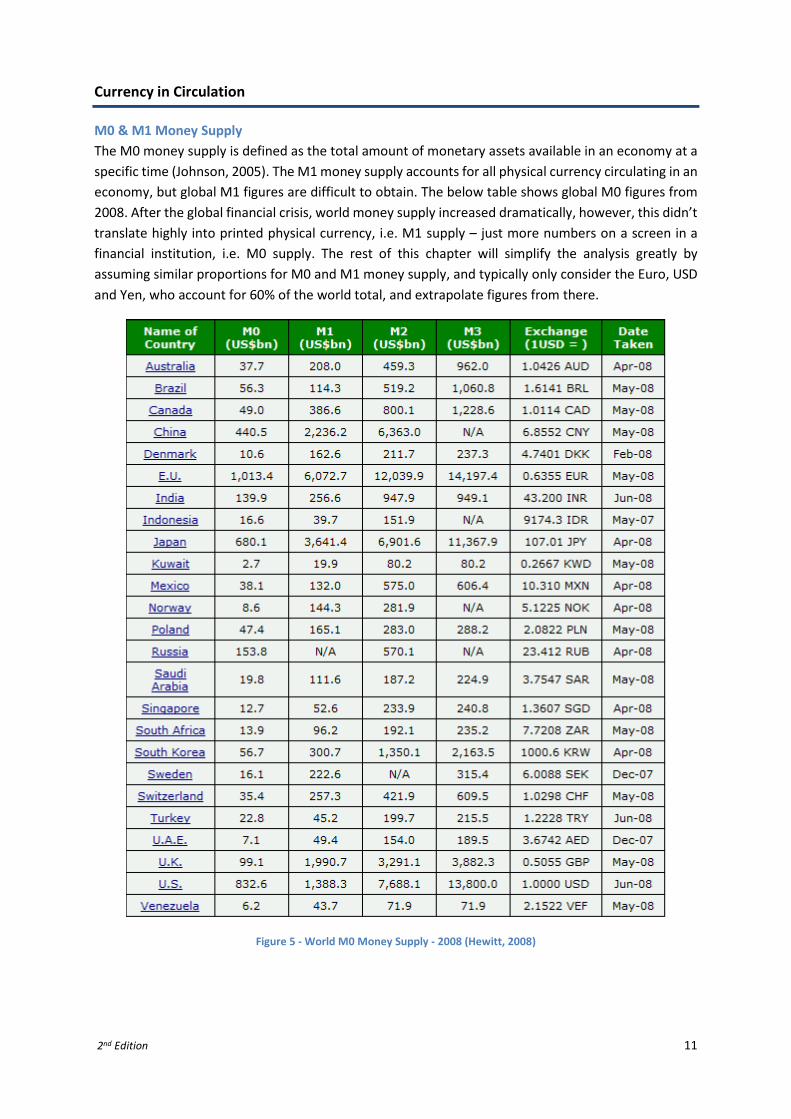
M0 & M1 Money Supply The M0 money supply is defined as the total amount of monetary assets available in an economy at a specific time (Johnson, 2005). The M1 money supply accounts for all physical currency circulating in an economy, but global M1 figures are difficult to obtain. The below table shows global M0 figures from 2008. After the global financial crisis, world money supply increased dramatically, however, this didn’t translate highly into printed physical currency, i.e. M1 supply – just more numbers on a screen in a financial institution, i.e. M0 supply. The rest of this chapter will simplify the analysis greatly by assuming similar proportions for M0 and M1 money supply, and typically only consider the Euro, USD and Yen, who account for 60% of the world total, and extrapolate figures from there.
Figure 5 - World M0 Money Supply - 2008 (Hewitt, 2008)
2nd Edition 11

Coins
The next sections will use the Euro and the USD to illustrate this point further, and attempt to extrapolate production to other markets.
US Dollar
Coin 1 ¢ 5 ¢ 10 ¢ 25 ¢ 50 ¢ $1 (Pres.) $1 (NA) Total
Coins Produced (millions)
62918 10482 17450 20023 90 781 1257 113000
Coin Weight (grams)
2.5 5 2.268 5.67 11.34 8.1 8.1
Metal Used (tonnes)
157296 52410 39576 113532 1021 6329 10180 380344
Table 6 - USD Coins in Circulation (produced 1999 – 2014) (U.S. Mint, 2014) (CoinNews, 2012)
Euro
Coin € 0.01 € 0.02 € 0.05 € 0.10 € 0.20 € 0.50 € 1 € 2 Total
Circulating Coins
(millions) 27892 21770 17200 12725 9716 5374 6457 5048 106180
Weight (g) 2.3 3.06 3.92 4.1 5.74 7.8 7.5 8.4
Total (tonne) 64152 66616 67424 52173 55770 41917 48428 42403 438882
Table 7 - Euro Coins in Circulation as at February 2014 (European Central Bank, 2014)
Japan Japan bucks the trend of the US and EU and only has about 4.5 billion coins in circulation, over 20 times less than the EU or USA (Statistics Japan, 2014).
Rest of the World Statistics from India show over 1 trillion coins in circulation – roughly 4 times the quantity of USD coins and Euro coins combined (Chinnammai, 2013). Combining the USD, EU and India accounts for only one third of the world’s population, so to be conservative, it will be assumed that 1.5 trillion coins are circulating around the planet, at an average weight of 3.5 tonnes per million coins, i.e., 5.25 million tonnes of metal circulating in the form of coins.
2nd Edition 12
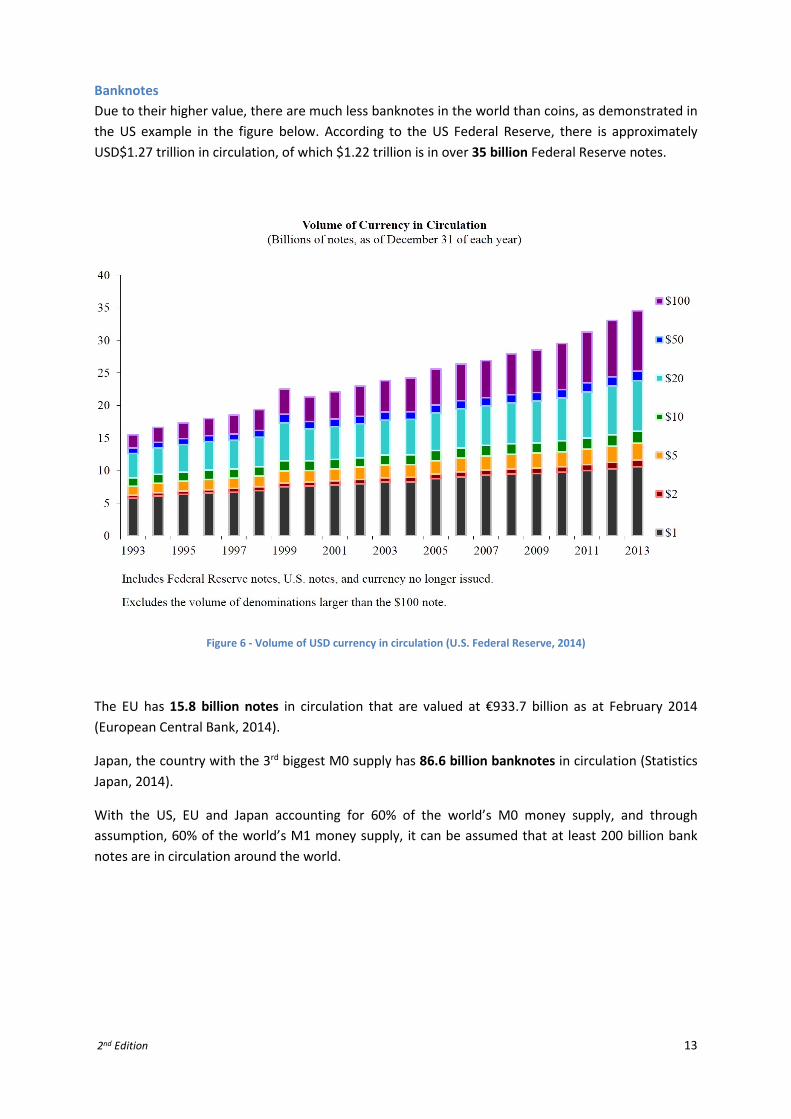
Banknotes Due to their higher value, there are much less banknotes in the world than coins, as demonstrated in the US example in the figure below. According to the US Federal Reserve, there is approximately USD$1.27 trillion in circulation, of which $1.22 trillion is in over 35 billion Federal Reserve notes.
Figure 6 - Volume of USD currency in circulation (U.S. Federal Reserve, 2014)
The EU has 15.8 billion notes in circulation that are valued at €933.7 billion as at February 2014 (European Central Bank, 2014).
Japan, the country with the 3rd biggest M0 supply has 86.6 billion banknotes in circulation (Statistics Japan, 2014).
With the US, EU and Japan accounting for 60% of the world’s M0 money supply, and through assumption, 60% of the world’s M1 money supply, it can be assumed that at least 200 billion bank notes are in circulation around the world.
2nd Edition 13

Economic Costs of Physical Currency
Banknotes Smithers-Pira estimates the global market for security printing in 2018 to reach USD$35.3 billion, based on a compound annual growth rate of 5.9% between 2013 – 2018, putting the current global market size at USD$26.5 billion (Smithers Pira, 2013).
Figure 7 - World Security Printing Market (Smithers Pira, 2013)
As a check, the United States paper currency budget for 2014 is USD$826.7 million (U.S. Federal Reserve, 2014). The United States has typically cheaper printed currency, due to their cotton-linen mix as opposed to typically polymer-based security currency. Whilst polymer notes cost twice as much as cotton ones, they last 4 times as long, effectively cutting the whole-of-life costs by 50% (Ahlers, et al., 2010).
Due to their increased defence against counterfeiting, as well as their longevity and lower environmental impact, it is expected that if the world does not go digital with their currency, polymer security notes will take over the cotton-linen market.
Coins The budget to mint US Coins in 2013 was USD$459 million (U.S. Mint, 2014) however, it is difficult to glean a detailed breakdown of these costs. To take the simplest approach, we can multiply the mass of all coins in circulation by the cost to buy the equivalent amount of raw materials, with a 25% premium put in place for the production process.
In 2013, the US used 37240 tonnes of metal to produce coins, of which 90% was copper and 10% was nickel (U.S. Mint, 2014). At a copper price of $7000/tonne and a Nickel price of $16,000/tonne (London 2nd Edition 14
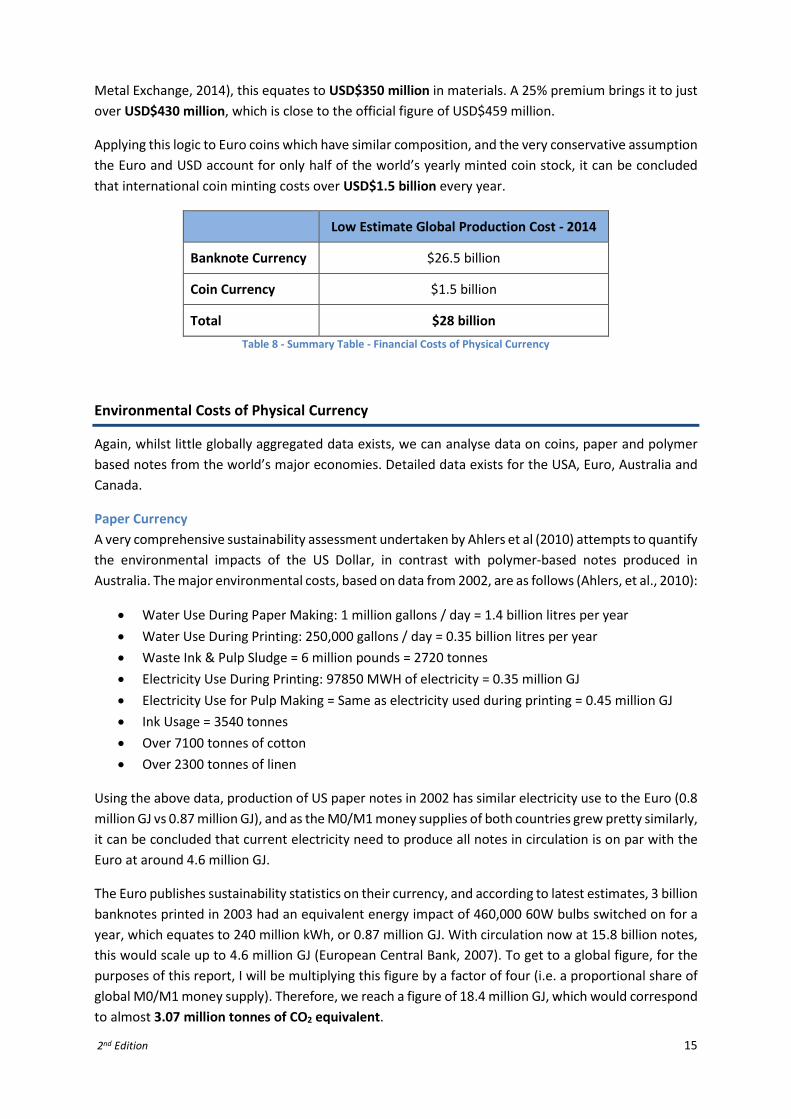
Metal Exchange, 2014), this equates to USD$350 million in materials. A 25% premium brings it to just over USD$430 million, which is close to the official figure of USD$459 million.
Applying this logic to Euro coins which have similar composition, and the very conservative assumption the Euro and USD account for only half of the world’s yearly minted coin stock, it can be concluded that international coin minting costs over USD$1.5 billion every year.
Low Estimate Global Production Cost - 2014
Banknote Currency $26.5 billion
Coin Currency $1.5 billion
Total $28 billion Table 8 - Summary Table - Financial Costs of Physical Currency
Environmental Costs of Physical Currency
Again, whilst little globally aggregated data exists, we can analyse data on coins, paper and polymer based notes from the world’s major economies. Detailed data exists for the USA, Euro, Australia and Canada.
Paper Currency A very comprehensive sustainability assessment undertaken by Ahlers et al (2010) attempts to quantify the environmental impacts of the US Dollar, in contrast with polymer-based notes produced in Australia. The major environmental costs, based on data from 2002, are as follows (Ahlers, et al., 2010):
• Water Use During Paper Making: 1 million gallons / day = 1.4 billion litres per year • Water Use During Printing: 250,000 gallons / day = 0.35 billion litres per year • Waste Ink & Pulp Sludge = 6 million pounds = 2720 tonnes • Electricity Use During Printing: 97850 MWH of electricity = 0.35 million GJ • Electricity Use for Pulp Making = Same as electricity used during printing = 0.45 million GJ • Ink Usage = 3540 tonnes • Over 7100 tonnes of cotton • Over 2300 tonnes of linen
Using the above data, production of US paper notes in 2002 has similar electricity use to the Euro (0.8 million GJ vs 0.87 million GJ), and as the M0/M1 money supplies of both countries grew pretty similarly, it can be concluded that current electricity need to produce all notes in circulation is on par with the Euro at around 4.6 million GJ.
The Euro publishes sustainability statistics on their currency, and according to latest estimates, 3 billion banknotes printed in 2003 had an equivalent energy impact of 460,000 60W bulbs switched on for a year, which equates to 240 million kWh, or 0.87 million GJ. With circulation now at 15.8 billion notes, this would scale up to 4.6 million GJ (European Central Bank, 2007). To get to a global figure, for the purposes of this report, I will be multiplying this figure by a factor of four (i.e. a proportional share of global M0/M1 money supply). Therefore, we reach a figure of 18.4 million GJ, which would correspond to almost 3.07 million tonnes of CO2 equivalent.
2nd Edition 15

Using heuristics from analysis of 100 paper bank notes, the conclusion can be drawn that 200 billion notes produce 3.2 million tonnes of CO2, with 100 paper notes producing 1.59kg CO2 equivalent (PE Americas; Tryskele, 2011). This figure checks well.
Low Estimate Global Production Cost - 2014
Energy Used 18.4 million GJ
Yearly Water Use 10 billion litres
CO2 (calculated) 3.2 million tonnes Table 9 - Summary Table – Environmental Costs of Paper Currency in Circulation
Polymer Currency Polymer Currency has shown to produce at least 30% less environmental impact than cotton-paper currency (PE Americas; Tryskele, 2011). Due to the relatively small volume of polymer-based currency currently circulating internationally, polymer based currency will not be considered further in this report. As discussed earlier, due to economic, environmental, and social superiority to cotton-paper money, it is likely that over the next generation, all paper money circulating in the world will become polymer based.
Coins Although there is no concrete data of global yearly minting statistics, data from the EU and US can be extrapolated globally. As a check, you can divide the number of coins currently in circulation in the world, 1.5 trillion, by the average life of a coin, 25 years, to reach a figure of 60 billion coins minted per annum. For reference, the U.S. mint minted 10.7 billion coins in 2013 (U.S. Mint, 2013), so a global figure of 60 billion is not unreasonable.
Using weight data from earlier sections of this report, the average weight of one million coins is roughly 3.5 tonnes. This means that 60 billion coins will require 210,000 tonnes of metal. Simplifying further and optimistically assuming that coins are 50% copper and 50% steel by weight, and using the carbon emissions data from the table below, we reach a figure of 21.25 million GJ to simply mine the materials used for coin making, not including the energy required for cutting and stamping coins.
Metal GJ / tonne for mining
Nickel 780 Copper 200
Steel 2.5 Table 10 - Carbon emissions from select base metal mine sites (Farrell, 2009)
2nd Edition 16
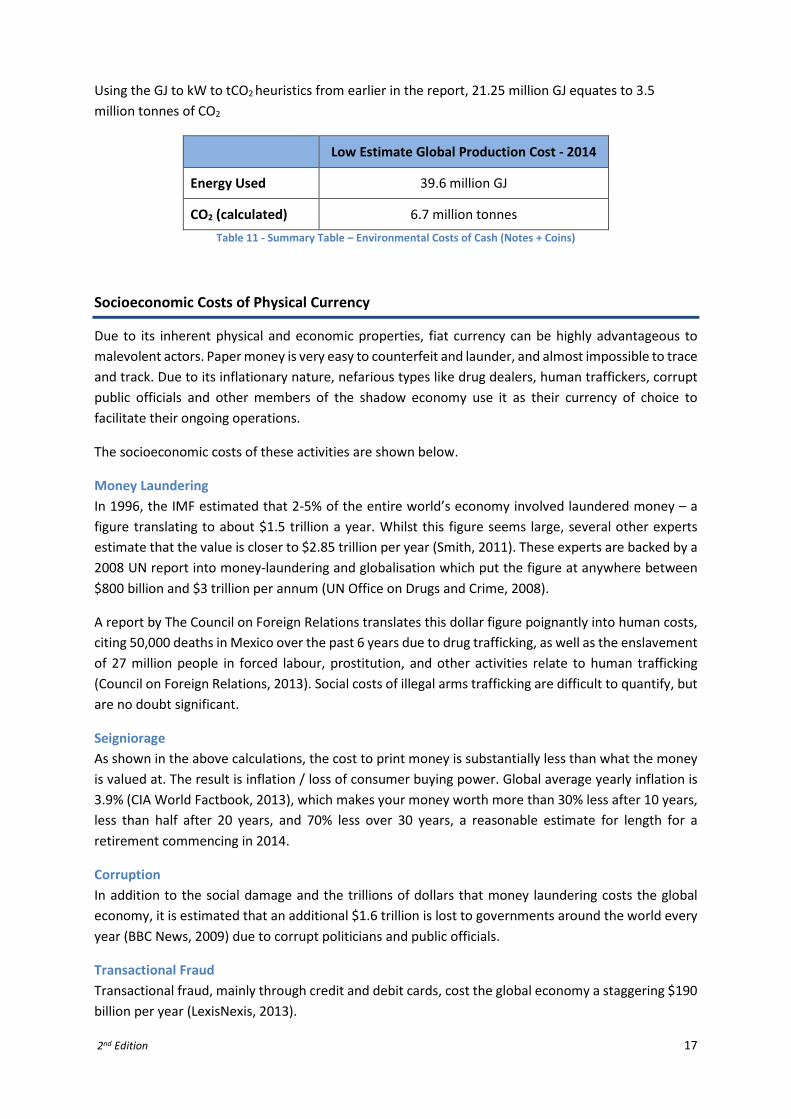
Using the GJ to kW to tCO2 heuristics from earlier in the report, 21.25 million GJ equates to 3.5 million tonnes of CO2
Low Estimate Global Production Cost - 2014
Energy Used 39.6 million GJ
CO2 (calculated) 6.7 million tonnes Table 11 - Summary Table – Environmental Costs of Cash (Notes + Coins)
Socioeconomic Costs of Physical Currency
Due to its inherent physical and economic properties, fiat currency can be highly advantageous to malevolent actors. Paper money is very easy to counterfeit and launder, and almost impossible to trace and track. Due to its inflationary nature, nefarious types like drug dealers, human traffickers, corrupt public officials and other members of the shadow economy use it as their currency of choice to facilitate their ongoing operations.
The socioeconomic costs of these activities are shown below.
Money Laundering In 1996, the IMF estimated that 2-5% of the entire world’s economy involved laundered money – a figure translating to about $1.5 trillion a year. Whilst this figure seems large, several other experts estimate that the value is closer to $2.85 trillion per year (Smith, 2011). These experts are backed by a 2008 UN report into money-laundering and globalisation which put the figure at anywhere between $800 billion and $3 trillion per annum (UN Office on Drugs and Crime, 2008).
A report by The Council on Foreign Relations translates this dollar figure poignantly into human costs, citing 50,000 deaths in Mexico over the past 6 years due to drug trafficking, as well as the enslavement of 27 million people in forced labour, prostitution, and other activities relate to human trafficking (Council on Foreign Relations, 2013). Social costs of illegal arms trafficking are difficult to quantify, but are no doubt significant.
Seigniorage As shown in the above calculations, the cost to print money is substantially less than what the money is valued at. The result is inflation / loss of consumer buying power. Global average yearly inflation is 3.9% (CIA World Factbook, 2013), which makes your money worth more than 30% less after 10 years, less than half after 20 years, and 70% less over 30 years, a reasonable estimate for length for a retirement commencing in 2014.
Corruption In addition to the social damage and the trillions of dollars that money laundering costs the global economy, it is estimated that an additional $1.6 trillion is lost to governments around the world every year (BBC News, 2009) due to corrupt politicians and public officials.
Transactional Fraud Transactional fraud, mainly through credit and debit cards, cost the global economy a staggering $190 billion per year (LexisNexis, 2013).
2nd Edition 17
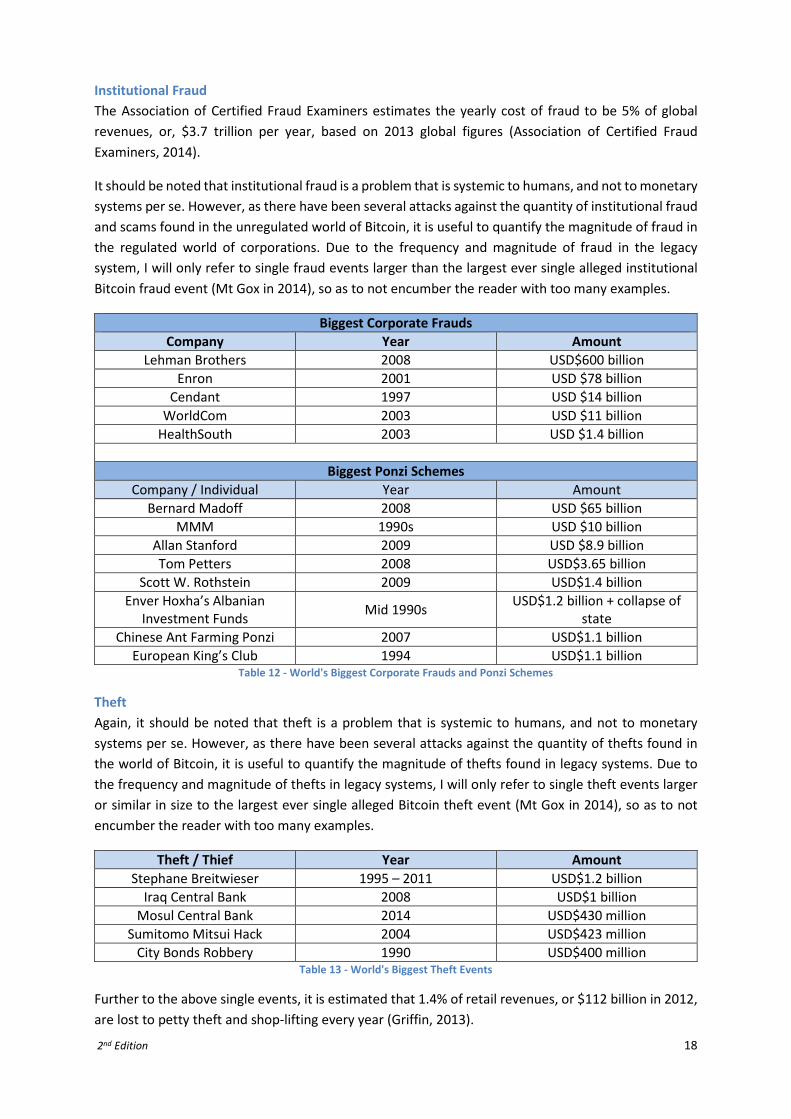
Institutional Fraud The Association of Certified Fraud Examiners estimates the yearly cost of fraud to be 5% of global revenues, or, $3.7 trillion per year, based on 2013 global figures (Association of Certified Fraud Examiners, 2014).
It should be noted that institutional fraud is a problem that is systemic to humans, and not to monetary systems per se. However, as there have been several attacks against the quantity of institutional fraud and scams found in the unregulated world of Bitcoin, it is useful to quantify the magnitude of fraud in the regulated world of corporations. Due to the frequency and magnitude of fraud in the legacy system, I will only refer to single fraud events larger than the largest ever single alleged institutional Bitcoin fraud event (Mt Gox in 2014), so as to not encumber the reader with too many examples.
Biggest Corporate Frauds Company Year Amount
Lehman Brothers 2008 USD$600 billion Enron 2001 USD $78 billion
Cendant 1997 USD $14 billion WorldCom 2003 USD $11 billion
HealthSouth 2003 USD $1.4 billion
Biggest Ponzi Schemes Company / Individual Year Amount
Bernard Madoff 2008 USD $65 billion MMM 1990s USD $10 billion
Allan Stanford 2009 USD $8.9 billion Tom Petters 2008 USD$3.65 billion
Scott W. Rothstein 2009 USD$1.4 billion Enver Hoxha’s Albanian
Investment Funds Mid 1990s USD$1.2 billion + collapse of state
Chinese Ant Farming Ponzi 2007 USD$1.1 billion European King’s Club 1994 USD$1.1 billion
Table 12 - World's Biggest Corporate Frauds and Ponzi Schemes
Theft Again, it should be noted that theft is a problem that is systemic to humans, and not to monetary systems per se. However, as there have been several attacks against the quantity of thefts found in the world of Bitcoin, it is useful to quantify the magnitude of thefts found in legacy systems. Due to the frequency and magnitude of thefts in legacy systems, I will only refer to single theft events larger or similar in size to the largest ever single alleged Bitcoin theft event (Mt Gox in 2014), so as to not encumber the reader with too many examples.
Theft / Thief Year Amount Stephane Breitwieser 1995 – 2011 USD$1.2 billion
Iraq Central Bank 2008 USD$1 billion Mosul Central Bank 2014 USD$430 million
Sumitomo Mitsui Hack 2004 USD$423 million City Bonds Robbery 1990 USD$400 million
Table 13 - World's Biggest Theft Events
Further to the above single events, it is estimated that 1.4% of retail revenues, or $112 billion in 2012, are lost to petty theft and shop-lifting every year (Griffin, 2013).
2nd Edition 18
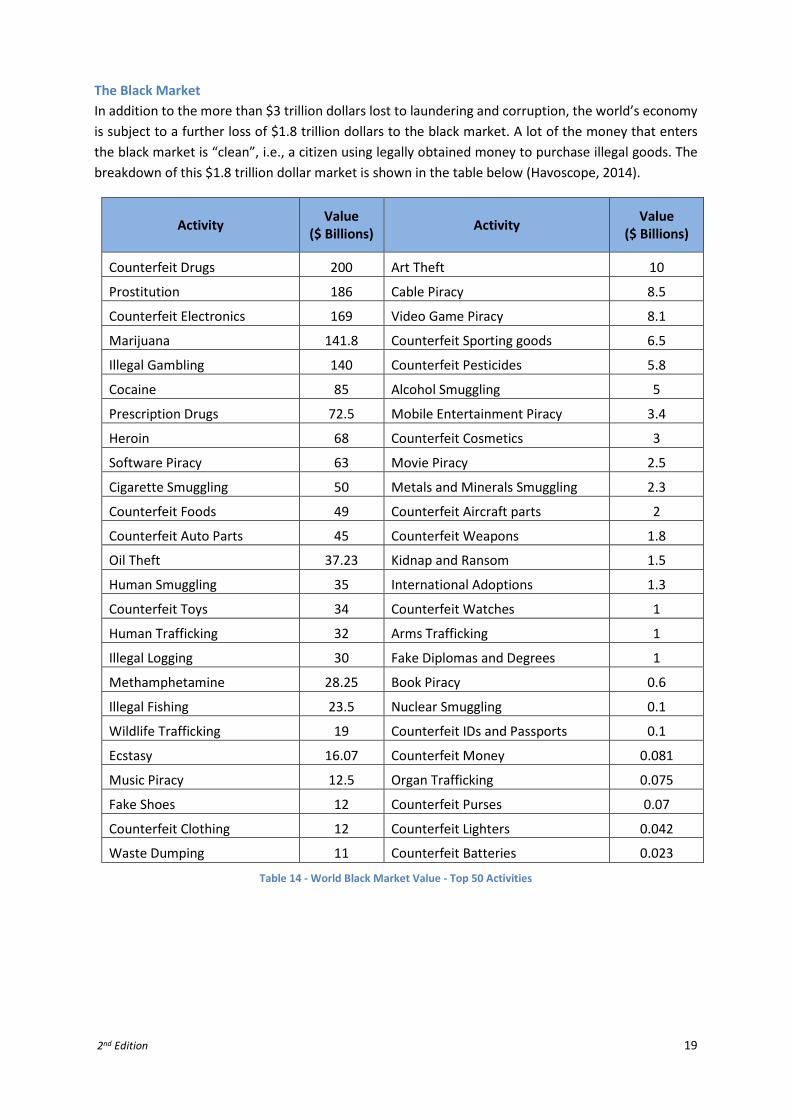
The Black Market In addition to the more than $3 trillion dollars lost to laundering and corruption, the world’s economy is subject to a further loss of $1.8 trillion dollars to the black market. A lot of the money that enters the black market is “clean”, i.e., a citizen using legally obtained money to purchase illegal goods. The breakdown of this $1.8 trillion dollar market is shown in the table below (Havoscope, 2014).
Activity Value ($ Billions) Activity Value
($ Billions)
Counterfeit Drugs 200 Art Theft 10
Prostitution 186 Cable Piracy 8.5
Counterfeit Electronics 169 Video Game Piracy 8.1
Marijuana 141.8 Counterfeit Sporting goods 6.5
Illegal Gambling 140 Counterfeit Pesticides 5.8
Cocaine 85 Alcohol Smuggling 5
Prescription Drugs 72.5 Mobile Entertainment Piracy 3.4
Heroin 68 Counterfeit Cosmetics 3
Software Piracy 63 Movie Piracy 2.5
Cigarette Smuggling 50 Metals and Minerals Smuggling 2.3
Counterfeit Foods 49 Counterfeit Aircraft parts 2
Counterfeit Auto Parts 45 Counterfeit Weapons 1.8
Oil Theft 37.23 Kidnap and Ransom 1.5
Human Smuggling 35 International Adoptions 1.3
Counterfeit Toys 34 Counterfeit Watches 1
Human Trafficking 32 Arms Trafficking 1
Illegal Logging 30 Fake Diplomas and Degrees 1
Methamphetamine 28.25 Book Piracy 0.6
Illegal Fishing 23.5 Nuclear Smuggling 0.1
Wildlife Trafficking 19 Counterfeit IDs and Passports 0.1
Ecstasy 16.07 Counterfeit Money 0.081
Music Piracy 12.5 Organ Trafficking 0.075
Fake Shoes 12 Counterfeit Purses 0.07
Counterfeit Clothing 12 Counterfeit Lighters 0.042
Waste Dumping 11 Counterfeit Batteries 0.023
Table 14 - World Black Market Value - Top 50 Activities
2nd Edition 19
Environmental Impact of the Banking System It is very hard to quantify the global impact of the banking and finance system, however, there are some key figures that we can draw on for an order-of-magnitude estimate. It is important to note that whilst this can be construed as an apples-to-oranges comparison, it is equally important to get a frame of reference of the huge environmental impact of the banking industry, and to illustrate that we must ensure that we avoid having the same negative impact as we have in the past, should Bitcoin be successful and scale to the size of the existing system
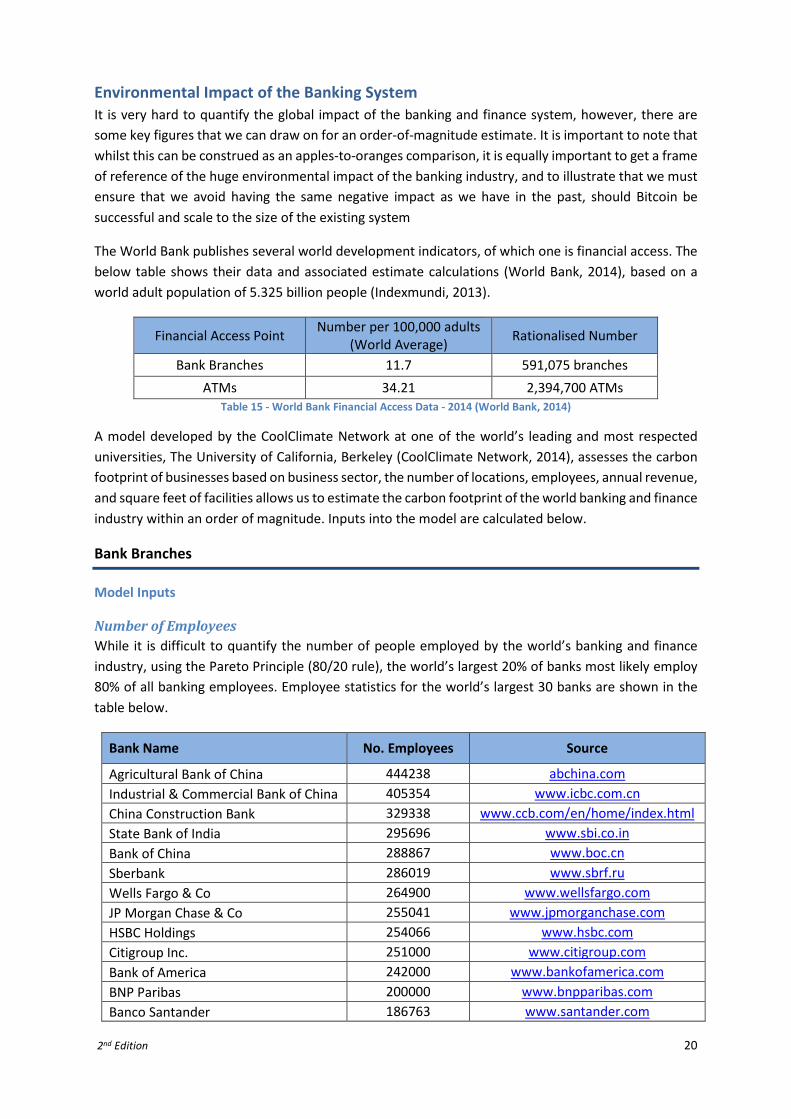
The World Bank publishes several world development indicators, of which one is financial access. The below table shows their data and associated estimate calculations (World Bank, 2014), based on a world adult population of 5.325 billion people (Indexmundi, 2013).
Financial Access Point Number per 100,000 adults (World Average) Rationalised Number
Bank Branches 11.7 591,075 branches ATMs 34.21 2,394,700 ATMs
Table 15 - World Bank Financial Access Data - 2014 (World Bank, 2014)
A model developed by the CoolClimate Network at one of the world’s leading and most respected universities, The University of California, Berkeley (CoolClimate Network, 2014), assesses the carbon footprint of businesses based on business sector, the number of locations, employees, annual revenue, and square feet of facilities allows us to estimate the carbon footprint of the world banking and finance industry within an order of magnitude. Inputs into the model are calculated below.
Bank Branches
Model Inputs
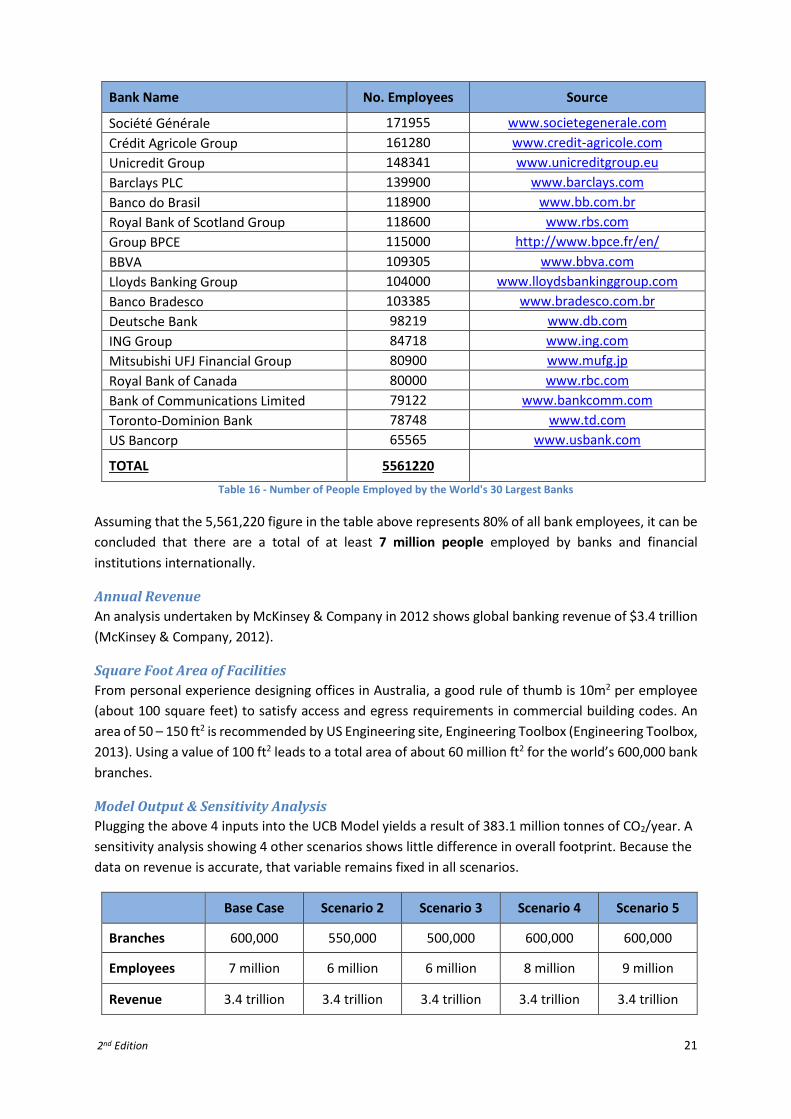
Number of Employees While it is difficult to quantify the number of people employed by the world’s banking and finance industry, using the Pareto Principle (80/20 rule), the world’s largest 20% of banks most likely employ 80% of all banking employees. Employee statistics for the world’s largest 30 banks are shown in the table below.
Bank Name No. Employees Source
Agricultural Bank of China 444238 abchina.com
Industrial & Commercial Bank of China 405354 www.icbc.com.cn
China Construction Bank 329338 www.ccb.com/en/home/index.html
State Bank of India 295696 www.sbi.co.in
Bank of China 288867 www.boc.cn
Sberbank 286019 www.sbrf.ru
Wells Fargo & Co 264900 www.wellsfargo.com
JP Morgan Chase & Co 255041 www.jpmorganchase.com
HSBC Holdings 254066 www.hsbc.com
Citigroup Inc. 251000 www.citigroup.com
Bank of America 242000 www.bankofamerica.com
BNP Paribas 200000 www.bnpparibas.com
Banco Santander 186763 www.santander.com
2nd Edition 20
Bank Name No. Employees Source
Société Générale 171955 www.societegenerale.com
Crédit Agricole Group 161280 www.credit-agricole.com
Unicredit Group 148341 www.unicreditgroup.eu
Barclays PLC 139900 www.barclays.com
Banco do Brasil 118900 www.bb.com.br
Royal Bank of Scotland Group 118600 www.rbs.com
Group BPCE 115000 http://www.bpce.fr/en/
BBVA 109305 www.bbva.com
Lloyds Banking Group 104000 www.lloydsbankinggroup.com
Banco Bradesco 103385 www.bradesco.com.br
Deutsche Bank 98219 www.db.com
ING Group 84718 www.ing.com
Mitsubishi UFJ Financial Group 80900 www.mufg.jp
Royal Bank of Canada 80000 www.rbc.com
Bank of Communications Limited 79122 www.bankcomm.com
Toronto-Dominion Bank 78748 www.td.com
US Bancorp 65565 www.usbank.com
TOTAL 5561220 Table 16 - Number of People Employed by the World's 30 Largest Banks
Assuming that the 5,561,220 figure in the table above represents 80% of all bank employees, it can be concluded that there are a total of at least 7 million people employed by banks and financial institutions internationally.
Annual Revenue An analysis undertaken by McKinsey & Company in 2012 shows global banking revenue of $3.4 trillion (McKinsey & Company, 2012).
Square Foot Area of Facilities From personal experience designing offices in Australia, a good rule of thumb is 10m2 per employee (about 100 square feet) to satisfy access and egress requirements in commercial building codes. An area of 50 – 150 ft2 is recommended by US Engineering site, Engineering Toolbox (Engineering Toolbox, 2013). Using a value of 100 ft2 leads to a total area of about 60 million ft2 for the world’s 600,000 bank branches.
Model Output & Sensitivity Analysis Plugging the above 4 inputs into the UCB Model yields a result of 383.1 million tonnes of CO2/year. A sensitivity analysis showing 4 other scenarios shows little difference in overall footprint. Because the data on revenue is accurate, that variable remains fixed in all scenarios.
Base Case Scenario 2 Scenario 3 Scenario 4 Scenario 5
Branches 600,000 550,000 500,000 600,000 600,000
Employees 7 million 6 million 6 million 8 million 9 million
Revenue 3.4 trillion 3.4 trillion 3.4 trillion 3.4 trillion 3.4 trillion
2nd Edition 21

Square Feet 60 million 50 million 40 million 60 million 60 million
Tonnes of CO2 383.1 million 380.4 million 380.3 million 385.7 million 388.2 million Table 17 - Model Outputs & Sensitivity Analysis - Global Banking Carbon Footprint
As can be seen from Table 17, the governing factor of the model appears to be the amount of yearly revenue generated, as significant changes to number of employees and branches have little effect on the model output.
Sense Check The World Resource Institute categorises World Greenhouse Gas Emissions by end-use and activity (World Resources Institute, 2009). In their 2009 report, it was identified that Commercial Buildings account for 6.3% of world emissions, and the mining of non-ferrous metals (including Gold) and aluminium account for 1.3% - an impact ratio of commercial buildings to mining of 4.86.
Considering that only a relatively small amount of Gold is mined every year (a few thousand tonnes), it is assumed that banks account for larger proportion of all commercial buildings, as gold mining does for non-ferrous metal mining. This would mean that banks should have an impact of between 6-8 times greater than that of gold. Having calculated a value of 54 million tonnes of CO2 produced by the gold mining industry, this would put the impact of the banking industry between 324 and 432 million tonnes of CO2, which is well within the same ballpark as the value of 380 million tonnes calculated by the UCB model.
ATMs
While ATMs reduce the need for bank branches, these machines have their own carbon footprint which isn’t insignificant.
It is estimated that each of the world’s 2,394,700 ATMs has an energy usage of 0.25 kWh (Roth, et al., 2002). This translates to a yearly energy use of 18.9 million GJ, or 3.2 million tonnes of CO2.
Summary
The environmental impact of the world’s financial access points are summarised in the table below
Access Type Impact (million tonnes CO2 / year) Energy Use (GJ)
Bank Branches 383.1 2.3 billion
Automatic Telling Machines 3.2 18.9 million
Total 386.3 2.3 billion
Table 18 - Summary of Impact of World's Banking and Finance Access Points
Using the rate of $100 / MWh, the above energy use would equate to an annual energy bill of $63.8 billion, or, roughly 2% of total revenue. To give the reader a broader idea of the efficiency of the banking system, banks typically have an overall expense-to-income ratio of over 55% (Federal Reserve Bank of St. Louis, 2011), i.e. overall expenses of 0.55 x 3.4 trillion = $1.87 trillion
2nd Edition 22

The Bitcoin Network & Bitcoin Mining
Introduction
Bitcoin mining underpins the Bitcoin network, and is the most fundamental aspect of the Bitcoin network, as the mining process both verifies and logs transactions, as well as generates new Bitcoins.
The landscape of the Bitcoin mining industry is very dynamic, and has experienced significant evolution since the network was created in January 2009. It is a perfectly competitive market, and anyone in the world can join it due to the lack of significant barriers to entry.
All calculations throughout have not been rationalised by market-cap of Bitcoin, as it is uncertain if Bitcoin will ever scale, and if it does, it is almost certain that mining equipment will exponentially increase in processing efficiency in line with Moore’s Law for at least another decade (Hruska, 2013), and exponentially increase in power efficiency in line with Koomey’s Law for at least another 30 years (Koomey, et al., 2010).
Brief History & Trends
Similar to gold mining, over time, Bitcoins become relatively harder and more expensive to mine. Just as several people found success panning for gold during the California Gold Rush of the 1840’s, making any money in the gold mining industry in 2014 requires multi-billion dollar infrastructure and equipment, and highly specialised technical skills and knowledge.
Mirroring this evolution, in the very early days of Bitcoin, an ordinary home PC could mine hundreds of Bitcoins per day, but at the time of this writing, a $10,000 piece of hardware known as an Application Specific Integrated Circuit (ASIC) will only mine fractions of a Bitcoin per day. This is because Bitcoins are mined when a complicated algorithm is solved and transaction block generated, typically every 10 minutes. When network hashrate increases, algorithms are solved faster, so the Bitcoin network self-regulates by increasing the difficulty of solving the algorithm to ensure that a new transaction block is generated every 10 minutes. If hashrate drops and blocks take longer than 10 minutes to generate, the network self-regulates and decreases difficulty.
Table 19 - Bitcoin Hashrate vs. Difficulty – Sept 2013 – June 2014 (BitcoinWisdom, 2014)
2nd Edition 23
Since October 30 2012, the network hashing power has increased exponentially from 23,645 GH/s to 130,000,000 GH/s at the time of this writing, a growth of almost 5,500 times (BitcoinWisdom, 2014).
Current Short-to-Medium-term Trend (3-18 months) Based on current relative lack of international adoption of bitcoin, and the equilibrium move to 28nm ASIC mining architecture, and then 20nm architecture, we can expect to see steady growth in hashrate and network difficulty of 15-20% per fortnight. For reference, of the 74 difficulty changes between 22 January 2012 and 12 July 2014, average difficulty increase was 14.38% +/- 12.03% (BitcoinWisdom, 2014).
Long-term trend (18-months+) Although it is apparent that the days of Moore’s Law of number of transistors doubling on a circuit-board every 18 months are coming to an end, due to size constraints of silicon atoms (10 nano-meters), it is not expected that Moore’s law will come to an end for another 6 or 7 years (Hruska, 2013), so this research will need to be revisited when there is a paradigm-shifting step-change in processing speed and energy efficiency. As can be seen in Table 20, future technology will make huge strides in efficiency and price per GH. In addition to Moore’s Law, Koomey’s Law (Koomey, et al., 2010), a law which has been accurate since the 1950s, and by which, according to the Landauer Principle (Landauer, 1961) and Second Law of Thermodynamics is expected to hold until 2048 when 99% of all Bitcoins are mined, energy needed for a fixed computing load halves every 18 months i.e. a factor of 100 every decade. Bruce Henderson hypothesised that in a competitive marketplace, there is a natural tendency for the market to be dominated by three or four players – known as “The Rule of Three” (Henderson, 1976). This hypothesis was tested and supported by Sheth and Sisodia, who observed the evolution of roughly 200 competitive markets (Sheth & Sisodia, 2002). According to their research, it is almost impossible for an oligopoly or monopoly to continue to dominate a competitive marketp in the long-term, not least a perfectly competitive market such as Bitcoin. The only times disruption to oligopolies and monopolies does not happen and when The Rule of Three does not apply is when the following conditions exist in a market:
1. Regulation hindering competition 2. Exclusive rights 3. Major barriers to entry 4. Markets with combined management and ownership
These conditions simply do not exist in the bitcoin economy. Therefore, in the long-term, as huge chip makers similar to Intel or AMD focus on mass-consumer production of ASIC mining equipment, the industry will most likely be dominated by 3 or 4 large pools, who each are powered in a reasonable part by individual private miners.
Naturally, the most competitive and profitable mining pools will be those set up in jurisdictions with the cheapest electricity, as well as access to cheaper-than-competitor bulk hardware.
2nd Edition 24
Economic & Environmental Impact Assumptions
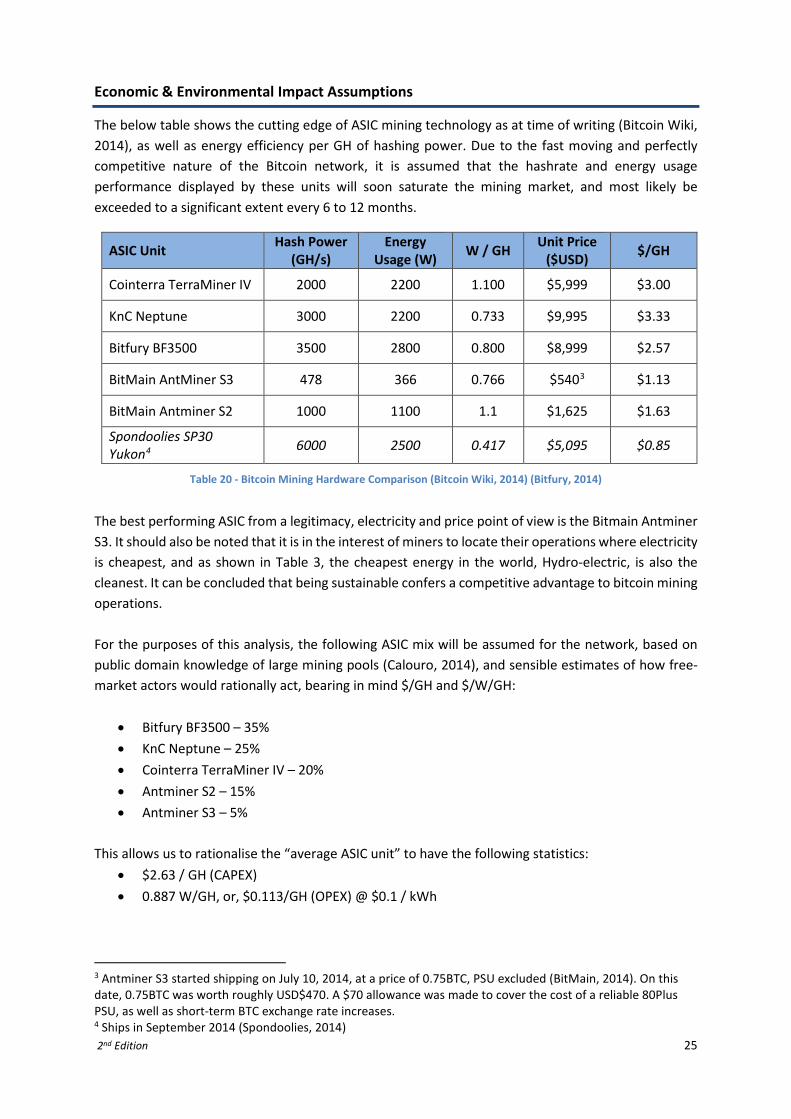
The below table shows the cutting edge of ASIC mining technology as at time of writing (Bitcoin Wiki, 2014), as well as energy efficiency per GH of hashing power. Due to the fast moving and perfectly competitive nature of the Bitcoin network, it is assumed that the hashrate and energy usage performance displayed by these units will soon saturate the mining market, and most likely be exceeded to a significant extent every 6 to 12 months.
ASIC Unit Hash Power (GH/s)
Energy Usage (W) W / GH Unit Price
($USD) $/GH
Cointerra TerraMiner IV 2000 2200 1.100 $5,999 $3.00
KnC Neptune 3000 2200 0.733 $9,995 $3.33
Bitfury BF3500 3500 2800 0.800 $8,999 $2.57
BitMain AntMiner S3 478 366 0.766 $5403 $1.13
BitMain Antminer S2 1000 1100 1.1 $1,625 $1.63
Spondoolies SP30 Yukon4 6000 2500 0.417 $5,095 $0.85
Table 20 - Bitcoin Mining Hardware Comparison (Bitcoin Wiki, 2014) (Bitfury, 2014)
The best performing ASIC from a legitimacy, electricity and price point of view is the Bitmain Antminer S3. It should also be noted that it is in the interest of miners to locate their operations where electricity is cheapest, and as shown in Table 3, the cheapest energy in the world, Hydro-electric, is also the cleanest. It can be concluded that being sustainable confers a competitive advantage to bitcoin mining operations. For the purposes of this analysis, the following ASIC mix will be assumed for the network, based on public domain knowledge of large mining pools (Calouro, 2014), and sensible estimates of how free-market actors would rationally act, bearing in mind $/GH and $/W/GH:
• Bitfury BF3500 – 35% • KnC Neptune – 25% • Cointerra TerraMiner IV – 20% • Antminer S2 – 15% • Antminer S3 – 5%
This allows us to rationalise the “average ASIC unit” to have the following statistics:
• $2.63 / GH (CAPEX) • 0.887 W/GH, or, $0.113/GH (OPEX) @ $0.1 / kWh
3 Antminer S3 started shipping on July 10, 2014, at a price of 0.75BTC, PSU excluded (BitMain, 2014). On this date, 0.75BTC was worth roughly USD$470. A $70 allowance was made to cover the cost of a reliable 80Plus PSU, as well as short-term BTC exchange rate increases. 4 Ships in September 2014 (Spondoolies, 2014) 2nd Edition 25
Environmental Costs of Running the Bitcoin Network
With a network hashrate of 130,000,000 GH/s, the network needs 0.887 x 130,000,000 Watts = 115,260 kW. This equates to 115,260 kW x 24 hrs/day x 365.25days/yr = 1,010,371,972 kWh / year.
This equates to 3.64 million GJ/year, and 610,000 tonnes of CO2 / year.
At $100/MWh (Table 1), this electricity would cost $101,037,197 / year.
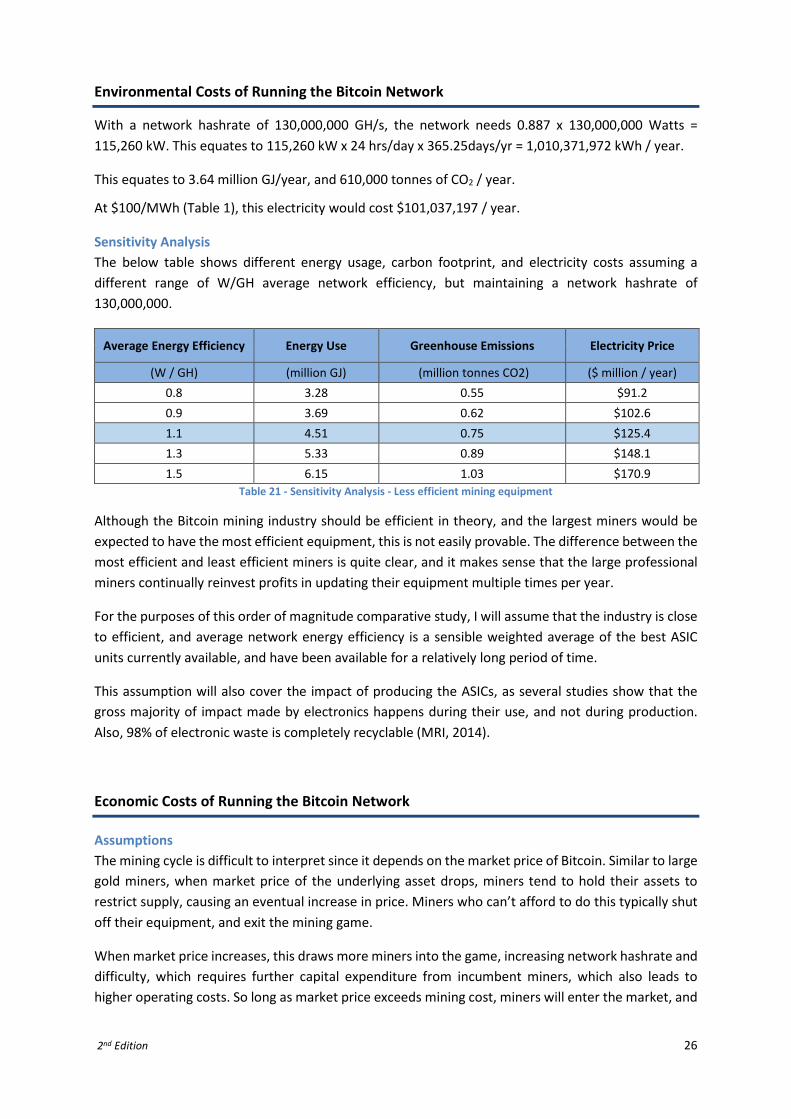
Sensitivity Analysis The below table shows different energy usage, carbon footprint, and electricity costs assuming a different range of W/GH average network efficiency, but maintaining a network hashrate of 130,000,000.
Average Energy Efficiency Energy Use Greenhouse Emissions Electricity Price
(W / GH) (million GJ) (million tonnes CO2) ($ million / year) 0.8 3.28 0.55 $91.2 0.9 3.69 0.62 $102.6 1.1 4.51 0.75 $125.4 1.3 5.33 0.89 $148.1 1.5 6.15 1.03 $170.9
Table 21 - Sensitivity Analysis - Less efficient mining equipment
Although the Bitcoin mining industry should be efficient in theory, and the largest miners would be expected to have the most efficient equipment, this is not easily provable. The difference between the most efficient and least efficient miners is quite clear, and it makes sense that the large professional miners continually reinvest profits in updating their equipment multiple times per year.
For the purposes of this order of magnitude comparative study, I will assume that the industry is close to efficient, and average network energy efficiency is a sensible weighted average of the best ASIC units currently available, and have been available for a relatively long period of time.
This assumption will also cover the impact of producing the ASICs, as several studies show that the gross majority of impact made by electronics happens during their use, and not during production. Also, 98% of electronic waste is completely recyclable (MRI, 2014).
Economic Costs of Running the Bitcoin Network
Assumptions The mining cycle is difficult to interpret since it depends on the market price of Bitcoin. Similar to large gold miners, when market price of the underlying asset drops, miners tend to hold their assets to restrict supply, causing an eventual increase in price. Miners who can’t afford to do this typically shut off their equipment, and exit the mining game.
When market price increases, this draws more miners into the game, increasing network hashrate and difficulty, which requires further capital expenditure from incumbent miners, which also leads to higher operating costs. So long as market price exceeds mining cost, miners will enter the market, and
2nd Edition 26

so long as mining costs exceed the market price, miners will either leave the game, or withhold supply – just as physical commodity miners do.
Difficulty increases have been fairly consistent over the past year, with typical fortnightly hashrate increases of between 10 and 20% (BitcoinWisdom, 2014). Because of this, the useful life of most mining equipment is only about 3 to 6 months.
Capital Expenditure (CAPEX) Theoretically, breaking the 130,000,000 GH/s hashrate down into equivalent network-average ASIC units at a CAPEX cost of $2.63/GH results in a one-off CAPEX of $343.3 million. Assuming this has to be spent twice a year, CAPEX of around $684.6 million needs to be invested in the network every year. At the current block reward of 25 Bitcoins per 10 minutes, roughly 1,314,000 Bitcoins are mined per year. This equates to yearly CAPEX of $684.6 million / 1.3140 million Bitcoins = $521 / Bitcoin.
Operational Expenditure (OPEX) As calculated earlier, yearly electricity OPEX for a network-average ASIC would be $101,037,197 / year, or $77 per coin.
Total Cost Adding CAPEX and OPEX results in a cost to mine a Bitcoin of approximately $598, and a total yearly cost of $785.7 million, +/- 5%. Interestingly, this is well within the +/-5% range of the cost of Bitcoin at the time of writing (Tuesday July 15, 11:00 UTC). It should be expected that price of Bitcoin should grow proportionally with the cost of network CAPEX and OPEX based on hash-rate from this point forward, barring any extraordinary demand cycles. This goes a long way to explain the cyclical bubble nature of Bitcoin’s market price, and gives us insights into local minimum prices after a burst bitcoin cycle bubble.
Yearly Expenditure Type Estimated Expenditure (as at 7/7/2014)
Capital Expenditure (CAPEX) $684.6 million
Operational Expenditure (OPEX) $101.1 million
Total $785.7 million
Total per coin $598.00 (+/- 5%)
Table 22 - Summary of Economic Costs of Bitcoin Mining
2nd Edition 27

Social Costs of Bitcoin
Transactional Fraud Because Bitcoin is resistant to transactional fraud and can be traced through its public ledger, there are no adverse social externalities or costs arising directly or indirectly from Bitcoin mining. Even though Bitcoin addresses are pseudonymous, a good team of detectives will be able to catch a criminal who has not been professionally meticulous in concealing their steps, which is very difficult to do on a public ledger. The slightest lapse of care will make anyone easily identifiable to authorities, and criminal detection rates will be much higher than the 1% success rate enjoyed by authorities in recovering laundered fiat money (UN Office on Drugs and Crime, 2008).
Institutional Fraud / Theft As is the case with any business or industry where money is involved, especially unregulated industries, there is a large scope for scam institutions and fraudsters. There is also potential for institutional incompetence which makes the job of thieves much easier. To that end, there has been quite a bit of negative media surrounding the extent of institutional fraud and theft in the bitcoin world, with one event in particular, The Mt Gox fiasco of February 2014, being amongst the largest financial loss events in history, resulting in a financial loss of $410 million (Forbes.com, 2014). The below table lists all bitcoin institutional fraud/theft events in history which resulted in a financial loss of more than $50,000 (BitcoinTalk, 2014).
Event Date BTC Lost Equivalent $USD Lost Mt Gox Collapse 2013-2014 650,000 $410,000,000 Bitcoin Savings & Trust (Ponzi Scheme) 2011-2012 263,024 $2,983,473 MyBitcoin Theft July 2011 78,739 $1,072,570
Allinvain Theft June 2011 25,000 $445,688
July 2012 Bitcoinica Theft July 2012 40,000 $315,133
Linode Hacks March 2012 46,653 $223,278
May 2012 Bitcoinica Hack May 2012 38,527 $191,638
“Tony” Silk Road Scam April 2012 30,000 $146,944
Mass MyBitcoin Thefts June 2011 4,019 $71,656
Table 23 - List of all Bitcoin theft/fraud events larger than USD$50,000
2nd Edition 28
Comparative Summary
Comparison of Economic Costs
Gross Yearly Cost
Gold Mining USD$105 billion
Gold Recycling USD$40 billion
Paper Currency & Minting USD$28 billion
Banking System USD$1870 billion (of which $63.8 billion are electricity costs)
Bitcoin Mining USD$0.78 billion
Comparison of Environmental Costs
Energy Used (GJ) Tonnes CO2 Produced Emission Trend
Gold Mining 475 million 54 million Increasing
Gold Recycling 25 million 4 million Decreasing
Paper Currency & Minting 39.6 million 6.7 million Increasing
Banking System 2340 million 390 million Increasing
Bitcoin Mining 3.6 million 0.6 million Decreasing
It should be noted that the only thing involved in Bitcoin mining is electricity use, and as the world moves towards clean and renewable energy, Bitcoin will have even less of an impact on the environment (See Koomey’s and Moore’s Laws). There is also much larger scope for energy efficiency improvements in integrated circuits and computing than there are in gold recycling.
Comparison of Socioeconomic Costs
Gold Fiat Currency Bitcoin
Worker Deaths Over 50,000 historically
recorded & Over 100 per year
0 0
Corruption
USD$600m
USD$1.60 trillion
Negligible Money Laundering USD$2.65 trillion
Black Markets USD$1.80 trillion
Institutional Fraud / Theft
USD$21 billion across two single events & several
billion historically recorded
USD$3800 billion/year & several trillion
historically recorded
< USD$0.5 billion ever recorded
Transactional Fraud N/A $190 billion $0
Inflation Deflationary (Long-term) 3.9% per year (time to
loss of 50% loss of value: 17.5 years)
Deflationary (Long-term)
2nd Edition 29

Conclusion As can be conclusively seen, the relative impact of the Bitcoin network does not even register on the radar of the fiat and gold-based monetary systems, representing a very conservative relative environmental impact of just over 0.13%, and a relative economic impact of just under 0.04%. When one considers Koomey’s Law, we can expect energy/GH to continue to half every 18 months until 2048. This means that we can expect our current industry best efficiency of 0.733 W/GH to reach 0.0000000873804 W/GH – so even the most ignorant, arrogant, narrow-minded and pseudo-intellectual critics and arm-chair academics should note that in the event that Bitcoin scales to a million times its current size and market cap over the next 30 years, it’s environmental impact will still be insignificant compared to existing systems. When considering Moore’s Law, we can expect $/GH to continue to half every 18 months until at least 2020. When we consider the advent of decentralised emission-free renewable energy, we can expect tCO2/GH, and possibly even $/kWh, to tend towards zero. The more agile and dynamic bitcoin companies can take advantage of these trends, but the sluggish, inert and over-encumbered incumbents simply cannot. As time goes on, Bitcoin only becomes more sustainable, while legacy systems continue to bloat year-on-year.
There are no negative social externalities as a result of Bitcoin proliferation, and any money laundering and shadow economy dealings that currently happen on the network will reduce drastically in proportion as adoption grows and regulations firm up on the on-and-off ramps into the Bitcoin economy. Rome wasn’t built in a day, and the crypto-currency space will take time to evolve to ensure that the issues faced and created by our legacy monetary systems do not continue to plague us for the next century and beyond. It has been demonstrated that institutional fraud is a problem systemic to humans, and not to monetary systems. However, transactional fraud is only a problem in legacy systems due to the infallibility of the fact that 2 + 2 will always equal 4.
Although this paper has shied away from all of the ideological and philosophical debates surrounding Bitcoin, what is clear is that the argument that Bitcoin is superior monetary system – from the benefits and protections it provides to merchants and consumers, to the relative lack of negative impact it has on our planet and humanity in general – is a strong one.
The world is currently crippled by several issues, and the human race faces several existential threats such as climate change, the global ageing population demographic crisis and wealth and income inequality. It is also unacceptable in 2014 to still have tens of millions of people forced into labour, and current monetary systems are somewhat responsible for several of the social ills brought about by corruption, money laundering and the black market.
For those who are willing to back their principles and morals with their money, Bitcoin provides the opportunity for socially, environmentally and economically conscious global citizens to choose to no longer participate in the fragile and rotten legacy monetary system, and voluntarily participate in the open and wondrous Bitcoin ecosystem. Due to the several benefits and significantly reduced burden on our planet and society, there is a certain feeling of inevitability about digital currencies, whether it be Bitcoin, or a future currency that proves to be even more sustainable and beneficial for humanity.
2nd Edition 30
Bibliography Ahlers, C., Martin, M., Ben Olsen, P. O. & Jr., M. S., 2010. How Green is Our Green? Sustainability Assessment of U.S. and Australian Currency, Vermont: University of Vermont.
Allen, K., 2013. Sterling to go plastic, Bank of England decides. [Online] Available at: http://www.theguardian.com/business/2013/dec/17/sterling-notes-go-plastic-bank-of-england [Accessed 9 April 2014].
Association of Certified Fraud Examiners, 2014. Report to the Nations on Occupational Fraud and Abuse, Austin, Texas: Association of Certified Fraud Examiners.
Barclays Commodities Research, 2013. Gold suffers its largest daily decline, where is the fundamental support?. [Online] Available at: http://www.ascentainternational.com/Early-Stage-Special-Situation-Resource-Fund/wp-content/uploads/2013/05/Barclays-Gold-Price-Fundamental-Support.pdf [Accessed 6 April 2014].
BBC News, 2009. Corruption costs $1.6tn, UN says. [Online] Available at: http://news.bbc.co.uk/2/hi/business/8350239.stm [Accessed 4 June 2014].
Bitcoin Wiki, 2014. Mining Hardware Comparison. [Online] Available at: https://en.bitcoin.it/wiki/Mining_hardware_comparison [Accessed 4 June 2014].
BitcoinTalk, 2014. List of Bitcoin Heists. [Online] Available at: https://bitcointalk.org/index.php?topic=576337#post_bitcoin_savings_and_trust [Accessed 14 June 2014].
BitcoinWisdom, 2014. Bitcoin Hashrate vs. Difficulty. [Online] Available at: https://bitcoinwisdom.com/bitcoin/difficulty [Accessed 4 June 2014].
Bitfury, 2014. Bitfury Products Page. [Online] Available at: http://www.bitfury.org/products/ [Accessed 2 July 2014].
BitMain, 2014. Antminer S3 Product Page. [Online] Available at: https://bitmaintech.com/productDetail.htm?pid=00020140704023505485N5SxDMkW0693 [Accessed 12 July 2014].
Calouro, E., 2014. GHash.IO Rleases Official Statement on 51% Hashing Power Threat. [Online] Available at: http://newsbtc.com/2014/01/09/ghash-io-releases-official-statement-51-hashing-power-threat/ [Accessed 14 July 2014].
Chamber of Mines of South Africa, 2012. Facts & Figures 2012, Johannesburg: Chamber of Mines of South Africa.
2nd Edition 31
Chinnammai, S., 2013. A Study on Currency and Coinage Circulation in India. International Journal of Trade, Economics and Finance, 4(February 2013), pp. 43-47.
CIA World Factbook, 2013. FIELD LISTING :: INFLATION RATE (CONSUMER PRICES). [Online] Available at: https://www.cia.gov/library/publications/the-world-factbook/fields/2092.html [Accessed 29 June 2014].
CoinNews, 2012. US Mint Circulating Coin Production: 1999-2012. [Online] Available at: http://www.coinnews.net/mints/us-circulating-coin-production-figures/ [Accessed 9 April 2014].
CoolClimate Network, 2014. Small Business Carbon Footprint Estimate. [Online] Available at: http://coolclimate.berkeley.edu/business-calculator [Accessed 4 June 2014].
Council on Foreign Relations, 2013. The Global Regime for Transnational Crime. [Online] Available at: http://www.cfr.org/transnational-crime/global-regime-transnational-crime/p28656 [Accessed 4 June 2014].
Engineering Toolbox, 2013. Common area per person in buildings. [Online] Available at: http://www.engineeringtoolbox.com/number-persons-buildings-d_118.html [Accessed 4 June 2014].
European Central Bank, 2007. Environmental impact of euro banknotes. [Online] Available at: http://www.ecb.europa.eu/euro/html/environment.en.html#security [Accessed 9 April 2014].
European Central Bank, 2014. Banknotes and Coins Circulation. [Online] Available at: https://www.ecb.europa.eu/stats/euro/circulation/html/index.en.html [Accessed 9 April 2014].
Farrell, M. J., 2009. Carbon Emissions From Base Metal Mine Sites. Mining Engineering, Issue April 2009, pp. 28 - 32.
Federal Reserve Bank of St. Louis, 2011. Bank's Cost to Income Ratio for World. [Online] Available at: http://research.stlouisfed.org/fred2/series/DDEI071WA156NWDB [Accessed 14 July 2014].
Forbes.com, 2014. Bitcoin's Mt. Gox Goes Offline, Loses $409M -- Recovery Steps and Taking Your Tax Losses. [Online] Available at: http://www.forbes.com/sites/cameronkeng/2014/02/25/bitcoins-mt-gox-shuts-down-loses-409200000-dollars-recovery-steps-and-taking-your-tax-losses/ [Accessed 16 June 2014].
Ghizoni, S. K., 1971. Nixon Ends Convertibility of U.S. Dollars to Gold and Announces Wage/Price Controls. [Online] Available at: http://www.federalreservehistory.org/Events/DetailView/33 [Accessed 9 April 2014].
2nd Edition 32
Griffin, J., 2013. Report: Shrink cost retailers more than $112B globally in 2012. [Online] Available at: http://www.securityinfowatch.com/article/11230550/global-retail-theft-barometer-examines-trends-in-global-retail-shrink [Accessed 17 June 2014].
Havoscope, 2014. Havoscope Black Market Rankings. [Online] Available at: http://www.havocscope.com/products/ranking/ [Accessed 4 June 2014].
Henderson, B., 1976. The Rule of Three and Four, s.l.: Boston Consulting Group.
Hewitt, M., 2008. Global Money Supply - 2008. [Online] Available at: http://www.gold-eagle.com/article/global-money-supply-2008-update [Accessed 9 April 2014].
Hewitt, M., 2008. Two Methods for Estimating the Price of Gold. [Online] Available at: http://dollardaze.org/blog/?post_id=00479&cat_id=20 [Accessed 6 April 2014].
Hruska, J., 2013. Intel’s former chief architect: Moore’s law will be dead within a decade. [Online] Available at: http://www.extremetech.com/computing/165331-intels-former-chief-architect-moores-law-will-be-dead-within-a-decade [Accessed 6 April 2014].
Indexmundi, 2013. World Demographics Profile. [Online] Available at: http://www.indexmundi.com/world/demographics_profile.html [Accessed 4 June 2014].
Jackson, R., 2010. What happens to old banknotes?. [Online] Available at: http://moneyweek.com/merryns-blog/what-happens-to-old-banknotes-00141/ [Accessed 4 June 2014].
Johnson, P., 2005. A Glossary of Political Economy Terms. [Online] Available at: http://www.auburn.edu/~johnspm/gloss/money_stock [Accessed 4 June 2014].
Kahler, R., 2006. Fatalities in the West Australian Mining Industry, Perth: The Chamber of Minerals and Energy of Western Australia.
Keynes, J. M., Johnson, E. & Moggridge, D., 1978. The Classification of Money. In: The Collected Writings of John Meynard Keynes. London: Royal Economic Society, pp. 3-19.
Koomey, J. et al., 2010. Implications of Historical Trends in the Electrical Efficiency of Computing. IEEE - Annals of the History of Computing, 33(3), pp. 46-54.
Landauer, R., 1961. Irreversibility and heat generation in the computing process. IBM Journal of Research and Development, Volume 5, pp. 183-191.
LexisNexis, 2013. 2013 LexisNexis True Cost of Fraud Study, s.l.: LexisNexis.
2nd Edition 33

London Metal Exchange, 2014. Metals. [Online] Available at: http://www.lme.com/metals/ [Accessed 9 April 2014].
McKinsey & Company, 2012. The Triple Transformation - Achieving a Sustainable Business Model. 2nd McKinsey Annual Review on the Banking Industry. [Online] Available at: http://solutions.mckinsey.com/globalbankingpools/cms/_SiteNote/WWW/GetFile.aspx?uri=:/globalbankingpools/cms/gpp-content/en-us/article/Files/MainBloc/2nd%20McK%20annual%20review%20on%20the%20banking%20industry%20-%20October%202012_07508fca-1642-4b1a-ae26- [Accessed 4 June 2014].
Miedema, D. & Bartz, D., 2014. Senators blast watchdogs over widespread gold investment fraud. [Online] Available at: http://www.reuters.com/article/2014/04/30/us-usa-metals-elderly-idUSBREA3T0IA20140430 [Accessed 17 June 2014].
Minerals Council of Australia, 2014. Life cycle of a mine. [Online] Available at: http://www.minerals.org.au/resources/gold/life_cycle_of_a_mine [Accessed 1 April 2104].
Moomaw, W. et al., 2011. Annex II: Methodology. In IPCC: Special Report on Renewable Energy Sources and Climate Change Mitigation, Geneva: IPCC.
MRI, 2014. Computer Recycling and E-Waste Solutions. [Online] Available at: http://www.mri.com.au/ [Accessed 4 June 2014].
Mudd, G., 2013. Australia's Mining Legacies. [Online] Available at: http://arena.org.au/australias-mining-legacies-by-gavin-m-mudd/ [Accessed 6 April 2014].
Mudd, G. M., 2007. Resource Consumption Intensity and the Sustainability of Gold Mining. Auckland, 2nd Internation Conference on Sustainability Engineering & Science.
Naidu-Ghelani, R., 2013. Gold Crashes Through Production Cost Levels. [Online] Available at: http://www.cnbc.com/id/100851209 [Accessed 6 April 2014].
News, B., 2014. China Finds $15 Billion of Loans Backed by Fake Gold Trades. [Online] Available at: http://www.bloomberg.com/news/2014-06-26/china-finds-15b-of-loans-backed-by-falsified-gold-trades.html [Accessed 29 June 2014].
Norgate, T. & Haque, N., 2012. Using life cycle assessment to evaluate some environmental impacts of gold production. Journal of Cleaner Production, 29-30(July), pp. 29-30, 53-63.
2nd Edition 34

Number Sleuth, 2011. All the World's Gold. [Online] Available at: http://www.numbersleuth.org/worlds-gold/ [Accessed 6 April 2014].
Oxfam, 2004. Dirty Metals: Mining, Communities and the Environment. [Online] Available at: www.nodirtygold.com [Accessed 6 April 2014].
PE Americas; Tryskele, 2011. Life Cycle Assessment of Canada’s Polymer Bank Notes and Cotton-Paper Bank Notes, Ottawa: Bank of Canada.
Raise Hope for Congo, 2014. Raise Hope for Congo. [Online] Available at: http://www.raisehopeforcongo.org/ [Accessed 7 April 2014].
Reilly, G., 2013. Ireland spends €11.8 million to mint coins worth… €7.1 million. [Online] Available at: http://www.thejournal.ie/ireland-costs-minting-1c-coins-929949-May2013/ [Accessed 9 April 2014].
Ro, S., 2012. BRE-X: Inside the $6 Billion Gold Fraud That Shocked The Mining Industry. [Online] Available at: http://www.businessinsider.com.au/bre-x-6-billion-gold-fraud-indonesia-2012-7#michael-de-guzmana-filipino-geologist-was-struggling-to-get-recognition-from-his-employer-so-he-devised-a-plan-to-get-rich-1 [Accessed 17 June 2014].
Roth, K. W., Goldstein, F. & Kleinman, J., 2002. Energy Consumption and Telecommunications Equipment in Commercial Buildings - Volume 1: Energy Consumption Baseline. [Online] Available at: http://www.biblioite.ethz.ch/downloads/Roth_ADL_1.pdf [Accessed 4 June 2014].
Royal Australian Mint, 2014. One Cent Coin. [Online] Available at: http://www.ramint.gov.au/designs/ram-designs/1c.cfm [Accessed 9 April 2014].
Rudarakanchana, N., 2014. Gold Prices Below $1,200 Could Mean Production Cutbacks: World Gold Council. [Online] Available at: http://www.ibtimes.com/gold-prices-below-1200-could-mean-production-cutbacks-world-gold-council-1553008 [Accessed 6 April 2014].
Sheth, J. N. & Sisodia, R. S., 2002. Competitive Markets and The Rule of Three, London, Ontario, Canada: Ivey School of Business.
Smith, D., 2011. Black Money: The Business of Money Laundering. [Online] Available at: http://www.economywatch.com/economy-business-and-finance-news/black-money-the-business-of-money-laundering.08-06.html [Accessed 4 June 2014].
Smithers Pira, 2013. The Future of Global Security Printing Markets to 2018, Shawbury, UK: Smithers Pira.
2nd Edition 35

Sovacool, B. K., 2008. Valuing the greenhouse gas emissions from nuclear power: A critical survey. Economic Policy, Volume 36, p. 2950.
Spondoolies, 2014. Spondoolies Yukon SP30 September Batch 1. [Online] Available at: http://www.spondoolies-tech.com/products/sp30-yukon-september-batch-1 [Accessed 2014 July 2014].
Statistics Japan, 2014. Crrency and Flow of Funds. [Online] Available at: http://www.stat.go.jp/english/data/nenkan/1431-04.htm [Accessed 9 April 2014].
The Economist, 2007. The Price of Virtue. [Online] Available at: http://www.economist.com/node/9302727 [Accessed 8 April 2014].
Thompson Reuters GFMS, 2011. GFMS Metals Database, Switzerland: Thompson Reuters GFMS.
U.S. Federal Reserve, 2014. How long is the life span of U.S. paper money?. [Online] Available at: http://www.federalreserve.gov/faqs/how-long-is-the-life-span-of-us-paper-money.htm [Accessed 4 June 2014].
U.S. Federal Reserve, 2014. How much does it cost to produce currency and coin?. [Online] Available at: http://www.federalreserve.gov/faqs/currency_12771.htm [Accessed 9 April 2014].
U.S. Geological Survey, 2014. Mineral Commodities Summary - Gold. [Online] Available at: http://minerals.usgs.gov/minerals/pubs/commodity/gold/mcs-2014-gold.pdf [Accessed 9 April 2014].
U.S. Mint, 2013. 2013 Annual Report, Philadelphia: U.S. Mint.
U.S. Mint, 2014. Circulating Coins Production Figures. [Online] Available at: http://www.usmint.gov/about_the_mint/index.cfm?action=productionFigures&allCoinsYear=2013&reportSelected#starthere&CFID=28962110&CFTOKEN=37351615 [Accessed 9 April 2014].
U.S. Mint, 2014. Coin Specifications. [Online] Available at: http://www.usmint.gov/about_the_mint/?action=coin_specifications [Accessed 9 April 2014].
U.S. Mint, 2014. FY 2014 President's Budget. [Online] Available at: http://www.treasury.gov/about/budget-performance/CJ14/20.%20Mint%202014%2004%20April%20FINAL%20ok.pdf [Accessed 9 April 2014].
U.S. Mint, 2014. What is the life span of a coin?. [Online] Available at: http://www.usmint.gov/faqs/circulating_coins/#anchor6 [Accessed 4 June 2014].
2nd Edition 36

UN Office on Drugs and Crime, 2008. Money-Laundering and Globalization, New York: United Nations.
United Nations, 1948. Proceedings and Documents of the United Nations Monetary and Financial Conference, Bretton Woods, New Hampshire, July 1-22, 1944. Washington DC, United States Government Printing Office.
United States Mine Rescue Association, 2010. MNM Mine Disasters in the United States - By Mineral (Gold). [Online] Available at: http://www.usmra.com/Mine_Disasters/search_mnm_mineral.asp?MINE_TYPE=Gold&x=7&y=16 [Accessed 7 April 2014].
US Department of Energy, 2013. Levelized Cost of New Generation Resources in the Annual Energy Outlook, Washington DC: US DoE.
US EPA, 2012. eCycling. [Online] Available at: http://www.epa.gov/epawaste/conserve/materials/ecycling/faq.htm [Accessed 8 April 2014].
Wagner, H., 1988. Discussion: Safety in South African Mines. Journal of the South African Institute of Mining and Metallurgy, Issue July 1988, pp. 233-243.
World Bank, 2014. World Development Indicators: Financial Access. [Online] Available at: http://wdi.worldbank.org/table/5.5 [Accessed 4 June 2014].
World Gold Council, 2012. The strategic case for gold as an asset class, s.l.: World Gold Council.
World Resources Institute, 2009. World Greenhouse Emissions 2005. [Online] Available at: http://pdf.wri.org/working_papers/world_greenhouse_gas_emissions_2005.pdf [Accessed 3 June 2014].
Zielinski, M., 2014. US Mint Cost To Make Penny and Nickel Declines in FY 2013. [Online] Available at: http://news.coinupdate.com/us-mint-cost-to-make-cent-and-nickel-declines-3113/ [Accessed 9 April 2014].
2nd Edition 37
![The McCook Tribune. (McCook, NE) 1899-09-29 [p ].M'COOK TRIBUNE K. M. ICIMMVI.T., J'ubllnlior-.McCOOK., NEBRASKA BRIEF TEirCRAMS. San Frnnclfco boilermakers arc on- n strike. The Peruvian](https://img.pdfslide.us/doc/110x75/5e6e6b4be9005038d2378bb0/the-mccook-tribune-mccook-ne-1899-09-29-p-mcook-tribune-k-m-icimmvit.jpg)


![The McCook Tribune. (McCook, NE) 1901-03-01 [p ].zaess-SSsM'COOK TRIBUNE. 7. M. KIBI3IKIX, PnbllBher-.McCOOK., - - NEBEA8KA BRIEf TELEGRAMS. Florence Carlyle, a grandneice of Thomas](https://img.pdfslide.us/doc/110x75/60e48b043072420843787d65/the-mccook-tribune-mccook-ne-1901-03-01-p-zaess-sssmcook-tribune-7-m.jpg)


![The McCook Tribune. (McCook, NE) 1886-06-24 [p ]](https://img.pdfslide.us/doc/110x75/615a3b22ef7d0d46562f01c7/the-mccook-tribune-mccook-ne-1886-06-24-p-.jpg)


![The McCook Tribune. (McCook, NE) 1887-02-17 [p ].Colby moved thai-t e *p](https://img.pdfslide.us/doc/110x75/5ea0d01c24b92a0eb360ad2e/-the-mccook-tribune-mccook-ne-1887-02-17-p-colby-moved-thai-t-e-p.jpg)