Embed Size (px)
Citation preview

2015 Financial
Guidance
Conference Call
January 8, 2015
1
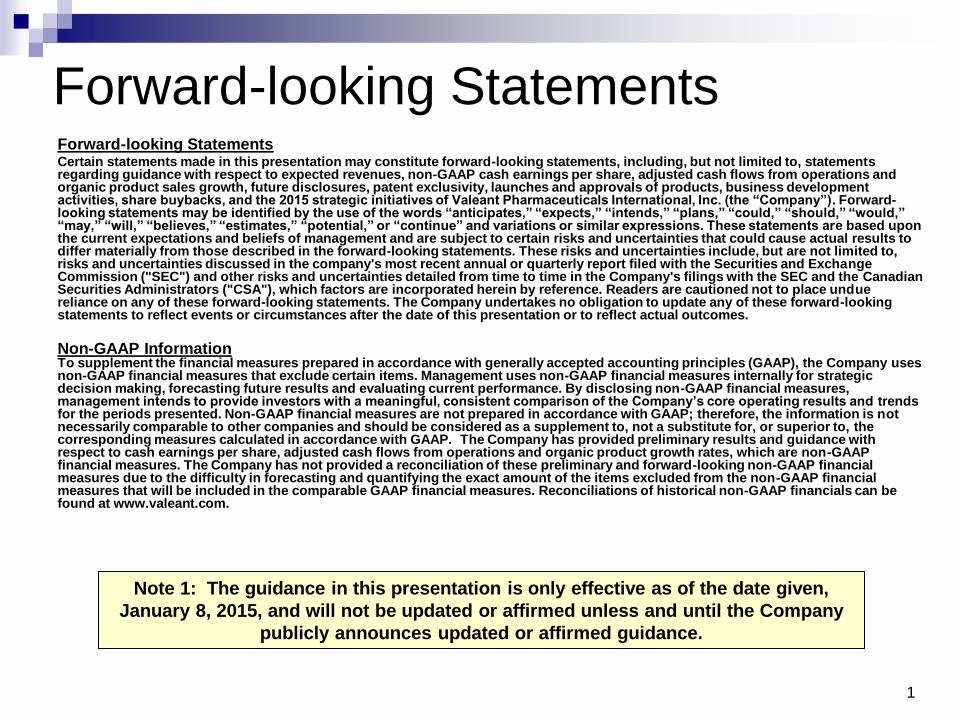
Forward-looking Statements Forward-looking Statements Certain statements made in this presentation may constitute forward-looking statements, including, but not limited to, statements regarding guidance with respect to expected revenues, non-GAAP cash earnings per share, adjusted cash flows from operations and organic product sales growth, future disclosures, patent exclusivity, launches and approvals of products, business development activities, share buybacks, and the 2015 strategic initiatives of Valeant Pharmaceuticals International, Inc. (the “Company”). Forward-looking statements may be identified by the use of the words “anticipates,” “expects,” “intends,” “plans,” “could,” “should,” “would,” “may,” “will,” “believes,” “estimates,” “potential,” or “continue” and variations or similar expressions. These statements are based upon the current expectations and beliefs of management and are subject to certain risks and uncertainties that could cause actual results to differ materially from those described in the forward-looking statements. These risks and uncertainties include, but are not limited to, risks and uncertainties discussed in the company's most recent annual or quarterly report filed with the Securities and Exchange Commission ("SEC") and other risks and uncertainties detailed from time to time in the Company's filings with the SEC and the Canadian Securities Administrators ("CSA"), which factors are incorporated herein by reference. Readers are cautioned not to place undue reliance on any of these forward-looking statements. The Company undertakes no obligation to update any of these forward-looking statements to reflect events or circumstances after the date of this presentation or to reflect actual outcomes.
Non-GAAP Information To supplement the financial measures prepared in accordance with generally accepted accounting principles (GAAP), the Company uses non-GAAP financial measures that exclude certain items. Management uses non-GAAP financial measures internally for strategic decision making, forecasting future results and evaluating current performance. By disclosing non-GAAP financial measures, management intends to provide investors with a meaningful, consistent comparison of the Company’s core operating results and trends for the periods presented. Non-GAAP financial measures are not prepared in accordance with GAAP; therefore, the information is not necessarily comparable to other companies and should be considered as a supplement to, not a substitute for, or superior to, the corresponding measures calculated in accordance with GAAP. The Company has provided preliminary results and guidance with respect to cash earnings per share, adjusted cash flows from operations and organic product growth rates, which are non-GAAP financial measures. The Company has not provided a reconciliation of these preliminary and forward-looking non-GAAP financial measures due to the difficulty in forecasting and quantifying the exact amount of the items excluded from the non-GAAP financial measures that will be included in the comparable GAAP financial measures. Reconciliations of historical non-GAAP financials can be found at www.valeant.com.
Note 1: The guidance in this presentation is only effective as of the date given,
January 8, 2015, and will not be updated or affirmed unless and until the Company
publicly announces updated or affirmed guidance.

2
Agenda
2014 Review – J. Michael Pearson
2015 Financial Guidance – Howard Schiller
New 2015 Strategic Initiatives – J. Michael Pearson
3
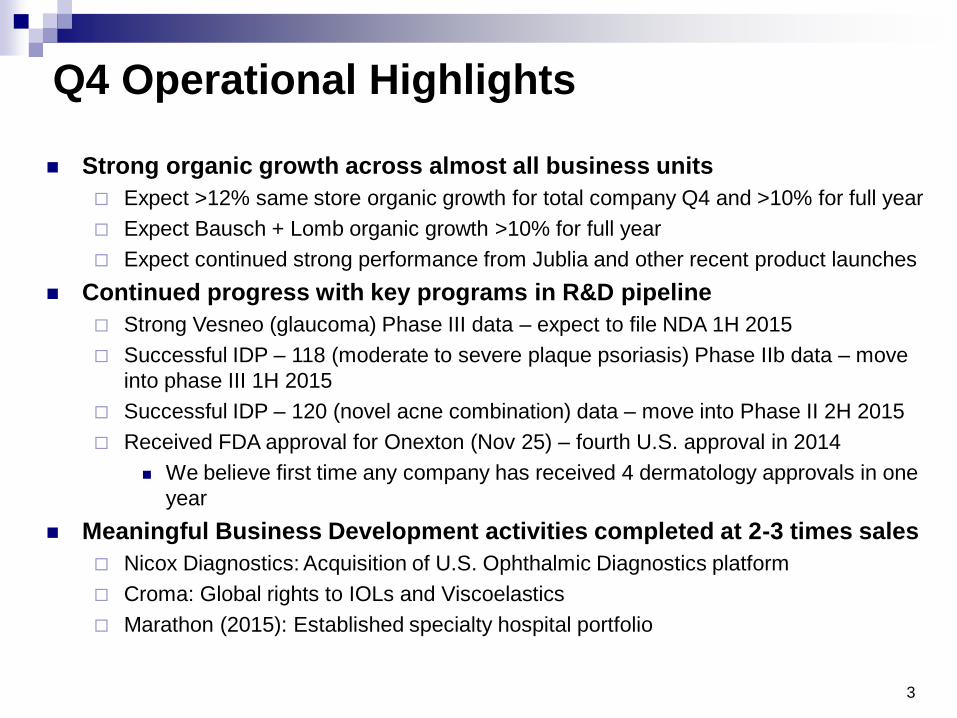
Q4 Operational Highlights
Strong organic growth across almost all business units
Expect >12% same store organic growth for total company Q4 and >10% for full year
Expect Bausch + Lomb organic growth >10% for full year
Expect continued strong performance from Jublia and other recent product launches
Continued progress with key programs in R&D pipeline
Strong Vesneo (glaucoma) Phase III data – expect to file NDA 1H 2015
Successful IDP – 118 (moderate to severe plaque psoriasis) Phase IIb data – move
into phase III 1H 2015
Successful IDP – 120 (novel acne combination) data – move into Phase II 2H 2015
Received FDA approval for Onexton (Nov 25) – fourth U.S. approval in 2014
We believe first time any company has received 4 dermatology approvals in one
year
Meaningful Business Development activities completed at 2-3 times sales
Nicox Diagnostics: Acquisition of U.S. Ophthalmic Diagnostics platform
Croma: Global rights to IOLs and Viscoelastics
Marathon (2015): Established specialty hospital portfolio
4
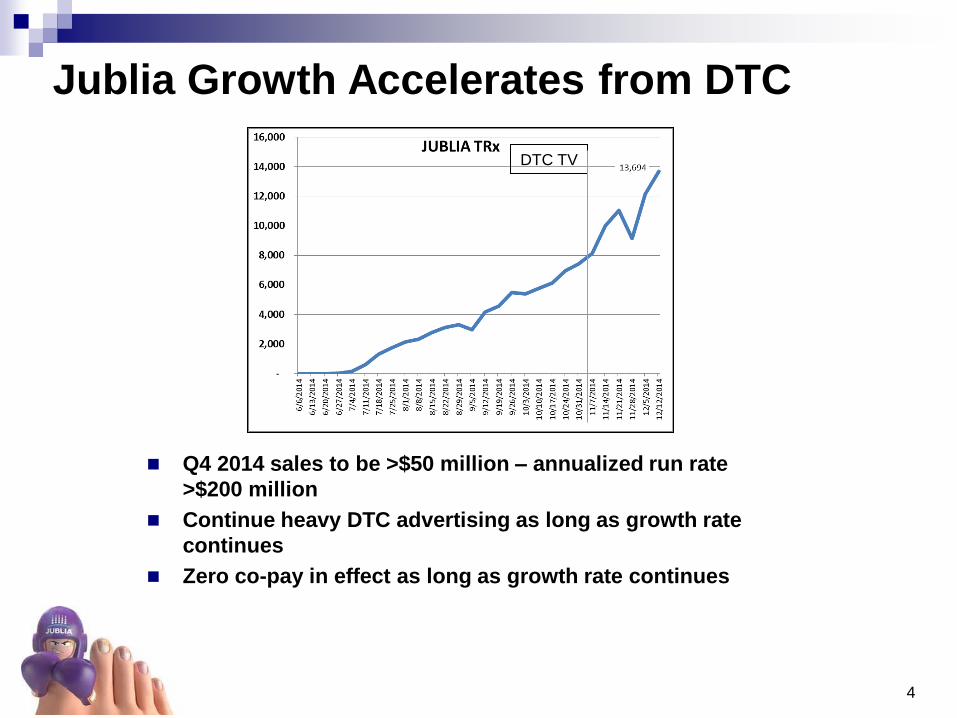
Jublia Growth Accelerates from DTC
Q4 2014 sales to be >$50 million – annualized run rate
>$200 million
Continue heavy DTC advertising as long as growth rate
continues
Zero co-pay in effect as long as growth rate continues
DTC TV
5
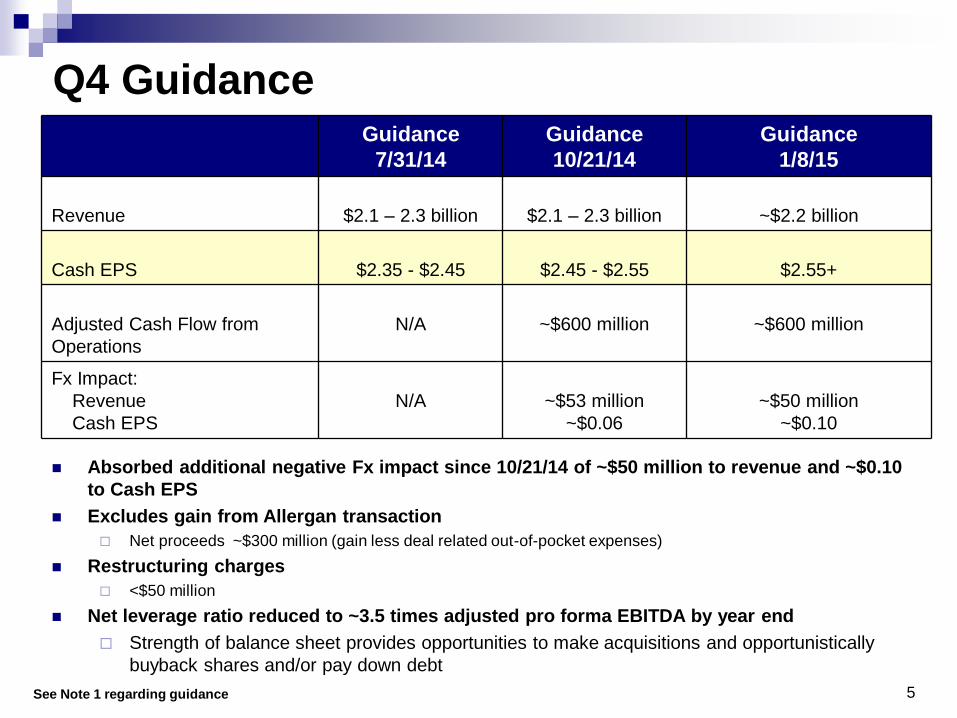
Q4 Guidance
See Note 1 regarding guidance
Guidance
7/31/14
Guidance
10/21/14
Guidance
1/8/15
Revenue
$2.1 – 2.3 billion
$2.1 – 2.3 billion
~$2.2 billion
Cash EPS
$2.35 - $2.45
$2.45 - $2.55
$2.55+
Adjusted Cash Flow from
Operations
N/A
~$600 million
~$600 million
Fx Impact:
Revenue
Cash EPS
N/A
~$53 million
~$0.06
~$50 million
~$0.10
Absorbed additional negative Fx impact since 10/21/14 of ~$50 million to revenue and ~$0.10
to Cash EPS
Excludes gain from Allergan transaction
Net proceeds ~$300 million (gain less deal related out-of-pocket expenses)
Restructuring charges
<$50 million
Net leverage ratio reduced to ~3.5 times adjusted pro forma EBITDA by year end
Strength of balance sheet provides opportunities to make acquisitions and opportunistically
buyback shares and/or pay down debt

6
Agenda
2014 Review – J. Michael Pearson
2015 Financial Guidance – Howard Schiller
New 2015 Strategic Initiatives – J. Michael Pearson
7
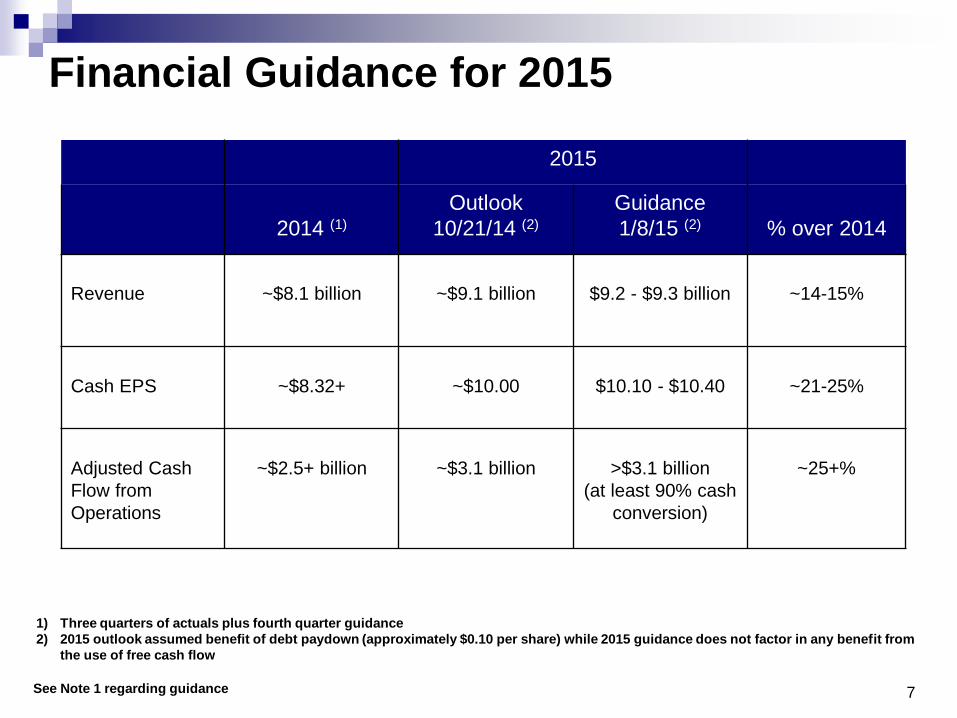
Financial Guidance for 2015
See Note 1 regarding guidance
2015
2014 (1)
Outlook
10/21/14 (2)
Guidance
1/8/15 (2)
% over 2014
Revenue
~$8.1 billion
~$9.1 billion
$9.2 - $9.3 billion
~14-15%
Cash EPS
~$8.32+
~$10.00
$10.10 - $10.40
~21-25%
Adjusted Cash
Flow from
Operations
~$2.5+ billion
~$3.1 billion
>$3.1 billion
(at least 90% cash
conversion)
~25+%
1) Three quarters of actuals plus fourth quarter guidance
2) 2015 outlook assumed benefit of debt paydown (approximately $0.10 per share) while 2015 guidance does not factor in any benefit from
the use of free cash flow
8
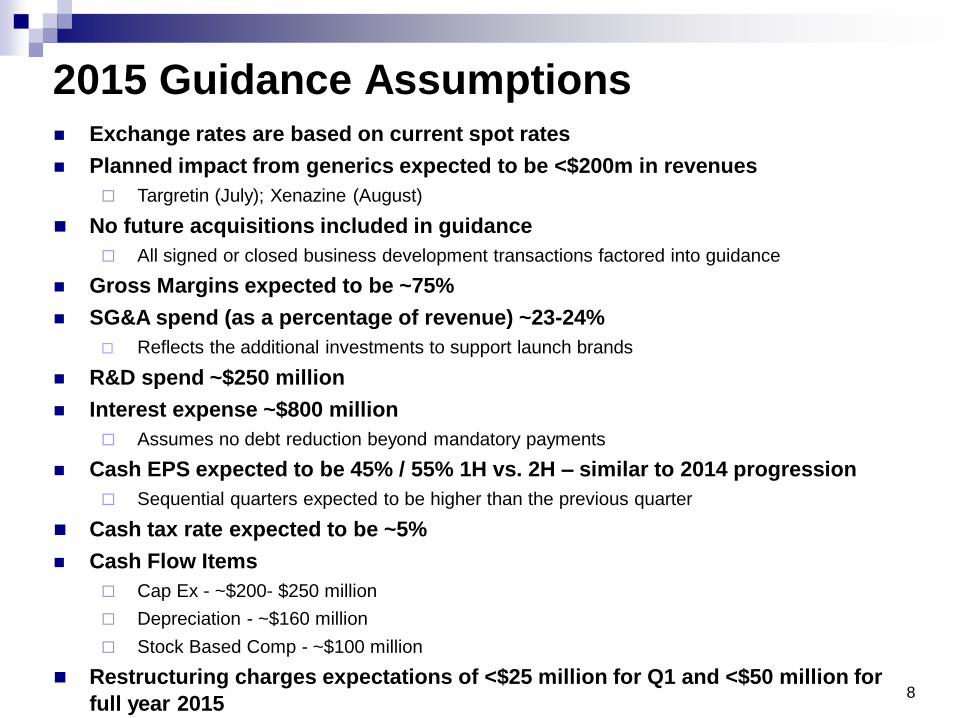
2015 Guidance Assumptions Exchange rates are based on current spot rates
Planned impact from generics expected to be <$200m in revenues
Targretin (July); Xenazine (August)
No future acquisitions included in guidance
All signed or closed business development transactions factored into guidance
Gross Margins expected to be ~75%
SG&A spend (as a percentage of revenue) ~23-24%
Reflects the additional investments to support launch brands
R&D spend ~$250 million
Interest expense ~$800 million
Assumes no debt reduction beyond mandatory payments
Cash EPS expected to be 45% / 55% 1H vs. 2H – similar to 2014 progression
Sequential quarters expected to be higher than the previous quarter
Cash tax rate expected to be ~5%
Cash Flow Items
Cap Ex - ~$200- $250 million
Depreciation - ~$160 million
Stock Based Comp - ~$100 million
Restructuring charges expectations of <$25 million for Q1 and <$50 million for
full year 2015
9
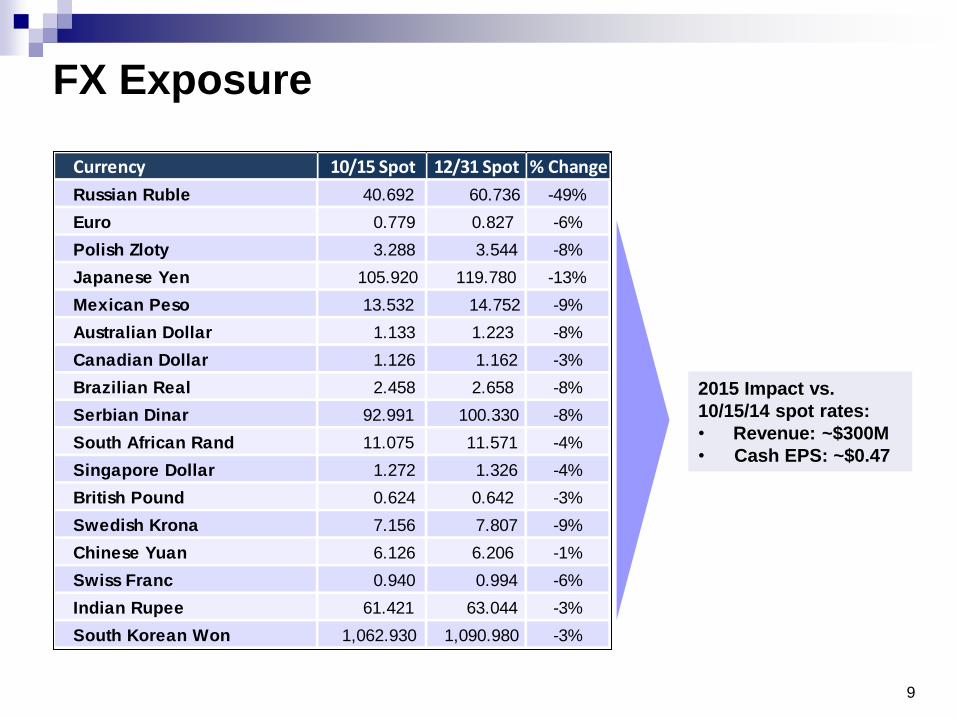
FX Exposure
2015 Impact vs.
10/15/14 spot rates:
• Revenue: ~$300M
• Cash EPS: ~$0.47
Currency 10/15 Spot 12/31 Spot % Change
Russian Ruble 40.692 60.736 -49%
Euro 0.779 0.827 -6%
Polish Zloty 3.288 3.544 -8%
Japanese Yen 105.920 119.780 -13%
Mexican Peso 13.532 14.752 -9%
Australian Dollar 1.133 1.223 -8%
Canadian Dollar 1.126 1.162 -3%
Brazilian Real 2.458 2.658 -8%
Serbian Dinar 92.991 100.330 -8%
South African Rand 11.075 11.571 -4%
Singapore Dollar 1.272 1.326 -4%
British Pound 0.624 0.642 -3%
Swedish Krona 7.156 7.807 -9%
Chinese Yuan 6.126 6.206 -1%
Swiss Franc 0.940 0.994 -6%
Indian Rupee 61.421 63.044 -3%
South Korean Won 1,062.930 1,090.980 -3%
10
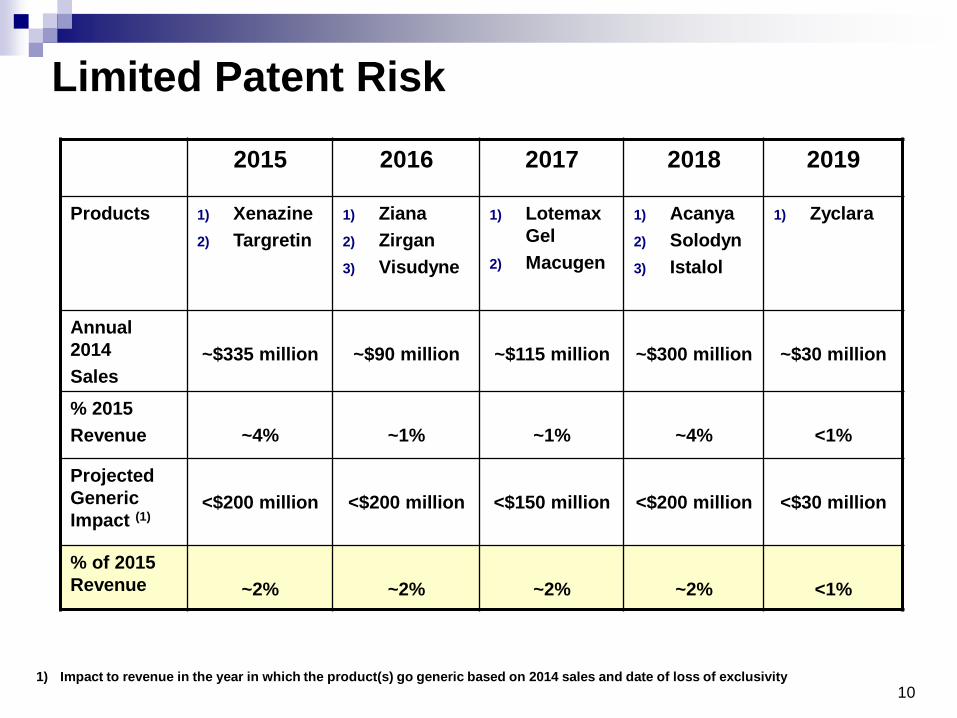
Limited Patent Risk
2015 2016 2017 2018 2019
Products 1) Xenazine
2) Targretin
1) Ziana
2) Zirgan
3) Visudyne
1) Lotemax
Gel
2) Macugen
1) Acanya
2) Solodyn
3) Istalol
1) Zyclara
Annual
2014
Sales
~$335 million
~$90 million
~$115 million
~$300 million
~$30 million
% 2015
Revenue
~4%
~1%
~1%
~4%
<1%
Projected
Generic
Impact (1)
<$200 million
<$200 million
<$150 million
<$200 million
<$30 million
% of 2015
Revenue
~2%
~2%
~2%
~2%
<1%
1) Impact to revenue in the year in which the product(s) go generic based on 2014 sales and date of loss of exclusivity
11
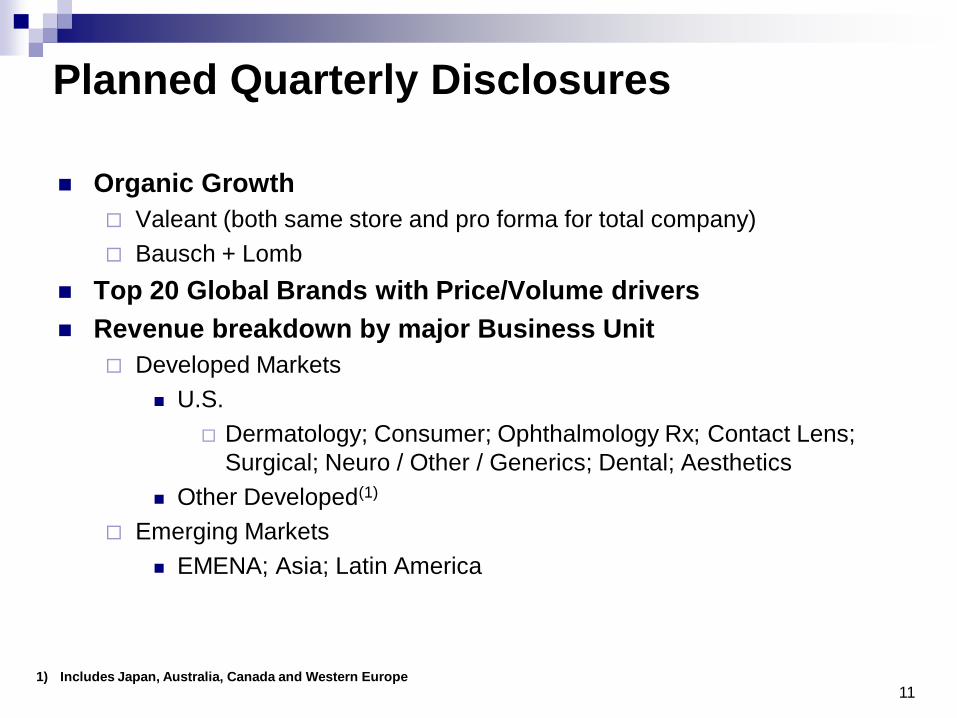
Planned Quarterly Disclosures
Organic Growth
Valeant (both same store and pro forma for total company)
Bausch + Lomb
Top 20 Global Brands with Price/Volume drivers
Revenue breakdown by major Business Unit
Developed Markets
U.S.
Dermatology; Consumer; Ophthalmology Rx; Contact Lens;
Surgical; Neuro / Other / Generics; Dental; Aesthetics
Other Developed(1)
Emerging Markets
EMENA; Asia; Latin America
1) Includes Japan, Australia, Canada and Western Europe

12
Agenda
2014 Review – J. Michael Pearson
2015 Financial Guidance – Howard Schiller
New 2015 Strategic Initiatives – J. Michael Pearson
13
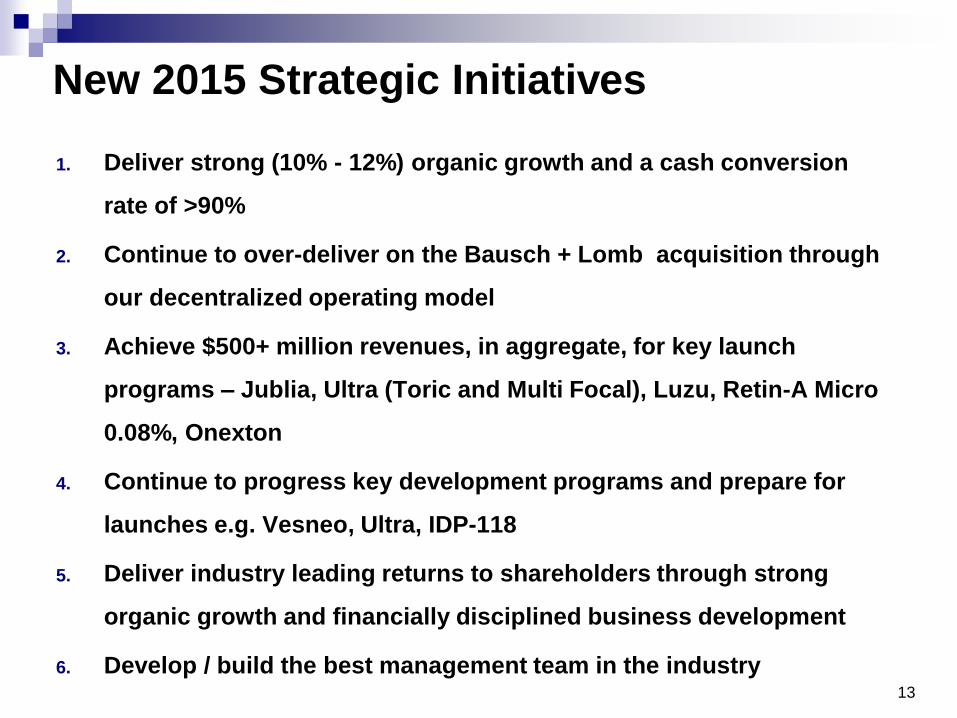
New 2015 Strategic Initiatives
1. Deliver strong (10% - 12%) organic growth and a cash conversion
rate of >90%
2. Continue to over-deliver on the Bausch + Lomb acquisition through
our decentralized operating model
3. Achieve $500+ million revenues, in aggregate, for key launch
programs – Jublia, Ultra (Toric and Multi Focal), Luzu, Retin-A Micro
0.08%, Onexton
4. Continue to progress key development programs and prepare for
launches e.g. Vesneo, Ultra, IDP-118
5. Deliver industry leading returns to shareholders through strong
organic growth and financially disciplined business development
6. Develop / build the best management team in the industry
14
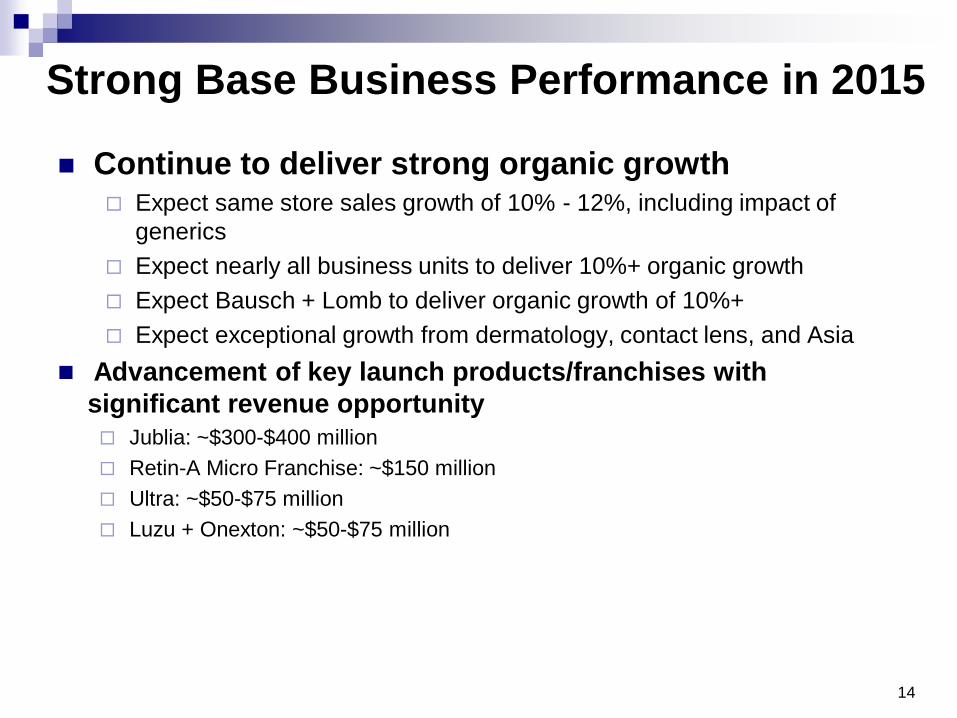
Strong Base Business Performance in 2015
Continue to deliver strong organic growth Expect same store sales growth of 10% - 12%, including impact of
generics
Expect nearly all business units to deliver 10%+ organic growth
Expect Bausch + Lomb to deliver organic growth of 10%+
Expect exceptional growth from dermatology, contact lens, and Asia
Advancement of key launch products/franchises with
significant revenue opportunity
Jublia: ~$300-$400 million
Retin-A Micro Franchise: ~$150 million
Ultra: ~$50-$75 million
Luzu + Onexton: ~$50-$75 million
15
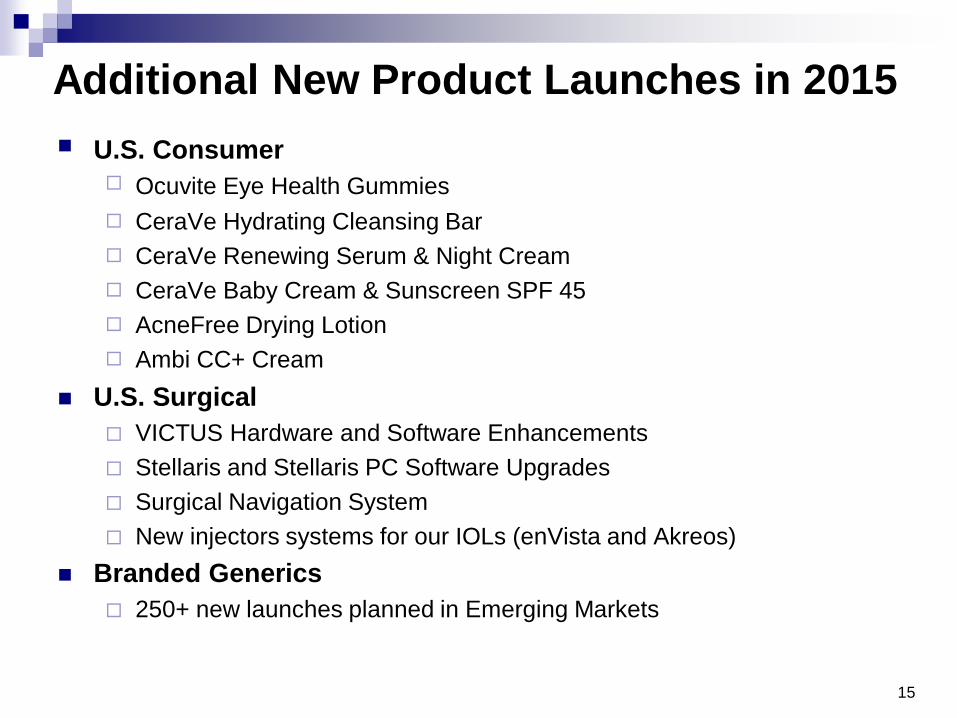
Additional New Product Launches in 2015
U.S. Consumer Ocuvite Eye Health Gummies
CeraVe Hydrating Cleansing Bar
CeraVe Renewing Serum & Night Cream
CeraVe Baby Cream & Sunscreen SPF 45
AcneFree Drying Lotion
Ambi CC+ Cream
U.S. Surgical
VICTUS Hardware and Software Enhancements
Stellaris and Stellaris PC Software Upgrades
Surgical Navigation System
New injectors systems for our IOLs (enVista and Akreos)
Branded Generics
250+ new launches planned in Emerging Markets
16
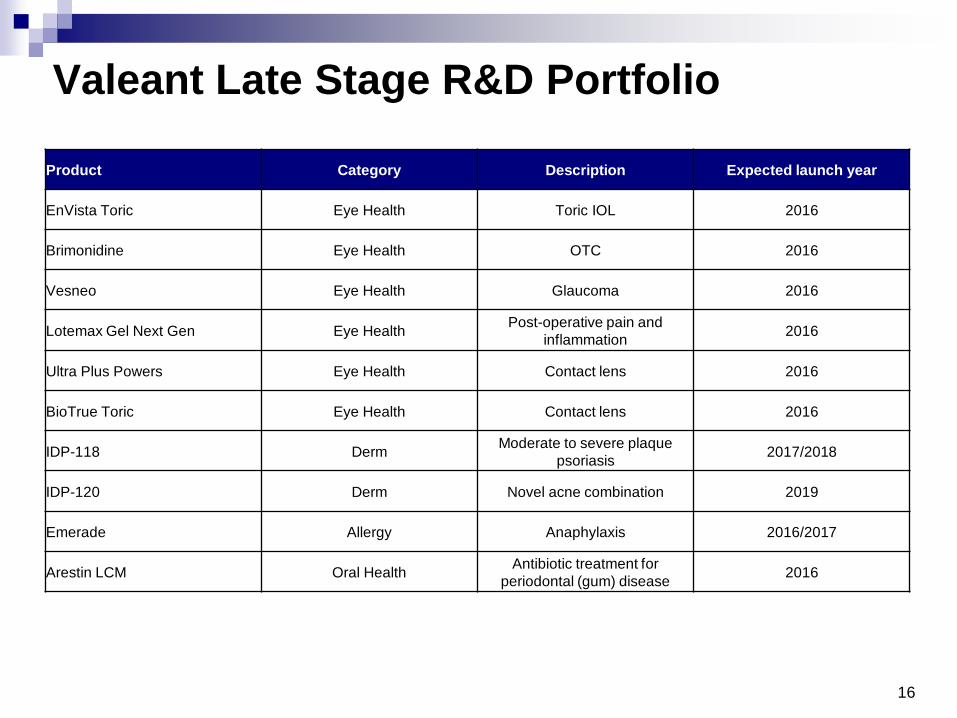
Valeant Late Stage R&D Portfolio
Product Category Description Expected launch year
EnVista Toric Eye Health Toric IOL 2016
Brimonidine Eye Health OTC 2016
Vesneo Eye Health Glaucoma 2016
Lotemax Gel Next Gen Eye Health Post-operative pain and
inflammation 2016
Ultra Plus Powers Eye Health Contact lens 2016
BioTrue Toric Eye Health Contact lens 2016
IDP-118 Derm Moderate to severe plaque
psoriasis 2017/2018
IDP-120 Derm Novel acne combination 2019
Emerade Allergy Anaphylaxis 2016/2017
Arestin LCM Oral Health Antibiotic treatment for
periodontal (gum) disease 2016

17
Key R&D milestones for 2015
Product Category Action
EnVista Toric Eye Health File PMA 1H 2015
Brimonidine (OTC) Eye Health File NDA 1H 2015
Vesneo (glaucoma) Eye Health File NDA 1H 2015
Lotemax Gel Next Gen Eye Health File NDA 2H 2015
Ultra Multi Focal Eye Health File PMA 1H 2015
Ultra Toric Eye Health File PMA 2H 2015
BioTrue Toric Eye Health File PMA 2H 2015
IDP-118 (moderate to severe plaque
psoriasis) Derm Initiate Phase III 1H 2015
IDP – 120 (novel acne combination ) Derm Initiate Phase II 2H 2015
Arestin LCM Oral Health File NDA 2H 2015
18
Use Balance Sheet to Maximize
Shareholder Value
Leverage at ~3.5 times adjusted pro forma EBITDA creates
substantial Balance Sheet capacity
Business Development will continue to be the priority
Developed Markets: Focus on building out existing platforms, adding new
platforms in fast growing markets, or acquiring tail products with extremely high
IRR’s and/or fast payback periods
Emerging Markets: Focus on Branded Generics and OTC’s and look to build out
platforms in Asia, Middle East and Latin America
Expect steady flow of small/medium sized deals
Timing of large transactions difficult to predict
Business Development criteria remain the same
Target 20% IRR’s at local statutory tax rates
Require 6 years or less payback period
Opportunistically repurchase shares and/or debt
19
2015 - Validation of Valeant’s Business Model
Robust organic growth profile
Double-digit organic growth expected in 2014, 2015 and beyond
Geographical and product diversification creates lower-risk profile
Durable product portfolio limits patent expiry exposure
Rich pipeline of low-risk R&D programs
Internal development – e.g. IDP-118, IDP-120, Onexton
Acquisitions – e.g. Vesneo, Brimonidine, Ultra
Product acquisitions/licenses – e.g. Emerade, Croma
Strong cash flows and balance sheet
Operating cash flows of over $3 billion expected in 2015
Absent large transactions, restructuring charges trending to zero
Convergence of GAAP to non-GAAP cash flows
Enhanced capacity to continue acquisition activity as well as opportunistically
paydown debt and/or buy back shares
Disciplined approach to business development
Continue to be disciplined with capital deployment to generate above average
returns for shareholders

2015 Financial
Guidance
Conference Call
January 8, 2015