Embed Size (px)
Citation preview

Growth Team Membership™:European Union 2010 Market Research and
Competitive Intelligence PrioritiesSurvey Results
April 2010

2Growth Team Membership™ Research.
What is Growth Team Membership™?
If you have any questions or comments, please contact us at [email protected]
Growth Team Membership™ (GTM) is an annual subscription program that offers research, events and services designed to increase the effectiveness, productivity, and impact of executives in the functions that support the CEO’s growth strategy.

3Growth Team Membership™ Research.
Table of Contents
Page
Section 1: Survey Purpose and Respondents 4
Section 2: External Factors Shaping Marketing Strategy 5
Section 3: Key Market Research Challenges 8
Section 4: Market Research Effectiveness and Expenditures 11
Section 5: Key Competitive Intelligence Challenges 21
Section 6: Competitive Intelligence Effectiveness and Expenditures 24
Section 7: Respondent Demographics 34
The content of these pages are © 2010 Frost & Sullivan. All rights reserved.

4Growth Team Membership™ Research.
Survey Purpose and Respondents
There were 45 survey
respondents
Research ObjectiveTo understand the most pressing external and internal challenges shaping market research and competitive intelligence executives’ 2010 planning.
MethodologyWeb-based survey platform
Survey PopulationTarget respondents were Manager level and above market research and CI executives from companies throughout the European Union
Co-Sponsor

5Growth Team Membership™ Research.
External Factors Shaping Market Research and Competitive Intelligence Strategies

6Growth Team Membership™ Research.
Top Three External Factors
N = 38
32%
26%
19%
0% 25% 50%
Need for product/serviceinnovation and capabilities
Intensifying competition
Tapping into global marketopportunities
KEY TAKEAWAY: The top external factors reflect the pressure to find new growth in the current competitive environment.
Survey Question: Please indicate the three business environment factors that have the most impact on your 2010 market research and competitive intelligence plans.

7Growth Team Membership™ Research.
71%75%
100%
0%
50%
100%
Tapping into global marketopportunities
Need for product/service innovationand capabilities
Intensifying competition
External Factors Impact on Market Research and Competitive Intelligence
N = 38
Survey Question: Please indicate the impact that each of the following forces have on your 2010 market research and competitive intelligence plans.
KEY TAKEAWAY: For 2010, the two of the top three external factors impacting strategies are positive.
Negative ImpactPositive Impact

8Growth Team Membership™ Research.
Key Market Research Challenges

9Growth Team Membership™ Research.
Top Five Key Market Research Challenges
Challenge 1 Boosting the effectiveness of Market Research to communicate insights (20%)
Challenge 2 Enhancing Market Research’s capabilities to provide consultative support to internal clients/stakeholders (27%)
Challenge 3 Contributing to the company’s strategic priorities (21%)
N =15
Survey Question: Please indicate the top five challenges shaping your Market Research decision-making in 2010.
KEY TAKEAWAY: Market Research’s challenges reflect the need to enhance their ability to drive strategic decision making within their company.
Challenge 4 Ensuring internal clients/stakeholders integrate research insights into their decision making (21%)
Challenge 5 Maintaining a portal for centralised knowledge management (23%)

10Growth Team Membership™ Research.
Root Cause of Top Five Market Research Challenges
N = 27
Process50%
Process25%
Process33%
Process50%
Staff50%
Staff75%
Staff67%
Staff50%
Staff67%
Technology33%
0%
50%
100%
Boosting the effectivenessof Market Research tocommunicate insights
Enhancing MarketResearch’s capabilities to
provide consultativesupport to internal
clients/stakeholders
Contributing to thecompany’s strategic
priorities
Enhancing MarketResearch’s capabilities to
provide consultativesupport to internal
clients/stakeholders
Maintaining a portal forcentralized knowledge
management
Survey Question: For the top five challenges you selected above, please indicate whether the root cause of the challenge is staff, technology, or process.
KEY TAKEAWAY: Staff is cited as the primary root cause of Market Research’s top challenges.

11Growth Team Membership™ Research.
Market Research Effectivenessand Expenditures
12Growth Team Membership™ Research.
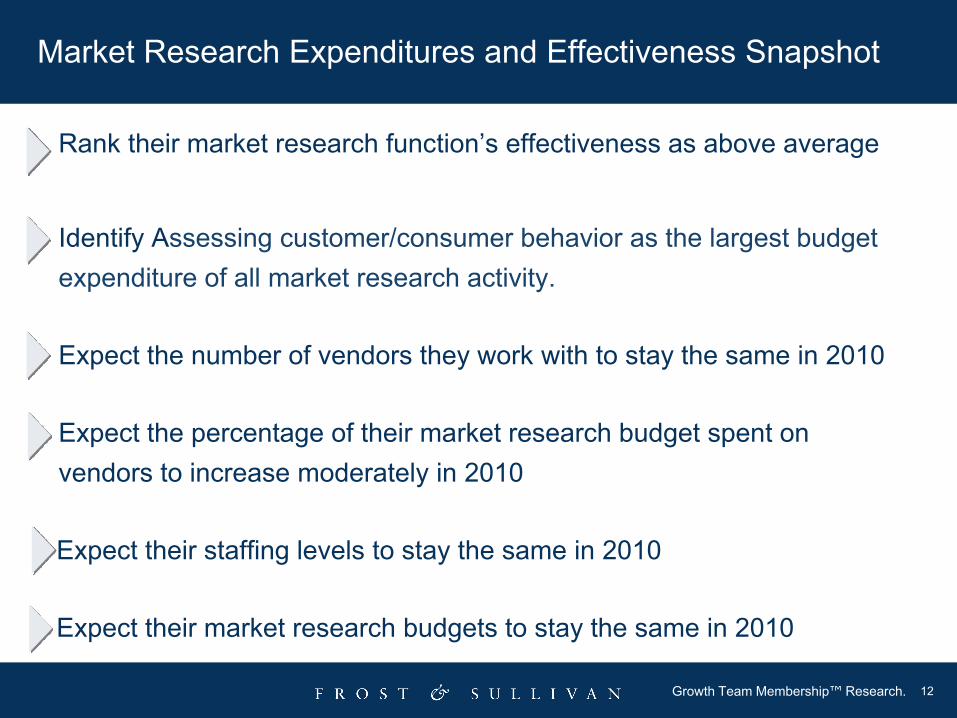
Market Research Expenditures and Effectiveness Snapshot
Rank their market research function’s effectiveness as above average
Identify Assessing customer/consumer behavior as the largest budget expenditure of all market research activity.
Expect the number of vendors they work with to stay the same in 2010
Expect the percentage of their market research budget spent on vendors to increase moderately in 2010
Expect their staffing levels to stay the same in 2010
Expect their market research budgets to stay the same in 2010

13Growth Team Membership™ Research.
Average36%
Above Average50%
Exceptional7%
Below Average7%
Market Research’s View of Its Effectiveness
N = 14
Survey Question: Please assess the overall effectiveness of your marker research function compared to those in other firms within your industry.
KEY TAKEAWAY: The majority of respondents feel that their function is “Above Average” in comparison to their peers.

14Growth Team Membership™ Research.
31%
15%
0%
15%
0%
39%
0%
20%
40%
Below € 686,813 € 686,813 to €2.05Million
€2.06 Million to€3.42 Million
€3.43 Million to€6.86 Million
€6.87 Million to€13.73 Million
€13.74 Million ormore
2009 Market Research Budgets
N = 25
Survey Question: Your 2009 total market research budget (all expenditures on primary, secondary syndicated and other research but excluding general & administrative expenses such as salaries) was in the range of in Euro€
KEY TAKEAWAY: The majority of market research budgets are under €2.05 million.

15Growth Team Membership™ Research.
10%
5%
20%
5%
10%
5%
10%
0%
10%
20%
MarketSize/Structure
Product/ServiceDevelopment and
Testing
Branding,Messaging, and
MarCom
Customer/ConsumerBehavior
Pricing Research CustomerSatisfaction/Market
Tracking
Business/CompetitiveIntelligence
Market Research Budget Allocation
KEY TAKEAWAY: On average, assessing customer/consumer behavior is allocated a higher percent of budget than any other market research activity.
N = 13
Survey Question: Please provide the percentage allocation of your total 2009 market research budget to the following research categories (must sum to 100%)

16Growth Team Membership™ Research.
Stay the Same53%
Decrease Moderately20%
Decrease Substantially7% Increase Moderately
20%
2010 vs. 2009 Vendor Portfolio
N = 15
Survey Question: In comparison to 2009, your 2010 the number of vendors your market research function works with will:
KEY TAKEAWAY: Market Researchers predict no change to the number of vendors they will use in 2010.

17Growth Team Membership™ Research.
Increase Moderately47%
Decrease Moderately20%
Stay the Same33%
2010 vs. 2009 Vendor Budget
N = 15
Survey Question: In comparison to 2009, your 2010 the percentage of your market research budget allocated to vendors will:
KEY TAKEAWAY: Respondents expect a moderate increase in budget allocations to vendors in 2010.
18Growth Team Membership™ Research.
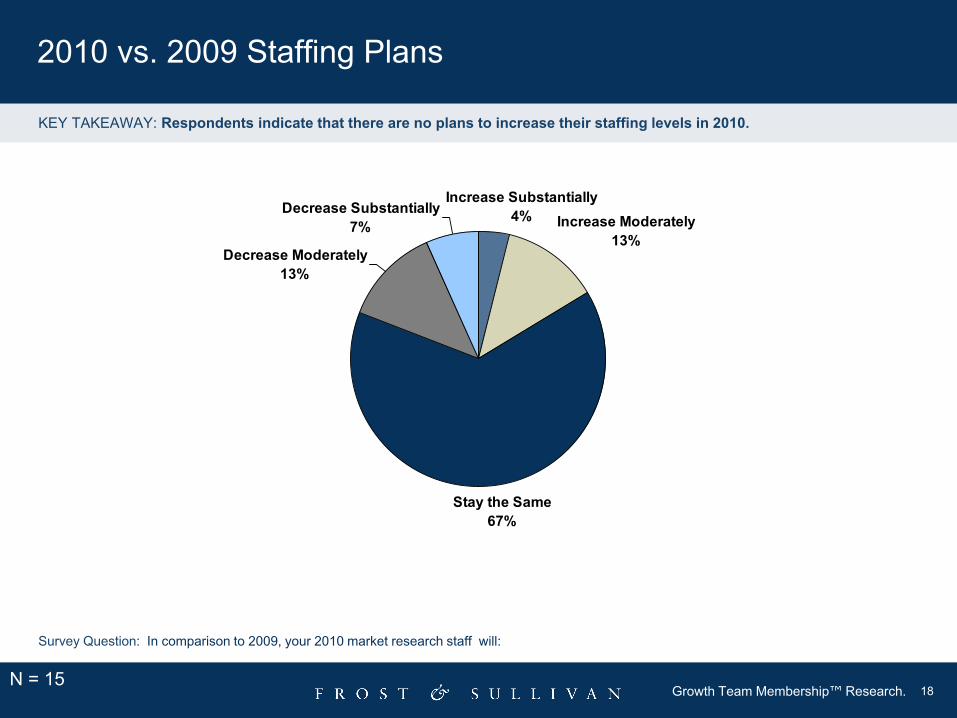
Decrease Substantially7% Increase Moderately
13%
Stay the Same67%
Decrease Moderately13%
Increase Substantially 4%
2010 vs. 2009 Staffing Plans
N = 15
Survey Question: In comparison to 2009, your 2010 market research staff will:
KEY TAKEAWAY: Respondents indicate that there are no plans to increase their staffing levels in 2010.

19Growth Team Membership™ Research.
Increase Moderately40%
Decrease Moderately13%
Stay the Same46%
2010 vs. 2009 Budgets
N = 15
Survey Question: In comparison to 2009, your 2010 market research budget will:
KEY TAKEAWAY: Market Research executives expect their budgets to remain static in 2010.

20Growth Team Membership™ Research.
Stay the Same13%
Decrease Moderately7%
Decrease Substantially7%
Increase Moderately73%
Anticipated Company Performance in 2010
N = 15
Survey Question: In comparison to 2009, your company’s performance by the end of 2010 will:
KEY TAKEAWAY: Respondents are optimistic about their companies performance in 2010.

21Growth Team Membership™ Research.
Key Competitive Intelligence Challenges
22Growth Team Membership™ Research.
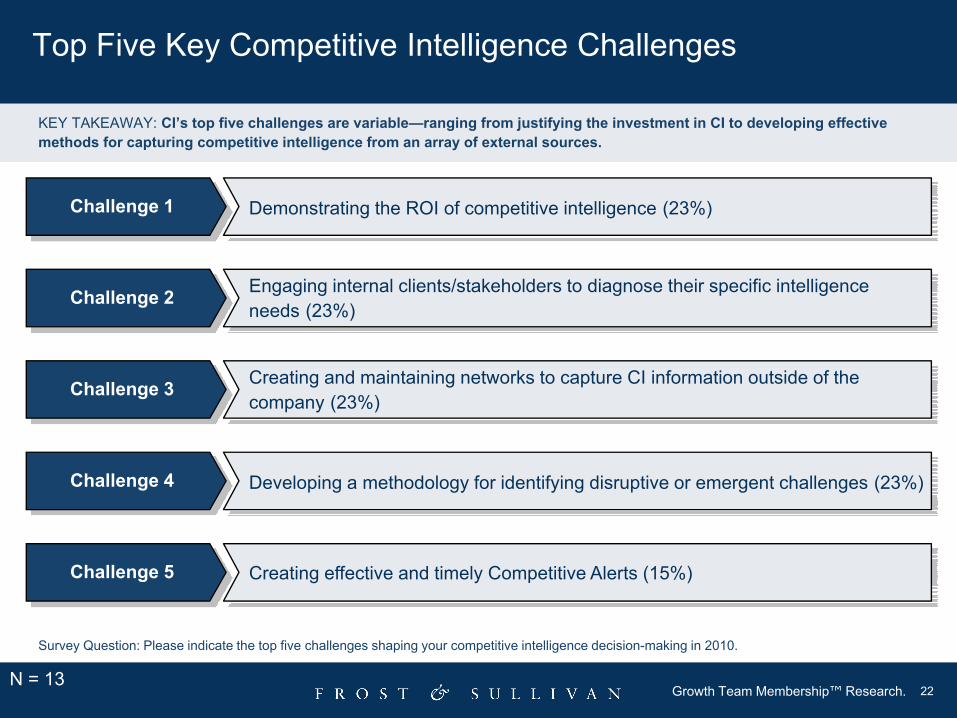
Top Five Key Competitive Intelligence Challenges
Challenge 1 Demonstrating the ROI of competitive intelligence (23%)
Challenge 2 Engaging internal clients/stakeholders to diagnose their specific intelligence needs (23%)
Challenge 3 Creating and maintaining networks to capture CI information outside of the company (23%)
N = 13
Survey Question: Please indicate the top five challenges shaping your competitive intelligence decision-making in 2010.
KEY TAKEAWAY: CI’s top five challenges are variable—ranging from justifying the investment in CI to developing effective methods for capturing competitive intelligence from an array of external sources.
Challenge 4 Developing a methodology for identifying disruptive or emergent challenges (23%)
Challenge 5 Creating effective and timely Competitive Alerts (15%)
23Growth Team Membership™ Research.
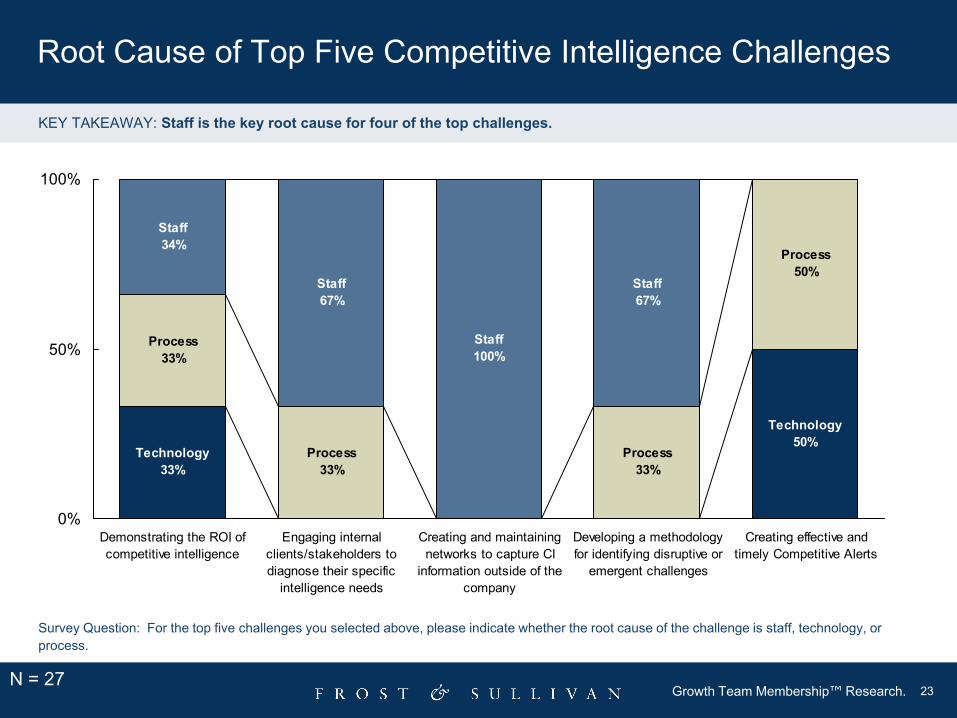
Root Cause of Top Five Competitive Intelligence Challenges
N = 27
Process33%
Process33%
Process33%
Process50%
Staff34%
Staff67%
Staff100%
Staff67%
Staff
Technology50%
Technology33%
0%
50%
100%
Demonstrating the ROI ofcompetitive intelligence
Engaging internalclients/stakeholders todiagnose their specific
intelligence needs
Creating and maintainingnetworks to capture CI
information outside of thecompany
Developing a methodologyfor identifying disruptive or
emergent challenges
Creating effective andtimely Competitive Alerts
Survey Question: For the top five challenges you selected above, please indicate whether the root cause of the challenge is staff, technology, or process.
KEY TAKEAWAY: Staff is the key root cause for four of the top challenges.

24Growth Team Membership™ Research.
Competitive Intelligence Effectiveness and Expenditures
25Growth Team Membership™ Research.
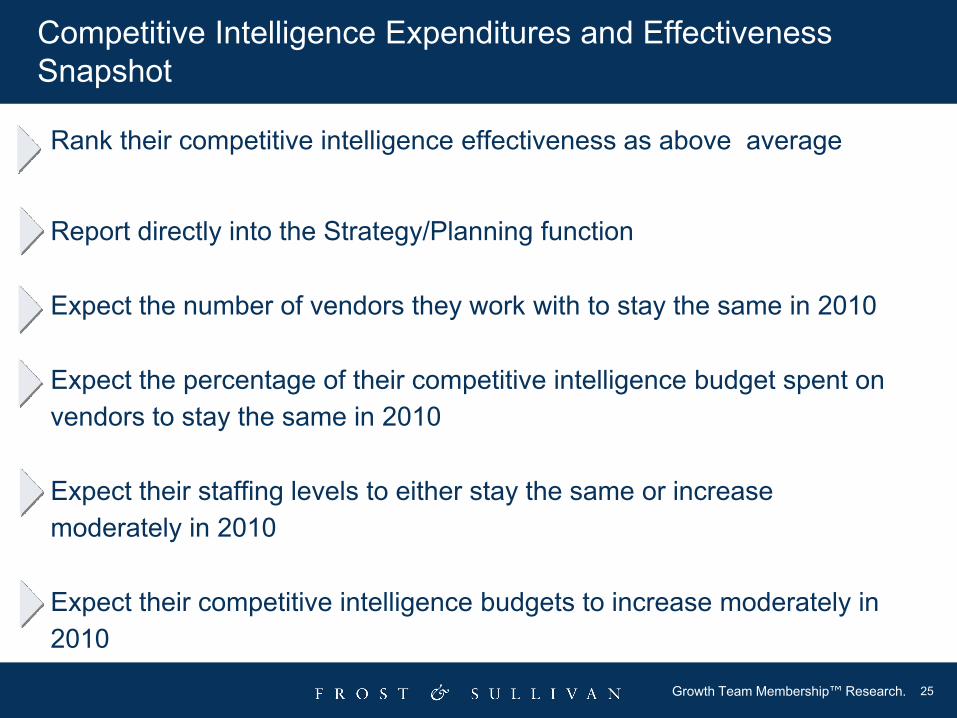
Competitive Intelligence Expenditures and Effectiveness Snapshot
Rank their competitive intelligence effectiveness as above average
Report directly into the Strategy/Planning function
Expect the number of vendors they work with to stay the same in 2010
Expect the percentage of their competitive intelligence budget spent on vendors to stay the same in 2010
Expect their staffing levels to either stay the same or increase moderately in 2010
Expect their competitive intelligence budgets to increase moderately in 2010

26Growth Team Membership™ Research.
Average31%
Above Average46%
Exceptional23%
Competitive Intelligence’s View of Its Effectiveness
N =13
Survey Question: Please assess the overall effectiveness of your competitive intelligence function compared to those in other firms within your industry.
KEY TAKEAWAY: Almost a fourth of respondents rate their CI function as exceptional in comparison to peers.

27Growth Team Membership™ Research.
31%
15% 15%
0%
7%
0% 0%
31%
0%
20%
40%
Less than€179,378
€179,378 to€358,756
€358,757 to€717,514
€717,515 to€1.43 Million
€1.44 Million to€2.15 Million
€2.16 Million to€2.87 Million
€2.88 Million to€3.59 Million
€3.60 Million ormore
2009 Competitive Intelligence Budgets
N = 13
Survey Question: Please indicate your 2009 total competitive intelligence budget (all expenditures on competitive intelligence activities but excluding general & administrative expenses such as staff) was in the range of in Euro€.
KEY TAKEAWAY: The majority of CI budgets are less than €358,756 .

28Growth Team Membership™ Research.
Direct Line Reporting of Competitive Intelligence Functions
N = 13
23%
23%
23%
31%
0% 25% 50%
Strategy/Planning
Marketing
Sales/Business Development
CEO/President/ GeneralManager
KEY TAKEAWAY: Competitive Intelligence departments are more likely to report into Corporate Strategy.
Survey Question: Your CI department reports directly into the following function.

29Growth Team Membership™ Research.
Stay the Same46%
Decrease Moderately23% Increase Moderately
31%
2010 vs. 2009 Vendor Portfolio
N = 13
Survey Question: In comparison to 2009, your 2010 the number of vendors your competitive intelligence function works with will:
KEY TAKEAWAY: CI executives predict no change in the number of vendors they work with in 2010.

30Growth Team Membership™ Research.
Stay the Same46%
Decrease Moderately23% Increase Moderately
31%
2010 vs. 2009 Vendor Budget
N = 13
Survey Question: In comparison to 2009, your 2010 the percentage of your competitive intelligence budget allocated to vendors will:
KEY TAKEAWAY: CI executives forecast no change in budget allocations for vendors for2010.

31Growth Team Membership™ Research.
Stay the Same39%
Decrease Moderately15%
Decrease Substantially7%
Increase Moderately39%
2010 vs. 2009 Staffing Plans
N = 13
Survey Question: In comparison to 2009, your 2010 competitive intelligence staff will:
KEY TAKEAWAY: The majority of respondents predict either a moderate or no increase in their staffing levels for 2010.
32Growth Team Membership™ Research.
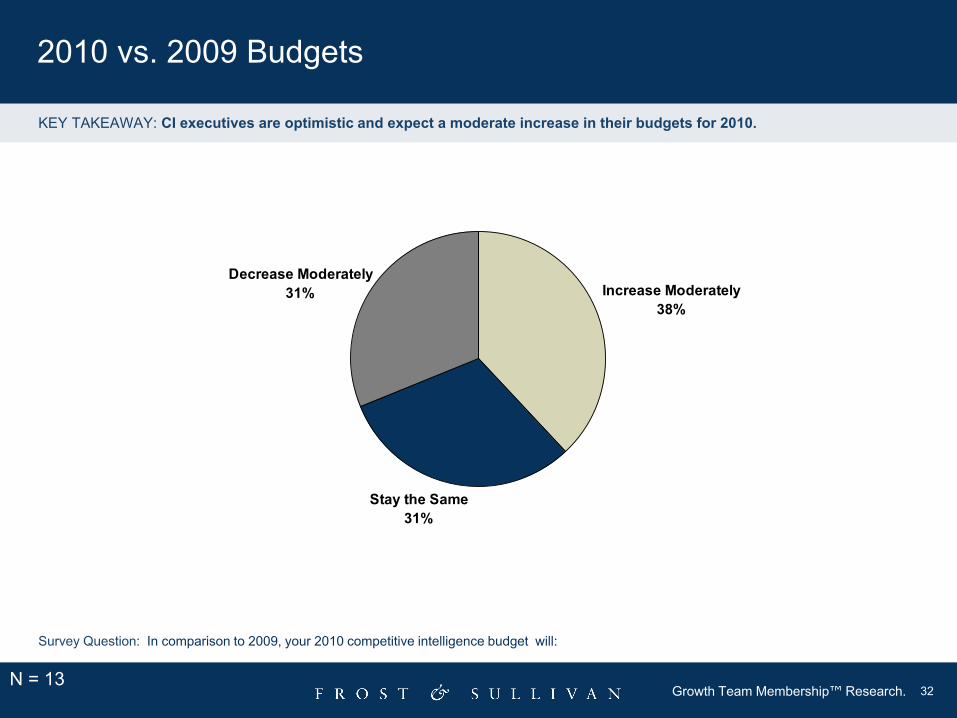
Stay the Same31%
Decrease Moderately31% Increase Moderately
38%
2010 vs. 2009 Budgets
N = 13
Survey Question: In comparison to 2009, your 2010 competitive intelligence budget will:
KEY TAKEAWAY: CI executives are optimistic and expect a moderate increase in their budgets for 2010.

33Growth Team Membership™ Research.
Increase Moderately55%
Stay the Same27%
Increase Substantially 18%
Anticipated Company Performance in 2010
N = 11
Survey Question: In comparison to 2009, your company’s performance by the end of 2010 will:
KEY TAKEAWAY: Respondents are optimistic about their company performance in 2010.

34Growth Team Membership™ Research.
Market Research and Competitive IntelligenceRespondent Demographics

35Growth Team Membership™ Research.
Venture Capital2%
Public35%
Private63% B-to-C
Company5%
Hybrid Company
32%B-to-B
Company63%
Demographics
N = 40
Over half of the respondents work in a private company.
Survey Question: Please indicate the type of enterprise best represents your organisation.
Respondents tended to be from private, B-to-B companies whose 2009 revenue was over € 695 Million
13% 8%
35% 30%
8%
0%
30%
60%
Below € 70 Million € 70 Million to €347.99 Million
€ 348 Million to €695.99 Million
€ 696 Million to € 7Billion
More than € 7 Billion
Enterprise Type Business Model
Company Revenue
N =41 N = 41

36Growth Team Membership™ Research.
21%
18%
14%
14%
25%
0% 20% 40%
Healthcare and Life Sciences
Information and CommunicationTechnologies
Electronics and Security
Chemicals, Materials, and Food
Automotive and Transportation
Demographics: Top Five Participating Industries
N = 44
Survey Question: Please indicate which of these Industry categories best describes you organisation (please indicate all that apply).

37Growth Team Membership™ Research.
Contact Us
If you have any questions or comments, please contact us at