Embed Size (px)
Citation preview
(c) AZOTH AnalyticsJanuary 2016
Global Blood Plasma Market: Trends, Opportunities and
Forecasts (2015-2020)
• By Market Segment (Type of Blood Plasma)-IVIG, Albumin, Factor VIII
• By Region-North America, Europe, APAC, RoW
• Market Entry Strategies for Global Players• Supply Chain Structure
(c) AZOTH Analytics
S.No Particulars Page No.
1. Research Methodology 12
2. Product Overview 14
3. Executive Summary 20
4. Global Blood Plasma Market Overview
4.1. Market Size & Forecast
4.1.1. By Value & Forecast 22
4.2. Market Shares & Analysis
4.2.1. By Product Type 24
4.2.2. By Company 25
4.3. Global Albumin Type Blood Plasma Market Overview
4.3.1. By Volume 29
4.3.2. By Value 30
4.3.3 By Company 31
4.4. Global IVIG Type Blood Plasma Market Overview
4.4.1. By Value 33
4.4.2 By Volume 34
4.5. Global Factor VIII Type Blood Plasma Market Overview
4.5.1 Overview 36
4.5.2 By Value 37
4.5.3 By Volume 38
2
(c) AZOTH Analytics
S.No Particulars Page No.
4.6. Other Blood Products Market Size
4.6.1. By Value ( Forecast 2020F) 39
5 North America Blood Plasma Market
5.1. Overview 41
5.2. By Value ( Forecast 2015E-2020F) 42
5.3. Factors Affecting Market 43
5.4. Factors Affecting Market 44
6. APAC Blood Plasma Market
6.1. Overview 46
6.2. By Value ( Forecast 2015E-2020F) 47
6.3. Factors Affecting Market 48
7. Europe Blood Plasma Market
7.1. By Value ( Forecast 2015E-2020F) 50
8. RoW Blood Plasma Market
8.1.. By Value ( Forecast 2015E-2020F) 52
8.2. Factors Affecting Market 53
8.3. Factors Affecting Market 54
9 Trends
9.1. Overview 56
3
(c) AZOTH Analytics
S.No Particulars Page No.
9.1.1. Solid and Stable Pricing Power in IG Market 57
9.1.2. Fast Growth of SCIG Market 58
9.1.3. Industrial Fractionators Planning Capacity Expansion 60
9.1.4. Increase in Albumin Market in China 61
9.1.5. Immunoglobulin Segment- High Profitability and Strength 62
10. Market Dynamics
Overview 64
10.1. Drivers
10.1.1 Augmentation in Plasma accumulations in the US 65
10.1.2. Rise in Global Healthcare Expenditure 67
10.1.3. Growth in Ageing Population 68
10.1.4. Growth in Male Population 70
10.1.5. Development Potential from New Indications 71
10.2. Challenges
10.2.1 Rivalry from Recombinant Factor VIII 72
10.2.2. Prospective Threat to Immunoglobulin Market 73
10.2.3. Costing Pressure in Tenders in Plasma-Derived FVIII Market 74
10.2.4. High Manufacturing and Safety Cost 75
11. Policy and Regulatory Landscape
11.1. WHO Blood Safety Regulations 77
4

(c) AZOTH Analytics
S.No Particulars Page No.
11.2. FDA Blood Safety Regulations 79
11.3. CANADA CAN/CSA-Z902-10 (R2015) - Blood and blood components 81
11.4. PHARMACEUTICAL AND FOOD SAFETY BUREAU (PFSB) JAPAN 84
11.5. UK Blood Safety Regulations 85
11.6. Australia Blood Safety Regulations 92
11.7. India Plasma Product Safety Regulations 95
12. Value Chain Analysis
12.1. Supply Chain Diagram 102
12.2. BLOOD PLASMA SUPPLY CHAIN 103
13. Blood Plasma Trade Data Analysis
13.1. Top 5 Nations with Import By Volume(Million KGS) 106
13.2. Top 5 Nations with Export By Volume(Million KGS) 107
13.3. Top 5 Nations with Import by Value (Billion $) 108
13.4. Top 5 Nations with Export by Value (Billion $) 109
14 Porter Five Force Analysis
14.1. Porter Five Force Model Blood Plasma 110
15 Competitive landscape
15.1. Company Financials 112
5
(c) AZOTH Analytics
15.1.1. Top 5 Companies Sales 113
15.1.2. Bottom 5 Companies Sales 114
15.1.3. Top 5 Companies EBITDA 115
15.1.4. Bottom 5 Companies EBITDA 116
15.1.5 Top 5 Companies EBIT 117
15.1.6 Bottom 5 Companies EBIT 118
15.1.7 Top 5 Companies PBT 119
15.1.8 Bottom 5 Companies PBT 120
15.1.9 Top 5 Companies PAT 121
15.1.10 Bottom 5 Companies PAT 122
15.2 Company Ratios
15.2.1 Top 5 Companies Current Ratio 123
15.2.2 Bottom 5 Companies Current Ratio 124
15.2.3 Top 5 Companies Profit Margin 125
15.2.4 Bottom 5 Companies Profit Margin 126
15.2.5 Top 5 Companies Debt Equity Ratio 127
16. Global Blood Plasma Market – Company Profiles
16.1. CSL Ltd. 129
16.2 Baxter International Inc 131
16.3 Grifols S.A 133
16.4 Antares Pharma Inc 135
6

(c) AZOTH Analytics
Table of Content
S.No Page No.
16.5 Emergent BioSolutions, Inc. 137
16.6 AMAG Pharmaceuticals, Inc. 139
16.7 Cipla 141
16.8 Octopharma 143
16.9 Biota Pharmaceuticals, Inc. 145
16.10 BioDelivery Sciences International, Inc. 149
17 Strategic Recommendations 151
18 About Us & Disclaimer 156
7
Figure No. Figure Title Page No.
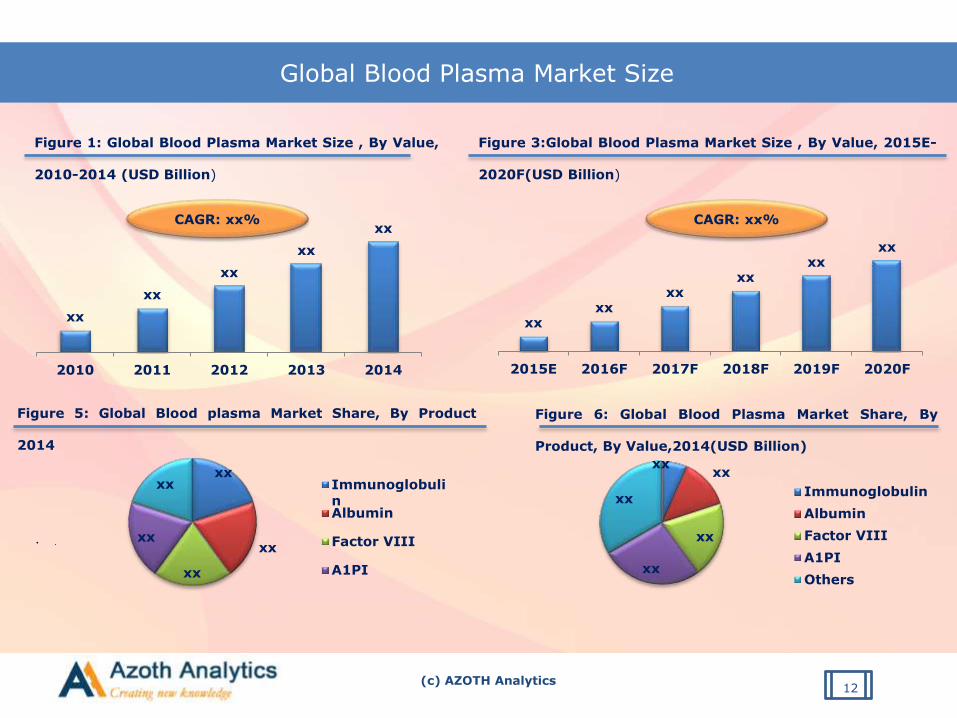
Figure 1: Global Blood Plasma Market Size , By Value, 2010-2014 (USD Billion) 22
Figure 2: Growth in Global Ageing Population (2010-2014) in Million 22
Figure 3: 3:Global Blood Plasma Market Size , By Value, 2015E-2020F(USD Billion) 23
Figure 4: India Per Capita Health care Expenditure (USD) 23
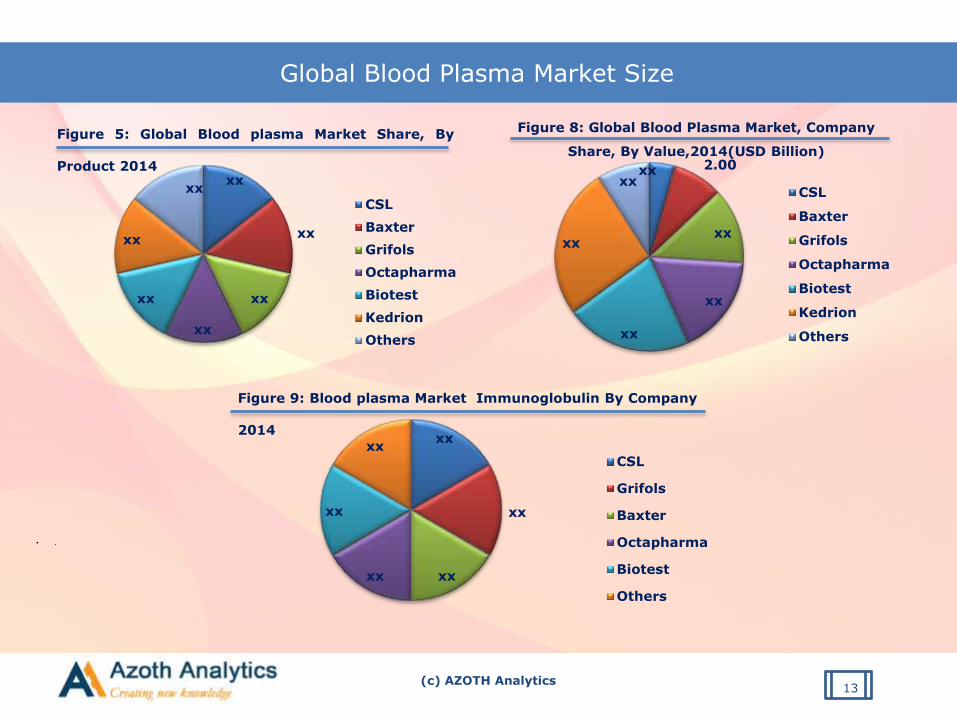
Figure 5: Blood plasma Market Share, By Product 2014 24
Figure 6: Blood Plasma Market Share, By Product, By Value,2014(USD Billion) 24
Figure 7: Blood plasma Market , By Company Share 2014 (Percentage) 25
Figure 8: 8:Blood Plasma Market, Company Share, By Value,2014(USD Billion) 25
Figure 9 : Blood plasma Market Immunoglobulin By Company 2014 26
Figure 10: Blood plasma Market Immunoglobulin By Company 2014 27

(c) AZOTH Analytics
List of FiguresFigure
No.Figure Title Page
No.
Figure 11: Global Albumin Market Size , By Volume, 2010-2014 (tons) 29
Figure 12: Global Albumin Market Size , By Volume, 2015E-2020E (tons) 29
Figure 13: Global Albumin Market Size , By Value, 2010-2014 (USD Billion) 30
Figure 14: Global Albumin Market Size , By Value, 2015E-2020E (USD Billion) 30
Figure 15: Blood plasma Market Albumin By Company 2014 31
Figure 16: Global IVIG Market Size , By Volume, 2010-2014 (tons) 33
Figure 17: Global IVIG Market Size , By Volume, 2015E-2020E (tons) 33
Figure 18: Global IVIG Market Size , By Value, 2010-2014 (USD Billion) 34
Figure 19: Global IVIG Market Size , By Value, 2015E-2020E (USD Billion) 34
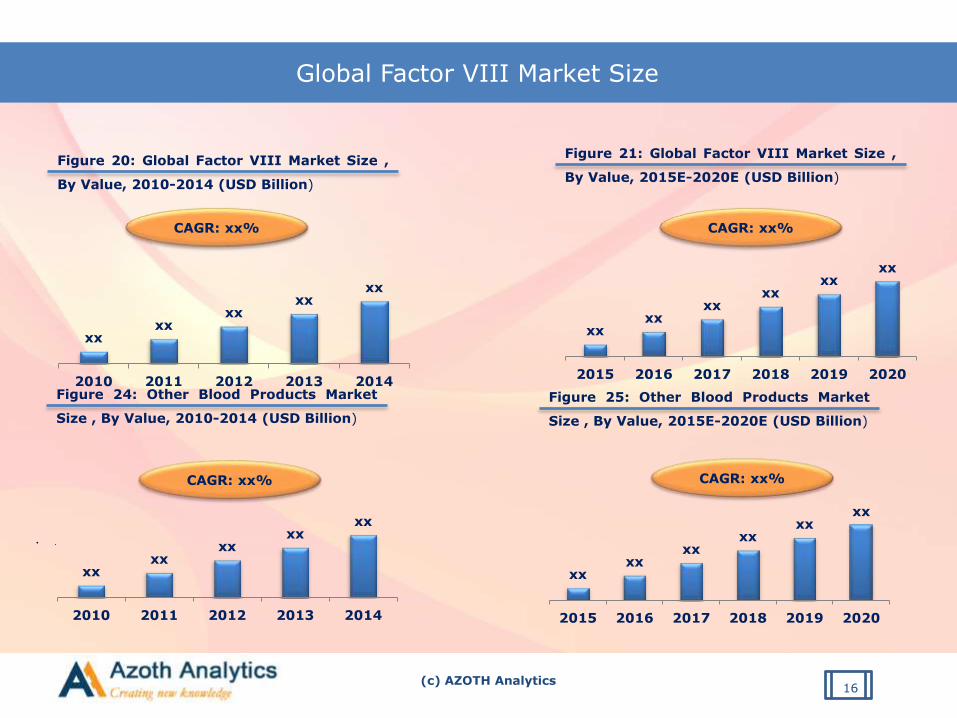
Figure 20: Global Factor VIII Market Size , By Value, 2010-2014 (USD Billion) 37
Figure 21: Global Factor VIII Market Size , By Value, 2015E-2020E (USD Billion) 37
Figure 22: Global Factor VIII Market Size , By Volume, 2010-2014 (International Units) 38
Figure 23: Global Factor VIII Market Size , By Volume, 2015E-2020E (International Units) 38
Figure 24: Other Blood Products Market Size , By Value, 2010-2014 (USD Billion) 39
Figure 25: Other Blood Products Market Size , By Value, 2015E-2020E (USD Billion) 39
Figure 26: North America Blood Plasma Market Size, By Value, 2010-2014 (USD Billion) 42
Figure 27: North America Blood Plasma Market Size, By Value, 2015E-2020E (USD Billion) 42
Figure 28: North America Aging Population, 2010-2020 (Million) 43
Figure 29: North America Blood Plasma Export to China, By Value, 2010-2014 (USD Billion) 43
8

(c) AZOTH Analytics
List of Figures
FigureNo.
Figure Title Page No.
Figure 30: Plasma Collection In America, By Volume, 2010-2014 (Million Litres) 44
Figure 31: APAC Blood Plasma Market Size, By Value, 2010-2014 (USD Billion) 47
Figure 32: APAC Blood Plasma Market Size, By Value, 2015E-2020E (USD Billion) 47
Figure 33: China Blood Plasma Import from North America, By Value, 2010-2014 (USD Million) 48
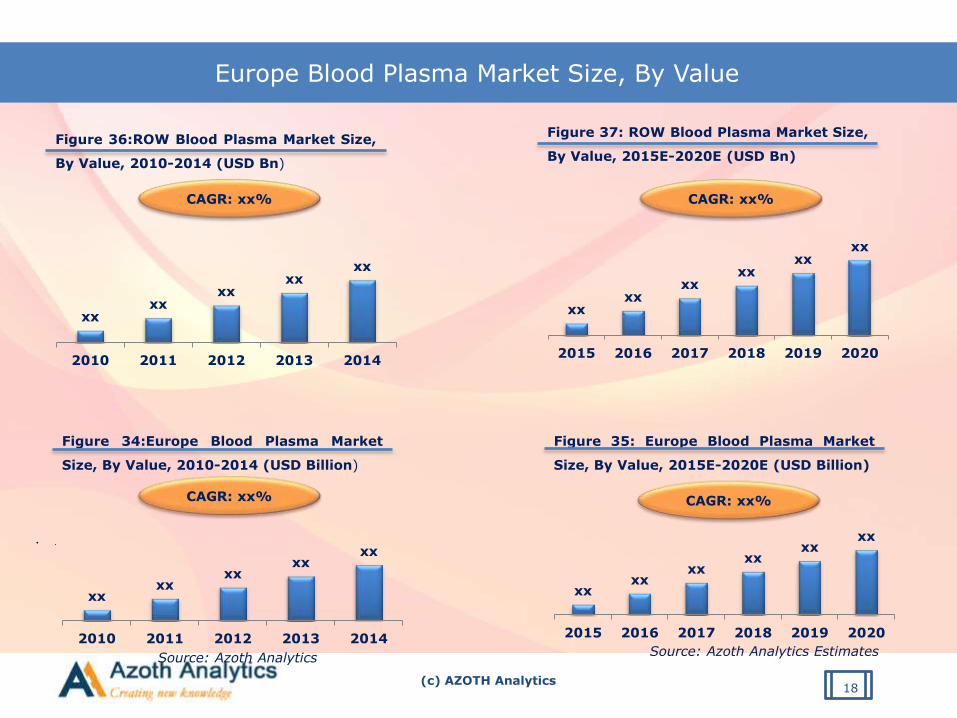
Figure 34: Europe Blood Plasma Market Size, By Value, 2010-2014 (USD Billion) 50
Figure 35: Europe Blood Plasma Market Size, By Value, 2015E-2020E (USD Billion) 50
Figure 36: ROW Blood Plasma Market Size, By Value, 2010-2014 (USD Billion) 52
Figure 37: ROW Blood Plasma Market Size, By Value, 2015E-2020E (USD Billion) 52
Figure 38: IVIG (KG/M) Usage Comparison 62
Figure 39: US Plasma Accumulations (2010-2014) 66
Figure 40: Rise in Global Healthcare Expenditure, 2010-2014 USD 67
Figure 41: Growth in Global Ageing Population (2010-2014) Million 69
Figure 42: Growth in Male Population, 2010-2014 (Million) 70
Figure 43: Blood Plasma Imports, By Top Countries, 2010-2014 (Million KGS) 106
Figure 44: Blood Plasma Exports, By Top Countries, 2010-2014 (Million KGS) 107
Figure 45: Blood Plasma Imports, By Top Countries, 2010-2014 (Billion $) 108
Figure 46: Blood Plasma Exports, By Top Countries, 2010-2014 (Billion $) 109
Figure 47: Top 5 Companies Sales in USD Billion 113
Figure 48: Bottom 5 Companies Sales in USD Million 114
Figure 49: Top 5 Companies EBITDA in USD Billion 115
Figure 50: Bottom 5 Companies EBITDA in USD Billion 116
9

(c) AZOTH Analytics
List of Figures
FigureNo.
Figure Title Page No.
Figure 51: Top 5 Companies EBIT in USD Billion 117
Figure 52: Bottom 5 Companies EBIT in USD Billion 118
Figure 53: Top 5 Companies PBT in USD Billion 119
Figure 54: Bottom 5 Companies PBT in USD Billion 120
Figure 55: Top 5 Companies PAT in USD Billion 121
Figure 56: Bottom 5 Companies PAT in USD Billion 122
Figure 57: Top 5 Companies Current Ratio 123
Figure 58: Bottom 5 Companies Current Ratio 124
Figure 59: Top 5 Companies Profit Margin 125
Figure 60: Bottom 5 Companies Profit Margin 126
Figure 61: Top 5 Companies Debt Equity Ratio 127
Figure 62: CSL Ltd. Percentage Revenue, By Product Segment (2014-2015) 129
Figure 63: CSL Ltd. Percentage Revenue, By Geography (2014-2015) 129
Figure 64: CSL Ltd. Sales (USD Billion) 2010-2014 130
Figure 65: Baxter International Inc. Percentage Revenue, By Product Segment (2014) 130
Figure 66: Baxter International Inc. Percentage Revenue, By Geography (2014) 131
Figure 67: Baxter International Inc. Sales (USD Billion) 2010-2014 132
Figure 68: Grifols S.A Percentage Revenue, By Product Segment (2014) 134
Figure 69: Grifols S.A Percentage Revenue, By Geography (2014) 134
Figure 70: Grifols SA Sales (USD Billion) 2010-2014 135
10

(c) AZOTH Analytics
List of Figures
FigureNo.
Figure Title Page No.
Figure 71: Antares Pharma Inc. Revenue (USD Billion) 2010-2014 137
Figure 72: Emergent BioSolutions, Inc. Revenue (USD Billion) 2010-2014 139
Figure 73: AMAG Pharmaceuticals, Inc. Revenue (USD Billion) 2010-2014 141
Figure 74: Octopharma Revenue (USD Billion) 2010-2014 143
Figure 75: Biota Pharmaceuticals, Inc. Revenue (USD Billion) 2010-2014 145
Figure 76: BioDelivery Sciences International, Inc. Revenue (USD Billion) 2010-2014 147
Figure 77: Flamel Technologies SA. Revenue (USD Billion) 2010-2014 149
11
(c) AZOTH Analytics
Global Blood Plasma Market Size
• .
12
xx
xx
xx
xx
xx
2010 2011 2012 2013 2014
Figure 1: Global Blood Plasma Market Size , By Value,
2010-2014 (USD Billion)
xx
xx
xx
xx
xx Immunoglobuli
nAlbumin
Factor VIII
A1PI
xxxx
xx
xx
xxImmunoglobulin
Albumin
Factor VIII
A1PI
Others
xxxx
xxxx
xxxx
2015E 2016F 2017F 2018F 2019F 2020F
Figure 3:Global Blood Plasma Market Size , By Value, 2015E-
2020F(USD Billion)
Figure 5: Global Blood plasma Market Share, By Product
2014
Figure 6: Global Blood Plasma Market Share, By
Product, By Value,2014(USD Billion)
CAGR: xx%CAGR: xx%
(c) AZOTH Analytics
Global Blood Plasma Market Size
• .
13
xx
xx
xx
xx
xx
xx
xx
CSL
Baxter
Grifols
Octapharma
Biotest
Kedrion
Others
xx 2.00
xx
xx
xx
xx
xxCSL
Baxter
Grifols
Octapharma
Biotest
Kedrion
Others
Figure 8: Global Blood Plasma Market, Company
Share, By Value,2014(USD Billion)
Figure 5: Global Blood plasma Market Share, By
Product 2014
xx
xx
xxxx
xx
xxCSL
Grifols
Baxter
Octapharma
Biotest
Others
Figure 9: Blood plasma Market Immunoglobulin By Company
2014

(c) AZOTH Analytics
Global Blood Plasma Market Size
• .
14
xxxx
xxxx
xx
2010 2011 2012 2013 2014
Figure 11: Global Albumin Market Size , By
Volume, 2010-2014 (tons)
xxxx
xxxx
xxxx
2015 2016 2017 2018 2019 2020
Figure 12: Global Albumin Market Size , By
Volume, 2015E-2020E (tons)
xxxx
xxxx
xx
2010 2011 2012 2013 2014
Figure 13: Global Albumin Market Size , By
Value, 2010-2014 (USD Billion)
xxxx
xxxx
xxxx
2015 2016 2017 2018 2019 2020
Source: Azoth Analytics
Figure 14: Global Albumin Market Size , By
Value, 2015E-2020E (USD Billion)
CAGR: xx%CAGR: xx%
CAGR: xx%CAGR: xx%

(c) AZOTH Analytics
Global Blood Plasma Market Size
• .
15
xxxx
xxxx
xx
2010 2011 2012 2013 2014
Figure 16: Global IVIG Market Size , By
Volume, 2010-2014 (tons)
xxxx
xxxx
xxxx
2015 2016 2017 2018 2019 2020
Figure 17: Global IVIG Market Size , By
Volume, 2015E-2020E (tons)
xxxx
xxxx
xx
2010 2011 2012 2013 2014
CAGR: xx%
Figure 18: Global IVIG Market Size , By Value,
2010-2014 (USD Billion)
xxxx
xxxx
xxxx
2015 2016 2017 2018 2019 2020
CAGR: xx%
Figure 19: Global IVIG Market Size , By Value,
2015E-2020E (USD Billion)
CAGR: xx% CAGR: xx%
(c) AZOTH Analytics
Global Factor VIII Market Size
• .
16
xxxx
xxxx
xx
2010 2011 2012 2013 2014
Figure 20: Global Factor VIII Market Size ,
By Value, 2010-2014 (USD Billion)
xxxx
xxxx
xxxx
2015 2016 2017 2018 2019 2020
Figure 21: Global Factor VIII Market Size ,
By Value, 2015E-2020E (USD Billion)
xxxx
xxxx
xx
2010 2011 2012 2013 2014
Figure 24: Other Blood Products Market
Size , By Value, 2010-2014 (USD Billion)
xxxx
xxxx
xxxx
2015 2016 2017 2018 2019 2020
Figure 25: Other Blood Products Market
Size , By Value, 2015E-2020E (USD Billion)
CAGR: xx%
CAGR: xx%CAGR: xx%
CAGR: xx%

(c) AZOTH Analytics
North America Blood Plasma Market Size, By Value
• .
17
xxxx
xxxx
xx
2010 2011 2012 2013 2014
Figure 26:North America Blood Plasma Market
Size, By Value, 2010-2014 (USD Billion)
xxxx
xxxx
xxxx
2015 2016 2017 2018 2019 2020
Figure 27:North America Blood Plasma
Market Size, By Value, 2015E-2020E (USD
Billion)
xxxx
xxxx
xx
2010 2011 2012 2013 2014
Figure 31:APAC Blood Plasma Market Size,
By Value, 2010-2014 (USD Billion)
xxxx
xxxx
xxxx
2015 2016 2017 2018 2019 2020
Figure32: APAC Blood Plasma Market Size, By
Value, 2015E-2020E (USD Billion)
Source: Azoth Analytics
CAGR: xx%
Figure 34:Europe Blood Plasma Market
Size, By Value, 2010-2014 (USD Billion)
CAGR: xx% CAGR: xx%
CAGR: xx%
(c) AZOTH Analytics
Europe Blood Plasma Market Size, By Value
• .
18
xxxx
xxxx
xxxx
2015 2016 2017 2018 2019 2020
Source: Azoth Analytics Estimates
Figure 35: Europe Blood Plasma Market
Size, By Value, 2015E-2020E (USD Billion)
xxxx
xxxx
xx
2010 2011 2012 2013 2014
Figure 36:ROW Blood Plasma Market Size,
By Value, 2010-2014 (USD Bn)
xxxx
xxxx
xxxx
2015 2016 2017 2018 2019 2020
Figure 37: ROW Blood Plasma Market Size,
By Value, 2015E-2020E (USD Bn)
CAGR: xx%
xxxx
xxxx
xx
2010 2011 2012 2013 2014
Source: Azoth Analytics
CAGR: xx%
Figure 34:Europe Blood Plasma Market
Size, By Value, 2010-2014 (USD Billion)
CAGR: xx% CAGR: xx%
(c) AZOTH Analytics
About Azoth Analytics Pvt Ltd.
Azoth Analytics creates in-depth research reports by recording, interpreting and analyzing information through primary and secondary
research. Our strategic market sizing and data dredging techniques include secondary research, interviews with key market players and
industry experts and use of industry specific statistical tools which helps in designing and planning effective research for our global and
local clients. We provide customized market research reports revealing the hidden truths on different verticals like pharmaceutical, oil and
gas, retail, automotive, real estate, logistics, energy, healthcare, technology, FMCG, food & beverages and media sectors .
19
Global Blood Plasma Market: Trends, Opportunities and Forecasts (2015-2020) -(Blood Plasma -IVIG, Albumin, Factor VIII, By Region-North America, Europe, APAC, Market Entry Strategies for Global Players))
Date of Publication: January 2016Number of Pages: 155Price: US$ 2200 (Single-User License)
: US$ 3000 (Multi-User License)
For Placing an Order of the Report, Please Follow the Link:
http://www.azothanalytics.com/report/global-blood-plasma-market-trends-opportunities-and-forecasts-2015-2020-r8
+91 120 429 5175