Embed Size (px)
Citation preview
Copyright 2013 Bottom Line Analytics All rights reserved.
The Price is Right? The Six Steps to More Profitable Pricing Leveraging Analytics to Generate More Profitable Pricing Strategies & Decisions
Sep., 2013
Copyright 2013 Bottom Line Analytics All rights reserved.
Content
2
Forward, Objectives & Destination
Destination: The 6 Step Process
1. The importance of analytics
a) Developing a Predictive Model
b) Deriving Price Elasticity Curves with Competitive Effects
c) Measuring the Volume Drivers and Variances
d) The Importance of Determining the Sales and Profit Impact by SKU
e) Price Sensitivity by Market and Channel
f) Macro-Economic impacts on the business
g) Identifying the Critical SKUs for Pricing Success
h) Price Simulation, Profit Optimization and Scenario Planning
Copyright 2013 Bottom Line Analytics All rights reserved. 3
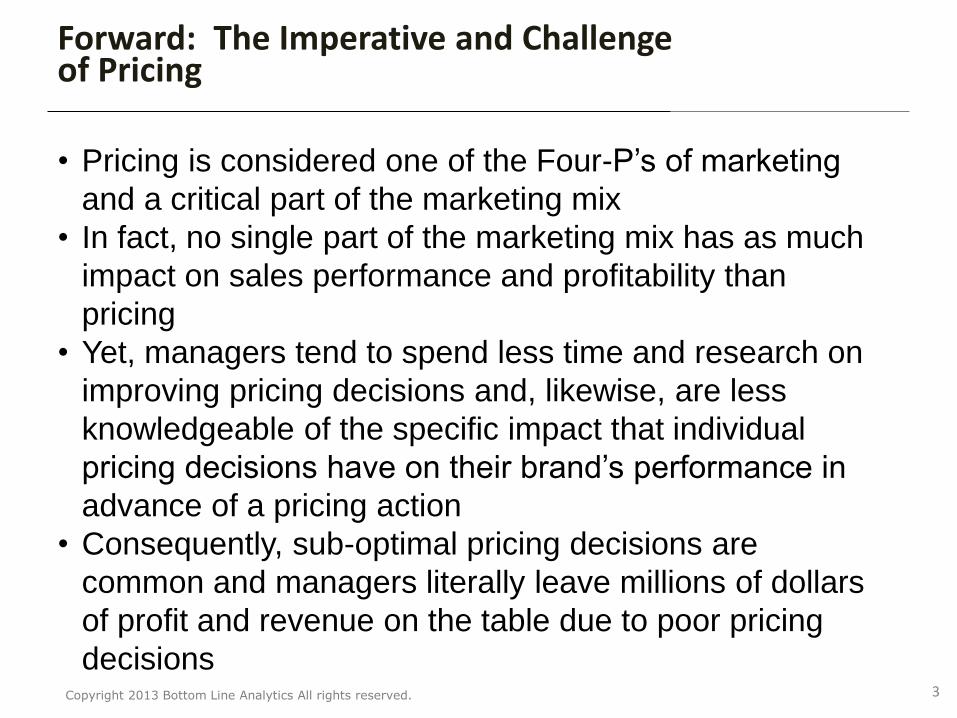
Forward: The Imperative and Challenge of Pricing
• Pricing is considered one of the Four-P’s of marketing
and a critical part of the marketing mix
• In fact, no single part of the marketing mix has as much
impact on sales performance and profitability than
pricing
• Yet, managers tend to spend less time and research on
improving pricing decisions and, likewise, are less
knowledgeable of the specific impact that individual
pricing decisions have on their brand’s performance in
advance of a pricing action
• Consequently, sub-optimal pricing decisions are
common and managers literally leave millions of dollars
of profit and revenue on the table due to poor pricing
decisions
Copyright 2013 Bottom Line Analytics All rights reserved. 4
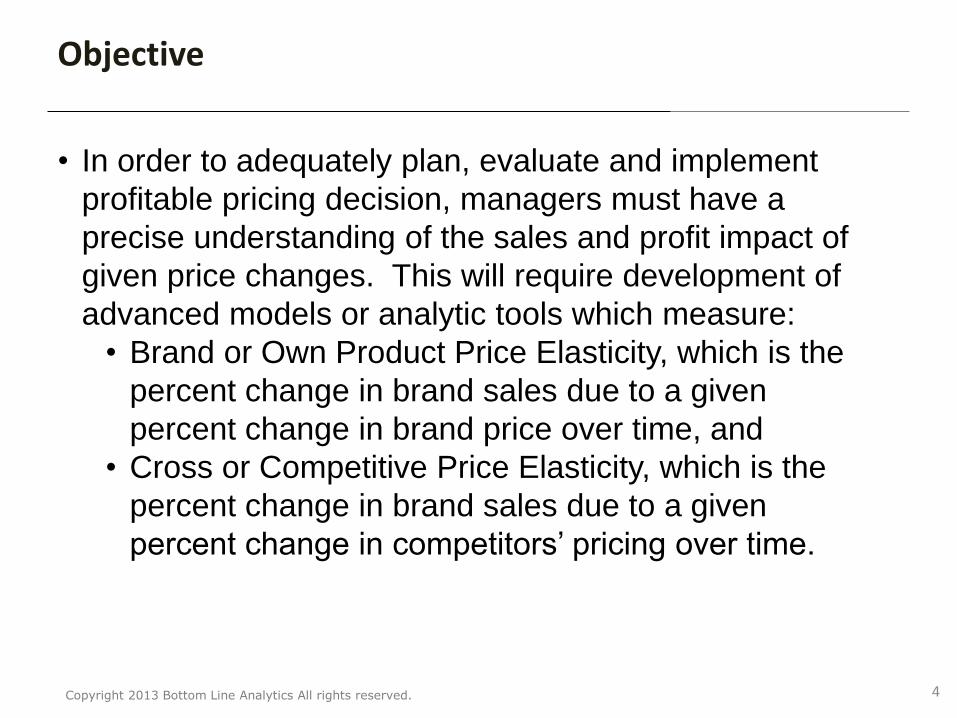
Objective
• In order to adequately plan, evaluate and implement
profitable pricing decision, managers must have a
precise understanding of the sales and profit impact of
given price changes. This will require development of
advanced models or analytic tools which measure:
• Brand or Own Product Price Elasticity, which is the
percent change in brand sales due to a given
percent change in brand price over time, and
• Cross or Competitive Price Elasticity, which is the
percent change in brand sales due to a given
percent change in competitors’ pricing over time.
Copyright 2013 Bottom Line Analytics All rights reserved.
Content
5
Forward, Objectives & Destination
Destination: The 6 Step Process
1. The importance of analytics
a) Developing a Predictive Model
b) Deriving Price Elasticity Curves with Competitive Effects
c) Measuring the Volume Drivers and Variances
d) The Importance of Determining the Sales and Profit Impact by SKU
e) Price Sensitivity by Market and Channel
f) Macro-Economic impacts on the business
g) Identifying the Critical SKUs for Pricing Success
h) Price Simulation, Profit Optimization and Scenario Planning
Copyright 2013 Bottom Line Analytics All rights reserved. 6
Destination
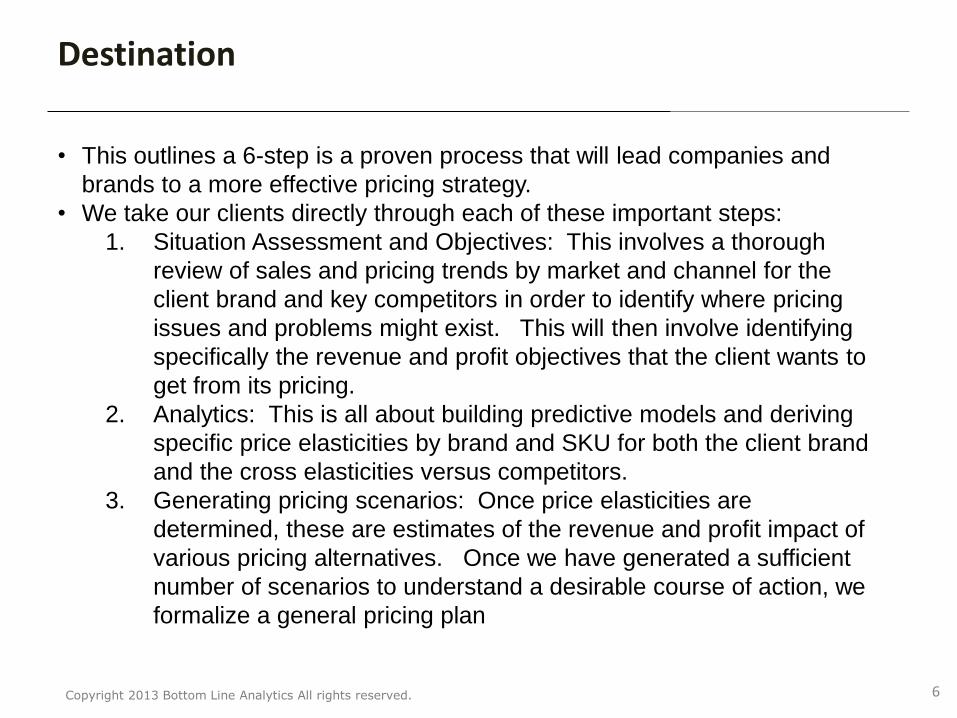
• This outlines a 6-step is a proven process that will lead companies and
brands to a more effective pricing strategy.
• We take our clients directly through each of these important steps:
1. Situation Assessment and Objectives: This involves a thorough
review of sales and pricing trends by market and channel for the
client brand and key competitors in order to identify where pricing
issues and problems might exist. This will then involve identifying
specifically the revenue and profit objectives that the client wants to
get from its pricing.
2. Analytics: This is all about building predictive models and deriving
specific price elasticities by brand and SKU for both the client brand
and the cross elasticities versus competitors.
3. Generating pricing scenarios: Once price elasticities are
determined, these are estimates of the revenue and profit impact of
various pricing alternatives. Once we have generated a sufficient
number of scenarios to understand a desirable course of action, we
formalize a general pricing plan
Copyright 2013 Bottom Line Analytics All rights reserved. 7
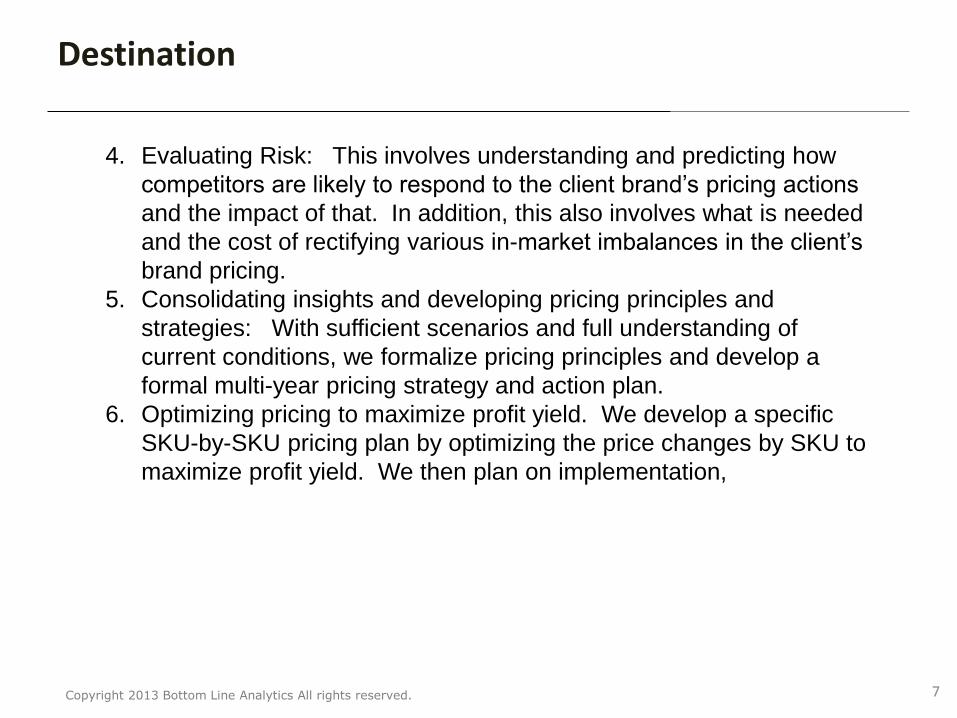
Destination
4. Evaluating Risk: This involves understanding and predicting how
competitors are likely to respond to the client brand’s pricing actions
and the impact of that. In addition, this also involves what is needed
and the cost of rectifying various in-market imbalances in the client’s
brand pricing.
5. Consolidating insights and developing pricing principles and
strategies: With sufficient scenarios and full understanding of
current conditions, we formalize pricing principles and develop a
formal multi-year pricing strategy and action plan.
6. Optimizing pricing to maximize profit yield. We develop a specific
SKU-by-SKU pricing plan by optimizing the price changes by SKU to
maximize profit yield. We then plan on implementation,
Copyright 2013 Bottom Line Analytics All rights reserved.
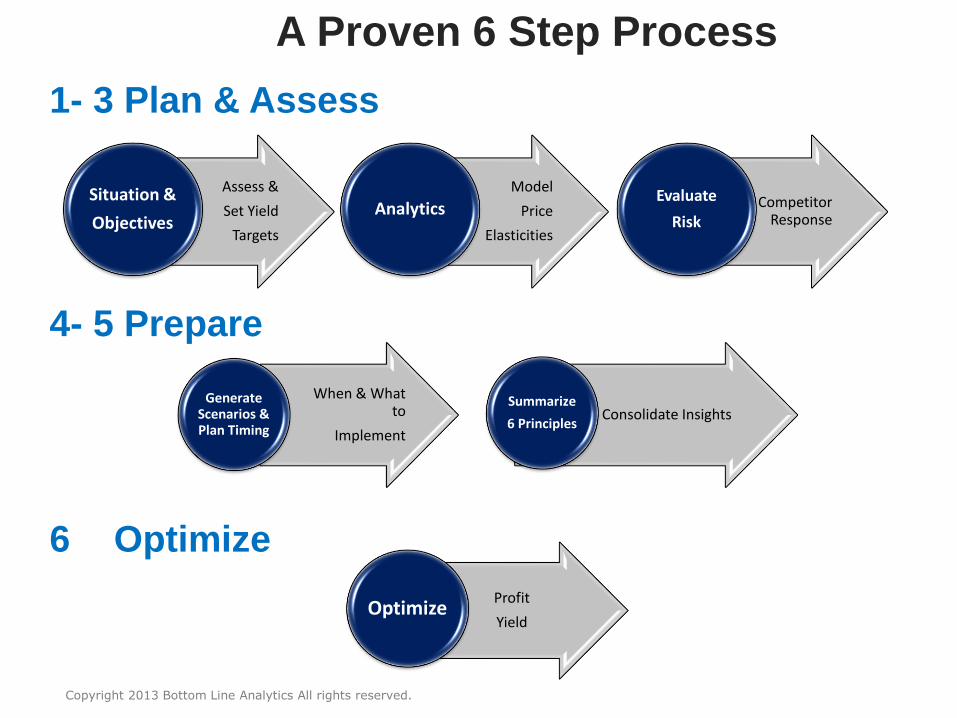
1- 3 Plan & Assess
4- 5 Prepare
6 Optimize
Assess &
Set Yield
Targets
Situation &
Objectives
Model
Price
Elasticities
Analytics Competitor Response
Evaluate
Risk
When & What to
Implement
Generate Scenarios & Plan Timing
Consolidate Insights Summarize
6 Principles
Profit
Yield Optimize
A Proven 6 Step Process
Copyright 2013 Bottom Line Analytics All rights reserved.
Content
9
Forward, Objectives & Destination
Destination: The 6 Step Process
1. The importance of analytics
a) Developing a Predictive Model
b) Deriving Price Elasticity Curves with Competitive Effects
c) Measuring the Volume Drivers and Variances
d) The Importance of Determining the Sales and Profit Impact by SKU
e) Price Sensitivity by Market and Channel
f) Macro-Economic impacts on the business
g) Identifying the Critical SKUs for Pricing Success
h) Price Simulation, Profit Optimization and Scenario Planning
Copyright 2013 Bottom Line Analytics All rights reserved.
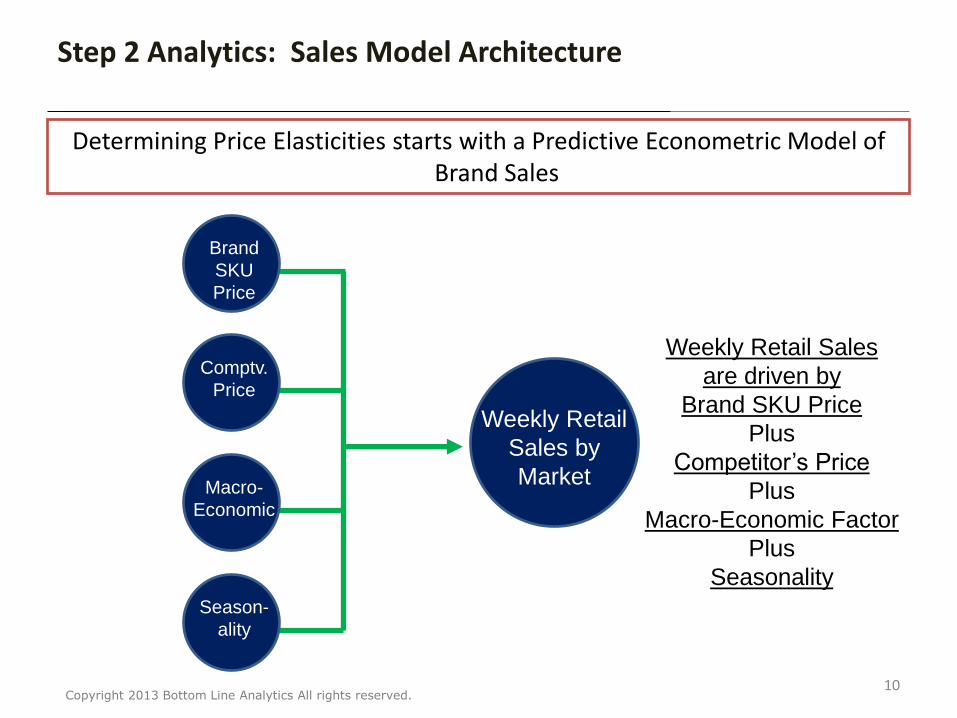
Step 2 Analytics: Sales Model Architecture
10
Brand
SKU
Price
Comptv.
Price
Macro-
Economic
Season-
ality
Weekly Retail
Sales by
Market
Determining Price Elasticities starts with a Predictive Econometric Model of Brand Sales
Weekly Retail Sales
are driven by
Brand SKU Price
Plus
Competitor’s Price
Plus
Macro-Economic Factor
Plus
Seasonality
Copyright 2013 Bottom Line Analytics All rights reserved.
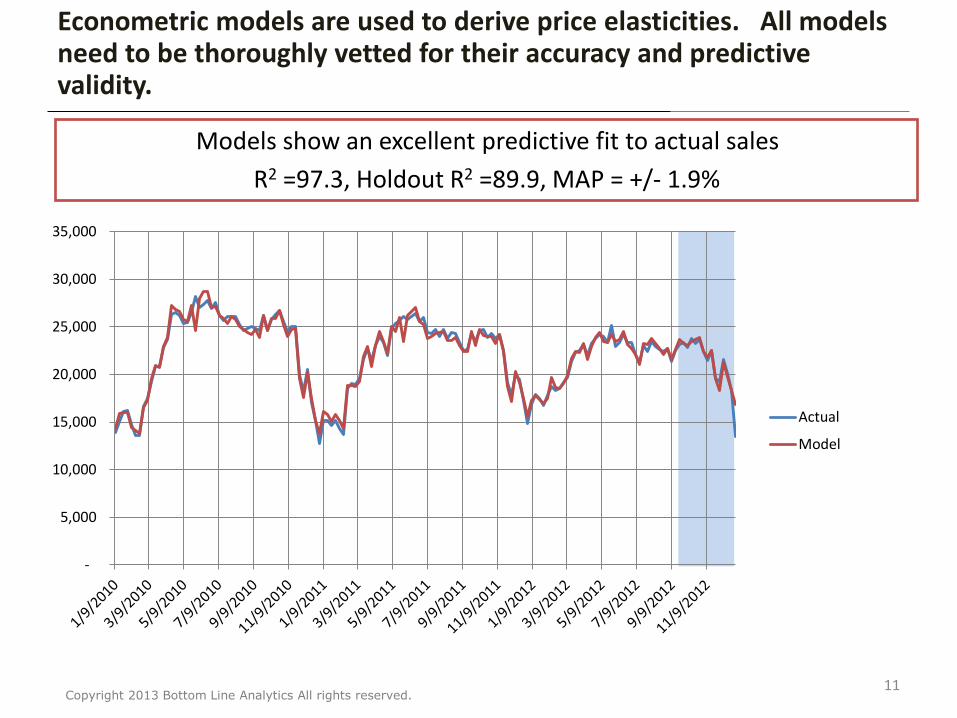
Econometric models are used to derive price elasticities. All models need to be thoroughly vetted for their accuracy and predictive validity.
-
5,000
10,000
15,000
20,000
25,000
30,000
35,000
Actual
Model
11
Models show an excellent predictive fit to actual sales
R2 =97.3, Holdout R2 =89.9, MAP = +/- 1.9%
Copyright 2013 Bottom Line Analytics All rights reserved.
Content
12
Forward, Objectives & Destination
Destination: The 6 Step Process
1. The importance of analytics
a) Developing a Predictive Model
b) Deriving Price Elasticity Curves with Competitive Effects
c) Measuring the Volume Drivers and Variances
d) The Importance of Determining the Sales and Profit Impact by SKU
e) Price Sensitivity by Market and Channel
f) Macro-Economic impacts on the business
g) Identifying the Critical SKUs for Pricing Success
h) Price Simulation, Profit Optimization and Scenario Planning
Copyright 2013 Bottom Line Analytics All rights reserved.
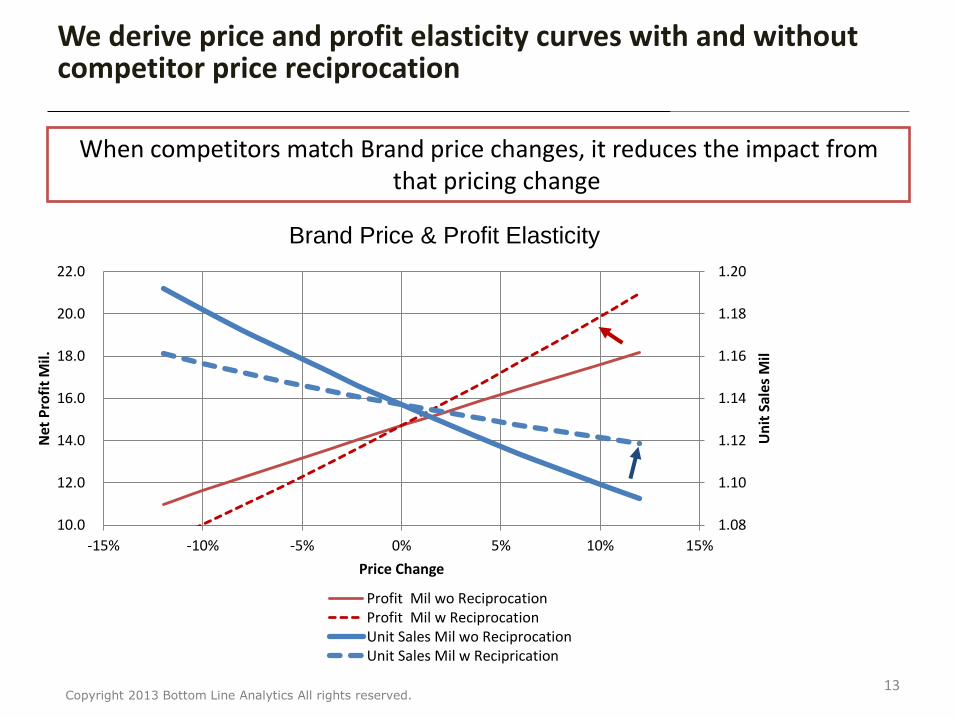
We derive price and profit elasticity curves with and without competitor price reciprocation
1.08
1.10
1.12
1.14
1.16
1.18
1.20
10.0
12.0
14.0
16.0
18.0
20.0
22.0
-15% -10% -5% 0% 5% 10% 15%
Un
it S
ales
Mil
Net
Pro
fit
Mil.
Price Change
Profit Mil wo ReciprocationProfit Mil w ReciprocationUnit Sales Mil wo ReciprocationUnit Sales Mil w Reciprication
13
When competitors match Brand price changes, it reduces the impact from that pricing change
Brand Price & Profit Elasticity
Copyright 2013 Bottom Line Analytics All rights reserved.
Content
14
Forward, Objectives & Destination
Destination: The 6 Step Process
1. The importance of analytics
a) Developing a Predictive Model
b) Deriving Price Elasticity Curves with Competitive Effects
c) Measuring the Volume Drivers and Variances
d) The Importance of Determining the Sales and Profit Impact by SKU
e) Price Sensitivity by Market and Channel
f) Macro-Economic impacts on the business
g) Identifying the Critical SKUs for Pricing Success
h) Price Simulation, Profit Optimization and Scenario Planning
Copyright 2013 Bottom Line Analytics All rights reserved.
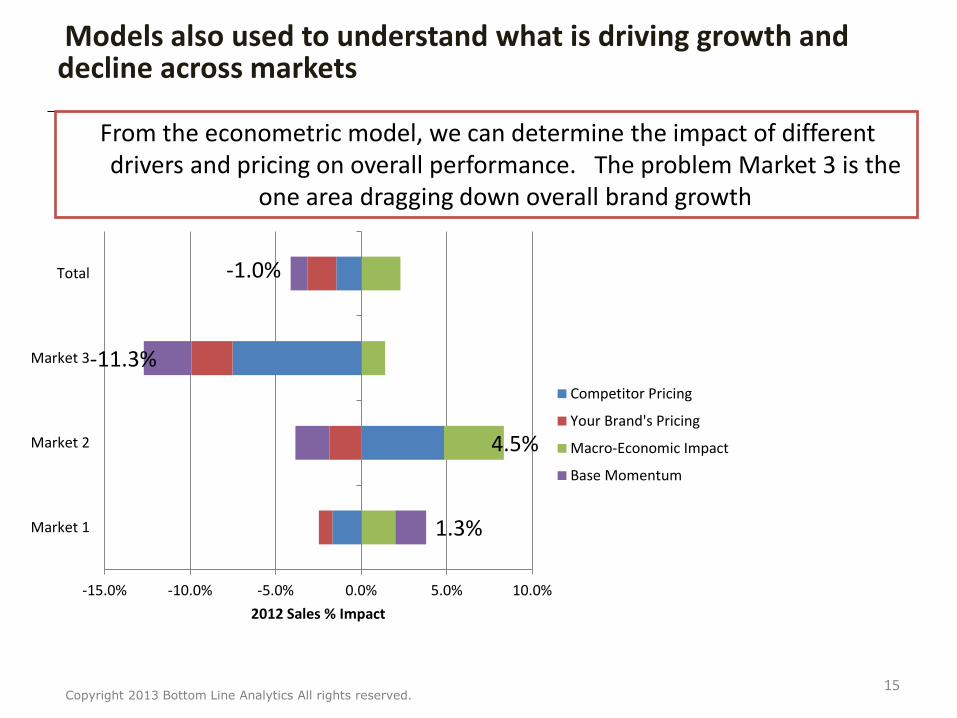
Models also used to understand what is driving growth and decline across markets
4.5%
1.3%
-11.3%
-1.0%
-15.0% -10.0% -5.0% 0.0% 5.0% 10.0%
Market 1
Market 2
Market 3
Total
2012 Sales % Impact
Competitor Pricing
Your Brand's Pricing
Macro-Economic Impact
Base Momentum
15
From the econometric model, we can determine the impact of different drivers and pricing on overall performance. The problem Market 3 is the
one area dragging down overall brand growth
Copyright 2013 Bottom Line Analytics All rights reserved.
Content
16
Forward, Objectives & Destination
Destination: The 6 Step Process
1. The importance of analytics
a) Developing a Predictive Model
b) Deriving Price Elasticity Curves with Competitive Effects
c) Measuring the Volume Drivers and Variances
d) The Importance of Determining the Sales and Profit Impact by SKU
e) Price Sensitivity by Market and Channel
f) Macro-Economic impacts on the business
g) Identifying the Critical SKUs for Pricing Success
h) Price Simulation, Profit Optimization and Scenario Planning
Copyright 2013 Bottom Line Analytics All rights reserved.
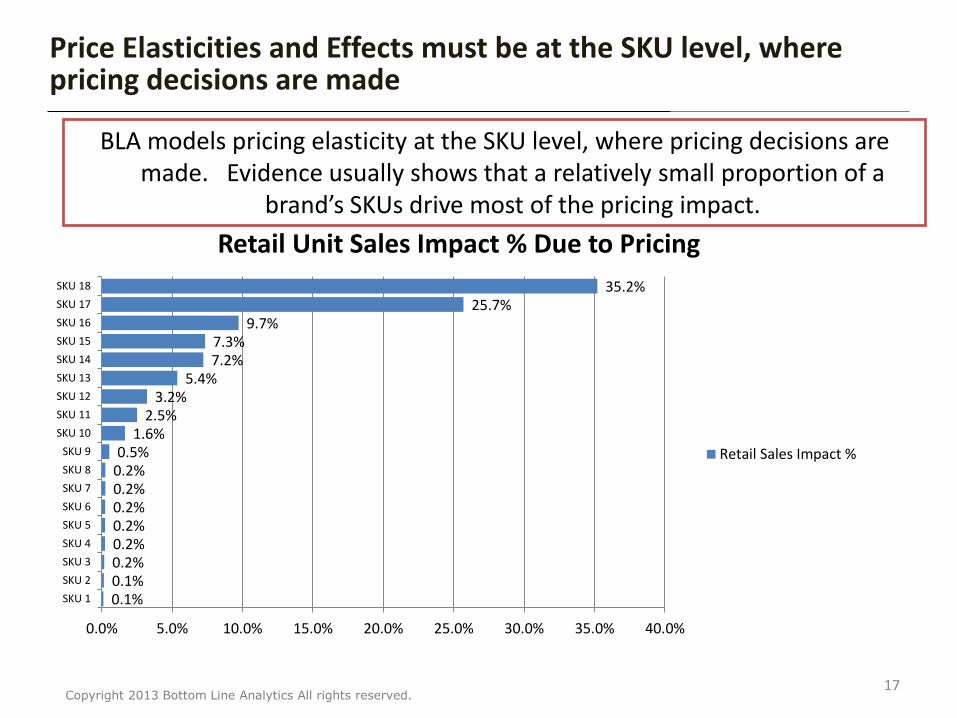
Price Elasticities and Effects must be at the SKU level, where pricing decisions are made
0.1% 0.1% 0.2% 0.2% 0.2% 0.2% 0.2% 0.2% 0.5%
1.6% 2.5%
3.2% 5.4%
7.2% 7.3%
9.7% 25.7%
35.2%
0.0% 5.0% 10.0% 15.0% 20.0% 25.0% 30.0% 35.0% 40.0%
SKU 1
SKU 2
SKU 3
SKU 4
SKU 5
SKU 6
SKU 7
SKU 8
SKU 9
SKU 10
SKU 11
SKU 12
SKU 13
SKU 14
SKU 15
SKU 16
SKU 17
SKU 18
Retail Unit Sales Impact % Due to Pricing
Retail Sales Impact %
17
BLA models pricing elasticity at the SKU level, where pricing decisions are made. Evidence usually shows that a relatively small proportion of a
brand’s SKUs drive most of the pricing impact.
Copyright 2013 Bottom Line Analytics All rights reserved.
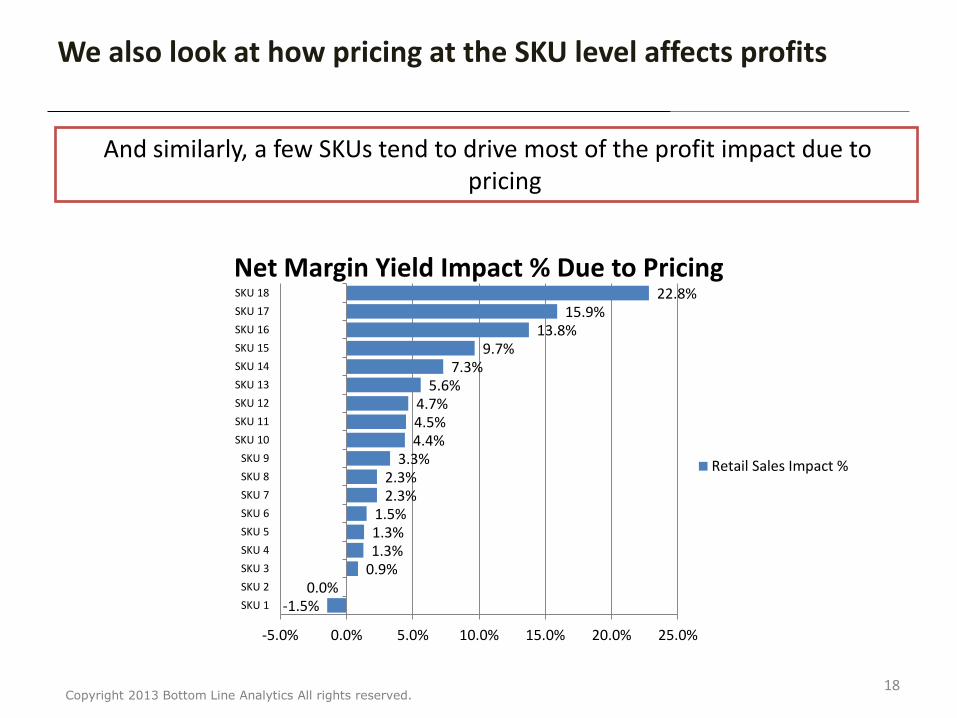
We also look at how pricing at the SKU level affects profits
-1.5% 0.0%
0.9% 1.3% 1.3% 1.5%
2.3% 2.3%
3.3% 4.4% 4.5% 4.7%
5.6% 7.3%
9.7% 13.8%
15.9% 22.8%
-5.0% 0.0% 5.0% 10.0% 15.0% 20.0% 25.0%
SKU 1
SKU 2
SKU 3
SKU 4
SKU 5
SKU 6
SKU 7
SKU 8
SKU 9
SKU 10
SKU 11
SKU 12
SKU 13
SKU 14
SKU 15
SKU 16
SKU 17
SKU 18
Net Margin Yield Impact % Due to Pricing
Retail Sales Impact %
18
And similarly, a few SKUs tend to drive most of the profit impact due to pricing
Copyright 2013 Bottom Line Analytics All rights reserved.
Content
19
Forward, Objectives & Destination
Destination: The 6 Step Process
1. The importance of analytics
a) Developing a Predictive Model
b) Deriving Price Elasticity Curves with Competitive Effects
c) Measuring the Volume Drivers and Variances
d) The Importance of Determining the Sales and Profit Impact by SKU
e) Price Sensitivity by Market and Channel
f) Macro-Economic impacts on the business
g) Identifying the Critical SKUs for Pricing Success
h) Price Simulation, Profit Optimization and Scenario Planning
Copyright 2013 Bottom Line Analytics All rights reserved.
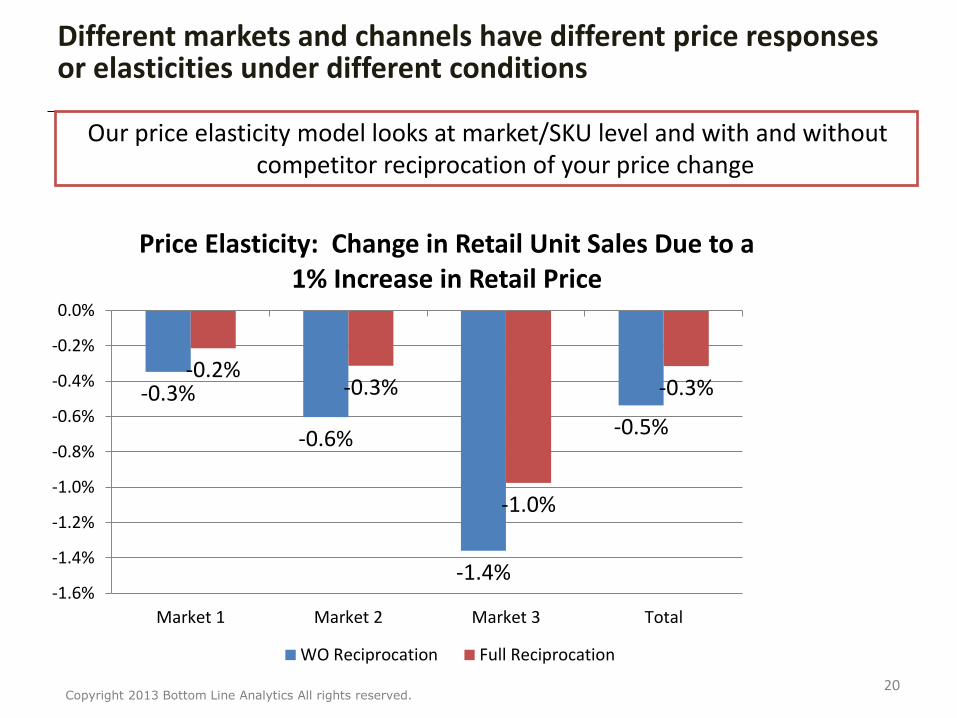
Different markets and channels have different price responses or elasticities under different conditions
-0.3%
-0.6%
-1.4%
-0.5%
-0.2% -0.3%
-1.0%
-0.3%
-1.6%
-1.4%
-1.2%
-1.0%
-0.8%
-0.6%
-0.4%
-0.2%
0.0%
Market 1 Market 2 Market 3 Total
Price Elasticity: Change in Retail Unit Sales Due to a 1% Increase in Retail Price
WO Reciprocation Full Reciprocation
20
Our price elasticity model looks at market/SKU level and with and without competitor reciprocation of your price change
Copyright 2013 Bottom Line Analytics All rights reserved.
Content
21
Forward, Objectives & Destination
Destination: The 6 Step Process
1. The importance of analytics
a) Developing a Predictive Model
b) Deriving Price Elasticity Curves with Competitive Effects
c) Measuring the Volume Drivers and Variances
d) The Importance of Determining the Sales and Profit Impact by SKU
e) Price Sensitivity by Market and Channel
f) Macro-Economic impacts on the business
g) Identifying the Critical SKUs for Pricing Success
h) Price Simulation, Profit Optimization and Scenario Planning
Copyright 2013 Bottom Line Analytics All rights reserved.
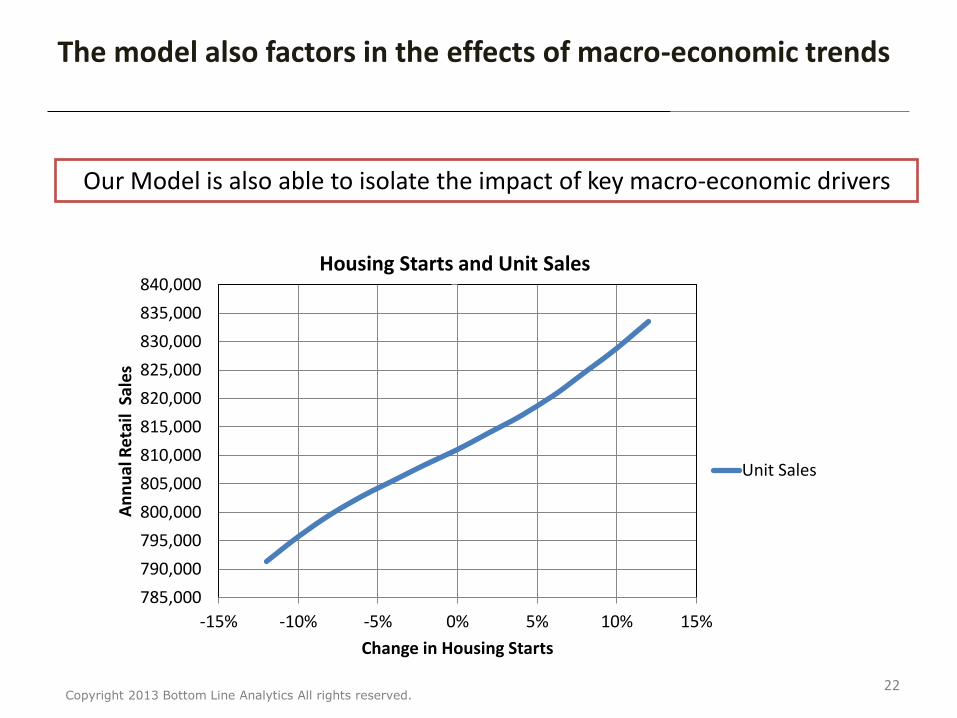
The model also factors in the effects of macro-economic trends
785,000
790,000
795,000
800,000
805,000
810,000
815,000
820,000
825,000
830,000
835,000
840,000
-15% -10% -5% 0% 5% 10% 15%
An
nu
al R
etai
l Sa
les
Change in Housing Starts
Housing Starts and Unit Sales
Unit Sales
22
Our Model is also able to isolate the impact of key macro-economic drivers
Copyright 2013 Bottom Line Analytics All rights reserved.
Content
23
Forward, Objectives & Destination
Destination: The 6 Step Process
1. The importance of analytics
a) Developing a Predictive Model
b) Deriving Price Elasticity Curves with Competitive Effects
c) Measuring the Volume Drivers and Variances
d) The Importance of Determining the Sales and Profit Impact by SKU
e) Price Sensitivity by Market and Channel
f) Macro-Economic impacts on the business
g) Identifying the Critical SKUs for Pricing Success
h) Price Simulation, Profit Optimization and Scenario Planning
Copyright 2013 Bottom Line Analytics All rights reserved.
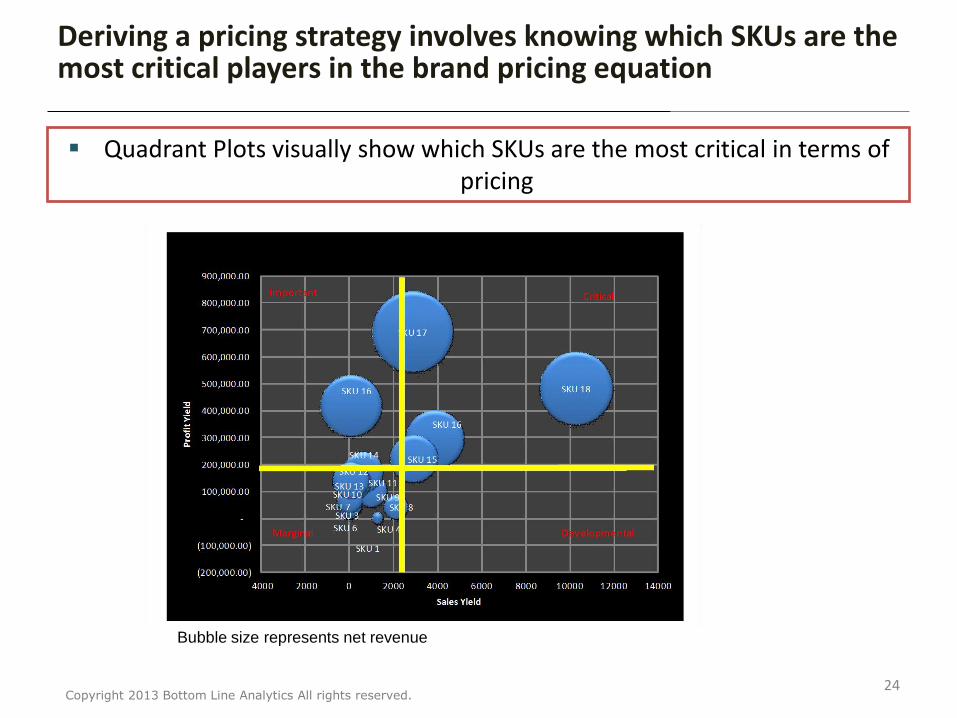
Deriving a pricing strategy involves knowing which SKUs are the most critical players in the brand pricing equation
24
Quadrant Plots visually show which SKUs are the most critical in terms of pricing
Bubble size represents net revenue
Copyright 2013 Bottom Line Analytics All rights reserved.
Content
25
Forward, Objectives & Destination
Destination: The 6 Step Process
1. The importance of analytics
a) Developing a Predictive Model
b) Deriving Price Elasticity Curves with Competitive Effects
c) Measuring the Volume Drivers and Variances
d) The Importance of Determining the Sales and Profit Impact by SKU
e) Price Sensitivity by Market and Channel
f) Macro-Economic impacts on the business
g) Identifying the Critical SKUs for Pricing Success
h) Price Simulation, Profit Optimization and Scenario Planning
Copyright 2013 Bottom Line Analytics All rights reserved.
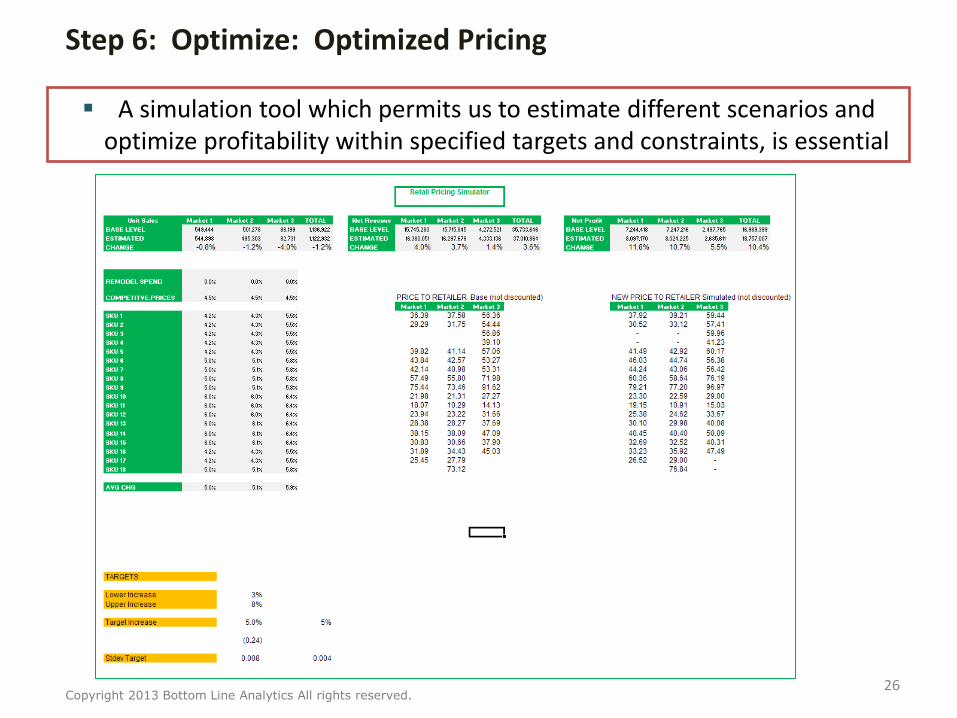
Step 6: Optimize: Optimized Pricing
26
A simulation tool which permits us to estimate different scenarios and optimize profitability within specified targets and constraints, is essential
Copyright 2013 Bottom Line Analytics All rights reserved.
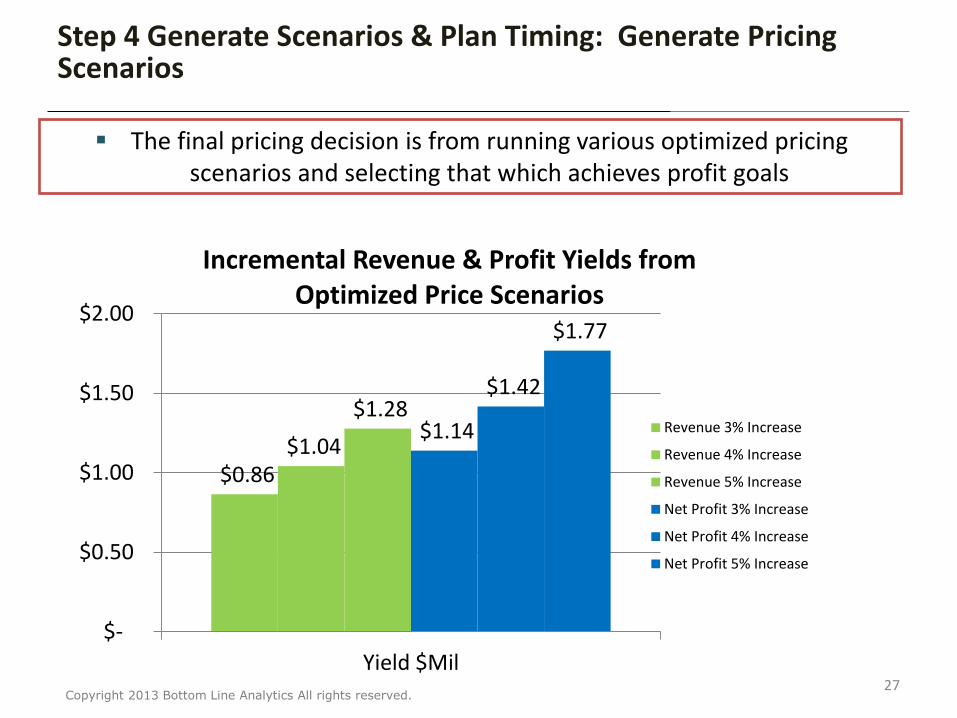
Step 4 Generate Scenarios & Plan Timing: Generate Pricing Scenarios
$0.86 $1.04
$1.28 $1.14
$1.42
$1.77
$-
$0.50
$1.00
$1.50
$2.00
Yield $Mil
Incremental Revenue & Profit Yields from Optimized Price Scenarios
Revenue 3% Increase
Revenue 4% Increase
Revenue 5% Increase
Net Profit 3% Increase
Net Profit 4% Increase
Net Profit 5% Increase
27
The final pricing decision is from running various optimized pricing scenarios and selecting that which achieves profit goals
Copyright 2013 Bottom Line Analytics All rights reserved.
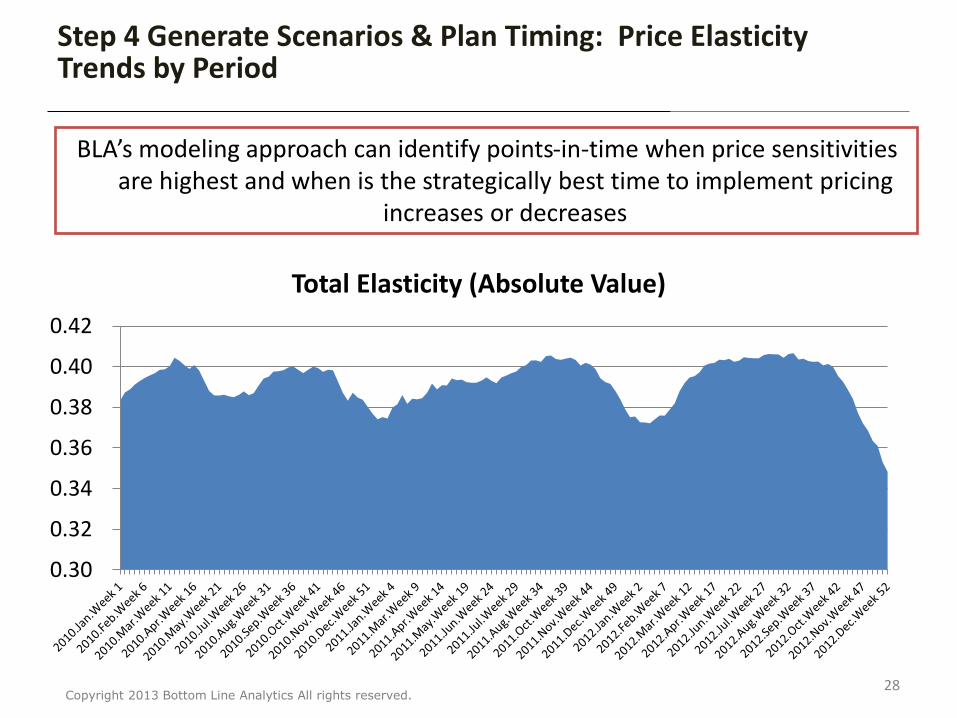
Step 4 Generate Scenarios & Plan Timing: Price Elasticity Trends by Period
0.30
0.32
0.34
0.36
0.38
0.40
0.42
Total Elasticity (Absolute Value)
28
BLA’s modeling approach can identify points-in-time when price sensitivities are highest and when is the strategically best time to implement pricing
increases or decreases
Copyright 2013 Bottom Line Analytics All rights reserved.
Contact Us
29
Michael Wolfe [email protected]
David Weinberger [email protected]
770-649-0472 678-314-8446 (m)
770-485-0270 (o)
www.bottomlineanalytics.com
Masood Akhtar [email protected]
+44 7970 789 663