Embed Size (px)
Citation preview
Current Issues Germany
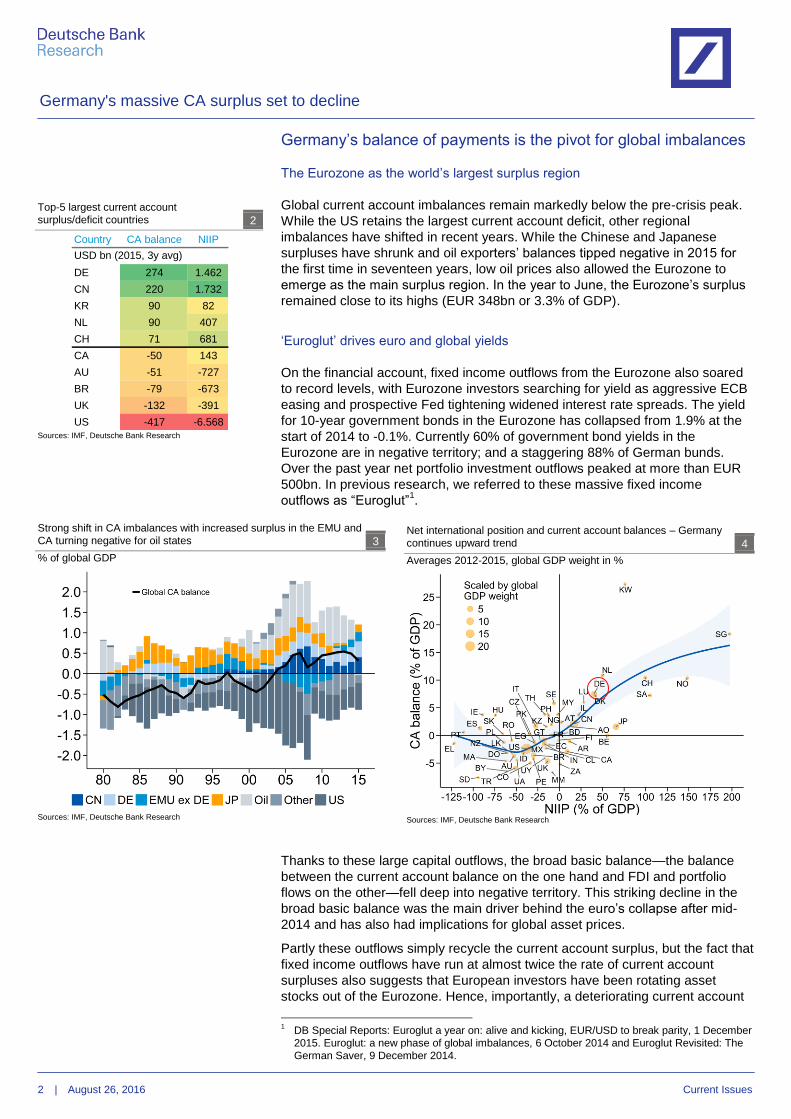
— The Eurozone’s current account (CA) surplus has lent some support to the
euro over the past two years at a time of relentless Fixed income outflows.
Germany is pivotal, as it accounts for 60% of the surplus. This report argues
that the German surplus is likely to weaken by about 20% to 7% of GDP by
the end of the decade.
— Since the rotation of fixed income assets out of Europe is likely to continue –
a dynamic we have referred to as ‘Euroglut’ – the balance of payments
should therefore become even more bearish for the euro.
— Unfavourable demographic trends and the domestic housing boom will be
most detrimental to the surplus. Both factors will lower household saving
ratios and are likely to result in higher import demand. As a new factor to
this mix, record levels of immigration will accelerate the decline. Directly, it
will raise import demand for foreign goods as well as remittances into home
countries. Indirectly, the integration in the housing market is likely to cement
excess demand for years to come and help drive real estate prices higher.
— Externally, accelerating global growth relative to Germany’s cycle will
benefit net export demand, but the net effect will be limited by the fact that
global trade will probably remain subdued. The aftermath of ‘Brexit’ and
weak demand from oil-exporting economies are particularly concerning for
German exporters.
— While our results are model-driven, we also provide deep dives into the
main drivers of the German current account: the housing market,
international trade and demographic change, including migration.
Authors
Heiko Peters
+49 69 910-21548
Robin Winkler
+44 20 754-71841
Editor
Stefan Schneider
Deutsche Bank AG
Deutsche Bank Research
Frankfurt am Main
Germany
E-mail: [email protected]
Fax: +49 69 910-31877
www.dbresearch.com
Content Page
Germany’s balance of payments is the pivot for global imbalances ......................................2
Our model points to a significant decline in the German surplus ........................................5
(1) International trade headwinds hamper export outlook .................................................8
(2) Rising import demand from accelerating housing boom ............................................... 10
(3) Ageing of the German population set to reduce the high savings rate of the households ................................................... 18
Conclusion .................................................... 21
Appendix ...................................................... 22
Germany’s CA surplus set to fall by 20% due to demography, housing boom and slowing
globalisation 1
% of GDP %, pp
Source: Deutsche Bank Research
August 26, 2016
Germany's massive CA surplus set to decline
-4
-2
0
2
4
6
8
10
95 99 03 07 11 15 19
DBe
-25
-20
-15
-10
-5
0
5
10Global cycle
Demography
Housingmarket
Global value chains
Total (%)
Germany's massive CA surplus set to decline
2 | August 26, 2016 Current Issues
Germany’s balance of payments is the pivot for global imbalances
The Eurozone as the world’s largest surplus region
Global current account imbalances remain markedly below the pre-crisis peak.
While the US retains the largest current account deficit, other regional
imbalances have shifted in recent years. While the Chinese and Japanese
surpluses have shrunk and oil exporters’ balances tipped negative in 2015 for
the first time in seventeen years, low oil prices also allowed the Eurozone to
emerge as the main surplus region. In the year to June, the Eurozone’s surplus
remained close to its highs (EUR 348bn or 3.3% of GDP).
‘Euroglut’ drives euro and global yields
On the financial account, fixed income outflows from the Eurozone also soared
to record levels, with Eurozone investors searching for yield as aggressive ECB
easing and prospective Fed tightening widened interest rate spreads. The yield
for 10-year government bonds in the Eurozone has collapsed from 1.9% at the
start of 2014 to -0.1%. Currently 60% of government bond yields in the
Eurozone are in negative territory; and a staggering 88% of German bunds.
Over the past year net portfolio investment outflows peaked at more than EUR
500bn. In previous research, we referred to these massive fixed income
outflows as “Euroglut”1.
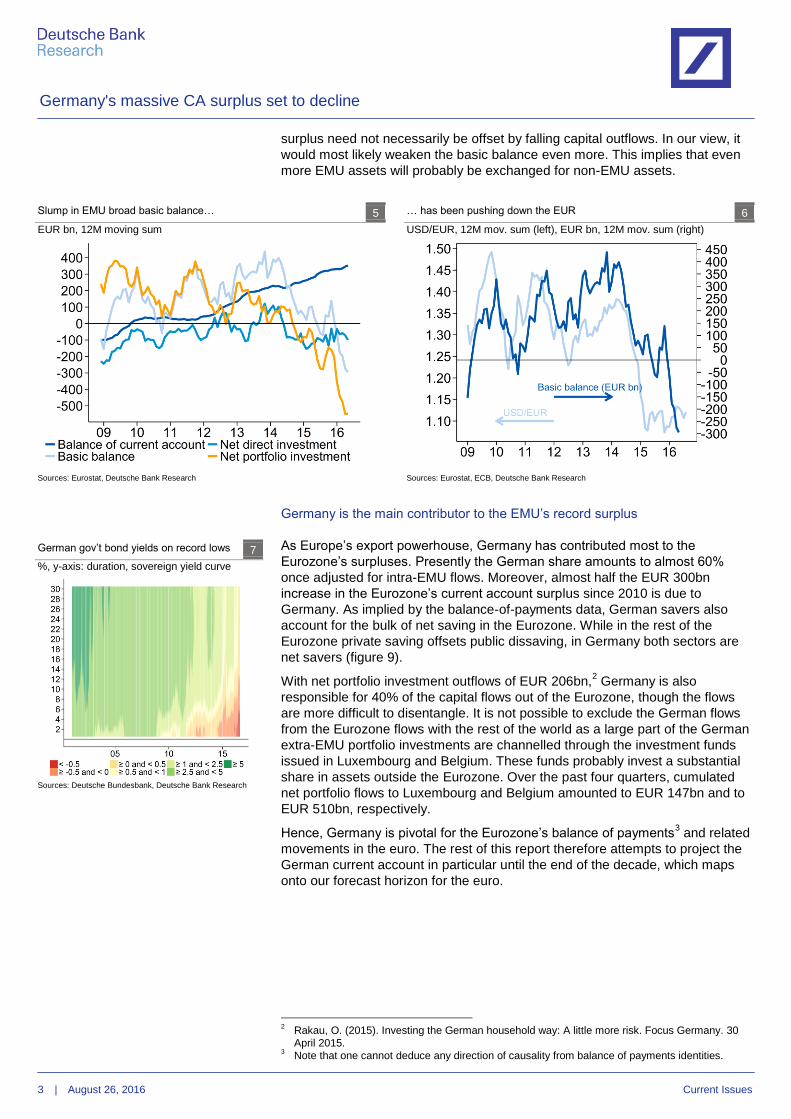
Thanks to these large capital outflows, the broad basic balance—the balance
between the current account balance on the one hand and FDI and portfolio
flows on the other—fell deep into negative territory. This striking decline in the
broad basic balance was the main driver behind the euro’s collapse after mid-
2014 and has also had implications for global asset prices.
Partly these outflows simply recycle the current account surplus, but the fact that
fixed income outflows have run at almost twice the rate of current account
surpluses also suggests that European investors have been rotating asset
stocks out of the Eurozone. Hence, importantly, a deteriorating current account
1 DB Special Reports: Euroglut a year on: alive and kicking, EUR/USD to break parity, 1 December
2015. Euroglut: a new phase of global imbalances, 6 October 2014 and Euroglut Revisited: The
German Saver, 9 December 2014.
Top-5 largest current account
surplus/deficit countries 2
Sources: IMF, Deutsche Bank Research
Strong shift in CA imbalances with increased surplus in the EMU and
CA turning negative for oil states 3
% of global GDP
Sources: IMF, Deutsche Bank Research
Net international position and current account balances – Germany
continues upward trend 4
Averages 2012-2015, global GDP weight in %
Sources: IMF, Deutsche Bank Research
Country CA balance NIIP
DE 274 1.462
CN 220 1.732
KR 90 82
NL 90 407
CH 71 681
CA -50 143
AU -51 -727
BR -79 -673
UK -132 -391
US -417 -6.568
USD bn (2015, 3y avg)
Germany's massive CA surplus set to decline
3 | August 26, 2016 Current Issues
surplus need not necessarily be offset by falling capital outflows. In our view, it
would most likely weaken the basic balance even more. This implies that even
more EMU assets will probably be exchanged for non-EMU assets.
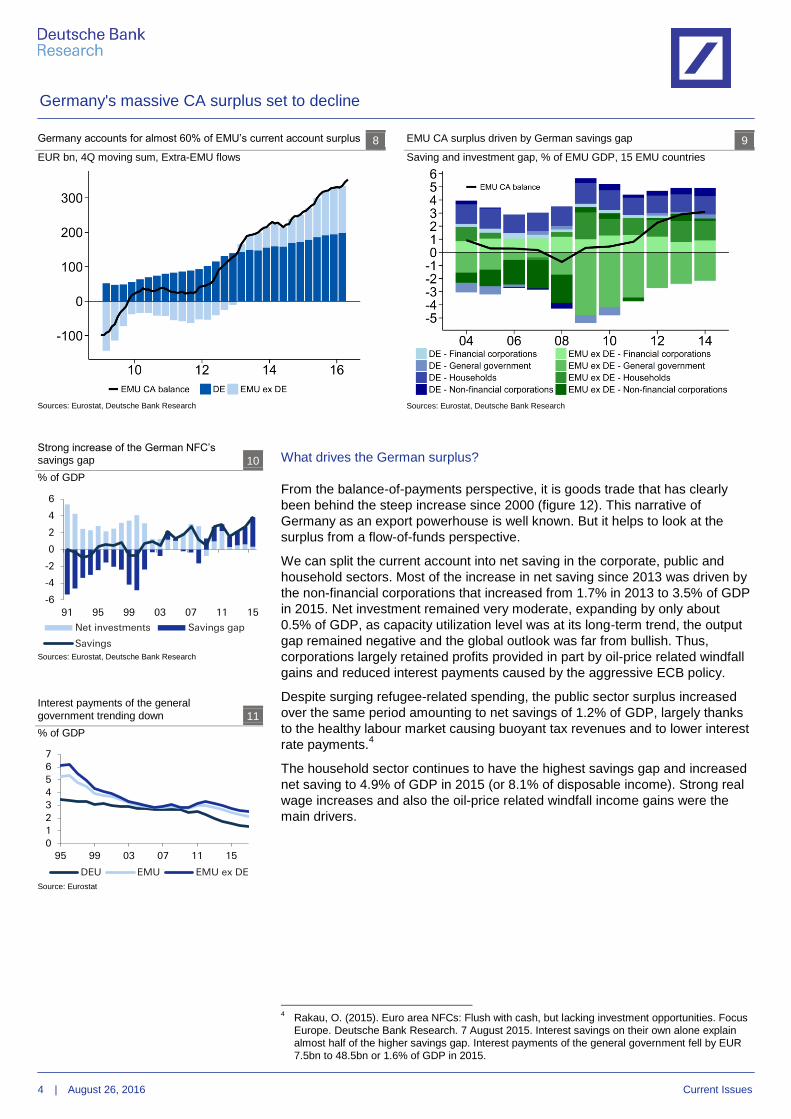
Germany is the main contributor to the EMU’s record surplus
As Europe’s export powerhouse, Germany has contributed most to the
Eurozone’s surpluses. Presently the German share amounts to almost 60%
once adjusted for intra-EMU flows. Moreover, almost half the EUR 300bn
increase in the Eurozone’s current account surplus since 2010 is due to
Germany. As implied by the balance-of-payments data, German savers also
account for the bulk of net saving in the Eurozone. While in the rest of the
Eurozone private saving offsets public dissaving, in Germany both sectors are
net savers (figure 9).
With net portfolio investment outflows of EUR 206bn,2 Germany is also
responsible for 40% of the capital flows out of the Eurozone, though the flows
are more difficult to disentangle. It is not possible to exclude the German flows
from the Eurozone flows with the rest of the world as a large part of the German
extra-EMU portfolio investments are channelled through the investment funds
issued in Luxembourg and Belgium. These funds probably invest a substantial
share in assets outside the Eurozone. Over the past four quarters, cumulated
net portfolio flows to Luxembourg and Belgium amounted to EUR 147bn and to
EUR 510bn, respectively.
Hence, Germany is pivotal for the Eurozone’s balance of payments3 and related
movements in the euro. The rest of this report therefore attempts to project the
German current account in particular until the end of the decade, which maps
onto our forecast horizon for the euro.
2 Rakau, O. (2015). Investing the German household way: A little more risk. Focus Germany. 30
April 2015. 3 Note that one cannot deduce any direction of causality from balance of payments identities.
… has been pushing down the EUR 6
USD/EUR, 12M mov. sum (left), EUR bn, 12M mov. sum (right)
Sources: Eurostat, ECB, Deutsche Bank Research
Slump in EMU broad basic balance… 5
EUR bn, 12M moving sum
Sources: Eurostat, Deutsche Bank Research
German gov’t bond yields on record lows 7
%, y-axis: duration, sovereign yield curve
Sources: Deutsche Bundesbank, Deutsche Bank Research
Germany's massive CA surplus set to decline
4 | August 26, 2016 Current Issues
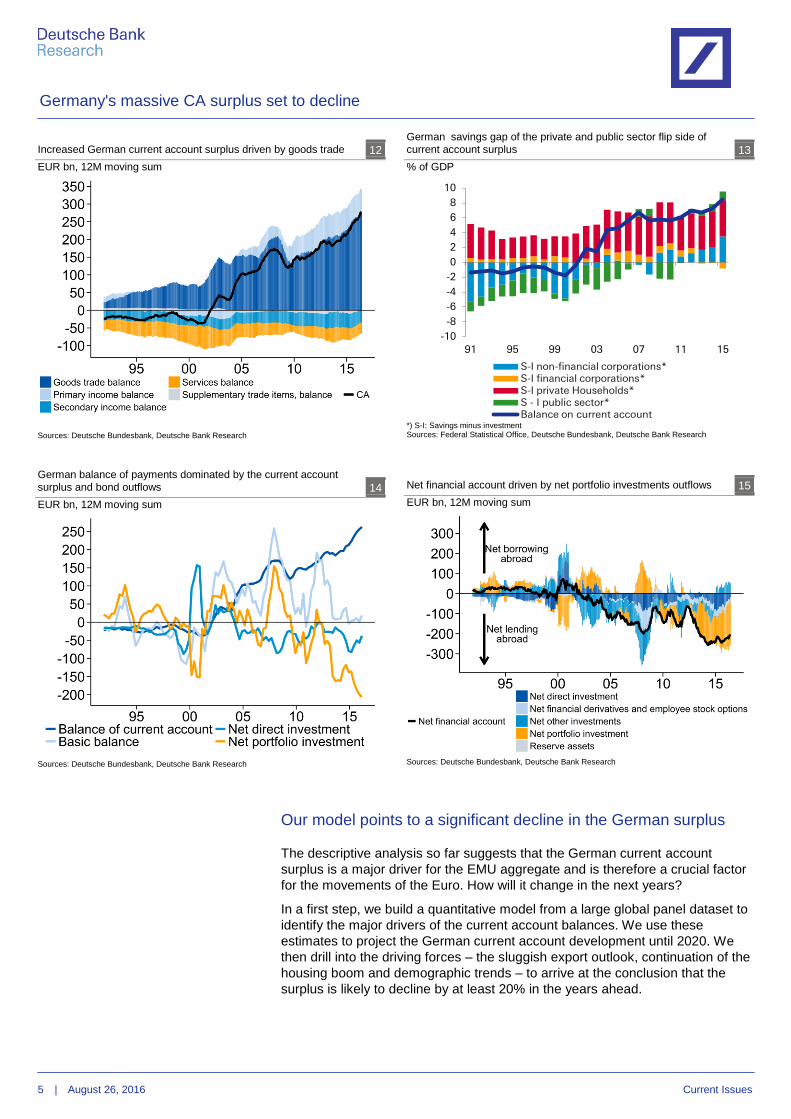
What drives the German surplus?
From the balance-of-payments perspective, it is goods trade that has clearly
been behind the steep increase since 2000 (figure 12). This narrative of
Germany as an export powerhouse is well known. But it helps to look at the
surplus from a flow-of-funds perspective.
We can split the current account into net saving in the corporate, public and
household sectors. Most of the increase in net saving since 2013 was driven by
the non-financial corporations that increased from 1.7% in 2013 to 3.5% of GDP
in 2015. Net investment remained very moderate, expanding by only about
0.5% of GDP, as capacity utilization level was at its long-term trend, the output
gap remained negative and the global outlook was far from bullish. Thus,
corporations largely retained profits provided in part by oil-price related windfall
gains and reduced interest payments caused by the aggressive ECB policy.
Despite surging refugee-related spending, the public sector surplus increased
over the same period amounting to net savings of 1.2% of GDP, largely thanks
to the healthy labour market causing buoyant tax revenues and to lower interest
rate payments.4
The household sector continues to have the highest savings gap and increased
net saving to 4.9% of GDP in 2015 (or 8.1% of disposable income). Strong real
wage increases and also the oil-price related windfall income gains were the
main drivers.
4 Rakau, O. (2015). Euro area NFCs: Flush with cash, but lacking investment opportunities. Focus
Europe. Deutsche Bank Research. 7 August 2015. Interest savings on their own alone explain
almost half of the higher savings gap. Interest payments of the general government fell by EUR
7.5bn to 48.5bn or 1.6% of GDP in 2015.
Germany accounts for almost 60% of EMU’s current account surplus 8
EUR bn, 4Q moving sum, Extra-EMU flows
Sources: Eurostat, Deutsche Bank Research
EMU CA surplus driven by German savings gap 9
Saving and investment gap, % of EMU GDP, 15 EMU countries
Sources: Eurostat, Deutsche Bank Research
Strong increase of the German NFC’s
savings gap 10
% of GDP
Sources: Eurostat, Deutsche Bank Research
Interest payments of the general
government trending down 11
% of GDP
Source: Eurostat
-6
-4
-2
0
2
4
6
91 95 99 03 07 11 15
Net investments Savings gap
Savings
0
1
2
3
4
5
6
7
95 99 03 07 11 15
DEU EMU EMU ex DE
Germany's massive CA surplus set to decline
5 | August 26, 2016 Current Issues
Our model points to a significant decline in the German surplus
The descriptive analysis so far suggests that the German current account
surplus is a major driver for the EMU aggregate and is therefore a crucial factor
for the movements of the Euro. How will it change in the next years?
In a first step, we build a quantitative model from a large global panel dataset to
identify the major drivers of the current account balances. We use these
estimates to project the German current account development until 2020. We
then drill into the driving forces – the sluggish export outlook, continuation of the
housing boom and demographic trends – to arrive at the conclusion that the
surplus is likely to decline by at least 20% in the years ahead.
Increased German current account surplus driven by goods trade 12
EUR bn, 12M moving sum
Sources: Deutsche Bundesbank, Deutsche Bank Research
German savings gap of the private and public sector flip side of
current account surplus 13
% of GDP
*) S-I: Savings minus investment Sources: Federal Statistical Office, Deutsche Bundesbank, Deutsche Bank Research
German balance of payments dominated by the current account
surplus and bond outflows 14
EUR bn, 12M moving sum
Sources: Deutsche Bundesbank, Deutsche Bank Research
Net financial account driven by net portfolio investments outflows 15
EUR bn, 12M moving sum
Sources: Deutsche Bundesbank, Deutsche Bank Research
-10
-8
-6
-4
-2
0
2
4
6
8
10
91 95 99 03 07 11 15
S-I non-financial corporations*S-I financial corporations*S-I private Households*S - I public sector*Balance on current account
Germany's massive CA surplus set to decline
6 | August 26, 2016 Current Issues
Our current account model is basically an improved version of the IMF’s
External Balance Assessment (EBA) and uses the IMF dataset, which
comprises 49 countries accounting for 90% of global GDP between 1986 and
2015.5 The main variables are financial, cyclical, and policy-related.
6 Our
improvement is twofold. First, we add house prices, for reasons we explain in
the next section. Second, we account for changes in global value chains since
the early 1990s.7 Including these variables improves the fit of the model and, in
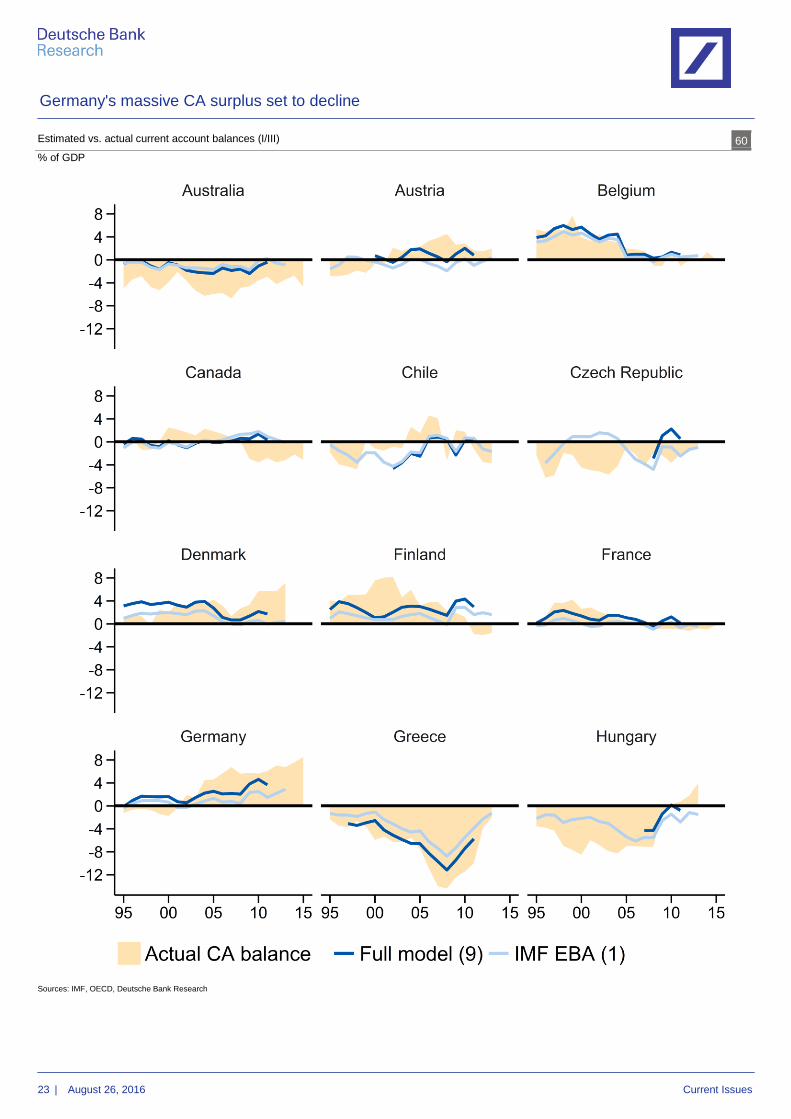
our view, captures current account dynamics more realistically (see figures 60 to
62 in the appendix for a comparison of the estimated models).
A global panel data model has the advantage of fully using information from
across countries. There are, however, also some limitations due to the possible
presence of structural breaks, nonlinearities and issues with the interpretation of
the residual, which could be due to policy distortions, uncaptured fundamentals
or limitations of the empirical model (as measurement or sampling errors or
possible misspecification).8
The comprehensive panel regressions (Full model (9) in figures 58 and 59)
show that:
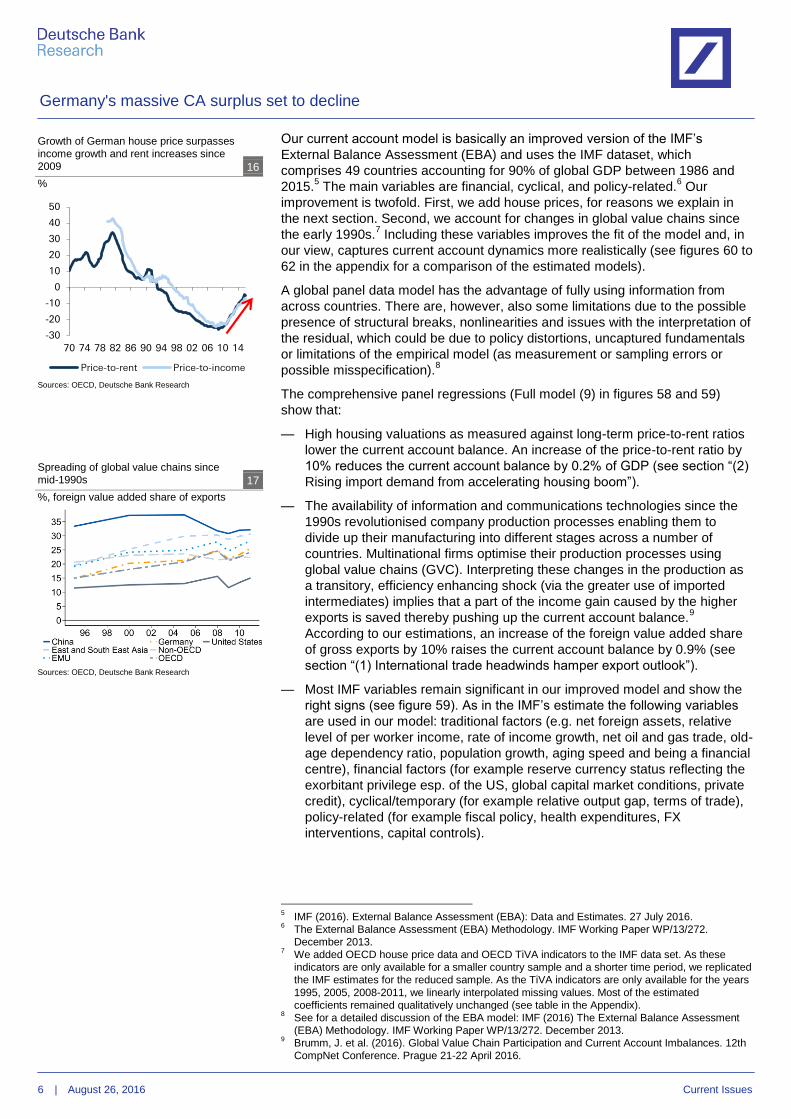
— High housing valuations as measured against long-term price-to-rent ratios
lower the current account balance. An increase of the price-to-rent ratio by
10% reduces the current account balance by 0.2% of GDP (see section “(2)
Rising import demand from accelerating housing boom”).
— The availability of information and communications technologies since the
1990s revolutionised company production processes enabling them to
divide up their manufacturing into different stages across a number of
countries. Multinational firms optimise their production processes using
global value chains (GVC). Interpreting these changes in the production as
a transitory, efficiency enhancing shock (via the greater use of imported
intermediates) implies that a part of the income gain caused by the higher
exports is saved thereby pushing up the current account balance.9
According to our estimations, an increase of the foreign value added share
of gross exports by 10% raises the current account balance by 0.9% (see
section “(1) International trade headwinds hamper export outlook”).
— Most IMF variables remain significant in our improved model and show the
right signs (see figure 59). As in the IMF’s estimate the following variables
are used in our model: traditional factors (e.g. net foreign assets, relative
level of per worker income, rate of income growth, net oil and gas trade, old-
age dependency ratio, population growth, aging speed and being a financial
centre), financial factors (for example reserve currency status reflecting the
exorbitant privilege esp. of the US, global capital market conditions, private
credit), cyclical/temporary (for example relative output gap, terms of trade),
policy-related (for example fiscal policy, health expenditures, FX
interventions, capital controls).
5 IMF (2016). External Balance Assessment (EBA): Data and Estimates. 27 July 2016.
6 The External Balance Assessment (EBA) Methodology. IMF Working Paper WP/13/272.
December 2013. 7 We added OECD house price data and OECD TiVA indicators to the IMF data set. As these
indicators are only available for a smaller country sample and a shorter time period, we replicated
the IMF estimates for the reduced sample. As the TiVA indicators are only available for the years
1995, 2005, 2008-2011, we linearly interpolated missing values. Most of the estimated
coefficients remained qualitatively unchanged (see table in the Appendix). 8 See for a detailed discussion of the EBA model: IMF (2016) The External Balance Assessment
(EBA) Methodology. IMF Working Paper WP/13/272. December 2013. 9 Brumm, J. et al. (2016). Global Value Chain Participation and Current Account Imbalances. 12th
CompNet Conference. Prague 21-22 April 2016.
Growth of German house price surpasses
income growth and rent increases since
2009 16
%
Sources: OECD, Deutsche Bank Research
Spreading of global value chains since
mid-1990s 17
%, foreign value added share of exports
Sources: OECD, Deutsche Bank Research
-30
-20
-10
0
10
20
30
40
50
70 74 78 82 86 90 94 98 02 06 10 14
Price-to-rent Price-to-income
Germany's massive CA surplus set to decline
7 | August 26, 2016 Current Issues
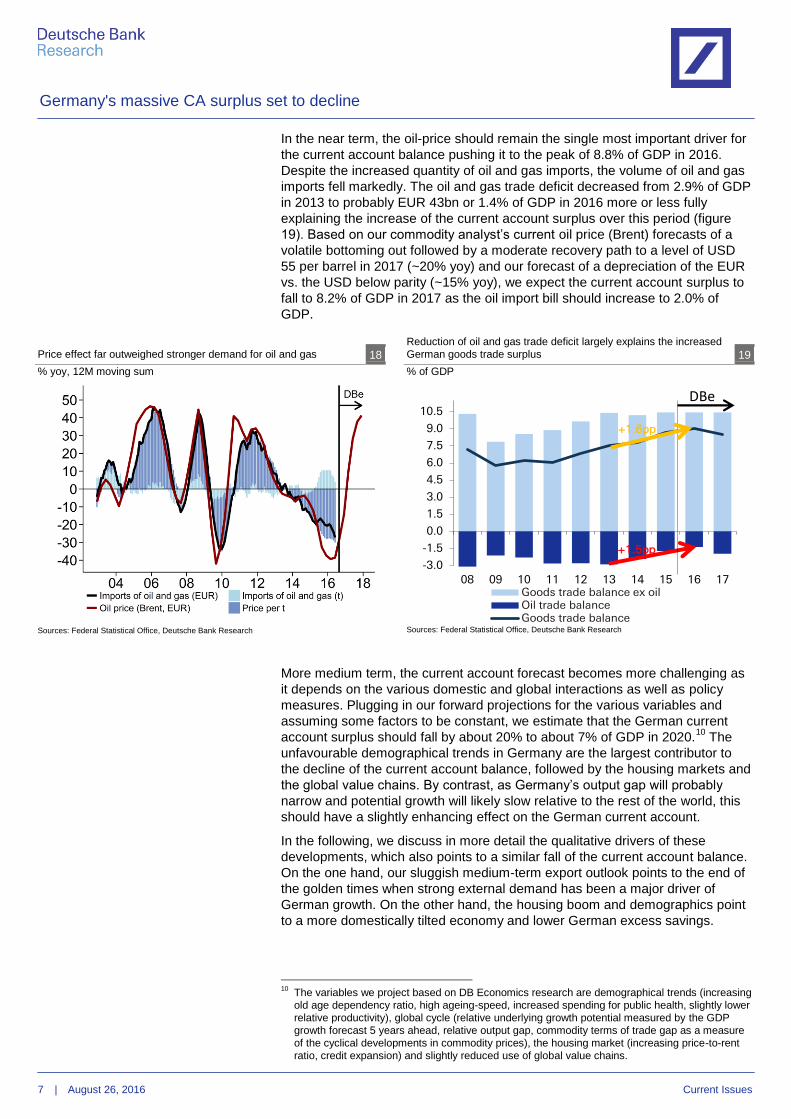
In the near term, the oil-price should remain the single most important driver for
the current account balance pushing it to the peak of 8.8% of GDP in 2016.
Despite the increased quantity of oil and gas imports, the volume of oil and gas
imports fell markedly. The oil and gas trade deficit decreased from 2.9% of GDP
in 2013 to probably EUR 43bn or 1.4% of GDP in 2016 more or less fully
explaining the increase of the current account surplus over this period (figure
19). Based on our commodity analyst’s current oil price (Brent) forecasts of a
volatile bottoming out followed by a moderate recovery path to a level of USD
55 per barrel in 2017 (~20% yoy) and our forecast of a depreciation of the EUR
vs. the USD below parity (~15% yoy), we expect the current account surplus to
fall to 8.2% of GDP in 2017 as the oil import bill should increase to 2.0% of
GDP.
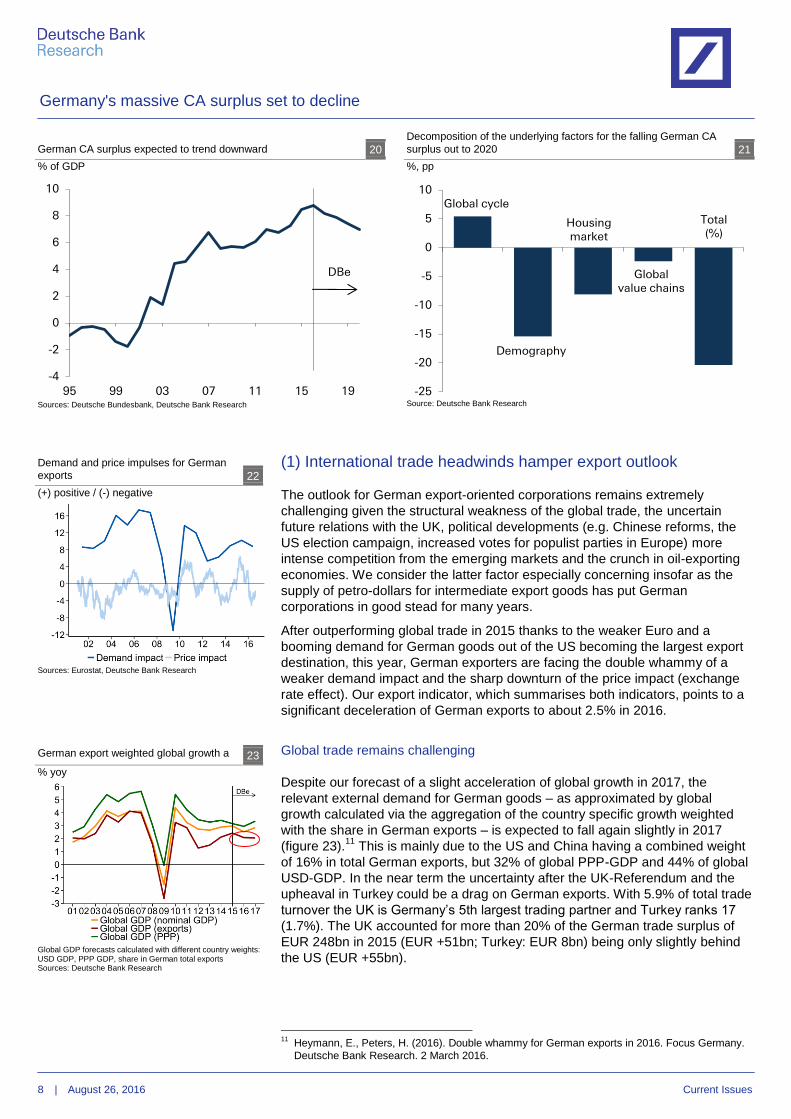
More medium term, the current account forecast becomes more challenging as
it depends on the various domestic and global interactions as well as policy
measures. Plugging in our forward projections for the various variables and
assuming some factors to be constant, we estimate that the German current
account surplus should fall by about 20% to about 7% of GDP in 2020.10
The
unfavourable demographical trends in Germany are the largest contributor to
the decline of the current account balance, followed by the housing markets and
the global value chains. By contrast, as Germany’s output gap will probably
narrow and potential growth will likely slow relative to the rest of the world, this
should have a slightly enhancing effect on the German current account.
In the following, we discuss in more detail the qualitative drivers of these
developments, which also points to a similar fall of the current account balance.
On the one hand, our sluggish medium-term export outlook points to the end of
the golden times when strong external demand has been a major driver of
German growth. On the other hand, the housing boom and demographics point
to a more domestically tilted economy and lower German excess savings.
10
The variables we project based on DB Economics research are demographical trends (increasing
old age dependency ratio, high ageing-speed, increased spending for public health, slightly lower
relative productivity), global cycle (relative underlying growth potential measured by the GDP
growth forecast 5 years ahead, relative output gap, commodity terms of trade gap as a measure
of the cyclical developments in commodity prices), the housing market (increasing price-to-rent
ratio, credit expansion) and slightly reduced use of global value chains.
Price effect far outweighed stronger demand for oil and gas 18
% yoy, 12M moving sum
Sources: Federal Statistical Office, Deutsche Bank Research
Reduction of oil and gas trade deficit largely explains the increased
German goods trade surplus 19
% of GDP
Sources: Federal Statistical Office, Deutsche Bank Research
-3.0
-1.5
0.0
1.5
3.0
4.5
6.0
7.5
9.0
10.5
08 09 10 11 12 13 14 15 16 17Goods trade balance ex oilOil trade balanceGoods trade balance
+1.5pp
DBe
+1.6pp
Germany's massive CA surplus set to decline
8 | August 26, 2016 Current Issues
(1) International trade headwinds hamper export outlook
The outlook for German export-oriented corporations remains extremely
challenging given the structural weakness of the global trade, the uncertain
future relations with the UK, political developments (e.g. Chinese reforms, the
US election campaign, increased votes for populist parties in Europe) more
intense competition from the emerging markets and the crunch in oil-exporting
economies. We consider the latter factor especially concerning insofar as the
supply of petro-dollars for intermediate export goods has put German
corporations in good stead for many years.
After outperforming global trade in 2015 thanks to the weaker Euro and a
booming demand for German goods out of the US becoming the largest export
destination, this year, German exporters are facing the double whammy of a
weaker demand impact and the sharp downturn of the price impact (exchange
rate effect). Our export indicator, which summarises both indicators, points to a
significant deceleration of German exports to about 2.5% in 2016.
Global trade remains challenging
Despite our forecast of a slight acceleration of global growth in 2017, the
relevant external demand for German goods – as approximated by global
growth calculated via the aggregation of the country specific growth weighted
with the share in German exports – is expected to fall again slightly in 2017
(figure 23).11
This is mainly due to the US and China having a combined weight
of 16% in total German exports, but 32% of global PPP-GDP and 44% of global
USD-GDP. In the near term the uncertainty after the UK-Referendum and the
upheaval in Turkey could be a drag on German exports. With 5.9% of total trade
turnover the UK is Germany’s 5th largest trading partner and Turkey ranks 17
(1.7%). The UK accounted for more than 20% of the German trade surplus of
EUR 248bn in 2015 (EUR +51bn; Turkey: EUR 8bn) being only slightly behind
the US (EUR +55bn).
11
Heymann, E., Peters, H. (2016). Double whammy for German exports in 2016. Focus Germany.
Deutsche Bank Research. 2 March 2016.
German CA surplus expected to trend downward 20
% of GDP
Sources: Deutsche Bundesbank, Deutsche Bank Research
Decomposition of the underlying factors for the falling German CA
surplus out to 2020 21
%, pp
Source: Deutsche Bank Research
Demand and price impulses for German
exports 22
(+) positive / (-) negative
Sources: Eurostat, Deutsche Bank Research
German export weighted global growth a 23
% yoy
Global GDP forecasts calculated with different country weights: USD GDP, PPP GDP, share in German total exports Sources: Deutsche Bank Research
-4
-2
0
2
4
6
8
10
95 99 03 07 11 15 19
DBe
-25
-20
-15
-10
-5
0
5
10Global cycle
Demography
Housingmarket
Global value chains
Total (%)
Germany's massive CA surplus set to decline
9 | August 26, 2016 Current Issues
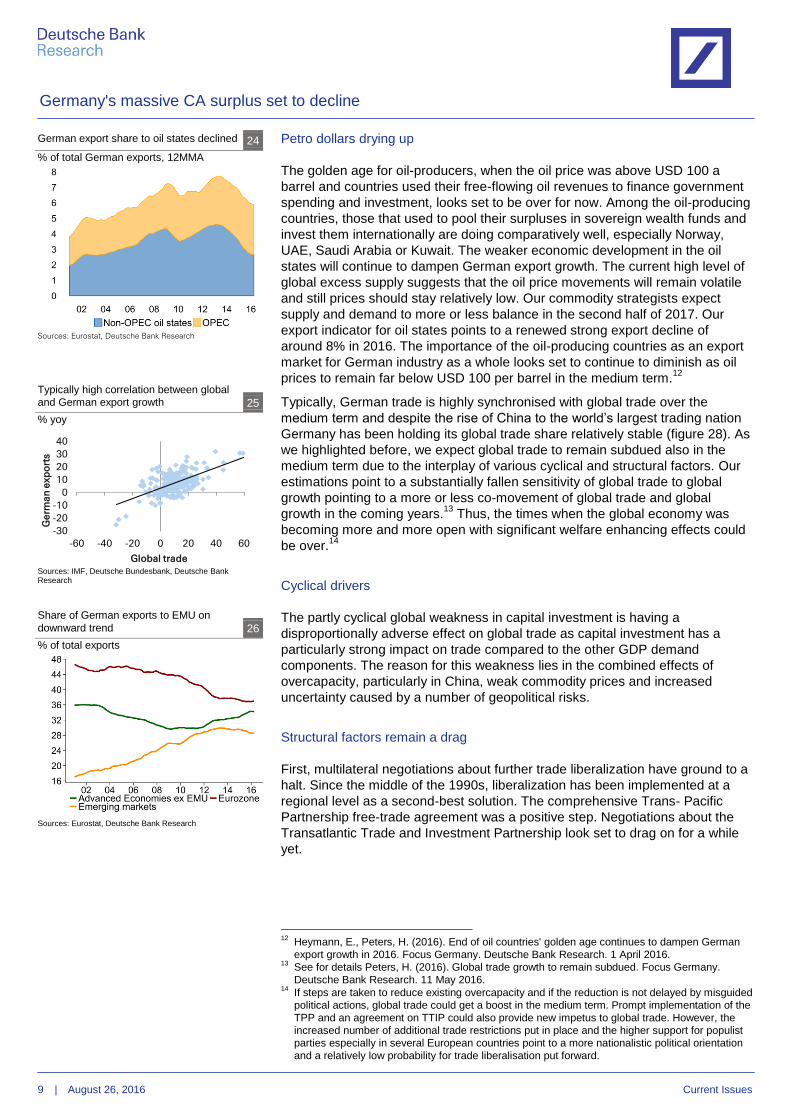
Petro dollars drying up
The golden age for oil-producers, when the oil price was above USD 100 a
barrel and countries used their free-flowing oil revenues to finance government
spending and investment, looks set to be over for now. Among the oil-producing
countries, those that used to pool their surpluses in sovereign wealth funds and
invest them internationally are doing comparatively well, especially Norway,
UAE, Saudi Arabia or Kuwait. The weaker economic development in the oil
states will continue to dampen German export growth. The current high level of
global excess supply suggests that the oil price movements will remain volatile
and still prices should stay relatively low. Our commodity strategists expect
supply and demand to more or less balance in the second half of 2017. Our
export indicator for oil states points to a renewed strong export decline of
around 8% in 2016. The importance of the oil-producing countries as an export
market for German industry as a whole looks set to continue to diminish as oil
prices to remain far below USD 100 per barrel in the medium term.12
Typically, German trade is highly synchronised with global trade over the
medium term and despite the rise of China to the world’s largest trading nation
Germany has been holding its global trade share relatively stable (figure 28). As
we highlighted before, we expect global trade to remain subdued also in the
medium term due to the interplay of various cyclical and structural factors. Our
estimations point to a substantially fallen sensitivity of global trade to global
growth pointing to a more or less co-movement of global trade and global
growth in the coming years.13
Thus, the times when the global economy was
becoming more and more open with significant welfare enhancing effects could
be over.14
Cyclical drivers
The partly cyclical global weakness in capital investment is having a
disproportionally adverse effect on global trade as capital investment has a
particularly strong impact on trade compared to the other GDP demand
components. The reason for this weakness lies in the combined effects of
overcapacity, particularly in China, weak commodity prices and increased
uncertainty caused by a number of geopolitical risks.
Structural factors remain a drag
First, multilateral negotiations about further trade liberalization have ground to a
halt. Since the middle of the 1990s, liberalization has been implemented at a
regional level as a second-best solution. The comprehensive Trans- Pacific
Partnership free-trade agreement was a positive step. Negotiations about the
Transatlantic Trade and Investment Partnership look set to drag on for a while
yet.
12
Heymann, E., Peters, H. (2016). End of oil countries' golden age continues to dampen German
export growth in 2016. Focus Germany. Deutsche Bank Research. 1 April 2016. 13
See for details Peters, H. (2016). Global trade growth to remain subdued. Focus Germany.
Deutsche Bank Research. 11 May 2016. 14
If steps are taken to reduce existing overcapacity and if the reduction is not delayed by misguided
political actions, global trade could get a boost in the medium term. Prompt implementation of the
TPP and an agreement on TTIP could also provide new impetus to global trade. However, the
increased number of additional trade restrictions put in place and the higher support for populist
parties especially in several European countries point to a more nationalistic political orientation
and a relatively low probability for trade liberalisation put forward.
German export share to oil states declined 24
% of total German exports, 12MMA
Sources: Eurostat, Deutsche Bank Research
Typically high correlation between global
and German export growth 25
% yoy
Sources: IMF, Deutsche Bundesbank, Deutsche Bank Research
Share of German exports to EMU on
downward trend 26
% of total exports
Sources: Eurostat, Deutsche Bank Research
-30
-20
-10
0
10
20
30
40
-60 -40 -20 0 20 40 60
Germ
an
exp
ort
s
Global trade
Germany's massive CA surplus set to decline
10 | August 26, 2016 Current Issues
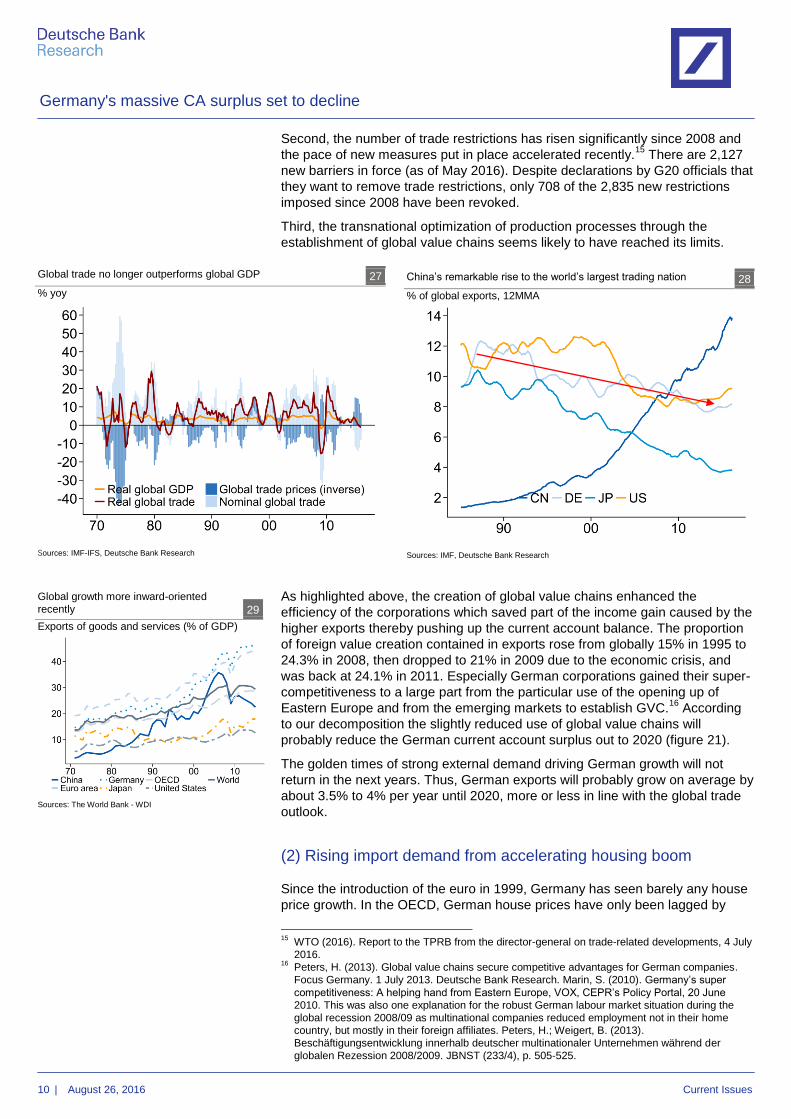
Second, the number of trade restrictions has risen significantly since 2008 and
the pace of new measures put in place accelerated recently.15
There are 2,127
new barriers in force (as of May 2016). Despite declarations by G20 officials that
they want to remove trade restrictions, only 708 of the 2,835 new restrictions
imposed since 2008 have been revoked.
Third, the transnational optimization of production processes through the
establishment of global value chains seems likely to have reached its limits.
As highlighted above, the creation of global value chains enhanced the
efficiency of the corporations which saved part of the income gain caused by the
higher exports thereby pushing up the current account balance. The proportion
of foreign value creation contained in exports rose from globally 15% in 1995 to
24.3% in 2008, then dropped to 21% in 2009 due to the economic crisis, and
was back at 24.1% in 2011. Especially German corporations gained their super-
competitiveness to a large part from the particular use of the opening up of
Eastern Europe and from the emerging markets to establish GVC.16
According
to our decomposition the slightly reduced use of global value chains will
probably reduce the German current account surplus out to 2020 (figure 21).
The golden times of strong external demand driving German growth will not
return in the next years. Thus, German exports will probably grow on average by
about 3.5% to 4% per year until 2020, more or less in line with the global trade
outlook.
(2) Rising import demand from accelerating housing boom
Since the introduction of the euro in 1999, Germany has seen barely any house
price growth. In the OECD, German house prices have only been lagged by
15
WTO (2016). Report to the TPRB from the director-general on trade-related developments, 4 July
2016. 16
Peters, H. (2013). Global value chains secure competitive advantages for German companies.
Focus Germany. 1 July 2013. Deutsche Bank Research. Marin, S. (2010). Germany’s super
competitiveness: A helping hand from Eastern Europe, VOX, CEPR’s Policy Portal, 20 June
2010. This was also one explanation for the robust German labour market situation during the
global recession 2008/09 as multinational companies reduced employment not in their home
country, but mostly in their foreign affiliates. Peters, H.; Weigert, B. (2013).
Beschäftigungsentwicklung innerhalb deutscher multinationaler Unternehmen während der
globalen Rezession 2008/2009. JBNST (233/4), p. 505-525.
Global trade no longer outperforms global GDP 27
% yoy
Sources: IMF-IFS, Deutsche Bank Research
China’s remarkable rise to the world’s largest trading nation 28
% of global exports, 12MMA
Sources: IMF, Deutsche Bank Research
Global growth more inward-oriented
recently 29
Exports of goods and services (% of GDP)
Sources: The World Bank - WDI
Germany's massive CA surplus set to decline
11 | August 26, 2016 Current Issues
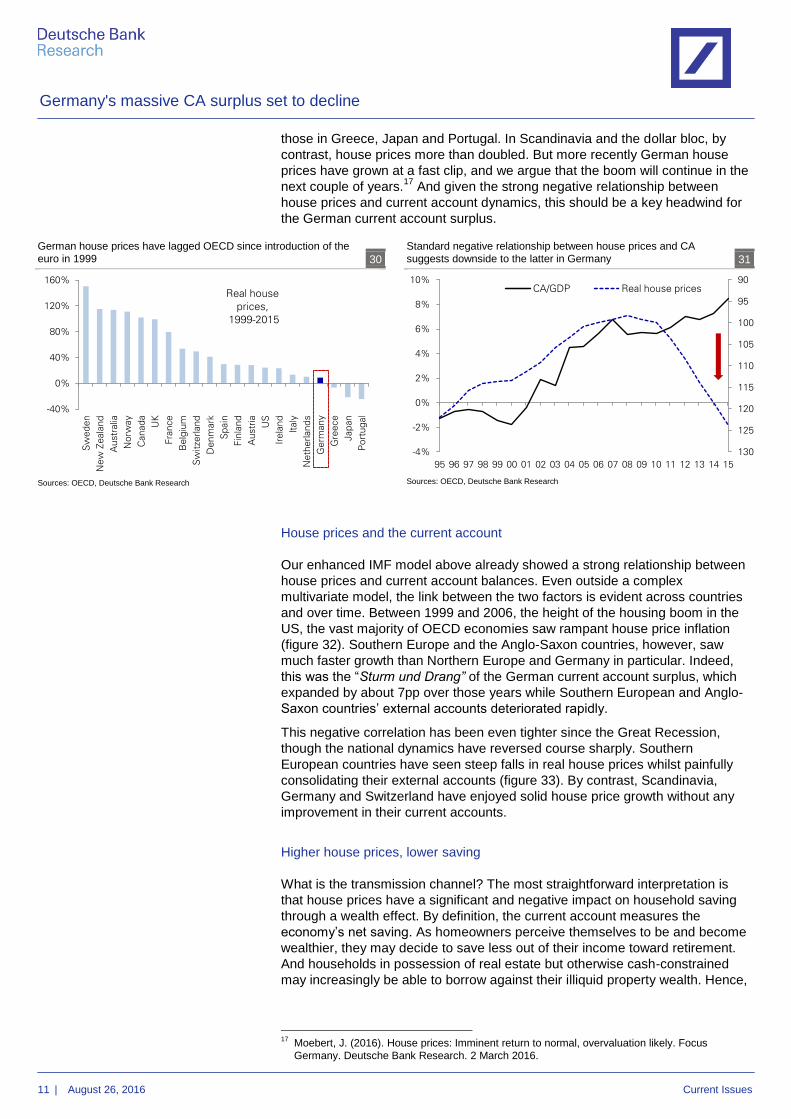
those in Greece, Japan and Portugal. In Scandinavia and the dollar bloc, by
contrast, house prices more than doubled. But more recently German house
prices have grown at a fast clip, and we argue that the boom will continue in the
next couple of years.17
And given the strong negative relationship between
house prices and current account dynamics, this should be a key headwind for
the German current account surplus.
House prices and the current account
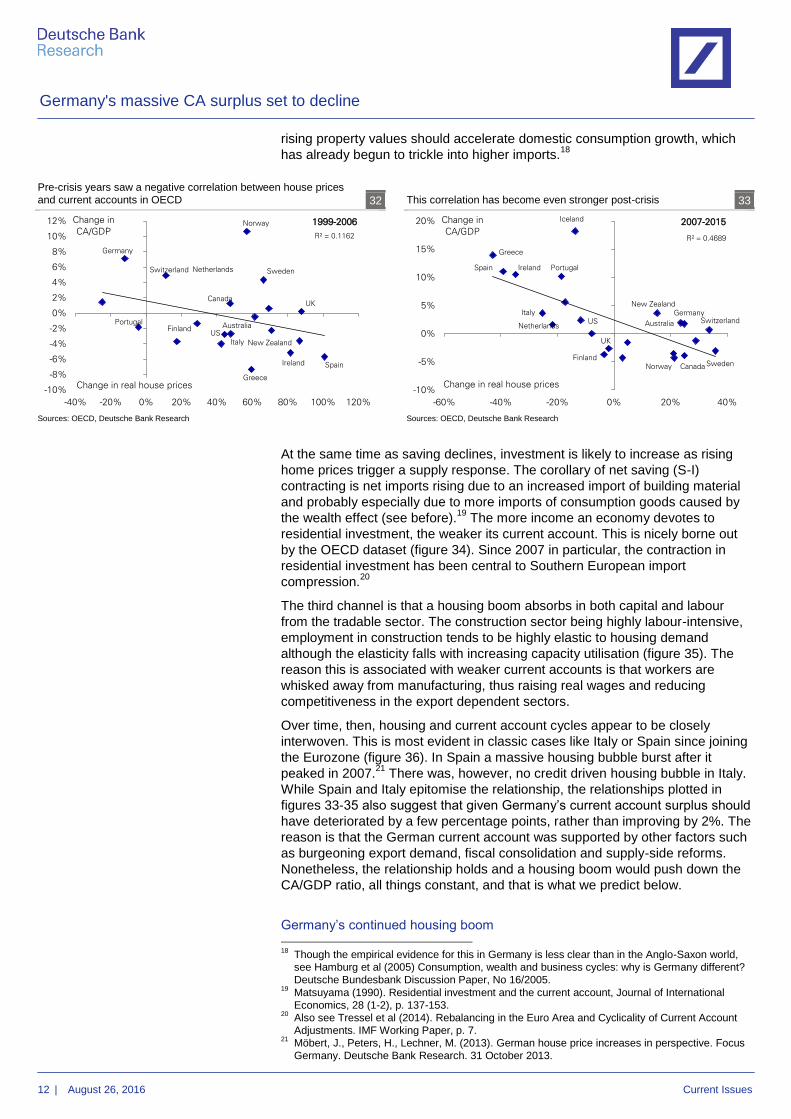
Our enhanced IMF model above already showed a strong relationship between
house prices and current account balances. Even outside a complex
multivariate model, the link between the two factors is evident across countries
and over time. Between 1999 and 2006, the height of the housing boom in the
US, the vast majority of OECD economies saw rampant house price inflation
(figure 32). Southern Europe and the Anglo-Saxon countries, however, saw
much faster growth than Northern Europe and Germany in particular. Indeed,
this was the “Sturm und Drang” of the German current account surplus, which
expanded by about 7pp over those years while Southern European and Anglo-
Saxon countries’ external accounts deteriorated rapidly.
This negative correlation has been even tighter since the Great Recession,
though the national dynamics have reversed course sharply. Southern
European countries have seen steep falls in real house prices whilst painfully
consolidating their external accounts (figure 33). By contrast, Scandinavia,
Germany and Switzerland have enjoyed solid house price growth without any
improvement in their current accounts.
Higher house prices, lower saving
What is the transmission channel? The most straightforward interpretation is
that house prices have a significant and negative impact on household saving
through a wealth effect. By definition, the current account measures the
economy’s net saving. As homeowners perceive themselves to be and become
wealthier, they may decide to save less out of their income toward retirement.
And households in possession of real estate but otherwise cash-constrained
may increasingly be able to borrow against their illiquid property wealth. Hence,
17
Moebert, J. (2016). House prices: Imminent return to normal, overvaluation likely. Focus
Germany. Deutsche Bank Research. 2 March 2016.
German house prices have lagged OECD since introduction of the
euro in 1999 30
Sources: OECD, Deutsche Bank Research
Standard negative relationship between house prices and CA
suggests downside to the latter in Germany 31
Sources: OECD, Deutsche Bank Research
-40%
0%
40%
80%
120%
160%
Sw
ed
en
New
Zeala
nd
Au
str
alia
No
rway
Can
ad
a
UK
Fra
nce
Belg
ium
Sw
itze
rland
Denm
ark
Sp
ain
Fin
land
Austr
ia
US
Irela
nd
Italy
Neth
erland
s
Ge
rman
y
Gre
ece
Jap
an
Po
rtug
al
Real house
prices,
1999-2015
90
95
100
105
110
115
120
125
130-4%
-2%
0%
2%
4%
6%
8%
10%
95 96 97 98 99 00 01 02 03 04 05 06 07 08 09 10 11 12 13 14 15
CA/GDP Real house prices
Germany's massive CA surplus set to decline
12 | August 26, 2016 Current Issues
rising property values should accelerate domestic consumption growth, which
has already begun to trickle into higher imports.18
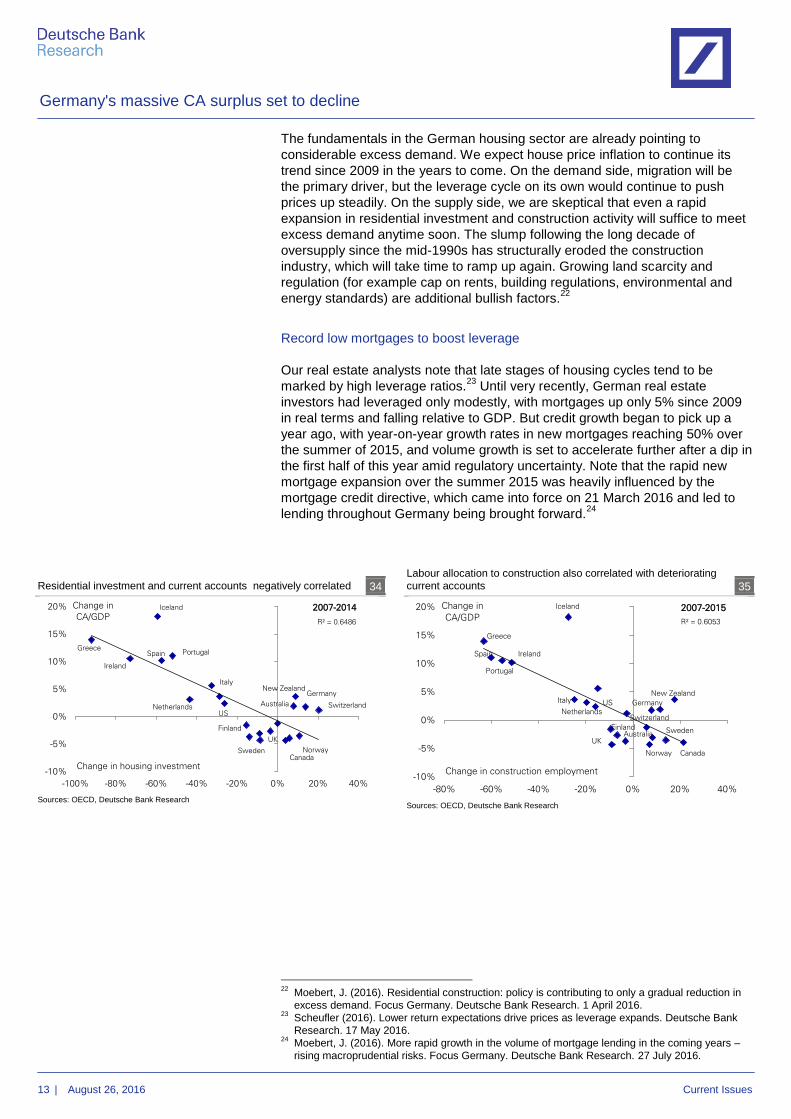
At the same time as saving declines, investment is likely to increase as rising
home prices trigger a supply response. The corollary of net saving (S-I)
contracting is net imports rising due to an increased import of building material
and probably especially due to more imports of consumption goods caused by
the wealth effect (see before).19
The more income an economy devotes to
residential investment, the weaker its current account. This is nicely borne out
by the OECD dataset (figure 34). Since 2007 in particular, the contraction in
residential investment has been central to Southern European import
compression.20
The third channel is that a housing boom absorbs in both capital and labour
from the tradable sector. The construction sector being highly labour-intensive,
employment in construction tends to be highly elastic to housing demand
although the elasticity falls with increasing capacity utilisation (figure 35). The
reason this is associated with weaker current accounts is that workers are
whisked away from manufacturing, thus raising real wages and reducing
competitiveness in the export dependent sectors.
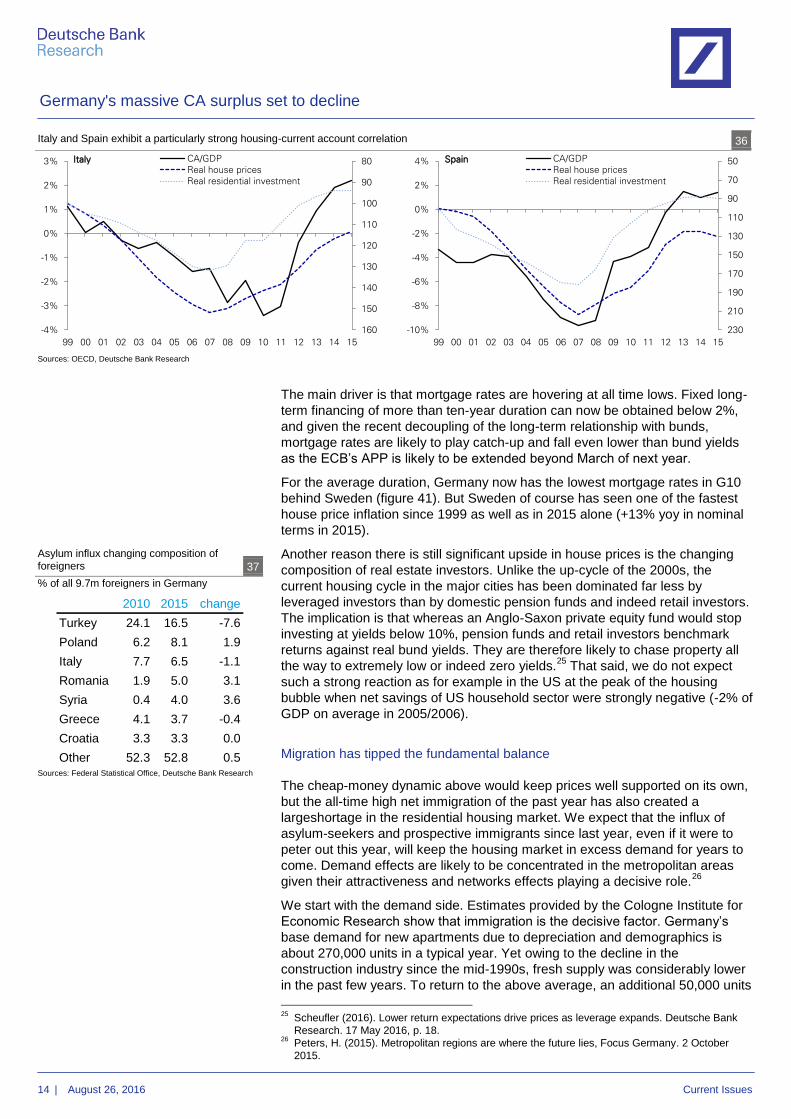
Over time, then, housing and current account cycles appear to be closely
interwoven. This is most evident in classic cases like Italy or Spain since joining
the Eurozone (figure 36). In Spain a massive housing bubble burst after it
peaked in 2007.21
There was, however, no credit driven housing bubble in Italy.
While Spain and Italy epitomise the relationship, the relationships plotted in
figures 33-35 also suggest that given Germany’s current account surplus should
have deteriorated by a few percentage points, rather than improving by 2%. The
reason is that the German current account was supported by other factors such
as burgeoning export demand, fiscal consolidation and supply-side reforms.
Nonetheless, the relationship holds and a housing boom would push down the
CA/GDP ratio, all things constant, and that is what we predict below.
Germany’s continued housing boom 18
Though the empirical evidence for this in Germany is less clear than in the Anglo-Saxon world,
see Hamburg et al (2005) Consumption, wealth and business cycles: why is Germany different?
Deutsche Bundesbank Discussion Paper, No 16/2005. 19
Matsuyama (1990). Residential investment and the current account, Journal of International
Economics, 28 (1-2), p. 137-153. 20
Also see Tressel et al (2014). Rebalancing in the Euro Area and Cyclicality of Current Account
Adjustments. IMF Working Paper, p. 7. 21
Möbert, J., Peters, H., Lechner, M. (2013). German house price increases in perspective. Focus
Germany. Deutsche Bank Research. 31 October 2013.
Pre-crisis years saw a negative correlation between house prices
and current accounts in OECD 32
Sources: OECD, Deutsche Bank Research
This correlation has become even stronger post-crisis 33
Sources: OECD, Deutsche Bank Research
R² = 0.1162
-10%
-8%
-6%
-4%
-2%
0%
2%
4%
6%
8%
10%
12%
-40% -20% 0% 20% 40% 60% 80% 100% 120%
Change in
CA/GDP
Change in real house prices
1999-2006
Greece
SpainIreland
Portugal
Sweden
Canada
Norway
New Zealand
Australia
Switzerland
Italy
Netherlands
FinlandUS
UK
Germany
R² = 0.4689
-10%
-5%
0%
5%
10%
15%
20%
-60% -40% -20% 0% 20% 40%
Change in
CA/GDP
Change in real house prices
2007-2015Iceland
Greece
Spain Ireland Portugal
SwedenCanadaNorway
New Zealand
Australia SwitzerlandGermanyItaly
Netherlands
Finland
US
UK
Germany's massive CA surplus set to decline
13 | August 26, 2016 Current Issues
The fundamentals in the German housing sector are already pointing to
considerable excess demand. We expect house price inflation to continue its
trend since 2009 in the years to come. On the demand side, migration will be
the primary driver, but the leverage cycle on its own would continue to push
prices up steadily. On the supply side, we are skeptical that even a rapid
expansion in residential investment and construction activity will suffice to meet
excess demand anytime soon. The slump following the long decade of
oversupply since the mid-1990s has structurally eroded the construction
industry, which will take time to ramp up again. Growing land scarcity and
regulation (for example cap on rents, building regulations, environmental and
energy standards) are additional bullish factors.22
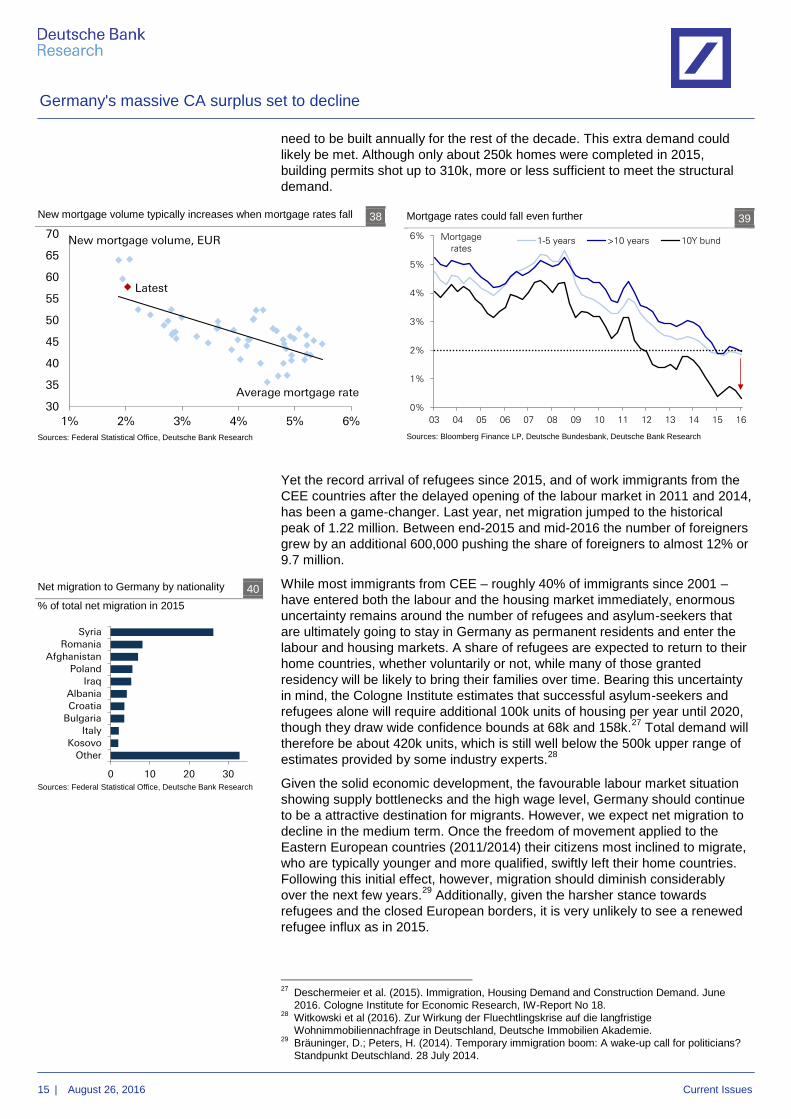
Record low mortgages to boost leverage
Our real estate analysts note that late stages of housing cycles tend to be
marked by high leverage ratios.23
Until very recently, German real estate
investors had leveraged only modestly, with mortgages up only 5% since 2009
in real terms and falling relative to GDP. But credit growth began to pick up a
year ago, with year-on-year growth rates in new mortgages reaching 50% over
the summer of 2015, and volume growth is set to accelerate further after a dip in
the first half of this year amid regulatory uncertainty. Note that the rapid new
mortgage expansion over the summer 2015 was heavily influenced by the
mortgage credit directive, which came into force on 21 March 2016 and led to
lending throughout Germany being brought forward.24
22
Moebert, J. (2016). Residential construction: policy is contributing to only a gradual reduction in
excess demand. Focus Germany. Deutsche Bank Research. 1 April 2016. 23
Scheufler (2016). Lower return expectations drive prices as leverage expands. Deutsche Bank
Research. 17 May 2016. 24
Moebert, J. (2016). More rapid growth in the volume of mortgage lending in the coming years –
rising macroprudential risks. Focus Germany. Deutsche Bank Research. 27 July 2016.
Residential investment and current accounts negatively correlated 34
Sources: OECD, Deutsche Bank Research
Labour allocation to construction also correlated with deteriorating
current accounts 35
Sources: OECD, Deutsche Bank Research
R² = 0.6486
-10%
-5%
0%
5%
10%
15%
20%
-100% -80% -60% -40% -20% 0% 20% 40%
Change in
CA/GDP
Change in housing investment
2007-2014Iceland
GreeceSpain
Ireland
Portugal
SwedenCanada
Norway
New Zealand
Australia Switzerland
Germany
Italy
Netherlands
Finland
US
UK
R² = 0.6053
-10%
-5%
0%
5%
10%
15%
20%
-80% -60% -40% -20% 0% 20% 40%
Change in
CA/GDP
Change in construction employment
2007-2015Iceland
Greece
Spain Ireland
Portugal
Sweden
CanadaNorway
New Zealand
Australia
Switzerland
GermanyItaly
Netherlands
Finland
US
UK
Germany's massive CA surplus set to decline
14 | August 26, 2016 Current Issues
The main driver is that mortgage rates are hovering at all time lows. Fixed long-
term financing of more than ten-year duration can now be obtained below 2%,
and given the recent decoupling of the long-term relationship with bunds,
mortgage rates are likely to play catch-up and fall even lower than bund yields
as the ECB’s APP is likely to be extended beyond March of next year.
For the average duration, Germany now has the lowest mortgage rates in G10
behind Sweden (figure 41). But Sweden of course has seen one of the fastest
house price inflation since 1999 as well as in 2015 alone (+13% yoy in nominal
terms in 2015).
Another reason there is still significant upside in house prices is the changing
composition of real estate investors. Unlike the up-cycle of the 2000s, the
current housing cycle in the major cities has been dominated far less by
leveraged investors than by domestic pension funds and indeed retail investors.
The implication is that whereas an Anglo-Saxon private equity fund would stop
investing at yields below 10%, pension funds and retail investors benchmark
returns against real bund yields. They are therefore likely to chase property all
the way to extremely low or indeed zero yields.25
That said, we do not expect
such a strong reaction as for example in the US at the peak of the housing
bubble when net savings of US household sector were strongly negative (-2% of
GDP on average in 2005/2006).
Migration has tipped the fundamental balance
The cheap-money dynamic above would keep prices well supported on its own,
but the all-time high net immigration of the past year has also created a
largeshortage in the residential housing market. We expect that the influx of
asylum-seekers and prospective immigrants since last year, even if it were to
peter out this year, will keep the housing market in excess demand for years to
come. Demand effects are likely to be concentrated in the metropolitan areas
given their attractiveness and networks effects playing a decisive role.26
We start with the demand side. Estimates provided by the Cologne Institute for
Economic Research show that immigration is the decisive factor. Germany’s
base demand for new apartments due to depreciation and demographics is
about 270,000 units in a typical year. Yet owing to the decline in the
construction industry since the mid-1990s, fresh supply was considerably lower
in the past few years. To return to the above average, an additional 50,000 units
25
Scheufler (2016). Lower return expectations drive prices as leverage expands. Deutsche Bank
Research. 17 May 2016, p. 18. 26
Peters, H. (2015). Metropolitan regions are where the future lies, Focus Germany. 2 October
2015.
Italy and Spain exhibit a particularly strong housing-current account correlation 36
Sources: OECD, Deutsche Bank Research
Asylum influx changing composition of
foreigners 37
% of all 9.7m foreigners in Germany
Sources: Federal Statistical Office, Deutsche Bank Research
80
90
100
110
120
130
140
150
160-4%
-3%
-2%
-1%
0%
1%
2%
3%
99 00 01 02 03 04 05 06 07 08 09 10 11 12 13 14 15
Italy CA/GDP
Real house prices
Real residential investment
50
70
90
110
130
150
170
190
210
230-10%
-8%
-6%
-4%
-2%
0%
2%
4%
99 00 01 02 03 04 05 06 07 08 09 10 11 12 13 14 15
Spain CA/GDP
Real house prices
Real residential investment
2010 2015 change
Turkey 24.1 16.5 -7.6
Poland 6.2 8.1 1.9
Italy 7.7 6.5 -1.1
Romania 1.9 5.0 3.1
Syria 0.4 4.0 3.6
Greece 4.1 3.7 -0.4
Croatia 3.3 3.3 0.0
Other 52.3 52.8 0.5
Germany's massive CA surplus set to decline
15 | August 26, 2016 Current Issues
need to be built annually for the rest of the decade. This extra demand could
likely be met. Although only about 250k homes were completed in 2015,
building permits shot up to 310k, more or less sufficient to meet the structural
demand.
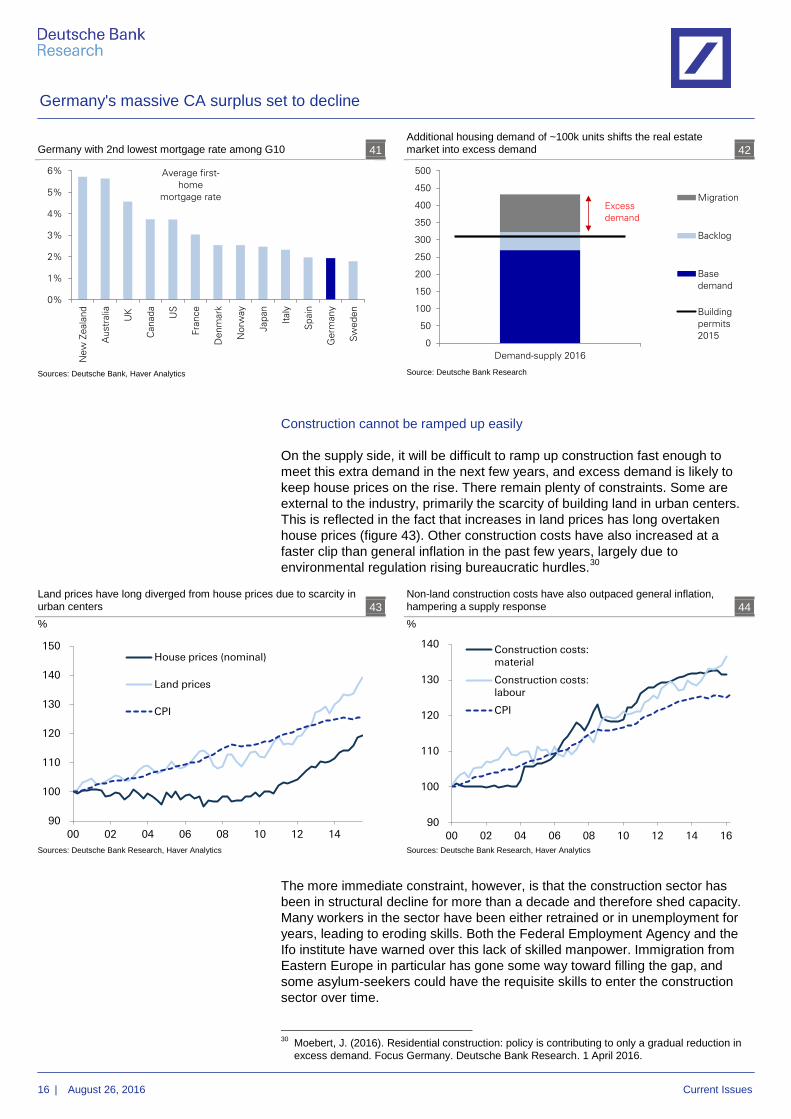
Yet the record arrival of refugees since 2015, and of work immigrants from the
CEE countries after the delayed opening of the labour market in 2011 and 2014,
has been a game-changer. Last year, net migration jumped to the historical
peak of 1.22 million. Between end-2015 and mid-2016 the number of foreigners
grew by an additional 600,000 pushing the share of foreigners to almost 12% or
9.7 million.
While most immigrants from CEE – roughly 40% of immigrants since 2001 –
have entered both the labour and the housing market immediately, enormous
uncertainty remains around the number of refugees and asylum-seekers that
are ultimately going to stay in Germany as permanent residents and enter the
labour and housing markets. A share of refugees are expected to return to their
home countries, whether voluntarily or not, while many of those granted
residency will be likely to bring their families over time. Bearing this uncertainty
in mind, the Cologne Institute estimates that successful asylum-seekers and
refugees alone will require additional 100k units of housing per year until 2020,
though they draw wide confidence bounds at 68k and 158k.27
Total demand will
therefore be about 420k units, which is still well below the 500k upper range of
estimates provided by some industry experts.28
Given the solid economic development, the favourable labour market situation
showing supply bottlenecks and the high wage level, Germany should continue
to be a attractive destination for migrants. However, we expect net migration to
decline in the medium term. Once the freedom of movement applied to the
Eastern European countries (2011/2014) their citizens most inclined to migrate,
who are typically younger and more qualified, swiftly left their home countries.
Following this initial effect, however, migration should diminish considerably
over the next few years.29
Additionally, given the harsher stance towards
refugees and the closed European borders, it is very unlikely to see a renewed
refugee influx as in 2015.
27
Deschermeier et al. (2015). Immigration, Housing Demand and Construction Demand. June
2016. Cologne Institute for Economic Research, IW-Report No 18. 28
Witkowski et al (2016). Zur Wirkung der Fluechtlingskrise auf die langfristige
Wohnimmobiliennachfrage in Deutschland, Deutsche Immobilien Akademie. 29
Bräuninger, D.; Peters, H. (2014). Temporary immigration boom: A wake-up call for politicians?
Standpunkt Deutschland. 28 July 2014.
New mortgage volume typically increases when mortgage rates fall 38
Sources: Federal Statistical Office, Deutsche Bank Research
Mortgage rates could fall even further 39
Sources: Bloomberg Finance LP, Deutsche Bundesbank, Deutsche Bank Research
Net migration to Germany by nationality 40
% of total net migration in 2015
Sources: Federal Statistical Office, Deutsche Bank Research
30
35
40
45
50
55
60
65
70
1% 2% 3% 4% 5% 6%
Average mortgage rate
Latest
New mortgage volume, EUR
0%
1%
2%
3%
4%
5%
6%
03 04 05 06 07 08 09 10 11 12 13 14 15 16
Mortgage
rates1-5 years >10 years 10Y bund
0 10 20 30
Syria
Romania
Afghanistan
Poland
Iraq
Albania
Croatia
Bulgaria
Italy
Kosovo
Other
Germany's massive CA surplus set to decline
16 | August 26, 2016 Current Issues
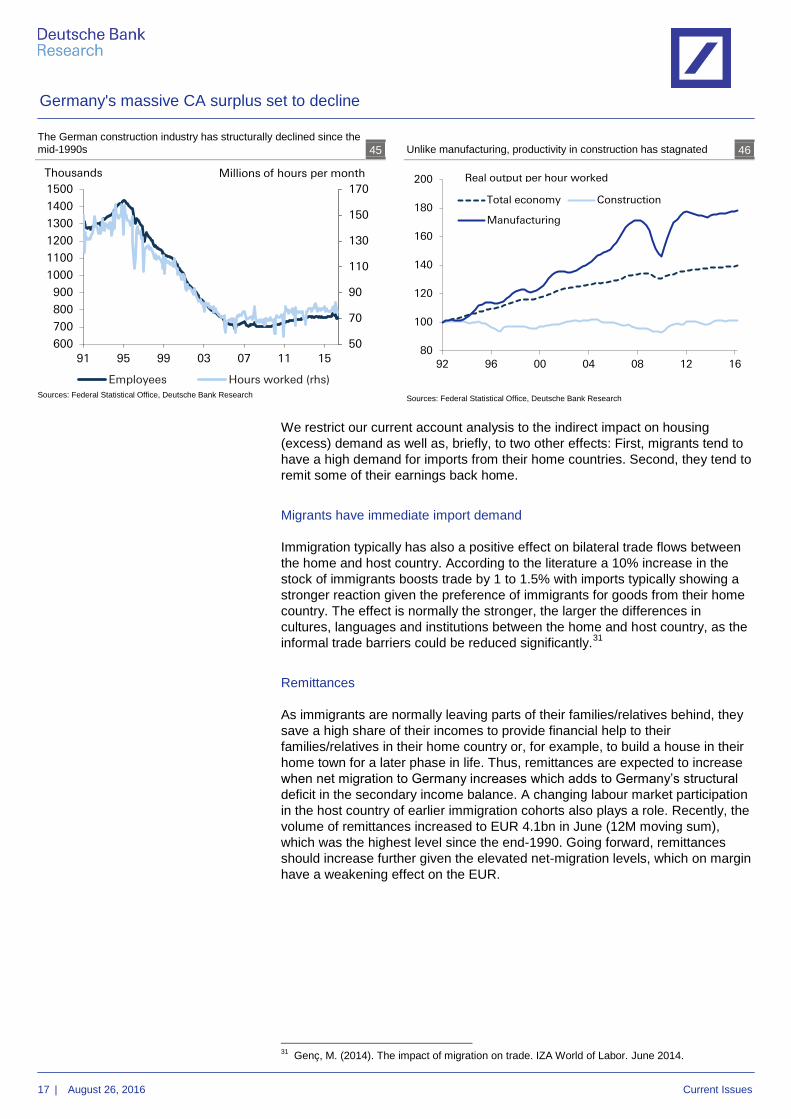
Construction cannot be ramped up easily
On the supply side, it will be difficult to ramp up construction fast enough to
meet this extra demand in the next few years, and excess demand is likely to
keep house prices on the rise. There remain plenty of constraints. Some are
external to the industry, primarily the scarcity of building land in urban centers.
This is reflected in the fact that increases in land prices has long overtaken
house prices (figure 43). Other construction costs have also increased at a
faster clip than general inflation in the past few years, largely due to
environmental regulation rising bureaucratic hurdles.30
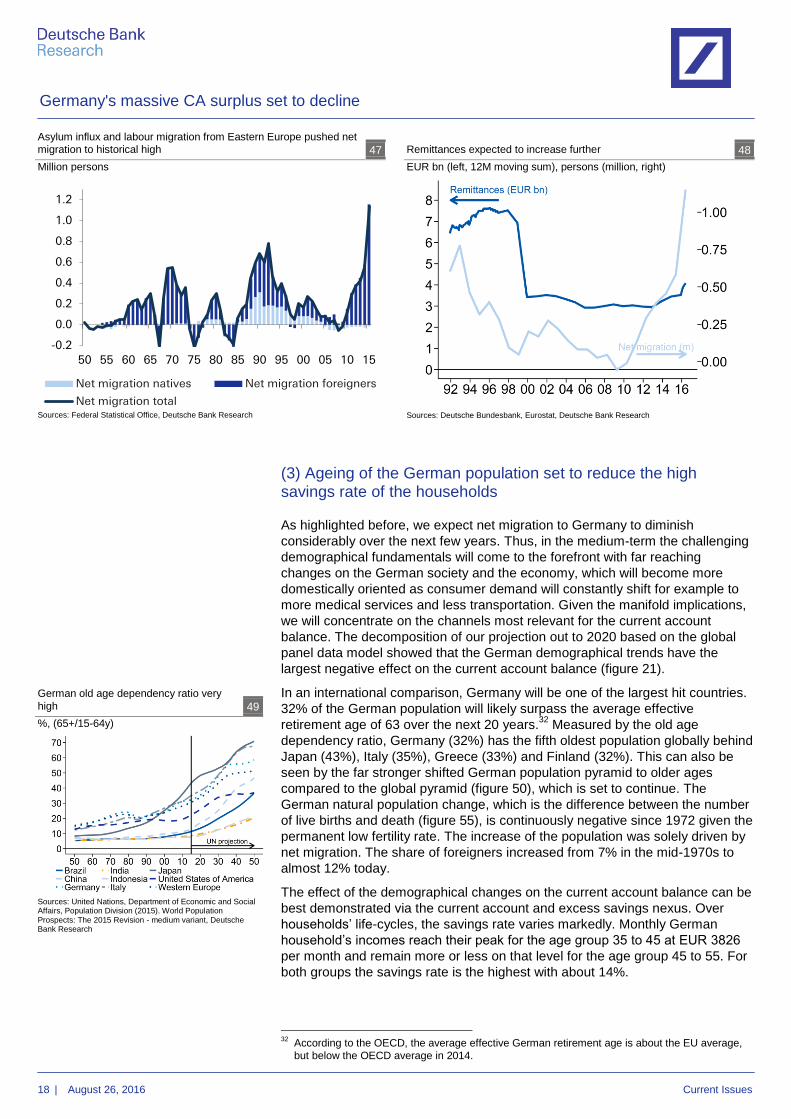
The more immediate constraint, however, is that the construction sector has
been in structural decline for more than a decade and therefore shed capacity.
Many workers in the sector have been either retrained or in unemployment for
years, leading to eroding skills. Both the Federal Employment Agency and the
Ifo institute have warned over this lack of skilled manpower. Immigration from
Eastern Europe in particular has gone some way toward filling the gap, and
some asylum-seekers could have the requisite skills to enter the construction
sector over time.
30
Moebert, J. (2016). Residential construction: policy is contributing to only a gradual reduction in
excess demand. Focus Germany. Deutsche Bank Research. 1 April 2016.
Germany with 2nd lowest mortgage rate among G10 41
Sources: Deutsche Bank, Haver Analytics
Additional housing demand of ~100k units shifts the real estate
market into excess demand 42
Source: Deutsche Bank Research
Land prices have long diverged from house prices due to scarcity in
urban centers 43
%
Sources: Deutsche Bank Research, Haver Analytics
Non-land construction costs have also outpaced general inflation,
hampering a supply response 44
%
Sources: Deutsche Bank Research, Haver Analytics
0%
1%
2%
3%
4%
5%
6%
New
Zeala
nd
Austr
alia
UK
Canad
a
US
Fra
nce
De
nm
ark
No
rway
Jap
an
Italy
Sp
ain
Germ
any
Sw
ed
en
Average first-
home
mortgage rate
0
50
100
150
200
250
300
350
400
450
500
Demand-supply 2016
Migration
Backlog
Base
demand
Building
permits
2015
Excess
demand
90
100
110
120
130
140
150
00 02 04 06 08 10 12 14
House prices (nominal)
Land prices
CPI
90
100
110
120
130
140
00 02 04 06 08 10 12 14 16
Construction costs: material
Construction costs: labour
CPI
Germany's massive CA surplus set to decline
17 | August 26, 2016 Current Issues
We restrict our current account analysis to the indirect impact on housing
(excess) demand as well as, briefly, to two other effects: First, migrants tend to
have a high demand for imports from their home countries. Second, they tend to
remit some of their earnings back home.
Migrants have immediate import demand
Immigration typically has also a positive effect on bilateral trade flows between
the home and host country. According to the literature a 10% increase in the
stock of immigrants boosts trade by 1 to 1.5% with imports typically showing a
stronger reaction given the preference of immigrants for goods from their home
country. The effect is normally the stronger, the larger the differences in
cultures, languages and institutions between the home and host country, as the
informal trade barriers could be reduced significantly.31
Remittances
As immigrants are normally leaving parts of their families/relatives behind, they
save a high share of their incomes to provide financial help to their
families/relatives in their home country or, for example, to build a house in their
home town for a later phase in life. Thus, remittances are expected to increase
when net migration to Germany increases which adds to Germany’s structural
deficit in the secondary income balance. A changing labour market participation
in the host country of earlier immigration cohorts also plays a role. Recently, the
volume of remittances increased to EUR 4.1bn in June (12M moving sum),
which was the highest level since the end-1990. Going forward, remittances
should increase further given the elevated net-migration levels, which on margin
have a weakening effect on the EUR.
31
Genç, M. (2014). The impact of migration on trade. IZA World of Labor. June 2014.
The German construction industry has structurally declined since the
mid-1990s 45
Sources: Federal Statistical Office, Deutsche Bank Research
Unlike manufacturing, productivity in construction has stagnated 46
Sources: Federal Statistical Office, Deutsche Bank Research
50
70
90
110
130
150
170
600
700
800
900
1000
1100
1200
1300
1400
1500
91 95 99 03 07 11 15
Employees Hours worked (rhs)
Millions of hours per monthThousands
80
100
120
140
160
180
200
92 96 00 04 08 12 16
Total economy Construction
Manufacturing
Real output per hour worked
Germany's massive CA surplus set to decline
18 | August 26, 2016 Current Issues
(3) Ageing of the German population set to reduce the high savings rate of the households
As highlighted before, we expect net migration to Germany to diminish
considerably over the next few years. Thus, in the medium-term the challenging
demographical fundamentals will come to the forefront with far reaching
changes on the German society and the economy, which will become more
domestically oriented as consumer demand will constantly shift for example to
more medical services and less transportation. Given the manifold implications,
we will concentrate on the channels most relevant for the current account
balance. The decomposition of our projection out to 2020 based on the global
panel data model showed that the German demographical trends have the
largest negative effect on the current account balance (figure 21).
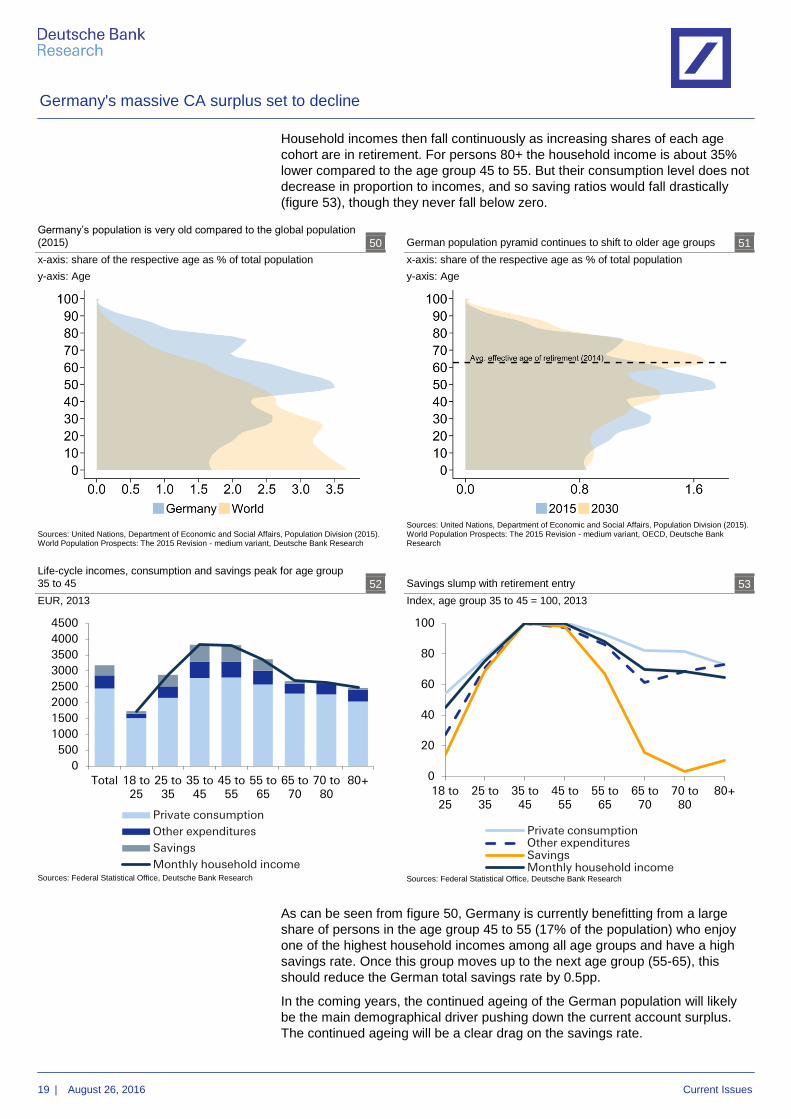
In an international comparison, Germany will be one of the largest hit countries.
32% of the German population will likely surpass the average effective
retirement age of 63 over the next 20 years.32
Measured by the old age
dependency ratio, Germany (32%) has the fifth oldest population globally behind
Japan (43%), Italy (35%), Greece (33%) and Finland (32%). This can also be
seen by the far stronger shifted German population pyramid to older ages
compared to the global pyramid (figure 50), which is set to continue. The
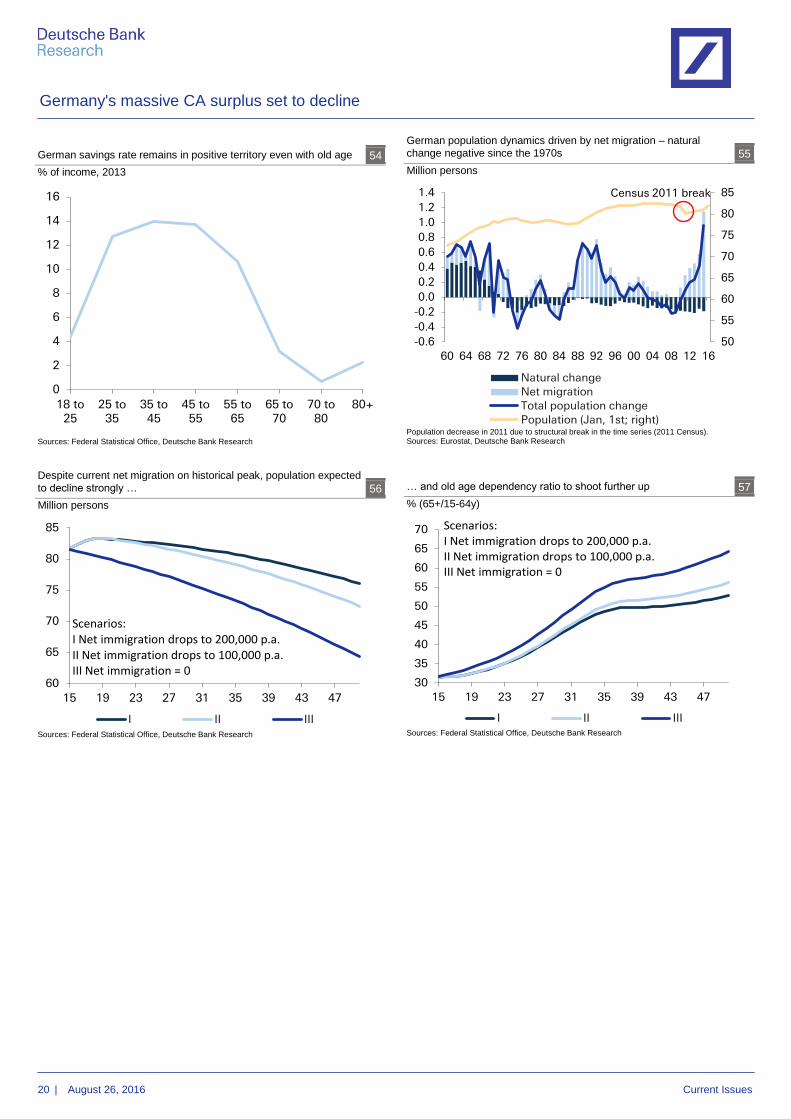
German natural population change, which is the difference between the number
of live births and death (figure 55), is continuously negative since 1972 given the
permanent low fertility rate. The increase of the population was solely driven by
net migration. The share of foreigners increased from 7% in the mid-1970s to
almost 12% today.
The effect of the demographical changes on the current account balance can be
best demonstrated via the current account and excess savings nexus. Over
households’ life-cycles, the savings rate varies markedly. Monthly German
household’s incomes reach their peak for the age group 35 to 45 at EUR 3826
per month and remain more or less on that level for the age group 45 to 55. For
both groups the savings rate is the highest with about 14%.
32
According to the OECD, the average effective German retirement age is about the EU average,
but below the OECD average in 2014.
Asylum influx and labour migration from Eastern Europe pushed net
migration to historical high 47
Million persons
Sources: Federal Statistical Office, Deutsche Bank Research
Remittances expected to increase further 48
EUR bn (left, 12M moving sum), persons (million, right)
Sources: Deutsche Bundesbank, Eurostat, Deutsche Bank Research
German old age dependency ratio very
high 49
%, (65+/15-64y)
Sources: United Nations, Department of Economic and Social Affairs, Population Division (2015). World Population Prospects: The 2015 Revision - medium variant, Deutsche Bank Research
-0.2
0.0
0.2
0.4
0.6
0.8
1.0
1.2
50 55 60 65 70 75 80 85 90 95 00 05 10 15
Net migration natives Net migration foreigners
Net migration total
Germany's massive CA surplus set to decline
19 | August 26, 2016 Current Issues
Household incomes then fall continuously as increasing shares of each age
cohort are in retirement. For persons 80+ the household income is about 35%
lower compared to the age group 45 to 55. But their consumption level does not
decrease in proportion to incomes, and so saving ratios would fall drastically
(figure 53), though they never fall below zero.
As can be seen from figure 50, Germany is currently benefitting from a large
share of persons in the age group 45 to 55 (17% of the population) who enjoy
one of the highest household incomes among all age groups and have a high
savings rate. Once this group moves up to the next age group (55-65), this
should reduce the German total savings rate by 0.5pp.
In the coming years, the continued ageing of the German population will likely
be the main demographical driver pushing down the current account surplus.
The continued ageing will be a clear drag on the savings rate.
Germany’s population is very old compared to the global population
(2015) 50
x-axis: share of the respective age as % of total population
y-axis: Age
Sources: United Nations, Department of Economic and Social Affairs, Population Division (2015). World Population Prospects: The 2015 Revision - medium variant, Deutsche Bank Research
German population pyramid continues to shift to older age groups 51
x-axis: share of the respective age as % of total population
y-axis: Age
Sources: United Nations, Department of Economic and Social Affairs, Population Division (2015). World Population Prospects: The 2015 Revision - medium variant, OECD, Deutsche Bank Research
Life-cycle incomes, consumption and savings peak for age group
35 to 45 52
EUR, 2013
Sources: Federal Statistical Office, Deutsche Bank Research
Savings slump with retirement entry 53
Index, age group 35 to 45 = 100, 2013
Sources: Federal Statistical Office, Deutsche Bank Research
0
500
1000
1500
2000
2500
3000
3500
4000
4500
Total 18 to 25
25 to 35
35 to 45
45 to 55
55 to 65
65 to 70
70 to 80
80+
Private consumption
Other expenditures
Savings
Monthly household income
0
20
40
60
80
100
18 to 25
25 to 35
35 to 45
45 to 55
55 to 65
65 to 70
70 to 80
80+
Private consumptionOther expendituresSavingsMonthly household income
Germany's massive CA surplus set to decline
20 | August 26, 2016 Current Issues
German savings rate remains in positive territory even with old age 54
% of income, 2013
Sources: Federal Statistical Office, Deutsche Bank Research
German population dynamics driven by net migration – natural
change negative since the 1970s 55
Million persons
Population decrease in 2011 due to structural break in the time series (2011 Census). Sources: Eurostat, Deutsche Bank Research
Despite current net migration on historical peak, population expected
to decline strongly … 56
Million persons
Sources: Federal Statistical Office, Deutsche Bank Research
… and old age dependency ratio to shoot further up 57
% (65+/15-64y)
Sources: Federal Statistical Office, Deutsche Bank Research
0
2
4
6
8
10
12
14
16
18 to 25
25 to 35
35 to 45
45 to 55
55 to 65
65 to 70
70 to 80
80+
50
55
60
65
70
75
80
85
-0.6
-0.4
-0.2
0.0
0.2
0.4
0.6
0.8
1.0
1.2
1.4
60 64 68 72 76 80 84 88 92 96 00 04 08 12 16
Natural changeNet migrationTotal population changePopulation (Jan, 1st; right)
Census 2011 break
60
65
70
75
80
85
15 19 23 27 31 35 39 43 47
I II III
Scenarios: I Net immigration drops to 200,000 p.a.II Net immigration drops to 100,000 p.a.III Net immigration = 0
30
35
40
45
50
55
60
65
70
15 19 23 27 31 35 39 43 47
I II III
Scenarios: I Net immigration drops to 200,000 p.a.II Net immigration drops to 100,000 p.a.III Net immigration = 0
Germany's massive CA surplus set to decline
21 | August 26, 2016 Current Issues
Conclusion
The likely fall of the German current account surplus from the record high of
almost 9% to 7% of GDP in 2020 will reduce global imbalances. Germany has
had the world’s largest current account surplus in the world over the past three
years. The surplus will decline not only due to domestic factors such as an
ageing population, the housing boom, and record immigration. It will also
weaken as a result of a structural slowdown in the growth of global trade.
A weaker German balance will also tend to weaken the Eurozone’s aggregate
current account surplus. Some of the deterioration will benefit the balances of
Germany’s European neighbours and thus offset the impact on the aggregate
current account balance. But the main decline will be vis-a-vis the traditional
importers in Asia, the Middle East, and elsewhere. Moreover, although a smaller
surplus would also suggest less recycling on the financial account, we see the
rotation of capital stocks out of the Eurozone as relatively independent from the
current account. Overall, therefore, we expect the German and thus the
Eurozone’s basic balances to deteriorate further and to increase the downward
pressure on the euro.
Germany's massive CA surplus set to decline
22 | August 26, 2016 Current Issues
Appendix
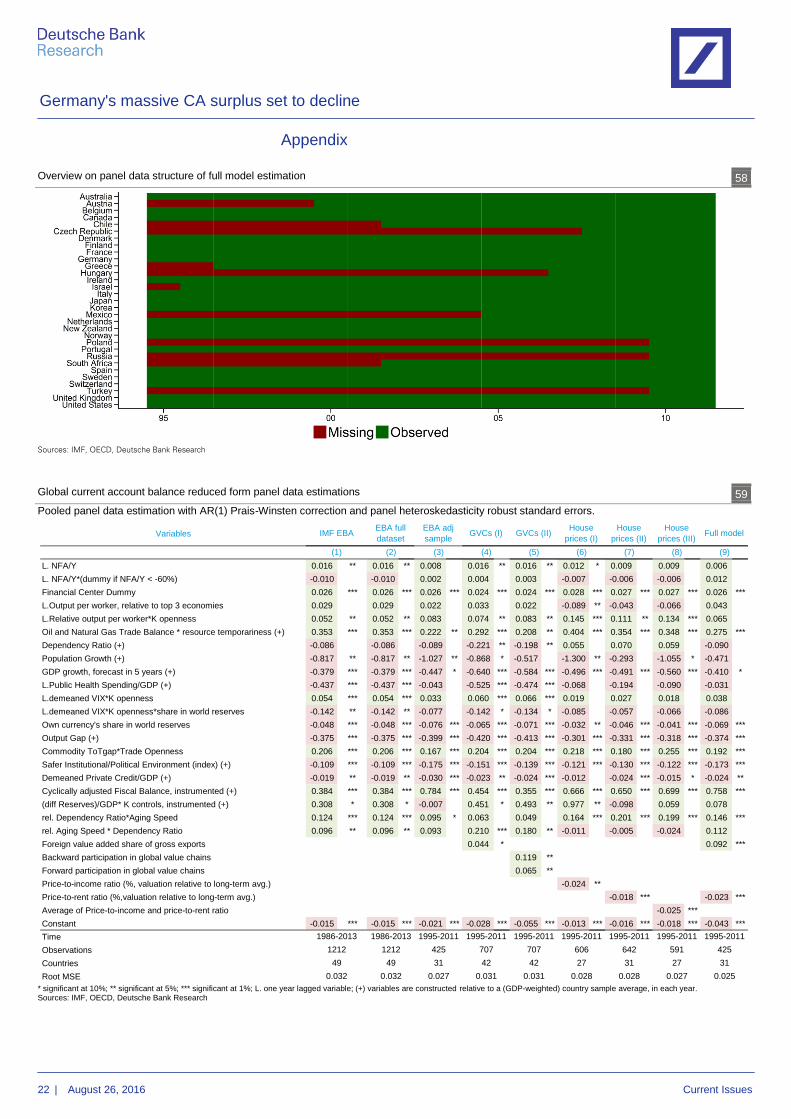
Overview on panel data structure of full model estimation 58
Sources: IMF, OECD, Deutsche Bank Research
Global current account balance reduced form panel data estimations 59
Pooled panel data estimation with AR(1) Prais-Winsten correction and panel heteroskedasticity robust standard errors.
* significant at 10%; ** significant at 5%; *** significant at 1%; L. one year lagged variable; (+) variables are constructed relative to a (GDP-weighted) country sample average, in each year. Sources: IMF, OECD, Deutsche Bank Research
Variables
L. NFA/Y 0.016 ** 0.016 ** 0.008 0.016 ** 0.016 ** 0.012 * 0.009 0.009 0.006
L. NFA/Y*(dummy if NFA/Y < -60%) -0.010 -0.010 0.002 0.004 0.003 -0.007 -0.006 -0.006 0.012
Financial Center Dummy 0.026 *** 0.026 *** 0.026 *** 0.024 *** 0.024 *** 0.028 *** 0.027 *** 0.027 *** 0.026 ***
L.Output per worker, relative to top 3 economies 0.029 0.029 0.022 0.033 0.022 -0.089 ** -0.043 -0.066 0.043
L.Relative output per worker*K openness 0.052 ** 0.052 ** 0.083 0.074 ** 0.083 ** 0.145 *** 0.111 ** 0.134 *** 0.065
Oil and Natural Gas Trade Balance * resource temporariness (+) 0.353 *** 0.353 *** 0.222 ** 0.292 *** 0.208 ** 0.404 *** 0.354 *** 0.348 *** 0.275 ***
Dependency Ratio (+) -0.086 -0.086 -0.089 -0.221 ** -0.198 ** 0.055 0.070 0.059 -0.090
Population Growth (+) -0.817 ** -0.817 ** -1.027 ** -0.868 * -0.517 -1.300 ** -0.293 -1.055 * -0.471
GDP growth, forecast in 5 years (+) -0.379 *** -0.379 *** -0.447 * -0.640 *** -0.584 *** -0.496 *** -0.491 *** -0.560 *** -0.410 *
L.Public Health Spending/GDP (+) -0.437 *** -0.437 *** -0.043 -0.525 *** -0.474 *** -0.068 -0.194 -0.090 -0.031
L.demeaned VIX*K openness 0.054 *** 0.054 *** 0.033 0.060 *** 0.066 *** 0.019 0.027 0.018 0.038
L.demeaned VIX*K openness*share in world reserves -0.142 ** -0.142 ** -0.077 -0.142 * -0.134 * -0.085 -0.057 -0.066 -0.086
Own currency's share in world reserves -0.048 *** -0.048 *** -0.076 *** -0.065 *** -0.071 *** -0.032 ** -0.046 *** -0.041 *** -0.069 ***
Output Gap (+) -0.375 *** -0.375 *** -0.399 *** -0.420 *** -0.413 *** -0.301 *** -0.331 *** -0.318 *** -0.374 ***
Commodity ToTgap*Trade Openness 0.206 *** 0.206 *** 0.167 *** 0.204 *** 0.204 *** 0.218 *** 0.180 *** 0.255 *** 0.192 ***
Safer Institutional/Political Environment (index) (+) -0.109 *** -0.109 *** -0.175 *** -0.151 *** -0.139 *** -0.121 *** -0.130 *** -0.122 *** -0.173 ***
Demeaned Private Credit/GDP (+) -0.019 ** -0.019 ** -0.030 *** -0.023 ** -0.024 *** -0.012 -0.024 *** -0.015 * -0.024 **
Cyclically adjusted Fiscal Balance, instrumented (+) 0.384 *** 0.384 *** 0.784 *** 0.454 *** 0.355 *** 0.666 *** 0.650 *** 0.699 *** 0.758 ***
(diff Reserves)/GDP* K controls, instrumented (+) 0.308 * 0.308 * -0.007 0.451 * 0.493 ** 0.977 ** -0.098 0.059 0.078
rel. Dependency Ratio*Aging Speed 0.124 *** 0.124 *** 0.095 * 0.063 0.049 0.164 *** 0.201 *** 0.199 *** 0.146 ***
rel. Aging Speed * Dependency Ratio 0.096 ** 0.096 ** 0.093 0.210 *** 0.180 ** -0.011 -0.005 -0.024 0.112
Foreign value added share of gross exports 0.044 * 0.092 ***
Backward participation in global value chains 0.119 **
Forward participation in global value chains 0.065 **
Price-to-income ratio (%, valuation relative to long-term avg.) -0.024 **
Price-to-rent ratio (%,valuation relative to long-term avg.) -0.018 *** -0.023 ***
Average of Price-to-income and price-to-rent ratio -0.025 ***
Constant -0.015 *** -0.015 *** -0.021 *** -0.028 *** -0.055 *** -0.013 *** -0.016 *** -0.018 *** -0.043 ***
Time
Observations
Countries
Root MSE 0.028 0.027 0.0250.032 0.0280.0310.0310.027
425
31
(1) (2) (3) (4) (5) (6) (7)
642
31
591
27
707
42
606
27
425
31
707
42
12121212
49 49
0.032
House
prices (I)
House
prices (II)Full model
House
prices (III)
1995-2011 1995-2011 1995-2011 1995-2011
(8) (9)
IMF EBA
1986-20131986-2013 1995-20111995-2011 1995-2011
EBA full
dataset
EBA adj
sampleGVCs (I) GVCs (II)
Germany's massive CA surplus set to decline
23 | August 26, 2016 Current Issues
Estimated vs. actual current account balances (I/III) 60
% of GDP
Sources: IMF, OECD, Deutsche Bank Research
Germany's massive CA surplus set to decline
24 | August 26, 2016 Current Issues
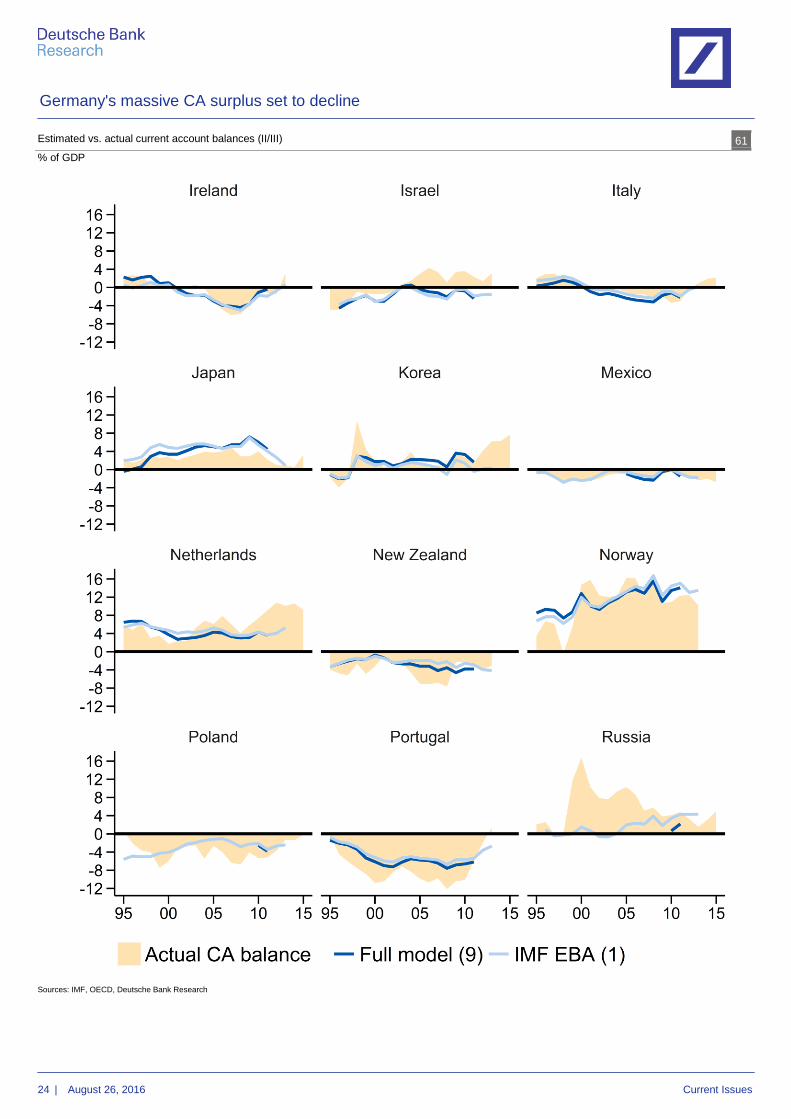
Estimated vs. actual current account balances (II/III) 61
% of GDP
Sources: IMF, OECD, Deutsche Bank Research
Germany's massive CA surplus set to decline
25 | August 26, 2016 Current Issues
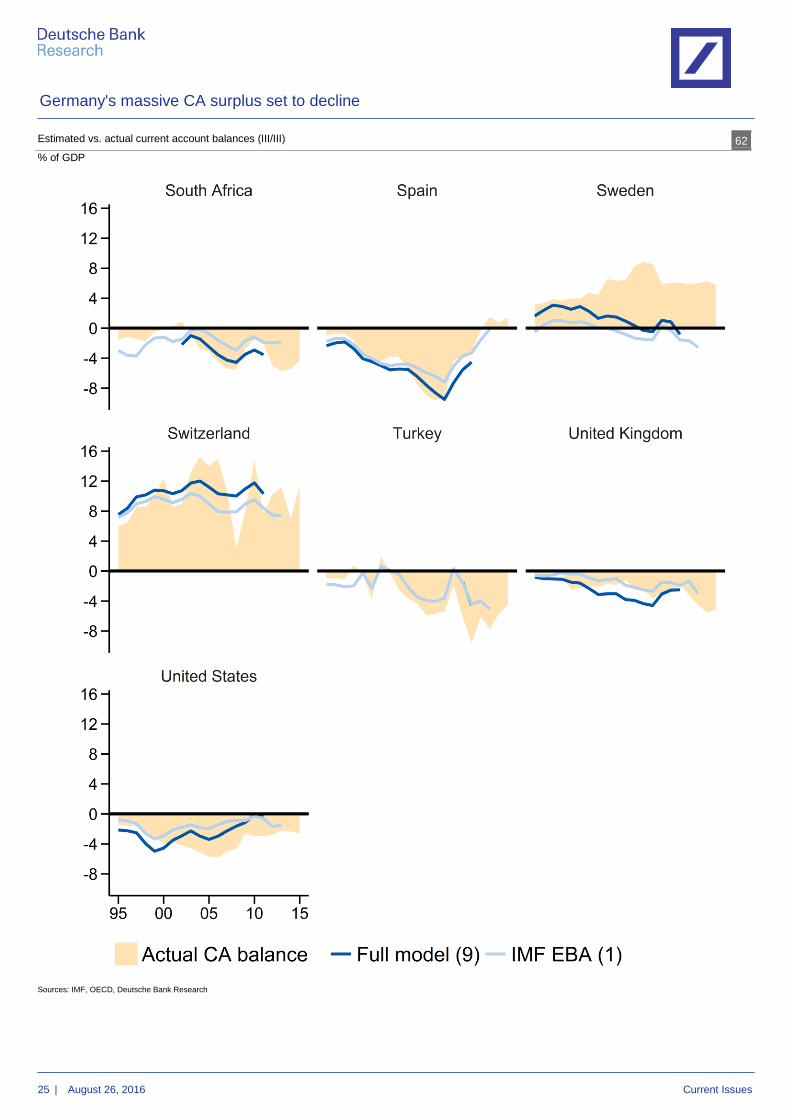
Estimated vs. actual current account balances (III/III) 62
% of GDP
Sources: IMF, OECD, Deutsche Bank Research
Germany
Our publications can be accessed, free of
charge, on our website www.dbresearch.com
You can also register there to receive our
publications regularly by E-mail.
Ordering address for the print version:
Deutsche Bank Research
Marketing
60262 Frankfurt am Main
Fax: +49 69 910-31877
E-mail: [email protected]
Available faster by E-mail: [email protected]
German industry: growth in employment likely to end
(Chart in focus) ..............................................................August 24, 2016
Focus Germany:
ECB helps industry and boosts property prices
(Current Issues – Business cycle) .................................... July 27, 2016
Fewer insolvencies in German industry
(Talking point) ................................................................... July 21, 2016
Start-ups inspire markets with digital technologies
(Fintech #7)
(Talking point) ..................................................................... July 6, 2016
Focus Germany: German consumer vs Brexit
(Current Issues – Business cycle) ...................................... July 4, 2016
Focus Germany:
Growth and fiscal outlook: Risks remain
(Current Issues – Business cycle) ..................................... June 3, 2016
German manufacturing output: a good first quarter,
but no stable uptrend
(Talking point) ................................................................... May 27, 2016
Focus Germany: How to pay for retirement?
(Current Issues – Business cycle) .................................... May 12, 2016
Focus Germany: Solid growth but difficulties for
exports and construction
(Current Issues – Business cycle) ...................................... April 4, 2016
The end of the golden era for oil states continues
to curb German export growth in 2016
(Talking point) ................................................................ March 22, 2016
Focus Germany:
German growth after oil, EUR and ECB
(Current Issues – Business cycle) .............................. February 2, 2015
Capital investment in Germany at sectoral level:
Service providers continue to expand
while industry contracts slightly
(Current Issues – Germany).......................................... January 9, 2015
Focus Germany:
Outlook 2015: Recovery with risks attached
(Current Issues – Business cycle) ................................ January 6, 2015
Case for higher investment in infrastructure –
despite questionable “gap analysis”
(Standpunkt Deutschland)......................................... December 5, 2014
Focus Germany:
Structural downshift in global trade
burdens growth outlook
(Current Issues – Business cycle) ............................ December 2, 2014
Konzept Issue 01
© Copyright 2016. Deutsche Bank AG, Deutsche Bank Research, 60262 Frankfurt am Main, Germany. All rights reserved. When quoting please cite
“Deutsche Bank Research”.
The above information does not constitute the provision of investment, legal or tax advice. Any views expressed reflect the current views of the author,
which do not necessarily correspond to the opinions of Deutsche Bank AG or its affiliates. Opinions expressed may change without notice. Opinions
expressed may differ from views set out in other documents, including research, published by Deutsche Bank. The above information is provided for
informational purposes only and without any obligation, whether contractual or otherwise. No warranty or representation is made as to the correctness,
completeness and accuracy of the information given or the assessments made.
In Germany this information is approved and/or communicated by Deutsche Bank AG Frankfurt, licensed to carry on banking business and to provide
financial services under the supervision of the European Central Bank (ECB) and the German Federal Financial Supervisory Authority (BaFin). In the
United Kingdom this information is approved and/or communicated by Deutsche Bank AG, London Branch, a member of the London Stock Exchange,
authorized by UK’s Prudential Regulation Authority (PRA) and subject to limited regulation by the UK’s Financial Conduct Authority (FCA) (under
number 150018) and by the PRA. This information is distributed in Hong Kong by Deutsche Bank AG, Hong Kong Branch, in Korea by Deutsche
Securities Korea Co. and in Singapore by Deutsche Bank AG, Singapore Branch. In Japan this information is approved and/or distributed by Deutsche
Securities Inc. In Australia, retail clients should obtain a copy of a Product Disclosure Statement (PDS) relating to any financial product referred to in this
report and consider the PDS before making any decision about whether to acquire the product.
Printed by: HST Offsetdruck Schadt & Tetzlaff GbR, Dieburg
Print: ISSN 1612-314X / Internet/E-mail: ISSN 1612-3158