Embed Size (px)
Citation preview
Financial Analysis of UNILEVER PAKISTAN
FINANCIAL ANALYSIS OF UNILEVER PAKISTAN (2014)
FINANCIAL ANALYSIS OF
UNILEVER PAKISTAN
Group Members:
1. Azam Aliani (2893)2. Namraah Khalid (3096)3. Afsheen S. Baig (1036)
Report Submitted to Sir IQBAL NIYANI
Final Project Of INTRODUCTION TO BUSINESS FINANCE (IBF)
Spring 2015
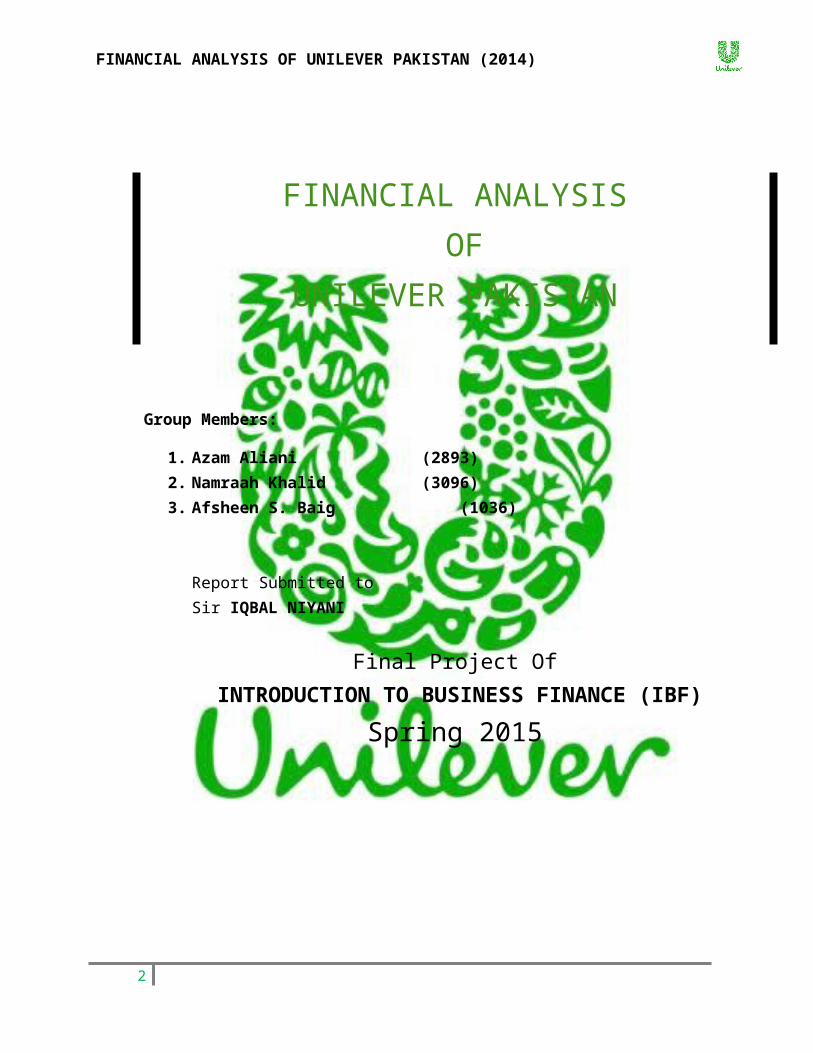
Annual Report 2014
UNILEVER PAKISTAN
2
FINANCIAL ANALYSIS OF UNILEVER PAKISTAN (2014)
Our Visit To
Unilever Pakistan limitedOn April 16, 2015
3
FINANCIAL ANALYSIS OF UNILEVER PAKISTAN (2014)
No Particular Page
1 Acknowledgement 5
2 Abstract 6
3 Introduction 8
4 Brands 9
5 History 10-12
6 Vision Of unilever 13
7 What is ratio Analysis 14
8 Director’s Review 15
9 Performance Indicator 16-17
10 Balance sheet 18-19
11 Income statement 20-21
12 Cashflow statement 22-23
13 Ratio Anaylsis 24-35
14 Conclusion 36
4
FINANCIAL ANALYSIS OF UNILEVER PAKISTAN (2014)
ACKNOWLEDGEMENT
This report is the result of the hard work of all our group members. First of all we would
like to thank the ALMIGHTY ALLAH on the successful completion of this report. We
would also like to thank our course instructor Mr. Iqbal Nayani for helping us understand
the depths of Finance and it was only because of his support, help and guidance
throughout the semester that we were successfully able to complete this project report. It
was because of this report that we were able to do our own analysis of a company’s
financial statements, which required a great deal of thinking and brainstorming. This
whole project has been an excellent learning experience for us all as it helped us put our
knowledge about business finance to practical implementation.
5

FINANCIAL ANALYSIS OF UNILEVER PAKISTAN (2014)
ABSTRACT
A financial statement is a formal record of the financial activities of a business, person,
or other entity. Relevant financial information is presented in a structured manner and in
a form which is easy to understand. They typically include basic financial Statements that
include the Balance Sheet or Statement of Financial Position, Income Statement or Profit
and Loss Account and Cash Flow Statement. Financial statements provide the overview
of the financial position of the company to the company’s stakeholders and the
management; however the company’s true financial position cannot be determined unless
the company’s financial statements are analyzed. Analysis of these Financial Statements
helps us find out about the liquidity position of the company, the company’s long term
solvency, the company’s profitability and its financial viability. Ratio analysis and
interpretation of financial statements help in determining the liquidity position, long term
solvency, financial viability and profitability of a firm and shows overall whether the
company has improved or deteriorated in the past few years. In this report we have done
our best to analyze the financial statements of Unilever Pakistan Limited.
6
FINANCIAL ANALYSIS OF UNILEVER PAKISTAN (2014)
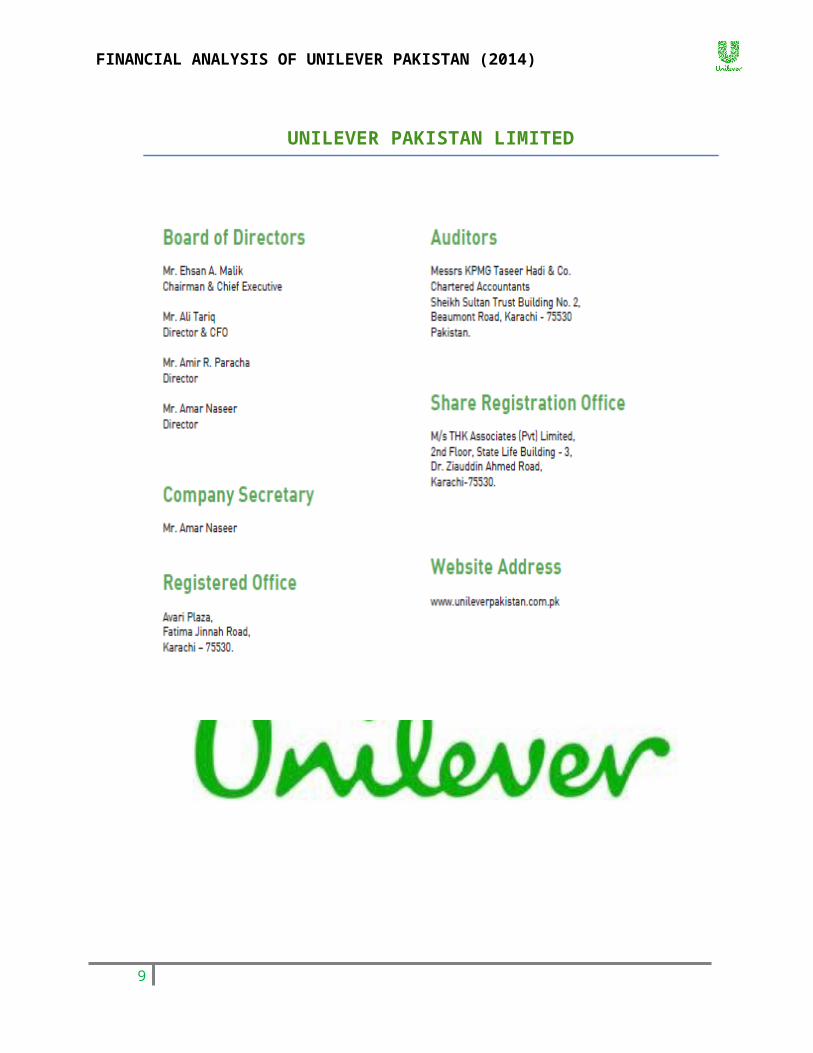
UNILEVER PAKISTAN LIMITED
7

FINANCIAL ANALYSIS OF UNILEVER PAKISTAN (2014)
INTRODUCTION TO UNILEVER PAKISTAN LTD.
Unilever Pakistan (70.4% Unilever equity) is the largest FMCG company in Pakistan, as well as
one of the largest multinationals operating in the country..The company had a turnover of
Rs. 23.3 bn (Euro 309 Mn) in 2007, and enjoys a leading position in most of its core Home and
Personal Care and Foods categories, e.g. Personal Wash, Personal Care, Laundry, Beverages
(Tea) and Ice Cream.
Since the time Unilever Pakistan began its operations in 1948, the Company has been
closely connected to the Pakistani people and its brands have been an integral feature in
their daily lives. In fact, the nature of our business enables our brands to be the pulse and
heartbeat of the 164 million people in Pakistan.
This is a huge commitment, which makes them responsible and accountable to all our
stakeholders and society as a whole and strengthens our resolve to:
Make a positive difference to the lives of low income consumers
Create new opportunities for growth
Improve the overall quality of life in Pakistan, by promoting education, nutrition, health
and hygiene.
8
FINANCIAL ANALYSIS OF UNILEVER PAKISTAN (2014)
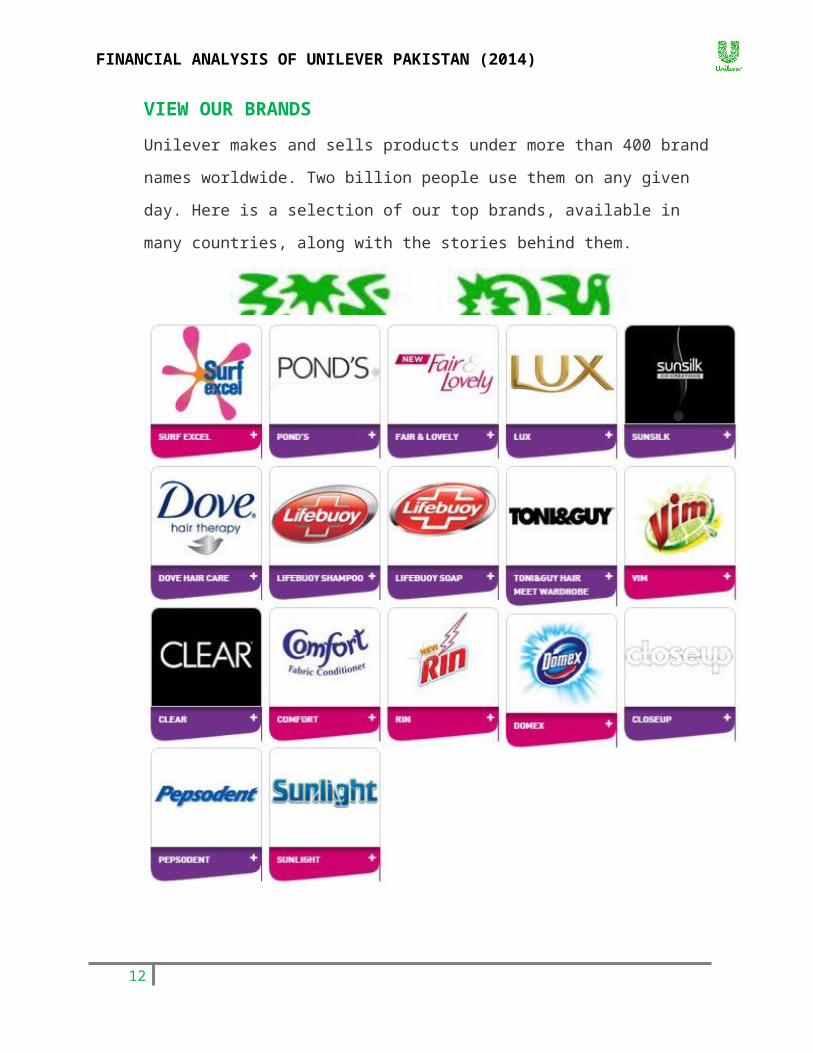
VIEW OUR BRANDS
Unilever makes and sells products under more than 400 brand names worldwide. Two
billion people use them on any given day. Here is a selection of our top brands, available
in many countries, along with the stories behind them.
9
FINANCIAL ANALYSIS OF UNILEVER PAKISTAN (2014)
HISTORY
HELPING PEOPLE GET MORE OUT OF LIFE
In the 1890s, William Hesketh Lever, founder of Lever Bros, wrote down his ideas for
Sunlight Soap – his revolutionary new product that helped popularize cleanliness and
hygiene in Victorian England. It was 'to make cleanliness commonplace; to lessen work
for women; to foster health and contribute to personal attractiveness, that life may be
more enjoyable and rewarding for the people who use their products'.
This was long before the phrase 'Corporate Mission' had been invented, but these ideas
have stayed at the heart of their business. Even if their language - and the notion of only
women doing housework – has become outdated.
In a history that now crosses three centuries, Unilever's success has been influenced by
the major events of the day – economic boom, depression, world wars, changing
consumer lifestyles and advances in technology. And throughout They've created
products that help people get more out of life – cutting the time spent on household
chores, improving nutrition, enabling people to enjoy food and take care of their homes,
their clothes and themselves.
BALANCING PROFIT WITH RESPONSIBLE CORPORATE BEHAVIOUR
In the late 19th century the businesses that would later become Unilever were among the
most philanthropic of their time. They set up projects to improve the lot of their workers
and created products with a positive social impact, making hygiene and personal care
commonplace and improving nutrition through adding vitamins to foods that were
already daily staples.
Today, Unilever still believes that success means acting with 'the highest standards of
corporate behavior towards their employees, consumers and the societies and world in
which they live'. Over the years they've launched or participated in an ever-growing
range of initiatives to source sustainable supplies of raw materials, protect environments,
support local communities and much more.
10

FINANCIAL ANALYSIS OF UNILEVER PAKISTAN (2014)
Through this timeline you'll see how their brand portfolio has evolved. At the beginning
of the 21st century, their Path to Growth strategy focused us on global high-potential
brands and their Vitality mission is taking us into a new phase of development.
19th Century: Although Unilever wasn't formed until 1930, the companies that joined
forces to create the business they know today they’re already well-established before the
start of the 20th century.
1900s: Unilever's founding companies produced products made of oils and fats,
principally soap and margarine. At the beginning of the 20th century their expansion
nearly outstrips the supply of raw materials.
1910s: Tough economic conditions and the First World War make trading difficult for
everyone, so many businesses form trade associations to protect their shared interests.
1920s: With businesses expanding fast, companies set up negotiations intending to stop
others producing the same types of products. But instead they agree to merge - and so
Unilever is created.
1930s: Unilever's first decade is no easy ride: it starts with the Great Depression and ends
with the Second World War. But while the business rationalises operations, it also
continues to diversify.
1940s: Unilever's operations around the world begin to fragment, but the business
continues to expand further into the foods market and increase investment in research and
development.
1950s: Business booms as new technology and the European Economic Community lead
to rising standards of living, while new markets open up in emerging economies around
the globe.
1960s: As the world economy expands so does Unilever and it sets about developing new
products, entering new markets and running a highly ambitious acquisition program.
11
FINANCIAL ANALYSIS OF UNILEVER PAKISTAN (2014)
1970s: Hard economic conditions and high inflation make the '70s a tough time for
everyone, but things are particularly difficult in the Fast Moving Consumer Goods
(FMCG) sector as the big retailers start to flex their muscles.
1980s: Unilever is now one of the world's biggest companies, but takes the decision to
focus its portfolio, and rationalize its businesses to focus on core products and brands.
1990s: The business expands into Central and Eastern Europe and further sharpens its
focus on few product categories, leading to the sale or withdrawal of two-thirds of its
brands.
21st Century: The decade starts with the launch of Path to Growth, a five-year strategic
plan, and in 2004 further sharpens its focus on the needs of 21st century-consumers with
its Vitality mission.
12
FINANCIAL ANALYSIS OF UNILEVER PAKISTAN (2014)
VISION OF UNILEVER
“We help people around the world meet everyday needs for nutrition; hygiene and wellbeing, with brands that help people look good, feel good and get more out of life.”
Unilever is committed to supporting sustainability and providing our consumers around
the world with the products they need to look good, feel good and get more out of life.
Our priorities & principles
Unilever is committed to supporting sustainability and providing our consumers around
the world with the products they need to look good, feel good and get more out of life.
Five key priorities provide the foundation for our brand’s campaigns. Read some
examples of how different brands are upholding these principles.
A better future for children
Our oral care brands Signal and Close-Up encourage children to brush their teeth day and
night for optimal dental health. We also partner the FDI World Dental Federation,
supporting oral health programmes around the world
Brands such as Omo and Persil have helped parents believe the unconventional
philosophy that Dirt is Good. Children learn through play, and mud spatters and grass
stains can easily be removed with effective laundry products
Unilever also partners the World Food Programme and launched the Together for Child
Vitality initiative to bring our expertise in nutrition to children in some of the world’s
poorest countries.
A healthier future
Our Flora/Becel margarine brands have been scientifically proven to help reduce
cholesterol levels, and a new Flora/Becel Heart Age tool allows consumers to work out
whether their heart might be old beyond its years
Vaseline has launched the Vaseline Skin Care Foundation, providing research into skin
conditions and support for people affected by them
13
FINANCIAL ANALYSIS OF UNILEVER PAKISTAN (2014)
WHAT IS RATIO ANALYSIS?
Ratio analysis involves the calculation and comparison of ratios which are derived from
the information given in the company's financial statements. The historical trends of these
ratios can be used to make inferences about a company's financial condition, its
operations and its investment attractiveness and whether the company has improved or
deteriorated in the past few years. Financial ratio analysis groups the ratios into
categories that tell us about the different sides of a company's financial state. Some of
those categories are described below:
1. Liquidity Ratios:
Liquidity ratios tell us about the company’s short term debt paying ability, or the
company’s short term financial situation or the company’s short term solvency.
2. Efficiency/Turnover Ratios :
Efficiency Ratios are used in order to determine that how quickly and efficiently certain
assets are converted in to cash.
3. Leverage Ratios:
The Leverage Ratios measure the long term solvency and ability of the company to pay
to its long term creditors.
4. Profitability Ratios:
Profitability ratios measure the operating efficiency and ability of a company to pay an
adequate return to its Shareholders/Stockholders. Management and Shareholders are
interested in profitability ratios, profitability ratios can be computed on the basis of sales
or investment.
14
FINANCIAL ANALYSIS OF UNILEVER PAKISTAN (2014)
Director’s Review
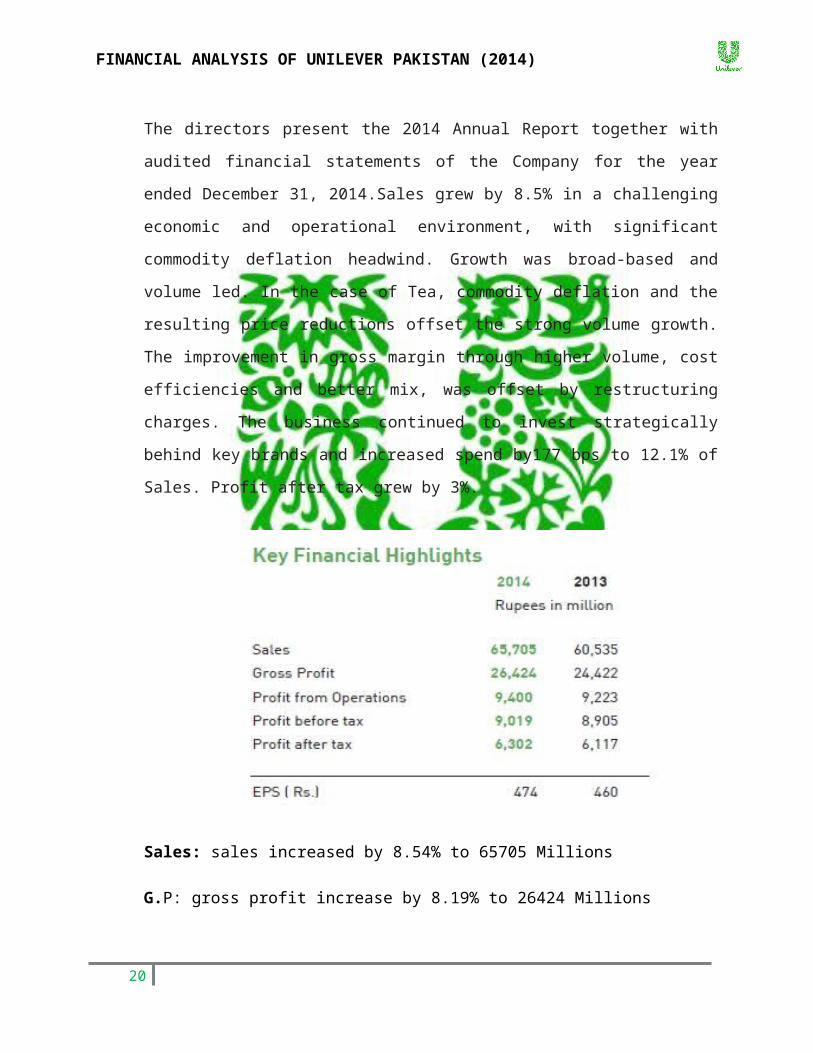
The directors present the 2014 Annual Report together with audited financial statements
of the Company for the year ended December 31, 2014.Sales grew by 8.5% in a
challenging economic and operational environment, with significant commodity deflation
headwind. Growth was broad-based and volume led. In the case of Tea, commodity
deflation and the resulting price reductions offset the strong volume growth. The
improvement in gross margin through higher volume, cost efficiencies and better mix,
was offset by restructuring charges. The business continued to invest strategically behind
key brands and increased spend by177 bps to 12.1% of Sales. Profit after tax grew by
3%.
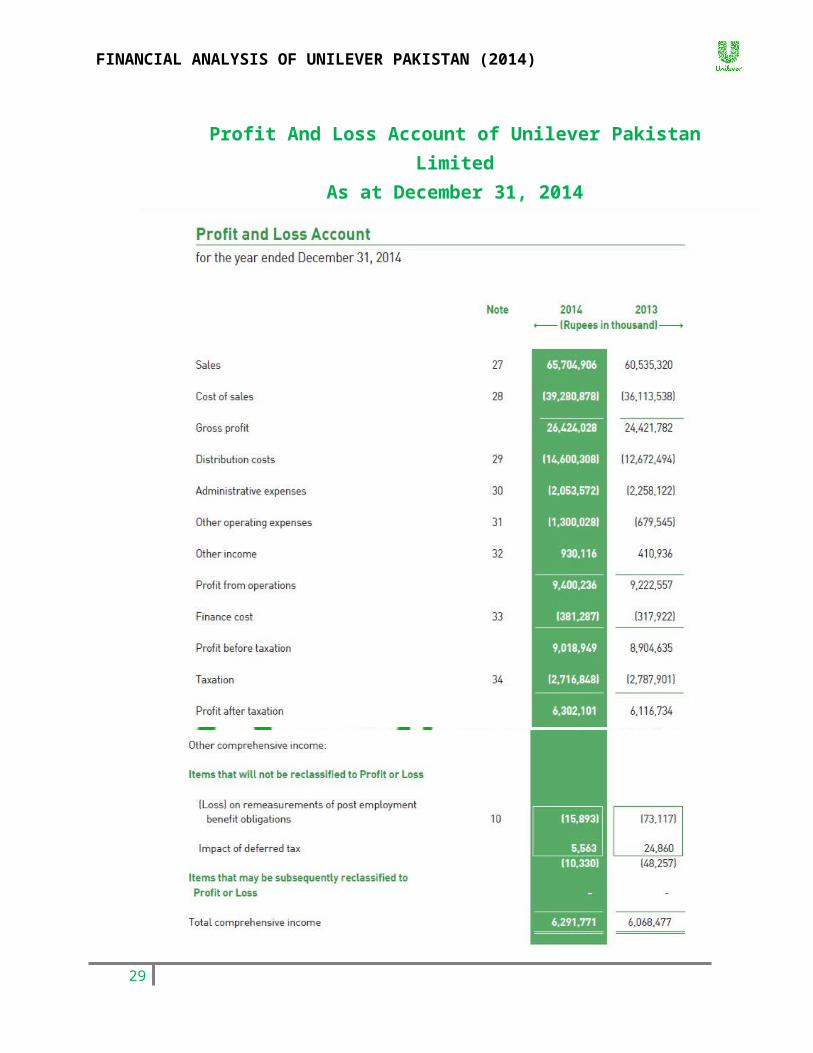
Sales: sales increased by 8.54% to 65705 Millions
G.P: gross profit increase by 8.19% to 26424 Millions
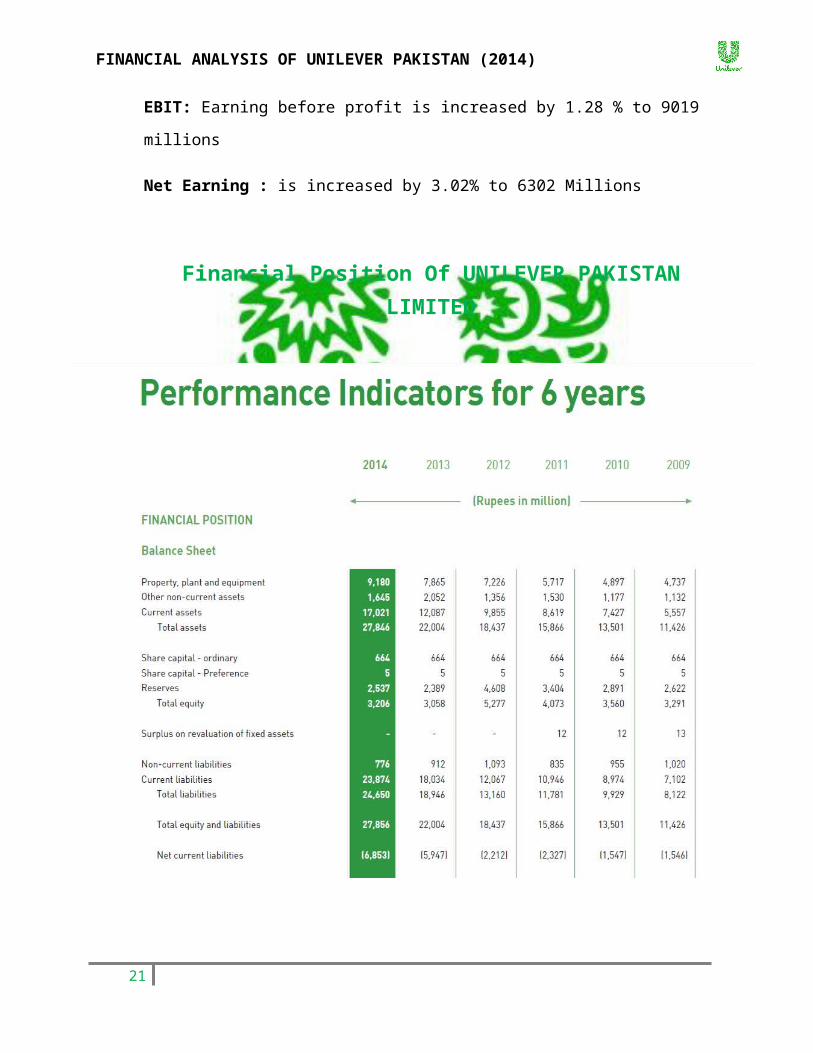
EBIT: Earning before profit is increased by 1.28 % to 9019 millions
Net Earning : is increased by 3.02% to 6302 Millions
15
FINANCIAL ANALYSIS OF UNILEVER PAKISTAN (2014)
Financial Position Of UNILEVER PAKISTAN LIMITED
16
FINANCIAL ANALYSIS OF UNILEVER PAKISTAN (2014)
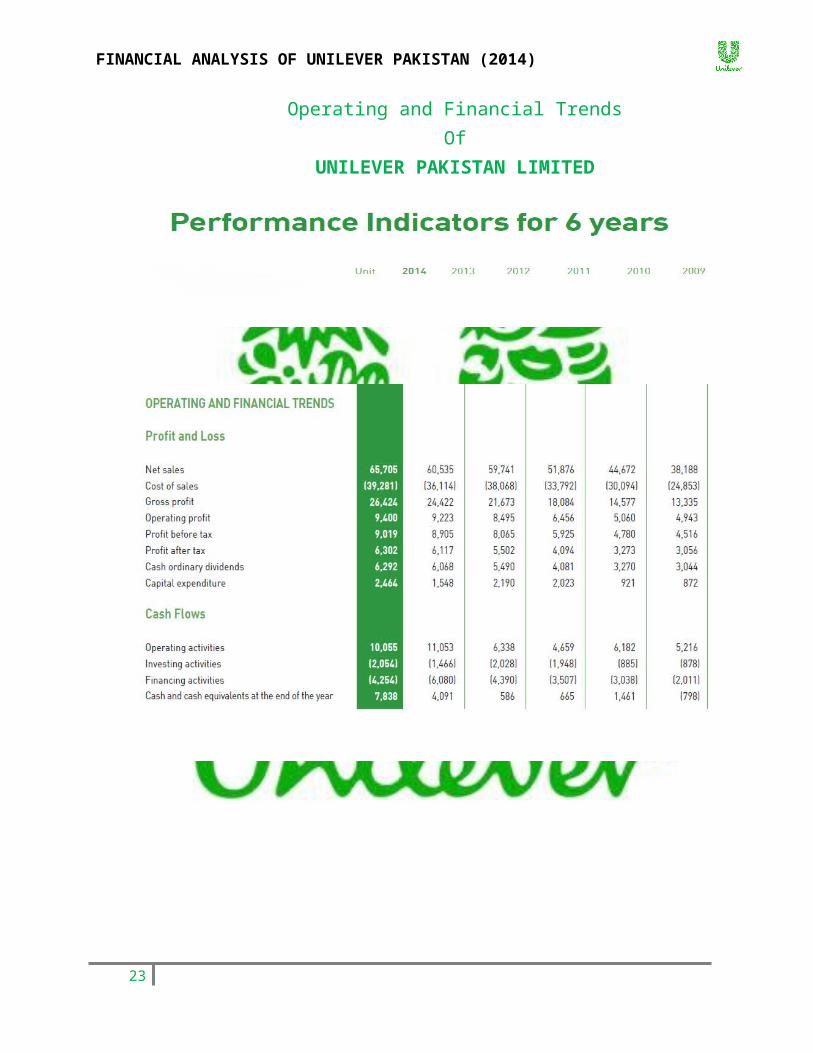
Operating and Financial Trends Of
UNILEVER PAKISTAN LIMITED
17
FINANCIAL ANALYSIS OF UNILEVER PAKISTAN (2014)
18

FINANCIAL ANALYSIS OF UNILEVER PAKISTAN (2014)
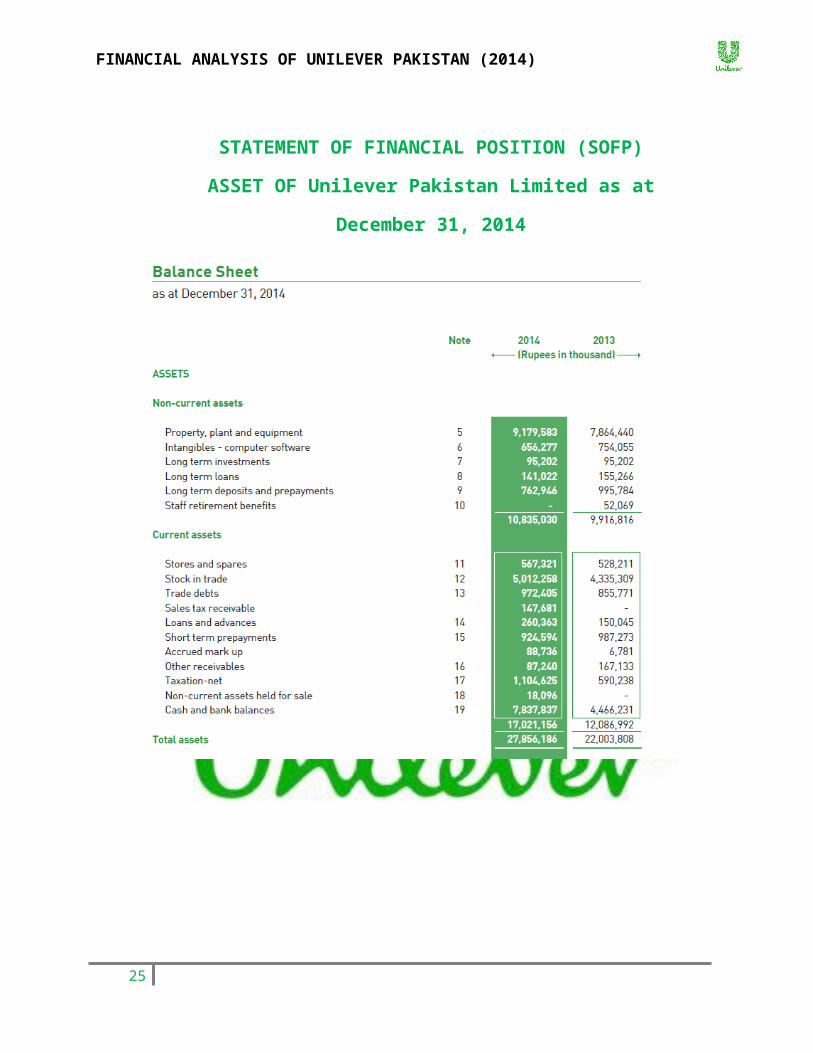
STATEMENT OF FINANCIAL POSITION (SOFP)
ASSET OF Unilever Pakistan Limited as at
December 31, 2014
19
FINANCIAL ANALYSIS OF UNILEVER PAKISTAN (2014)
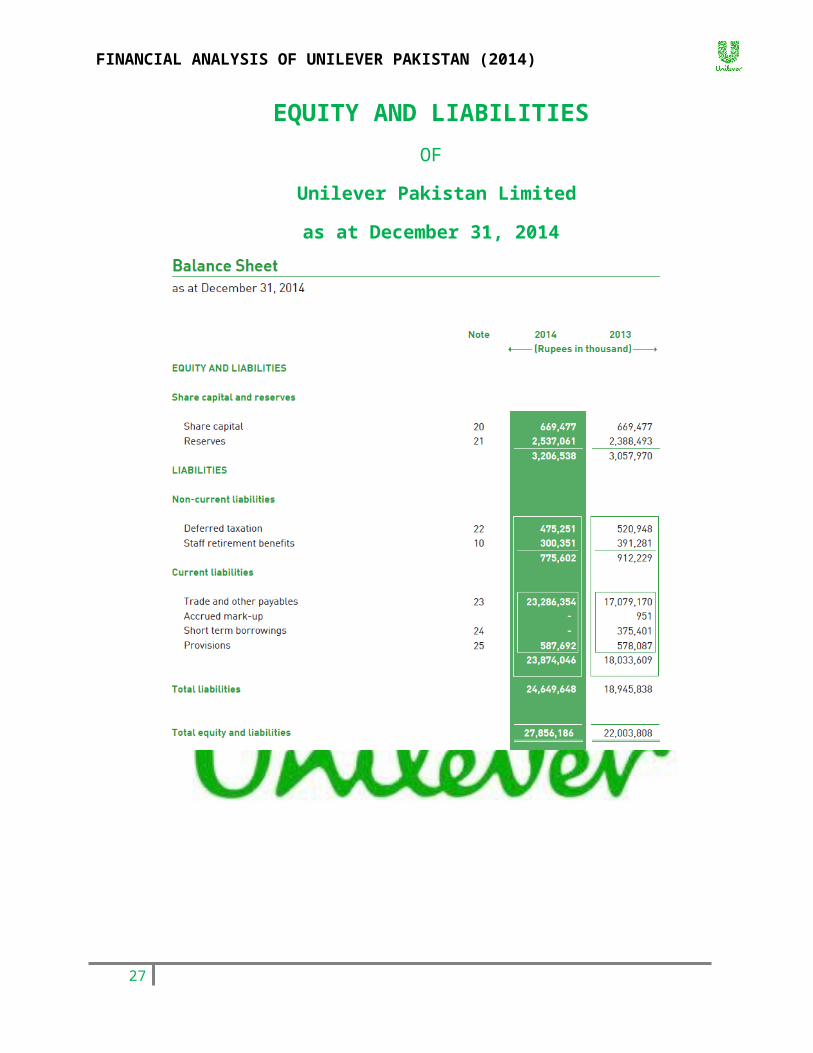
EQUITY AND LIABILITIES
OF
Unilever Pakistan Limited
as at December 31, 2014
20
FINANCIAL ANALYSIS OF UNILEVER PAKISTAN (2014)
21

FINANCIAL ANALYSIS OF UNILEVER PAKISTAN (2014)
Profit And Loss Account of Unilever Pakistan LimitedAs at December 31, 2014
22
FINANCIAL ANALYSIS OF UNILEVER PAKISTAN (2014)
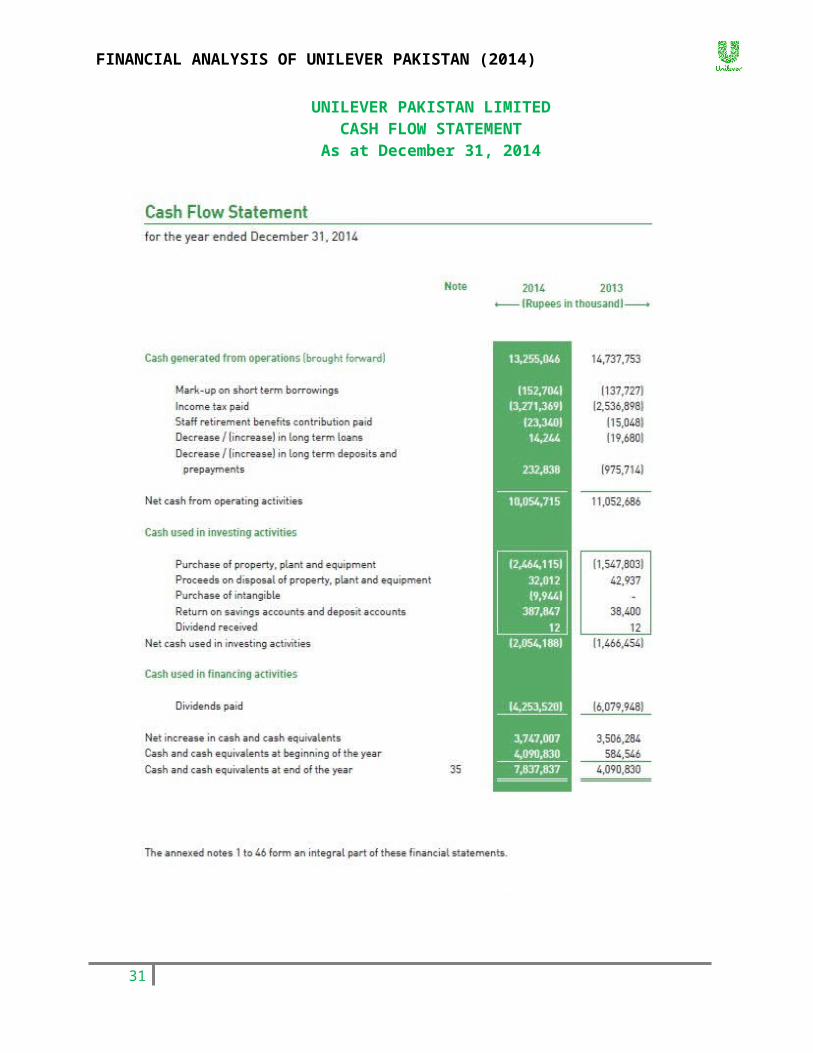
UNILEVER PAKISTAN LIMITEDCASH FLOW STATEMENT
As at December 31, 2014
23
FINANCIAL ANALYSIS OF UNILEVER PAKISTAN (2014)
Cont..
24
FINANCIAL ANALYSIS OF UNILEVER PAKISTAN (2014)
RATIO ANALYSIS
COMPARISON OF CURRENT YEAR WITH PREVIOUS YEAR:
LIQUIDITY RATIOS
Current Ratio:
Current Ratio = Current Assets/Current Liabilities
Current Ratio for 2014 = 17,021,156/ 23,874,046 = 0.71 times or. 0.71:1.00
Current Ratio for 2013 = 12,086,992/ 18,033,609 = 0.67 times or. 0.67:1.00
Interpretation:
In 2013, to pay off Current liabilities of Rs. 1 the company has Current Assets of
Rs. 0.71, which means that the company is not capable of paying its current
liabilities, when they fall due.
In 2014, to pay off Current liabilities of Rs. 1 the company has Current Assets of
Rs. 0.67 which means that the company is not capable of paying its current
liabilities when they fall due.
The company’s current ratio was down in 2013 and it is still not capable to pay
off its current liabilities when they fall due. Although the company’s current ratio
got better in 2014 but in both years the company is not in a good position to pay
off its current liabilities.
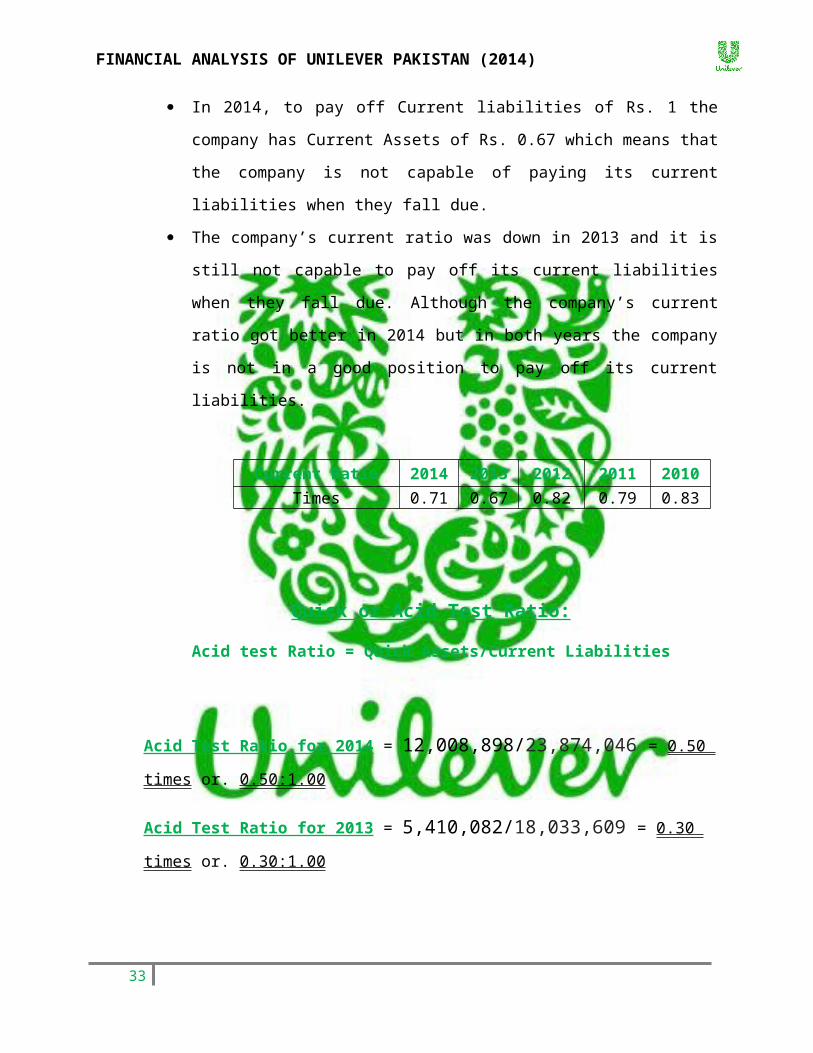
Current Ratio 2014 2013 2012 2011 2010
Times 0.71 0.67 0.82 0.79 0.83
25
FINANCIAL ANALYSIS OF UNILEVER PAKISTAN (2014)
Quick or Acid Test Ratio:
Acid test Ratio = Quick Assets/Current Liabilities
Acid Test Ratio for 2014 = 12,008,898/23,874,046 = 0.50 times or. 0.50:1.00
Acid Test Ratio for 2013 = 5,410,082/18,033,609 = 0.30 times or. 0.30:1.00
Interpretation:
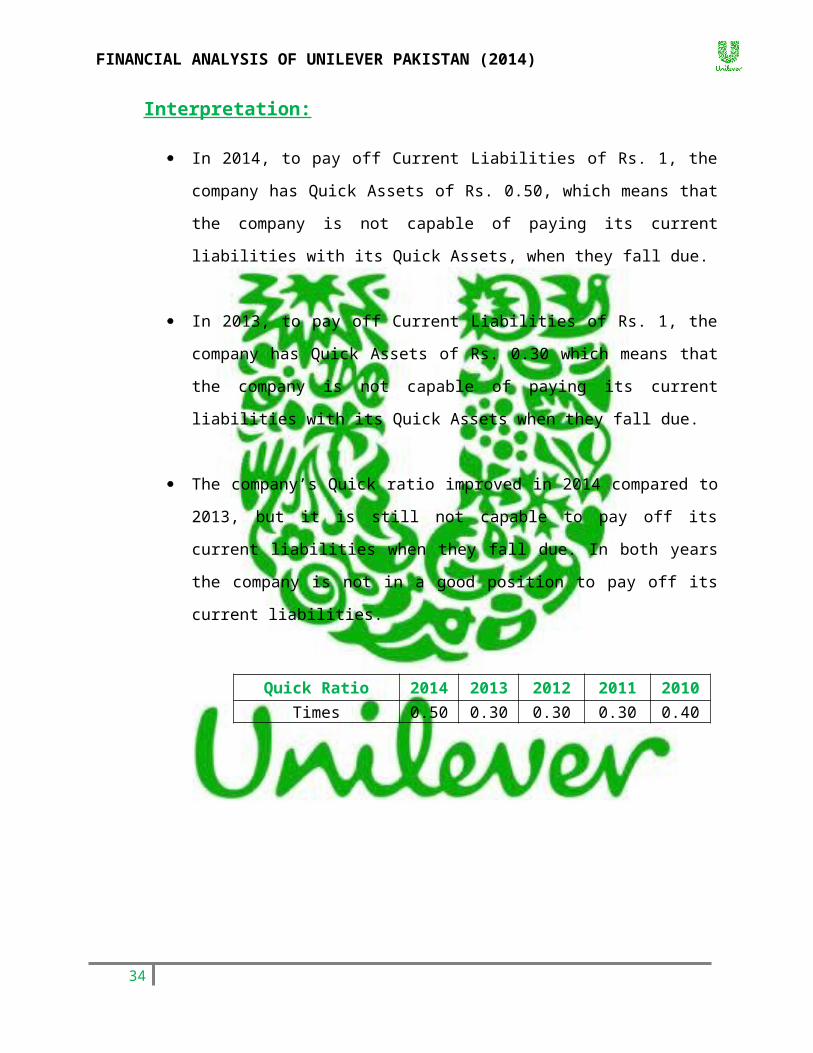
In 2014, to pay off Current Liabilities of Rs. 1, the company has Quick Assets of
Rs. 0.50, which means that the company is not capable of paying its current
liabilities with its Quick Assets, when they fall due.
In 2013, to pay off Current Liabilities of Rs. 1, the company has Quick Assets of
Rs. 0.30 which means that the company is not capable of paying its current
liabilities with its Quick Assets when they fall due.
The company’s Quick ratio improved in 2014 compared to 2013, but it is still not
capable to pay off its current liabilities when they fall due. In both years the
company is not in a good position to pay off its current liabilities.
Quick Ratio 2014 2013 2012 2011 2010
Times 0.50 0.30 0.30 0.30 0.40
26
FINANCIAL ANALYSIS OF UNILEVER PAKISTAN (2014)
PROFITABILITY RATIOS :
Gross Profit Margin:
Gross Profit Margin = 100 x Gross Profit/Net Sales
Gross Profit Margin for 2014 = 100 x 26,424,000/65,705,000 = 40%
Gross Profit Margin for 2013 = 100 x 24,422,000/60,535,000 = 40%
Interpretation:
In 2014, if the company makes net sales of Rs. 100, then the company will earn a
Gross Profit of Rs 40.
In 2013, if the company makes net sales of Rs. 100, then the company will earn a
Gross Profit of Rs. 40.
In terms of gross profitability the company is in same position in 2014, as it is
earning same Gross Profit.
G.P Margin 2014 2013 2012 2011 2010
% 40% 40% 36% 35% 33%
Net Profit Margin:27

FINANCIAL ANALYSIS OF UNILEVER PAKISTAN (2014)
Net Profit Margin = 100 x Net Income After tax/Net Sales
Net Profit Margin for 2014 = 100 x 6,302,000/65,705,000= 10%
Net Profit Margin for 2013 = 100 x 6,117,000/60,535,000 = 10%
Interpretation :
In 2014, if the company makes net sales of Rs. 100, then the company will earn a
Net Profit of Rs. 10.
In 2013, if the company makes net sales of Rs. 100, then the company will earn a
Net Profit of Rs. 10.
In terms of net profitability the company is in same position in 2014, as it earning
same Net Profit.
N.P Margin 2014 2013 2012 2011 2010
% 10% 10% 9% 8% 7%
Earnings before Interest and Tax (EBIT) Margin:
EBIT Margin = 100 x EBIT/Net Sales
28
FINANCIAL ANALYSIS OF UNILEVER PAKISTAN (2014)
EBIT Margin for 2014 = 100 x 9949065/65,705,000 = 15%
EBIT Margin for 2013 = 100 x 9315571/60,535,000 = 16%
Interpretation:
In 2014, if the company makes net sales of Rs. 100, then the company’s earnings
before interest and tax will be Rs. 15.
In 2013, if the company makes net sales of Rs. 100, company’s earnings before
interest and tax will be Rs. 16.
The company was in a slightly better position in 2013, as its earnings before
interest and tax are higher in 2013.
EBIT 2014 2013 2012 2011 2010
% 15% 16% 15% 13% 12%
Return on Equity:
Return on Equity = 100 x Net income after tax/Common Shareholder’s Equity
29

FINANCIAL ANALYSIS OF UNILEVER PAKISTAN (2014)
Return on Equity for 2014 = 100 x 6,302,000/3,206,000 = 196%
Return on Equity for 2013 = 100 x 6,117,000/3,058,000 = 200%
Interpretation:
In 2014, if the company’s shareholder’s makes an investment of Rs.100 than the
company’s earnings after income tax will be of Rs.196.
In 2013, if the company’s shareholder’s makes an investment of Rs.100 than the
company’s earnings after income tax will be of Rs.200.
The company was in a better in 2013 because it was getting some good return on
its investment compared to only as small return in 2014.
Return On Equity 2014 2013 2012 2011 2010
% 196% 200% 104% 101% 92%
Equity Ratio:
Equity Ratio = Shareholder’s Equity/Total Assets
30
FINANCIAL ANALYSIS OF UNILEVER PAKISTAN (2014)
Equity Ratio for 2014 = 3,206,000/27,856,186 = 0.12 times or 12%
Equity Ratio for 2013 = 3,058,000/22,003,808 = 0.14 times or 14%
Interpretation:
In 2014, the Equity Ratio of 0.12 times indicates that the Shareholders or the
Stockholders have a holding of 12% in the business.
In 2013, the Equity Ratio of 0.14 times indicates that the creditors have a holding
of 14% in the business.
The company was better in 2013 as the Shareholders had less holding or claims in
the business.
EFFICIENCY RATIOS
Inventory Turnover (Times and Days):
Inventory Turnover = Cost of Goods Sold/Average Inventory
Inventory Turnover for 2014 = 39,281,000/4,673,783 = 8 times
Inventory Turnover for 2013 = 36,114,000/4335309 =8.5 times
Interpretation:
In 2014, the inventory will turnover is 8 times in a year.
In 2013, the inventory will turnover was 8 times in a year.
The company is better in 2014 as compared to 2013 because the inventory turns
over more times in 2014.
Inventory Period = 360 days/ Inventory Turnover (times)31
FINANCIAL ANALYSIS OF UNILEVER PAKISTAN (2014)
Inventory Period for 2014 = 360/8 = 46 days
Inventory Period for 2013 = 360/78.5 = 43 days
Interpretation:
In 2014, after every 46 days the inventory will turnover. In 2013, after every 43 days the inventory will turnover The company is slightly better in 2014 as it takes fewer days for the inventory to
turnover or fewer days are required to sell the inventory in 2014.
Inventory Turnover 2014 2013 2012 2011 2010
Days 46 43 59 49 46
Debtor Turnover (Times and Days):
Debtor turnover= Credit Sales or Net Sales/Average Accounts Receivables
Debtor Turnover for 2014 = 65,704,906/972,405 = 68 times
Debtor Turnover for 2013 = 60,535,320/855,771 =71 times
Interpretation:
In 2014, 68 times receivable is collected from the customers or debtors in a year.
In 2013, 71 times receivable was collected from the customers or debtors in a
year.
The company is slightly better in 2013 as compared to 2014 because receivable
was collected more times in 2013.
Days Sales Outstanding = 360 days/ Receivable Turnover (times)
Days Sales Outstanding for 2014 = 360/68 =5 days
32
FINANCIAL ANALYSIS OF UNILEVER PAKISTAN (2014)
Days Sales Outstanding for 2013 = 360/71 =5 days
Interpretation:
In 2014, after every 5 days the receivable is collected from the customers or
debtors.
In 2013, after every 5 days the receivable is collected from the customers or
debtors.
The company’s DSO same in 2014. As compare to 2013
Debtor Turnover 2014 2013 2012 2011 2010
Days 5 5 6 5 4
Creditor Turnover (Times and Days):
Creditors turnover= Credit purchases or Net purchases/Average Accounts payable
Creditors Turnover for 2014 = 39,364,604/23,286,354 =1.7 times
Creditors Turnover for 2013 = 35,348,870/17,079,170 =2.1 times
Interpretation:
In 2014, 1.7 times receivable is collected from the customers or debtors in a year.
In 2013, 2.1 times receivable was collected from the customers or debtors in a
year.
The company was slightly better in 2013 as compared to 2014 because receivable
is collected more times in 2013.
Days Sales Outstanding = 360 days/ Receivable Turnover (times)
Days Sales Outstanding for 2014 = 360/1.7 = 212 days
Days Sales Outstanding for 2013 = 360/2.1 = 172 days
33
FINANCIAL ANALYSIS OF UNILEVER PAKISTAN (2014)
Interpretation:
In 2014, after every 212 days the receivable is collected from the customers or
debtors.
In 2013, after every 172 days the receivable is collected from the customers or
debtors.
The company is better in 2014 as it takes fewer days to collect receivables from
the debtors or customers.
Inventory turnover 2014 2013 2012 2011 2010
Days 212 171 108 98 75
Cash Cycle:
Cash Cycle = Inventory Turnover (days) + Accounts Receivable Turnover (days)-Account payable (days)
Cash Cycle for 2014 = 46+5-212=(161) days
Cash Cycle for 2013 = 43+5-171= (123) days
Interpretation:
In 2014, the Cash Cycle will complete in -161 days.
In 2013, the Cash cycle will complete in -129 days
The company is slightly better in 2014 as it takes fewer days for the Cash Cycle to
complete.
CCC 2014 2013 2012 2011 2010
Days (161) (123) 43 44 34
Total Assets Turnover (times)
34
FINANCIAL ANALYSIS OF UNILEVER PAKISTAN (2014)
Total Assets Turnover = Net Sales/ Average Total Assets
Total Asset Turnover for 2014 = 65704906/27856186= 236 Times
Total Asset Turnover for 2013 = 60535320/22003808 = 276 Times
Interpretation:
In 2014, the total assets turnover is 236 times in one year
In 2012, the total assets turnover was 276 times in one year
The company was better in 2013 as the total assets turned over more times in that
year than they did in 2014.
Asset Turnover 2014 2013 2012 2011 2010
Times 236 278 324 327 331
LEVERAGE RATIOS
Debt Ratio = Total Liabilities/Total Assets
Debt Ratio for 2014 = 24,649,648/27,856,186 =0.88 Times
Debt Ratio for 2013 =18945838/22003808 =0.86 Times
35
FINANCIAL ANALYSIS OF UNILEVER PAKISTAN (2014)
Interpretation:
In 2014, the Debt Ratio of 0.88 times indicates that the creditors have a holding of
88% in the business.
In 2013, the Debt Ratio of 0.86 times indicates that the creditors have a holding of
86% in the business.
The company is slightly better in 2014 as the Debtors have less holding in the
business. The holding of Debtor is almost same in both years.
36
FINANCIAL ANALYSIS OF UNILEVER PAKISTAN (2014)
CONCLUSION
According to the above analysis of Unilever Pakistan Limited, the company is in a good
position as far as its profitability is concerned, over the past years the company has seen a
same in its Gross Profit, Net Profit, with the company’s Margins in the current year being
the highest.
However Unilever Pakistan Limited is in a good position. The company’s efficiency has
seen some improvement in the turnover for the inventory and decrease in the account
receivable turnover and it only takes a few days collect the money from customers,
however given the company’s current liquidity position the company is not still
converting the assets into cash quick enough to pay off its current liabilities. This is good
for a company that they are working on creditors money. They return their money in 213
days in 2014.And unilever pakistan’s EPS is Rs.474 in 2014.
Conclusively, Unilever Pakistan Limited is operating effectively and efficiently on
overall basis and generating enough profit to keep its operations running in the most
effective way possible and keeping its standard of being one of the largest and most
stable multinational organizations.
37