Embed Size (px)
Citation preview

European Federation of Management Consultancies AssociationsFédération Européenne des Associations de Conseils en Organisation
Survey of the European Management Consultancy
2014 | 2015
European Federation of Management Consultancies AssociationsFédération Européenne des Associations de Conseils en Organisation
Survey of the European Management Consultancy
2014 | 2015
December 2015
3
Table of Contents
Introduction by the FEACO Chairman
Executive Summary
Foreword on report methodology and structure
SECTION A - Major trends in European Management ConsultancyTurnover TrendEmployment TrendTurnover per ProfessionalService LinesClient Industries
Exports
SECTION B – Selected Management Consultancy country profilesAustriaFinlandFranceGermanyGreeceIrelandItalyNorwayPortugalRomaniaSloveniaSpainUnited Kingdom
About FEACO, the European Federation of Management
Consultancies Associa-tions
4
5
6
781114151719
21222426293133353840424446
48
50
4
Introduction by the FEACO Chairman
I am pleased to introduce the 2014/15 edition of the FEACO survey of the European management consultancy market.
Our industry has experienced a significant growth in terms of both turnover and employment. The growth has been driven mainly by Germany and the UK but it has spread across all the European countries, highlighting a quite general recovery. The recovery in the management consulting in-dustry has anticipated the recovery of the overall economy and, what is more, in every country its growth rate has exceeded the GDP growth rate. It stands out that the management consulting industry has taken a leading role in bringing forward processes of innovation, mainly those related to digitalization. Such a move is highli-ghted by the relevance of consulting related to Technology, an area that has become one of the major service lines together with Strategy and Operations.
In this generally positive outlook there are still three major divides splitting our industry: geo-graphical, dimensional and sectorial. As to the geographical divide, the turnover growth rate in the Northern countries is more than twice the growth rate of the Southern countries. The tur-nover per professional shows a similar pattern. As to the dimensional divide, the recovery of the overall industry has been driven mainly by the large consulting firms while the medium and even more the small consultancies in general are still suffering from the crisis, even if among them there are several notable exceptions of very suc-cessful companies. As to the sectorial divide, the Public Sector is still lagging behind of the Private
Sector – in particular in the Service Sector – in ter-ms of its use of management consulting advice, in spite of its need to be supported in the structural reforms announced across Europe. Such divides in management consulting ends up increasing even more the divide in the overall economies gi-ven that professional consulting services are un-questionably able to improve competencies and quickly generate concrete change.
Besides these considerations, what future pro-spects are there for the the industry in Europe? Which opportunities and challenges are there? Certainly the future of management consulting hinges on how it is evolving. With regard to our environment, digital has changed the game and from the client-side, there is more need for a dif-ferent set of services. Management consulting will need to acquire new capabilities to match changes in the economy in order to successfully keep growing. In this scenario, I think that more than ever before the key imperative for our indu-stry is to reimagine innovation.
Ezio LattanzioFEACO Chairman
5
Executive Summary
The Management Consulting industry in Europe has finally overcome a period of stagnation achieving for three consecutive years a significant – and accelerating – growth rate: +3.8% in 2013, +5.2% in 2014, and +6.6% in 2015. The recovery of the industry has been led by the UK and Germany and is quite widespread at the European level, where all countries have registered a turnover growth.
The growth of the Management Consulting industry has benefited from the overall recovery of the economy but it has by far outperformed the GDP trend: in the 2012-15 period the MC turnover has, on average, grown yearly by +5.2% while GDP grew by +1.9%. A similar trend is also found with respect to a longer horizon, considering that in the 2007-15 period the Management Consulting market has grown on average 3.7% per year while European GDP has grown on average 1.0% per year.
The recovery of the industry has had a very positive impact on employment: +5.8% in 2013, +4.8% in 2014 and +6.5% in 2015.
The positive trend in the turnover has had a limited positive impact on price levels, which are still under pressure in most countries, with a market recovery that has been driven more by an increased level of activity than by fee growth.
The European Management Consulting industry is still quite heterogeneous by countries as well as by company size, as highlighted by the analysis of the turnover per professional. In the past three years, in Northern countries (France included) the average revenue per professional has been around €200,000 per year, while in Mediterranean countries it has been slightly above €100,000. It also appears that there is always a very large difference between the turnover per professional
in large consulting companies and in medium-small consulting firms: on average the turnover per professional of the former is almost twice than the latter.
The three dominant service lines in the European Management Consulting market are Technology, Operations and Strategy, each with a market share around 20% (2014 data). The relevance of Technology is highlighted by the strong involvement of Management Consulting firms in supporting the digitalization process, while a diminished presence of Strategy – a service line that has been declining over the past five years – underlines how more clients now focus on projects with narrower short-term impacts.
The European Management Consulting industry is strongly focused on the Service sector: 59% of Management Consulting turnover in 2014. Consulting services to the Manufacturing sector and the Public sector represent respectively 28% and 13% of the overall Management Consulting market. Within the Service sector, Financial Services are the highest spender (43% of the Management Consulting turnover within the Service sector and 26% of the overall European Management Consulting market) followed by Telecom & Media, and Energy.
The country profiles reported in Section 2 look into the specificities of the Management Consulting industry trends in each participating country.
6
Foreword on report methodology and structure
This report aims to provide an overview of the Eu-ropean Management Consulting industry. It has been developed based upon data already collected by national Management Consulting Associations for their yearly surveys. Each Association has been asked to provide:
• key data on turnover, employment, service lines, client industries and exports from 2012 to 2015;
• a country profile with a description of their national Management Consulting market, including references to the overall situation of the economy, major opportunities and threats faced by the Management Consult-ing firms and other relevant issues.
Considering their background, their different asso-ciate members and law provisions, National Asso-ciations tend to collect their data with respect to domains that are not fully homogenous.
• the subjects: some Associations collect data only related to consulting firms (such as Italy) while others also take into account in-dividual professionals (such as Austria);
• the scope: some Associations collect data only related to their members (such as the UK and Spain), others as to the overall mar-ket irrespective of membership (such as Italy and Spain);
• the focus: Associations might treat different-ly businesses that are very closely related to Management Consulting, such as IT con-sulting or consulting on finance & taxation.
In order to avoid adding up data that are not fully homogeneous, this report provides an overall picture of the European Management Consulting industry only in terms of trends, as the above mentioned differences should not distort the general trends of the Management Consulting industry.
At the same time, this report provides insights into the different national Management Consulting mar-kets through dedicated country profiles. The country profiles include key industry data and qualitative analysis, as developed by national Associations.Accordingly, this report is made up of two sections:
• SECTION A – Major trends in the European Management Consultancy
• SECTION B – Selected Management Con-sultancy countries’ profiles.
Thirteen national Associations have provided data for this report, namely:
• Austria – UBIT, Austrian Professional Association for Management Consultancy, Accounting and Information Technology;
• Finland – LJK, Finnish Management Consul-tants Association;
• France – Consult’inFrance (formerly Syntec Conseil en Management);
• Germany – BDU eV, German Association of Management Consultants;
• Greece – SESMA, Hellenic Association of Management Consulting Firms;
• Ireland – IMCA , Institute of Management Consultants and Advisers;
• Italy – Assoconsult, Italian Association of Management Consulting Firms;
• Norway – Consulting Norway Virke (only as to the country profile);
• Portugal – APPC , Trade Association of the Portuguese Autonomous Sector of Enginee-ring, Architecture, Environment, Economics and Management Consultancy (only as to the country profile);
• Romania – AMCOR, Romanian Manage-ment Consultancies Association (only as to the country profile);
• Slovenia – AMCOS, Association of Manage-ment Consulting of Slovenia;
• Spain – AEC, Spanish Association of Consul-ting Companies;
• UK – MCA, Management Consultancies Association.
Section AMajor trends in European Management Consultancy
8
This section is based on a European panel that in-cludes Austria, Finland, France, Germany, Greece, Ireland, Italy, Slovenia, Spain and the UK, unless dif-ferently specified. Such a panel represents 78% of the overall European Gross Domestic Product (GDP).In order to identify the European trends, national data provided by the Associations have been wei-ghted based on the national GDPs at market prices from Eurostat (2014 data).
This section includes an analysis of the European Management Consulting in order to identify their main features.
Major trends in European Management Consultancy
TURNOVER TREND
EMPLOYMENT TREND
TURNOVER PER PROFESSIONAL
SERVICE LINES
CLIENT INDUSTRIES
EXPORT
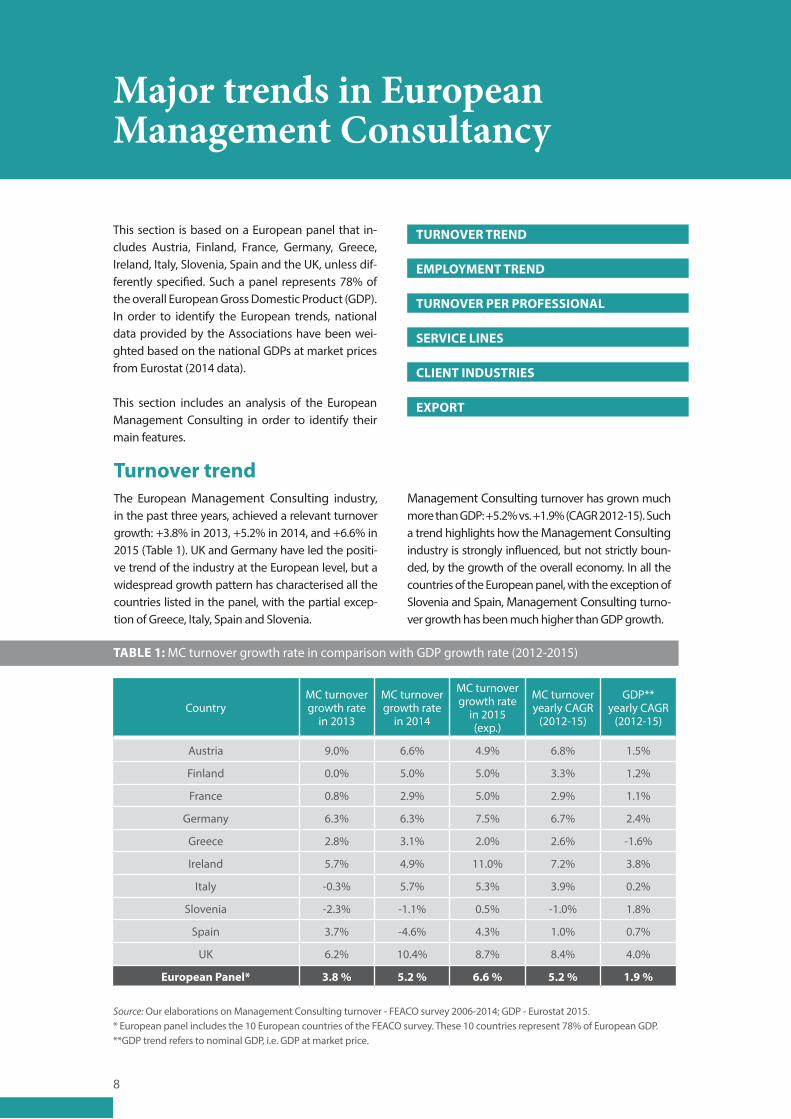
Turnover trendThe European Management Consulting industry, in the past three years, achieved a relevant turnover growth: +3.8% in 2013, +5.2% in 2014, and +6.6% in 2015 (Table 1). UK and Germany have led the positi-ve trend of the industry at the European level, but a widespread growth pattern has characterised all the countries listed in the panel, with the partial excep-tion of Greece, Italy, Spain and Slovenia.
Management Consulting turnover has grown much more than GDP: +5.2% vs. +1.9% (CAGR 2012-15). Such a trend highlights how the Management Consulting industry is strongly influenced, but not strictly boun-ded, by the growth of the overall economy. In all the countries of the European panel, with the exception of Slovenia and Spain, Management Consulting turno-ver growth has been much higher than GDP growth.
TABLE 1: MC turnover growth rate in comparison with GDP growth rate (2012-2015)
CountryMC turnover growth rate
in 2013
MC turnover growth rate
in 2014
MC turnover growth rate
in 2015 (exp.)
MC turnover yearly CAGR
(2012-15)
GDP** yearly CAGR
(2012-15)
Austria 9.0% 6.6% 4.9% 6.8% 1.5%
Finland 0.0% 5.0% 5.0% 3.3% 1.2%
France 0.8% 2.9% 5.0% 2.9% 1.1%
Germany 6.3% 6.3% 7.5% 6.7% 2.4%
Greece 2.8% 3.1% 2.0% 2.6% -1.6%
Ireland 5.7% 4.9% 11.0% 7.2% 3.8%
Italy -0.3% 5.7% 5.3% 3.9% 0.2%
Slovenia -2.3% -1.1% 0.5% -1.0% 1.8%
Spain 3.7% -4.6% 4.3% 1.0% 0.7%
UK 6.2% 10.4% 8.7% 8.4% 4.0%
European Panel* 3.8 % 5.2 % 6.6 % 5.2 % 1.9 %
Source: Our elaborations on Management Consulting turnover - FEACO survey 2006-2014; GDP - Eurostat 2015.* European panel includes the 10 European countries of the FEACO survey. These 10 countries represent 78% of European GDP. **GDP trend refers to nominal GDP, i.e. GDP at market price.
9
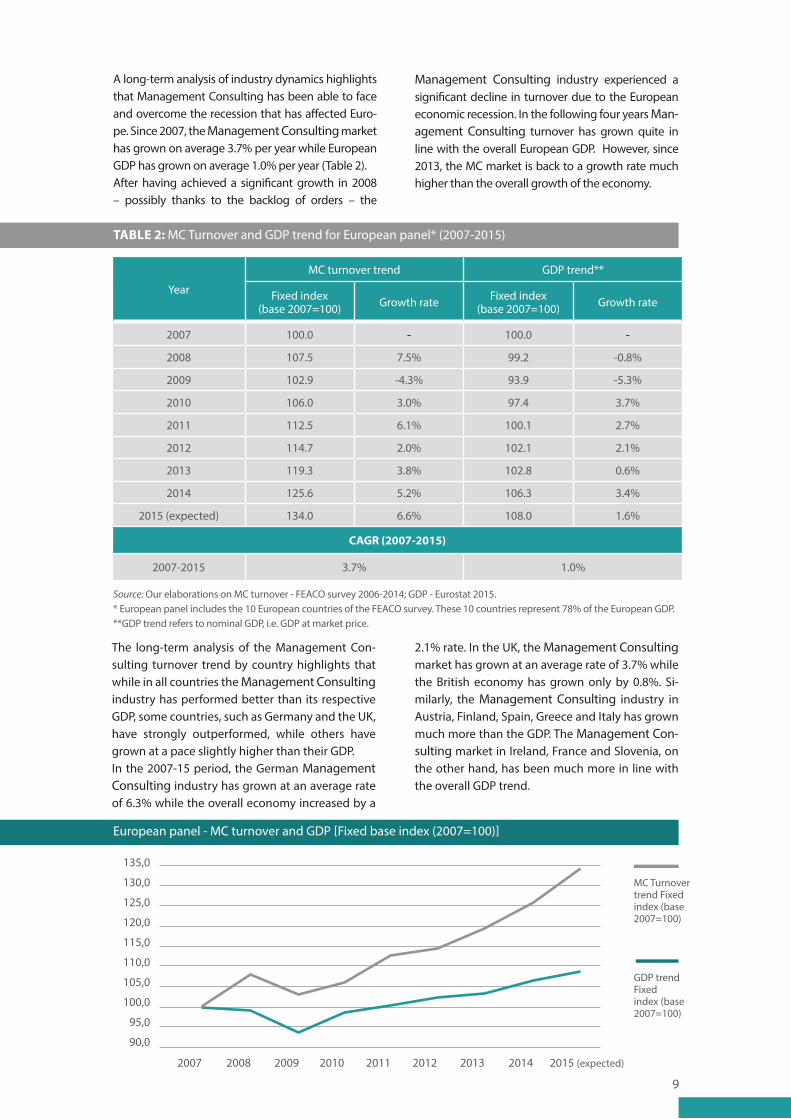
A long-term analysis of industry dynamics highlights that Management Consulting has been able to face and overcome the recession that has affected Euro-pe. Since 2007, the Management Consulting market has grown on average 3.7% per year while European GDP has grown on average 1.0% per year (Table 2). After having achieved a significant growth in 2008 – possibly thanks to the backlog of orders – the
Management Consulting industry experienced a significant decline in turnover due to the European economic recession. In the following four years Man-agement Consulting turnover has grown quite in line with the overall European GDP. However, since 2013, the MC market is back to a growth rate much higher than the overall growth of the economy.
TABLE 2: MC Turnover and GDP trend for European panel* (2007-2015)
Year
MC turnover trend GDP trend**
Fixed index(base 2007=100) Growth rate Fixed index
(base 2007=100) Growth rate
2007 100.0 - 100.0 -
2008 107.5 7.5% 99.2 -0.8%
2009 102.9 -4.3% 93.9 -5.3%
2010 106.0 3.0% 97.4 3.7%
2011 112.5 6.1% 100.1 2.7%
2012 114.7 2.0% 102.1 2.1%
2013 119.3 3.8% 102.8 0.6%
2014 125.6 5.2% 106.3 3.4%
2015 (expected) 134.0 6.6% 108.0 1.6%
CAGR (2007-2015)
2007-2015 3.7% 1.0%
Source: Our elaborations on MC turnover - FEACO survey 2006-2014; GDP - Eurostat 2015.* European panel includes the 10 European countries of the FEACO survey. These 10 countries represent 78% of the European GDP.**GDP trend refers to nominal GDP, i.e. GDP at market price.
The long-term analysis of the Management Con-sulting turnover trend by country highlights that while in all countries the Management Consulting industry has performed better than its respective GDP, some countries, such as Germany and the UK, have strongly outperformed, while others have grown at a pace slightly higher than their GDP.In the 2007-15 period, the German Management Consulting industry has grown at an average rate of 6.3% while the overall economy increased by a
2.1% rate. In the UK, the Management Consulting market has grown at an average rate of 3.7% while the British economy has grown only by 0.8%. Si-milarly, the Management Consulting industry in Austria, Finland, Spain, Greece and Italy has grown much more than the GDP. The Management Con-sulting market in Ireland, France and Slovenia, on the other hand, has been much more in line with the overall GDP trend.
European panel - MC turnover and GDP [Fixed base index (2007=100)]
135,0
130,0
125,0
120,0
115,0
110,0
105,0
100,0
95,0
90,0
2007
GDP trend Fixed index (base 2007=100)
MC Turnover trend Fixed index (base 2007=100)
2008 2009 2010 2011 2012 2013 2014 2015 (expected)
10
Source: Our elaborations on MC turnover - FEACO survey 2006-2014; GDP - Eurostat 2015.* European panel here includes the 10 European countries of the FEACO survey. These 10 countries represent 78% of European GDP. **GDP trend refers to nominal GDP, i.e. GDP at market price.
Differences in growth rates between MC turnover and GDP (CAGR 2007-2015)
Germany
Austria
Finland
UK
European panel
Spain
Greece
Italy
Ireland
France
Slovenia
0.0% 0.5% 1.0% 1.5% 2.0% 2.5% 3.0% 3.5% 4.0%
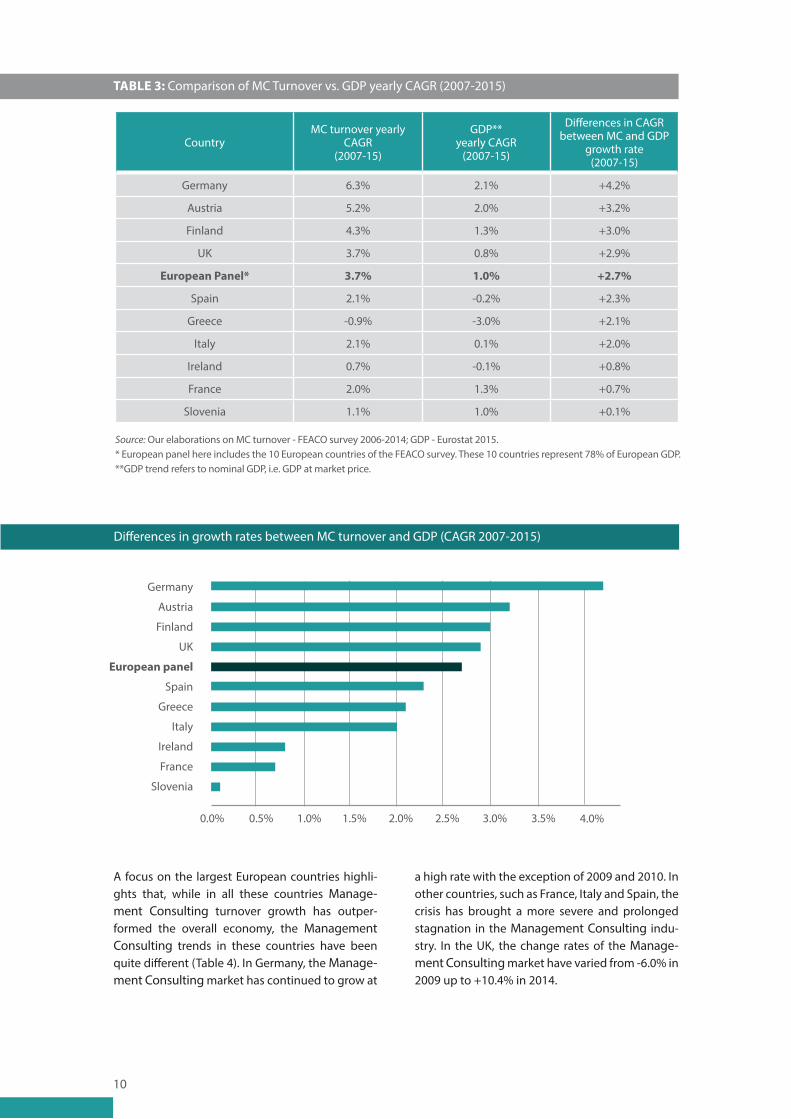
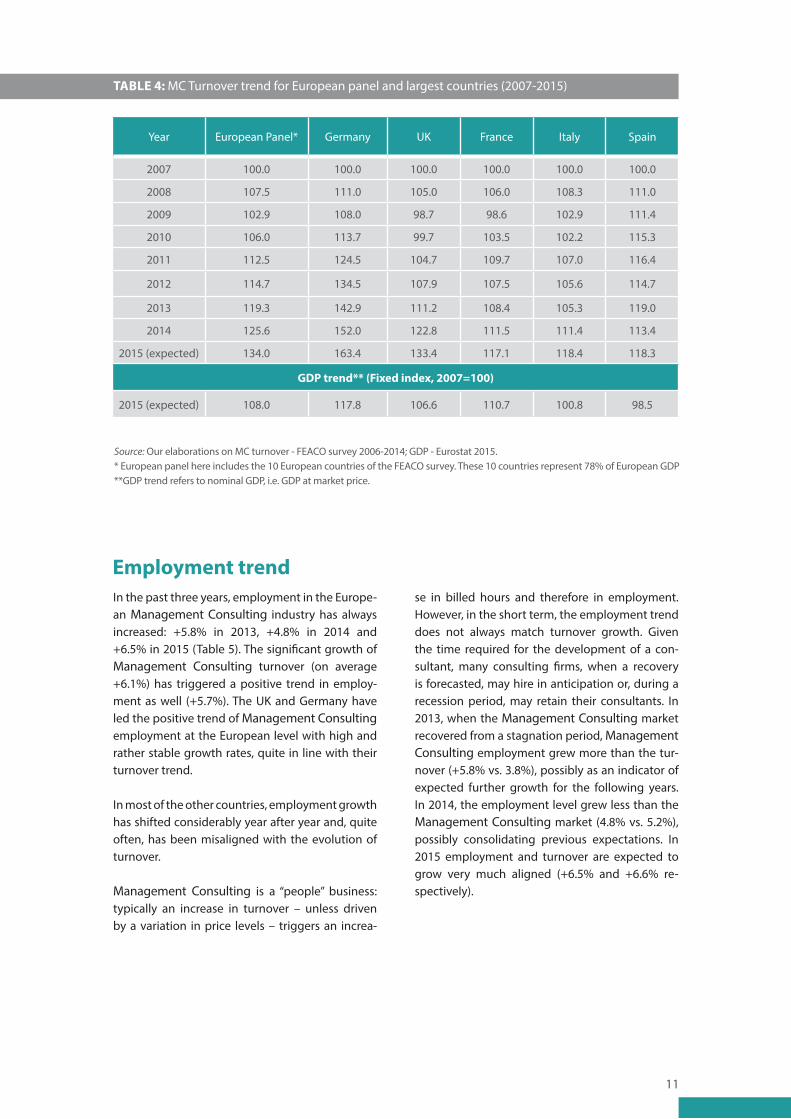
A focus on the largest European countries highli-ghts that, while in all these countries Manage-ment Consulting turnover growth has outper-formed the overall economy, the Management Consulting trends in these countries have been quite different (Table 4). In Germany, the Manage-ment Consulting market has continued to grow at
a high rate with the exception of 2009 and 2010. In other countries, such as France, Italy and Spain, the crisis has brought a more severe and prolonged stagnation in the Management Consulting indu-stry. In the UK, the change rates of the Manage-ment Consulting market have varied from -6.0% in 2009 up to +10.4% in 2014.
TABLE 3: Comparison of MC Turnover vs. GDP yearly CAGR (2007-2015)
CountryMC turnover yearly
CAGR(2007-15)
GDP** yearly CAGR
(2007-15)
Differences in CAGRbetween MC and GDP
growth rate(2007-15)
Germany 6.3% 2.1% +4.2%
Austria 5.2% 2.0% +3.2%
Finland 4.3% 1.3% +3.0%
UK 3.7% 0.8% +2.9%
European Panel* 3.7% 1.0% +2.7%
Spain 2.1% -0.2% +2.3%
Greece -0.9% -3.0% +2.1%
Italy 2.1% 0.1% +2.0%
Ireland 0.7% -0.1% +0.8%
France 2.0% 1.3% +0.7%
Slovenia 1.1% 1.0% +0.1%
11
TABLE 4: MC Turnover trend for European panel and largest countries (2007-2015)
Year European Panel* Germany UK France Italy Spain
2007 100.0 100.0 100.0 100.0 100.0 100.0
2008 107.5 111.0 105.0 106.0 108.3 111.0
2009 102.9 108.0 98.7 98.6 102.9 111.4
2010 106.0 113.7 99.7 103.5 102.2 115.3
2011 112.5 124.5 104.7 109.7 107.0 116.4
2012 114.7 134.5 107.9 107.5 105.6 114.7
2013 119.3 142.9 111.2 108.4 105.3 119.0
2014 125.6 152.0 122.8 111.5 111.4 113.4
2015 (expected) 134.0 163.4 133.4 117.1 118.4 118.3
GDP trend** (Fixed index, 2007=100)
2015 (expected) 108.0 117.8 106.6 110.7 100.8 98.5
Source: Our elaborations on MC turnover - FEACO survey 2006-2014; GDP - Eurostat 2015.* European panel here includes the 10 European countries of the FEACO survey. These 10 countries represent 78% of European GDP **GDP trend refers to nominal GDP, i.e. GDP at market price.
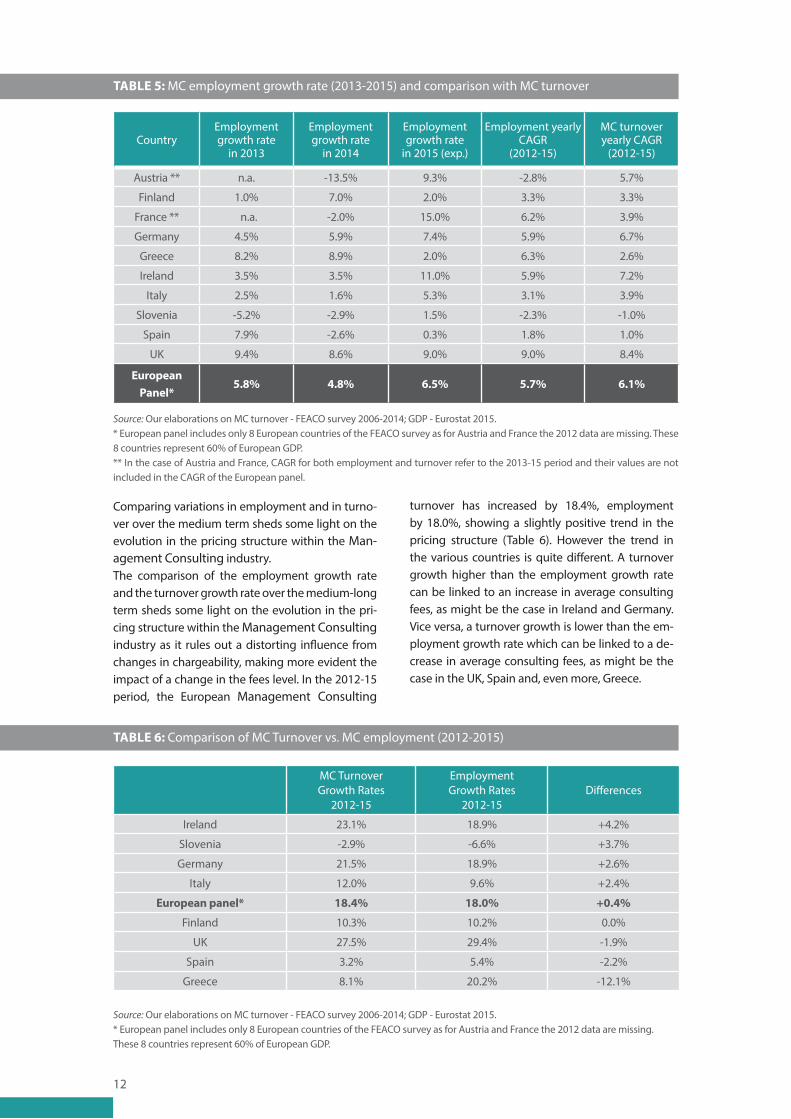
Employment trendIn the past three years, employment in the Europe-an Management Consulting industry has always increased: +5.8% in 2013, +4.8% in 2014 and +6.5% in 2015 (Table 5). The significant growth of Management Consulting turnover (on average +6.1%) has triggered a positive trend in employ-ment as well (+5.7%). The UK and Germany have led the positive trend of Management Consulting employment at the European level with high and rather stable growth rates, quite in line with their turnover trend.
In most of the other countries, employment growth has shifted considerably year after year and, quite often, has been misaligned with the evolution of turnover.
Management Consulting is a “people” business: typically an increase in turnover – unless driven by a variation in price levels – triggers an increa-
se in billed hours and therefore in employment. However, in the short term, the employment trend does not always match turnover growth. Given the time required for the development of a con-sultant, many consulting firms, when a recovery is forecasted, may hire in anticipation or, during a recession period, may retain their consultants. In 2013, when the Management Consulting market recovered from a stagnation period, Management Consulting employment grew more than the tur-nover (+5.8% vs. 3.8%), possibly as an indicator of expected further growth for the following years. In 2014, the employment level grew less than the Management Consulting market (4.8% vs. 5.2%), possibly consolidating previous expectations. In 2015 employment and turnover are expected to grow very much aligned (+6.5% and +6.6% re-spectively).
12
TABLE 5: MC employment growth rate (2013-2015) and comparison with MC turnover
CountryEmployment growth rate
in 2013
Employment growth rate
in 2014
Employment growth rate
in 2015 (exp.)
Employment yearly CAGR
(2012-15)
MC turnover yearly CAGR
(2012-15)
Austria ** n.a. -13.5% 9.3% -2.8% 5.7%
Finland 1.0% 7.0% 2.0% 3.3% 3.3%
France ** n.a. -2.0% 15.0% 6.2% 3.9%
Germany 4.5% 5.9% 7.4% 5.9% 6.7%
Greece 8.2% 8.9% 2.0% 6.3% 2.6%
Ireland 3.5% 3.5% 11.0% 5.9% 7.2%
Italy 2.5% 1.6% 5.3% 3.1% 3.9%
Slovenia -5.2% -2.9% 1.5% -2.3% -1.0%
Spain 7.9% -2.6% 0.3% 1.8% 1.0%
UK 9.4% 8.6% 9.0% 9.0% 8.4%
European Panel*
5.8% 4.8% 6.5% 5.7% 6.1%
Source: Our elaborations on MC turnover - FEACO survey 2006-2014; GDP - Eurostat 2015.* European panel includes only 8 European countries of the FEACO survey as for Austria and France the 2012 data are missing. These 8 countries represent 60% of European GDP. ** In the case of Austria and France, CAGR for both employment and turnover refer to the 2013-15 period and their values are not included in the CAGR of the European panel.
Source: Our elaborations on MC turnover - FEACO survey 2006-2014; GDP - Eurostat 2015.* European panel includes only 8 European countries of the FEACO survey as for Austria and France the 2012 data are missing. These 8 countries represent 60% of European GDP.
Comparing variations in employment and in turno-ver over the medium term sheds some light on the evolution in the pricing structure within the Man-agement Consulting industry.The comparison of the employment growth rate and the turnover growth rate over the medium-long term sheds some light on the evolution in the pri-cing structure within the Management Consulting industry as it rules out a distorting influence from changes in chargeability, making more evident the impact of a change in the fees level. In the 2012-15 period, the European Management Consulting
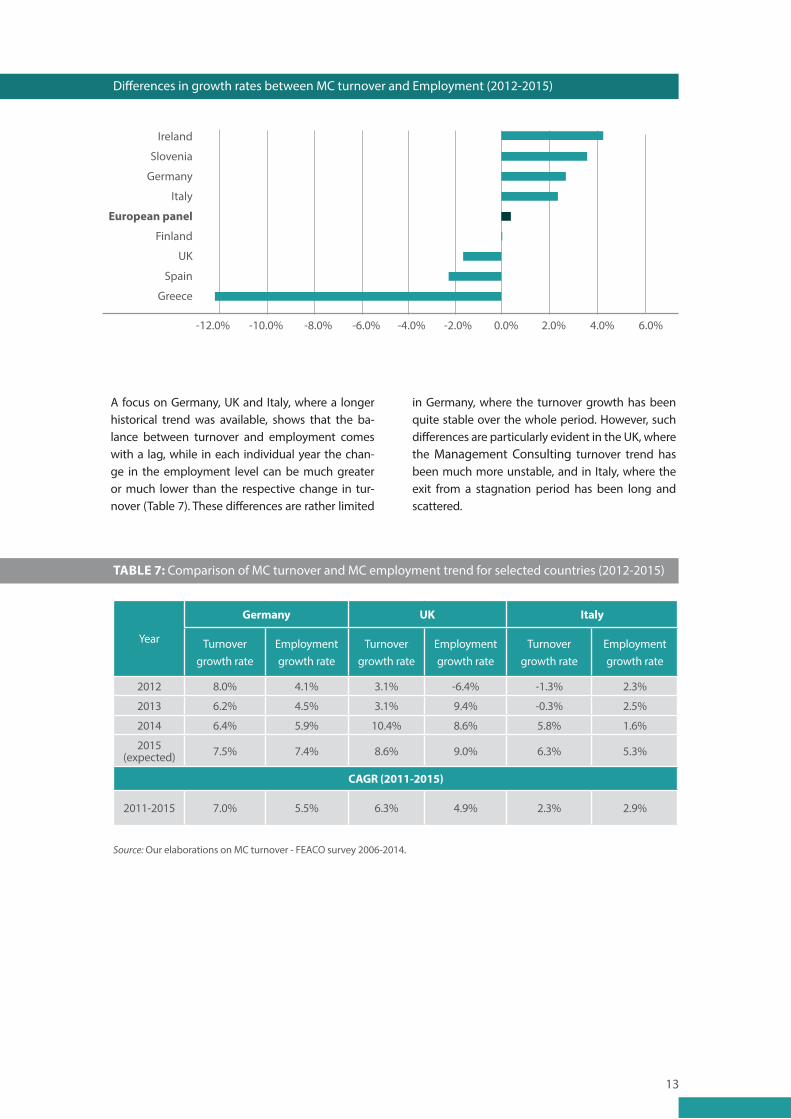
turnover has increased by 18.4%, employment by 18.0%, showing a slightly positive trend in the pricing structure (Table 6). However the trend in the various countries is quite different. A turnover growth higher than the employment growth rate can be linked to an increase in average consulting fees, as might be the case in Ireland and Germany. Vice versa, a turnover growth is lower than the em-ployment growth rate which can be linked to a de-crease in average consulting fees, as might be the case in the UK, Spain and, even more, Greece.
TABLE 6: Comparison of MC Turnover vs. MC employment (2012-2015)
MC TurnoverGrowth Rates
2012-15
EmploymentGrowth Rates
2012-15Differences
Ireland 23.1% 18.9% +4.2%
Slovenia -2.9% -6.6% +3.7%
Germany 21.5% 18.9% +2.6%
Italy 12.0% 9.6% +2.4%
European panel* 18.4% 18.0% +0.4%
Finland 10.3% 10.2% 0.0%
UK 27.5% 29.4% -1.9%
Spain 3.2% 5.4% -2.2%
Greece 8.1% 20.2% -12.1%
13
Differences in growth rates between MC turnover and Employment (2012-2015)
Ireland
Slovenia
Germany
Italy
European panel
Finland
UK
Spain
Greece
-10.0%-12.0% -8.0% -6.0% -4.0% -2.0% 0.0% 2.0% 4.0% 6.0%
A focus on Germany, UK and Italy, where a longer historical trend was available, shows that the ba-lance between turnover and employment comes with a lag, while in each individual year the chan-ge in the employment level can be much greater or much lower than the respective change in tur-nover (Table 7). These differences are rather limited
in Germany, where the turnover growth has been quite stable over the whole period. However, such differences are particularly evident in the UK, where the Management Consulting turnover trend has been much more unstable, and in Italy, where the exit from a stagnation period has been long and scattered.
TABLE 7: Comparison of MC turnover and MC employment trend for selected countries (2012-2015)
Year
Germany UK Italy
Turnover growth rate
Employment growth rate
Turnover growth rate
Employment growth rate
Turnover growth rate
Employment growth rate
2012 8.0% 4.1% 3.1% -6.4% -1.3% 2.3%
2013 6.2% 4.5% 3.1% 9.4% -0.3% 2.5%
2014 6.4% 5.9% 10.4% 8.6% 5.8% 1.6%
2015 (expected) 7.5% 7.4% 8.6% 9.0% 6.3% 5.3%
CAGR (2011-2015)
2011-2015 7.0% 5.5% 6.3% 4.9% 2.3% 2.9%
Source: Our elaborations on MC turnover - FEACO survey 2006-2014.
14
TABLE 8: Turnover per professional by country (average 2013-2015)
Turnover per professional CountryTurnover per professional
(Average 2013-2015)
Above 200,000 €Finland € 249,000
Germany € 234,000
From 150,000 to 200,000 €
France € 186,000
UK € 181,000
European panel* € 177,000
Ireland € 159,000
From 100,000 to 150,000 €
Spain € 122,000
Greece € 119,000
Austria ** € 113,000
Italy € 111,000
Below 100,000 € Slovenia** € 99,000
Turnover per Professional
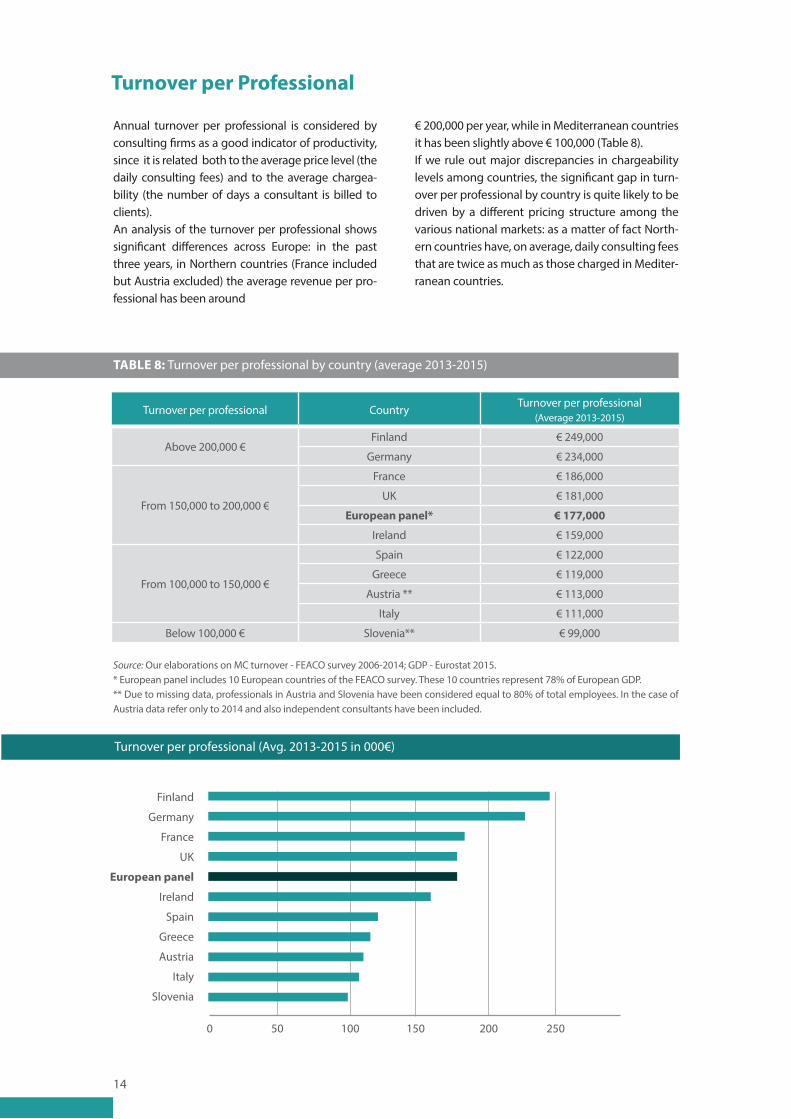
Annual turnover per professional is considered by consulting firms as a good indicator of productivity, since it is related both to the average price level (the daily consulting fees) and to the average chargea-bility (the number of days a consultant is billed to clients). An analysis of the turnover per professional shows significant differences across Europe: in the past three years, in Northern countries (France included but Austria excluded) the average revenue per pro-fessional has been around
€ 200,000 per year, while in Mediterranean countries it has been slightly above € 100,000 (Table 8). If we rule out major discrepancies in chargeability levels among countries, the significant gap in turn-over per professional by country is quite likely to be driven by a different pricing structure among the various national markets: as a matter of fact North-ern countries have, on average, daily consulting fees that are twice as much as those charged in Mediter-ranean countries.
Source: Our elaborations on MC turnover - FEACO survey 2006-2014; GDP - Eurostat 2015.* European panel includes 10 European countries of the FEACO survey. These 10 countries represent 78% of European GDP. ** Due to missing data, professionals in Austria and Slovenia have been considered equal to 80% of total employees. In the case of Austria data refer only to 2014 and also independent consultants have been included.
Turnover per professional (Avg. 2013-2015 in 000€)
Finland
Germany
France
UK
European panel
Ireland
Spain
Greece
Austria
Italy
Slovenia
0 50 100 150 200 250
15
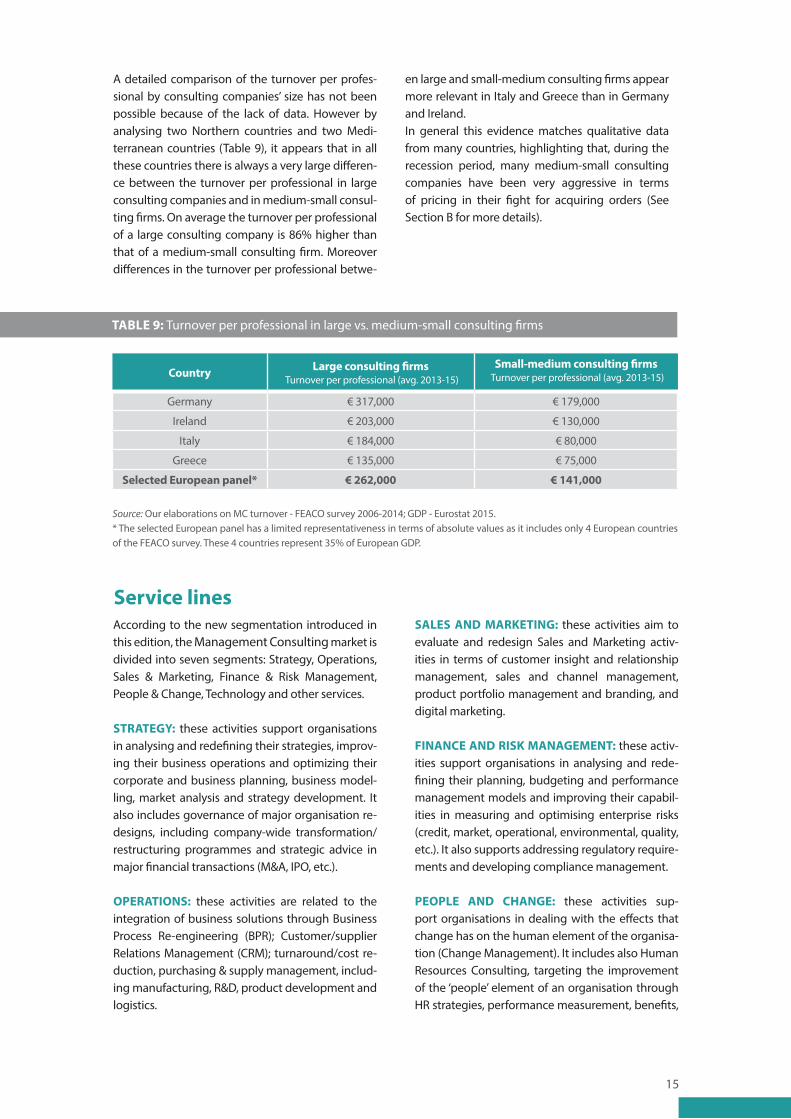
A detailed comparison of the turnover per profes-sional by consulting companies’ size has not been possible because of the lack of data. However by analysing two Northern countries and two Medi-terranean countries (Table 9), it appears that in all these countries there is always a very large differen-ce between the turnover per professional in large consulting companies and in medium-small consul-ting firms. On average the turnover per professional of a large consulting company is 86% higher than that of a medium-small consulting firm. Moreover differences in the turnover per professional betwe-
en large and small-medium consulting firms appear more relevant in Italy and Greece than in Germany and Ireland. In general this evidence matches qualitative data from many countries, highlighting that, during the recession period, many medium-small consulting companies have been very aggressive in terms of pricing in their fight for acquiring orders (See Section B for more details).
TABLE 9: Turnover per professional in large vs. medium-small consulting firms
Country Large consulting firms Turnover per professional (avg. 2013-15)
Small-medium consulting firms Turnover per professional (avg. 2013-15)
Germany € 317,000 € 179,000
Ireland € 203,000 € 130,000
Italy € 184,000 € 80,000
Greece € 135,000 € 75,000
Selected European panel* € 262,000 € 141,000
Source: Our elaborations on MC turnover - FEACO survey 2006-2014; GDP - Eurostat 2015.* The selected European panel has a limited representativeness in terms of absolute values as it includes only 4 European countries of the FEACO survey. These 4 countries represent 35% of European GDP.
Service linesAccording to the new segmentation introduced in this edition, the Management Consulting market is divided into seven segments: Strategy, Operations, Sales & Marketing, Finance & Risk Management, People & Change, Technology and other services.
STRATEGY: these activities support organisations in analysing and redefining their strategies, improv-ing their business operations and optimizing their corporate and business planning, business model-ling, market analysis and strategy development. It also includes governance of major organisation re-designs, including company-wide transformation/restructuring programmes and strategic advice in major financial transactions (M&A, IPO, etc.).
OPERATIONS: these activities are related to the integration of business solutions through Business Process Re-engineering (BPR); Customer/supplier Relations Management (CRM); turnaround/cost re-duction, purchasing & supply management, includ-ing manufacturing, R&D, product development and logistics.
SALES AND MARKETING: these activities aim to evaluate and redesign Sales and Marketing activ-ities in terms of customer insight and relationship management, sales and channel management, product portfolio management and branding, and digital marketing.
FINANCE AND RISK MANAGEMENT: these activ-ities support organisations in analysing and rede-fining their planning, budgeting and performance management models and improving their capabil-ities in measuring and optimising enterprise risks (credit, market, operational, environmental, quality, etc.). It also supports addressing regulatory require-ments and developing compliance management.
PEOPLE AND CHANGE: these activities sup-port organisations in dealing with the effects that change has on the human element of the organisa-tion (Change Management). It includes also Human Resources Consulting, targeting the improvement of the ‘people’ element of an organisation through HR strategies, performance measurement, benefits,
16
compensations and retirement schemes, talent de-velopment programmes and executive coaching.
TECHNOLOGY: these activities support organisa-tions in evaluating their IT strategies with the objec-tive of aligning technology with business processes. These services include strategic support to decisions related to the planning and implementation of new technologies for business applications, including IT Network & Security and Data Centre architecture.
OTHER SERVICES: these activities include a variety of services complementary to Management Con-sulting, such as training, market studies, outplace-ment, executive selection and recruitment.
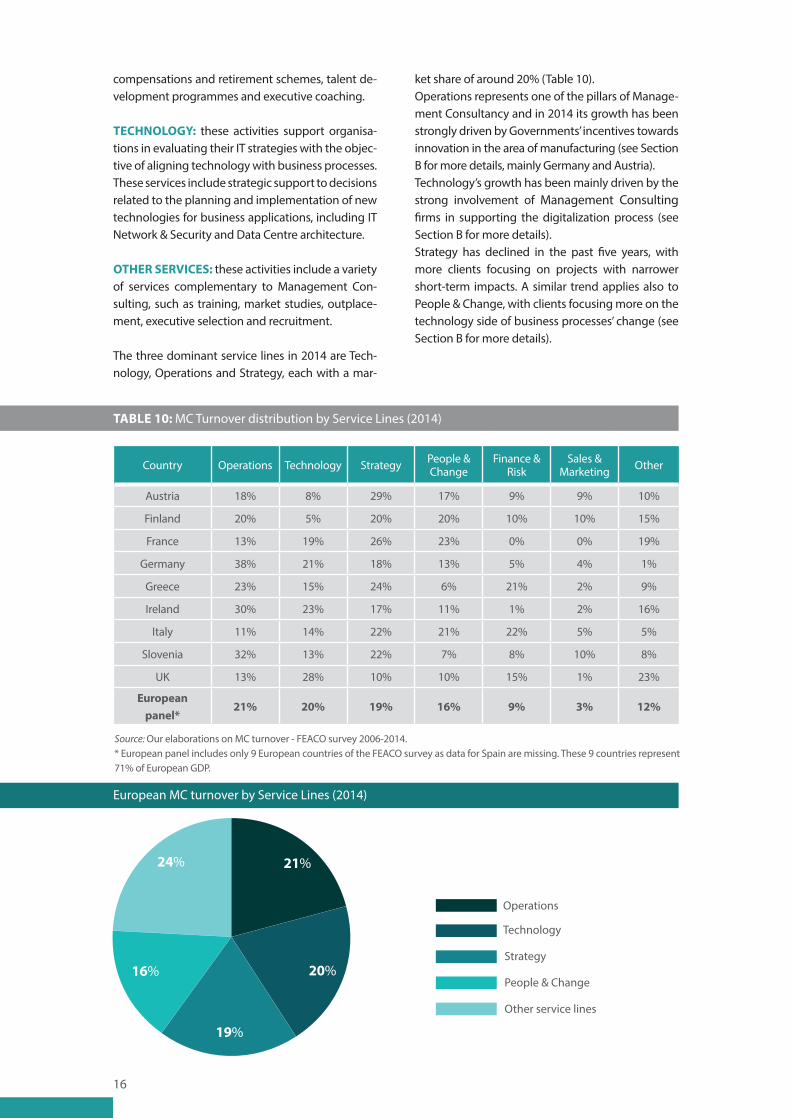
The three dominant service lines in 2014 are Tech-nology, Operations and Strategy, each with a mar-
ket share of around 20% (Table 10). Operations represents one of the pillars of Manage-ment Consultancy and in 2014 its growth has been strongly driven by Governments’ incentives towards innovation in the area of manufacturing (see Section B for more details, mainly Germany and Austria). Technology’s growth has been mainly driven by the strong involvement of Management Consulting firms in supporting the digitalization process (see Section B for more details).Strategy has declined in the past five years, with more clients focusing on projects with narrower short-term impacts. A similar trend applies also to People & Change, with clients focusing more on the technology side of business processes’ change (see Section B for more details).
TABLE 10: MC Turnover distribution by Service Lines (2014)
Source: Our elaborations on MC turnover - FEACO survey 2006-2014.* European panel includes only 9 European countries of the FEACO survey as data for Spain are missing. These 9 countries represent 71% of European GDP.
Country Operations Technology Strategy People & Change
Finance & Risk
Sales & Marketing Other
Austria 18% 8% 29% 17% 9% 9% 10%
Finland 20% 5% 20% 20% 10% 10% 15%
France 13% 19% 26% 23% 0% 0% 19%
Germany 38% 21% 18% 13% 5% 4% 1%
Greece 23% 15% 24% 6% 21% 2% 9%
Ireland 30% 23% 17% 11% 1% 2% 16%
Italy 11% 14% 22% 21% 22% 5% 5%
Slovenia 32% 13% 22% 7% 8% 10% 8%
UK 13% 28% 10% 10% 15% 1% 23%
European panel*
21% 20% 19% 16% 9% 3% 12%
Technology
Strategy
People & Change
Operations
Other service lines
24% 21%
16%
19%
20%
European MC turnover by Service Lines (2014)
17
Client industriesThe Management Consulting market has been analysed by Clients, considering the three most rel-evant segments of economic activity, namely Man-ufacturing, Services and the Public Sector, and then detailing by industries within the Services.
The Manufacturing Sector includes all the Consum-er and Industrial Products, namely Aerospace and Defence; Automotive; Consumer Products; High Tech Products; Machinery; Chemicals, Pharmaceuti-cal & Biotech; Other Manufacturing Industries.
The Service Sector: includes Financial Services (Banking and Financial services; Insurance), Energy & Utilities (Oil & Gas; Chemicals & Petrochemicals; Utilities), Telecoms and Media (Communication; Media and Entertainment; Telecommunications; Publishing) and Other Services (Retail; Travel & Lei-sure; Private Health Care; Software and Computer Services; Business Services.)
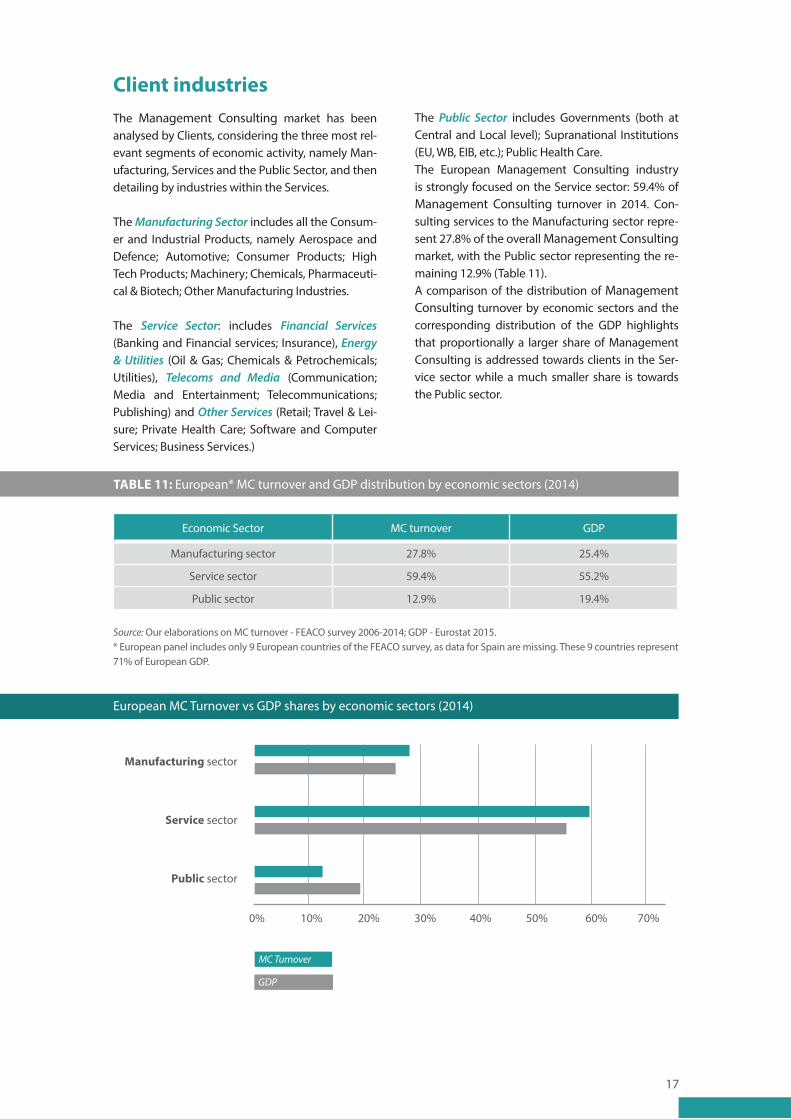
The Public Sector includes Governments (both at Central and Local level); Supranational Institutions (EU, WB, EIB, etc.); Public Health Care.The European Management Consulting industry is strongly focused on the Service sector: 59.4% of Management Consulting turnover in 2014. Con-sulting services to the Manufacturing sector repre-sent 27.8% of the overall Management Consulting market, with the Public sector representing the re-maining 12.9% (Table 11).A comparison of the distribution of Management Consulting turnover by economic sectors and the corresponding distribution of the GDP highlights that proportionally a larger share of Management Consulting is addressed towards clients in the Ser-vice sector while a much smaller share is towards the Public sector.
TABLE 11: European* MC turnover and GDP distribution by economic sectors (2014)
Source: Our elaborations on MC turnover - FEACO survey 2006-2014; GDP - Eurostat 2015. * European panel includes only 9 European countries of the FEACO survey, as data for Spain are missing. These 9 countries represent 71% of European GDP.
Economic Sector MC turnover GDP
Manufacturing sector 27.8% 25.4%
Service sector 59.4% 55.2%
Public sector 12.9% 19.4%
European MC Turnover vs GDP shares by economic sectors (2014)
Manufacturing sector
Service sector
Public sector
0% 10% 20% 30% 40% 50% 60% 70%
MC Turnover
GDP
18
TABLE 12: MC turnover vs GDP – share of economy sectors by countries (2014)
MC turnover by sectors (share of 2014 MC turnover)
GDP by sectors (share of 2014 GDP)
Mftg Service P.A. Country Mftg Service P.A.
39.0% 49.4% 11.6% Austria 30.1% 52.3% 17.6%
20.0% 70.0% 10.0% Finland 28.3% 49.5% 22.2%
27.0% 63.0% 10.0% France 20.6% 56.5% 22.9%
33.6% 57.3% 9.1% Germany 31.0% 50.6% 18.4%
19.0% 50.0% 31.0% Greece 20.1% 58.3% 21.6%
22.0% 53.0% 25.0% Ireland 29.9% 52.3% 17.8%
38.1% 52.9% 9.0% Italy 26.0% 57.2% 16.8%
35.0% 52.0% 13.0% Slovenia 34.3% 48.3% 17.4%
13.6% 65.1% 21.3% UK 21.0% 59.7% 19.3%
27.8% 59.3% 12.9% European Panel * 25.4% 55.2% 19.4%
Source: Our elaborations on MC turnover - FEACO survey 2006-2014; GDP - Eurostat 2015.* European panel includes only 9 European countries of the FEACO survey, as data for Spain are missing. These 9 countries represent 71% of European GDP
In all countries, Management Consulting turnover is distributed across economic sectors similarly to the country GDP structure (Table 12). The Service sector is always the most relevant buyer of man-agement consultancy. The Manufacturing sector is buying a share of Management Consulting great-er than the GDP share only in Austria and Germa-ny (because of government policies supporting innovative manufacturing) and in Italy. The limited spending in Management Consulting by the Pub-
lic Administration – compared to the GDP share – characterises most European countries with the exception of the UK, Ireland and Greece. The pan-el is lacking data from Eastern European countries but qualitative evidence from the country profiles highlights that in these countries Management Consulting to the Public Administration (mainly supported by EU funding) plays a major role (see Section B for more details).
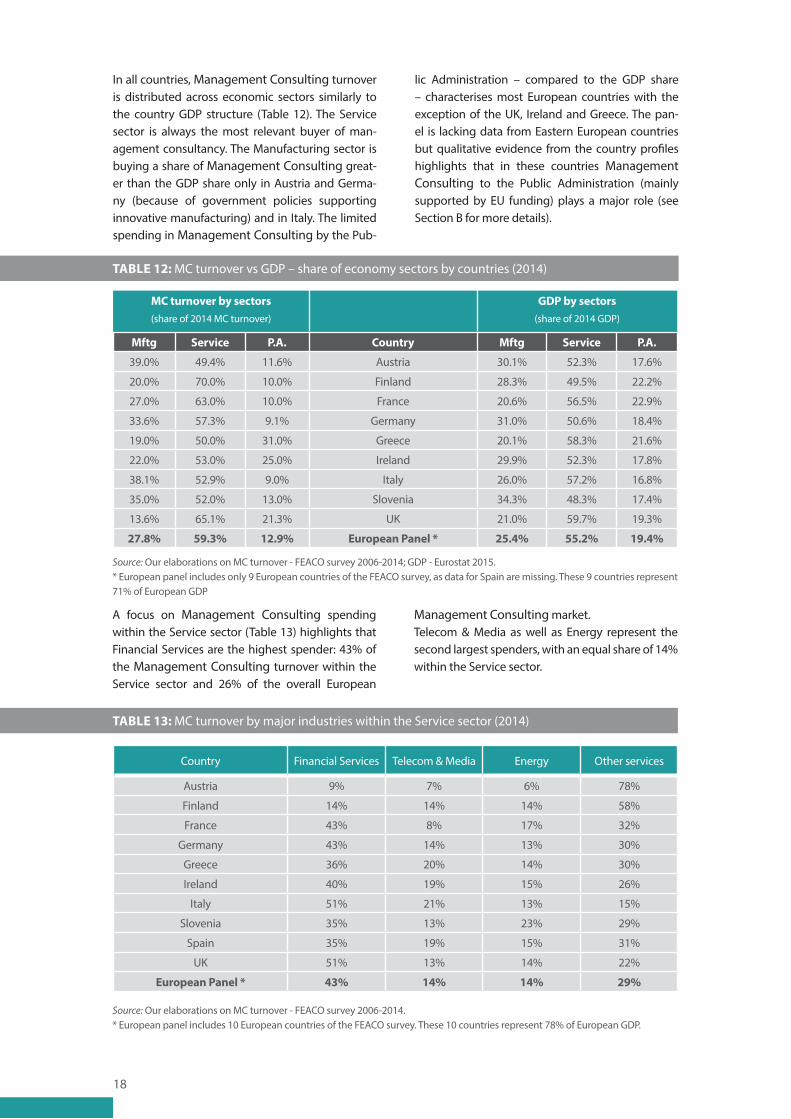
A focus on Management Consulting spending within the Service sector (Table 13) highlights that Financial Services are the highest spender: 43% of the Management Consulting turnover within the Service sector and 26% of the overall European
Management Consulting market. Telecom & Media as well as Energy represent the second largest spenders, with an equal share of 14% within the Service sector.
TABLE 13: MC turnover by major industries within the Service sector (2014)
Country Financial Services Telecom & Media Energy Other services
Austria 9% 7% 6% 78%
Finland 14% 14% 14% 58%
France 43% 8% 17% 32%
Germany 43% 14% 13% 30%
Greece 36% 20% 14% 30%
Ireland 40% 19% 15% 26%
Italy 51% 21% 13% 15%
Slovenia 35% 13% 23% 29%
Spain 35% 19% 15% 31%
UK 51% 13% 14% 22%
European Panel * 43% 14% 14% 29%
Source: Our elaborations on MC turnover - FEACO survey 2006-2014.* European panel includes 10 European countries of the FEACO survey. These 10 countries represent 78% of European GDP.
19
European MC Turnover within the Service sector (2014)
Telecom & Media
Energy
Other services
Financial services
43%
29%
14%
14%
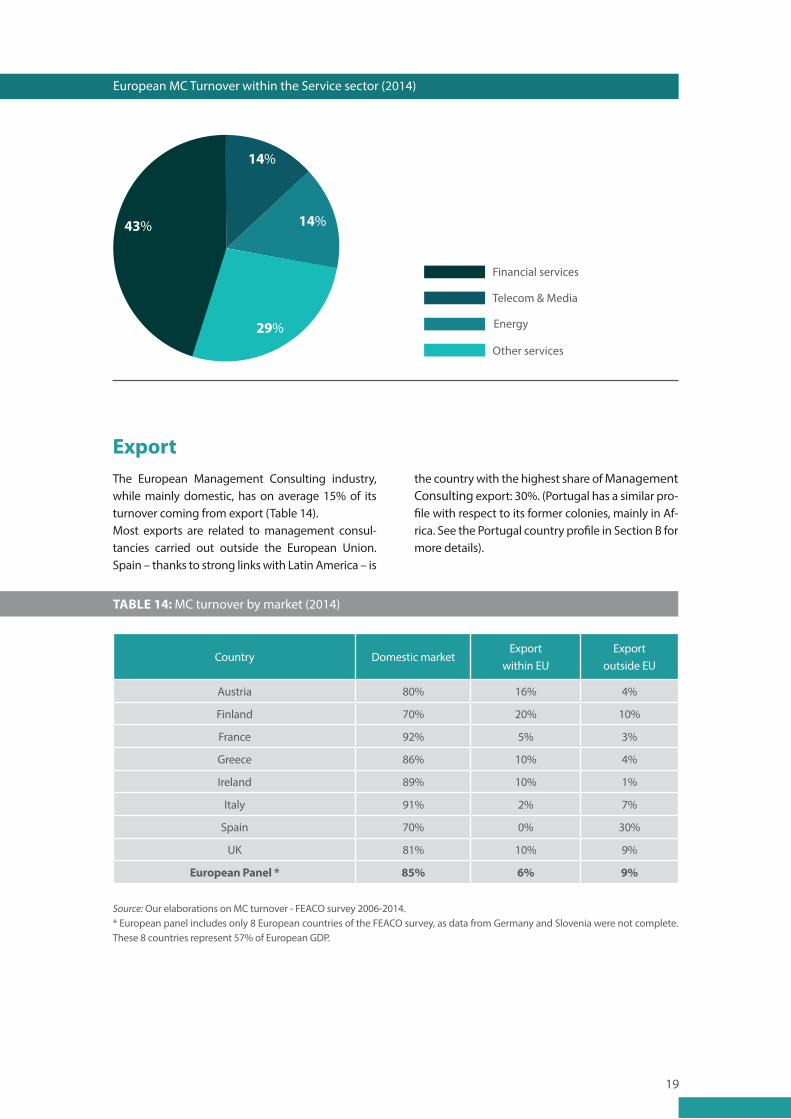
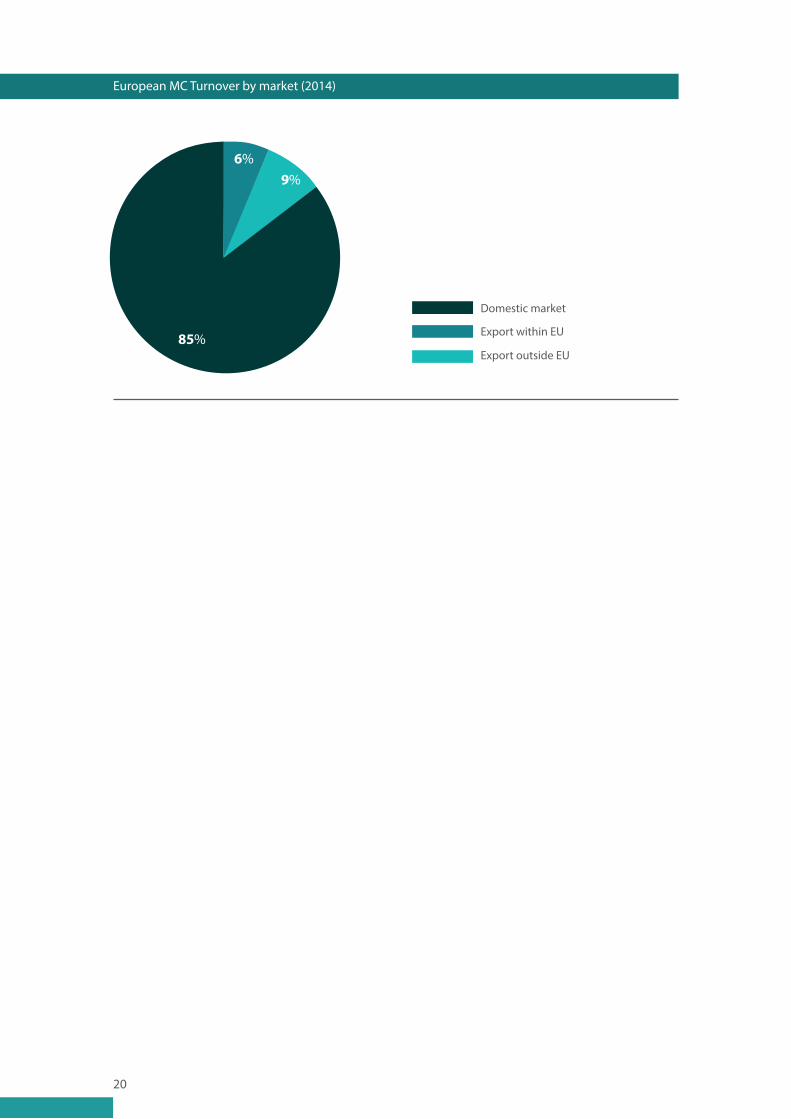
ExportThe European Management Consulting industry, while mainly domestic, has on average 15% of its turnover coming from export (Table 14). Most exports are related to management consul-tancies carried out outside the European Union. Spain – thanks to strong links with Latin America – is
the country with the highest share of Management Consulting export: 30%. (Portugal has a similar pro-file with respect to its former colonies, mainly in Af-rica. See the Portugal country profile in Section B for more details).
TABLE 14: MC turnover by market (2014)
Country Domestic marketExport
within EUExport
outside EU
Austria 80% 16% 4%
Finland 70% 20% 10%
France 92% 5% 3%
Greece 86% 10% 4%
Ireland 89% 10% 1%
Italy 91% 2% 7%
Spain 70% 0% 30%
UK 81% 10% 9%
European Panel * 85% 6% 9%
Source: Our elaborations on MC turnover - FEACO survey 2006-2014.* European panel includes only 8 European countries of the FEACO survey, as data from Germany and Slovenia were not complete. These 8 countries represent 57% of European GDP.
20
European MC Turnover by market (2014)
85%
6%9%
Export within EU
Domestic market
Export outside EU
21
Section BSelected Management Consultancy country profiles
The profiles on national Management Consulting (MC) markets reported in this section are based on the data provided by the national Associations from Austria, Finland, France, Germany, Greece, Ireland, Italy, Norway, Portugal, Romania, Slovenia, Spain and the United Kingdom.
Each country profile has a short introduction on the state of the overall economy in the country, then it focuses on the Management Consulting industry, providing industry data as well highlighting the major trends in the business (as collected by the national Association).
22
Key data on the Management Consulting industry
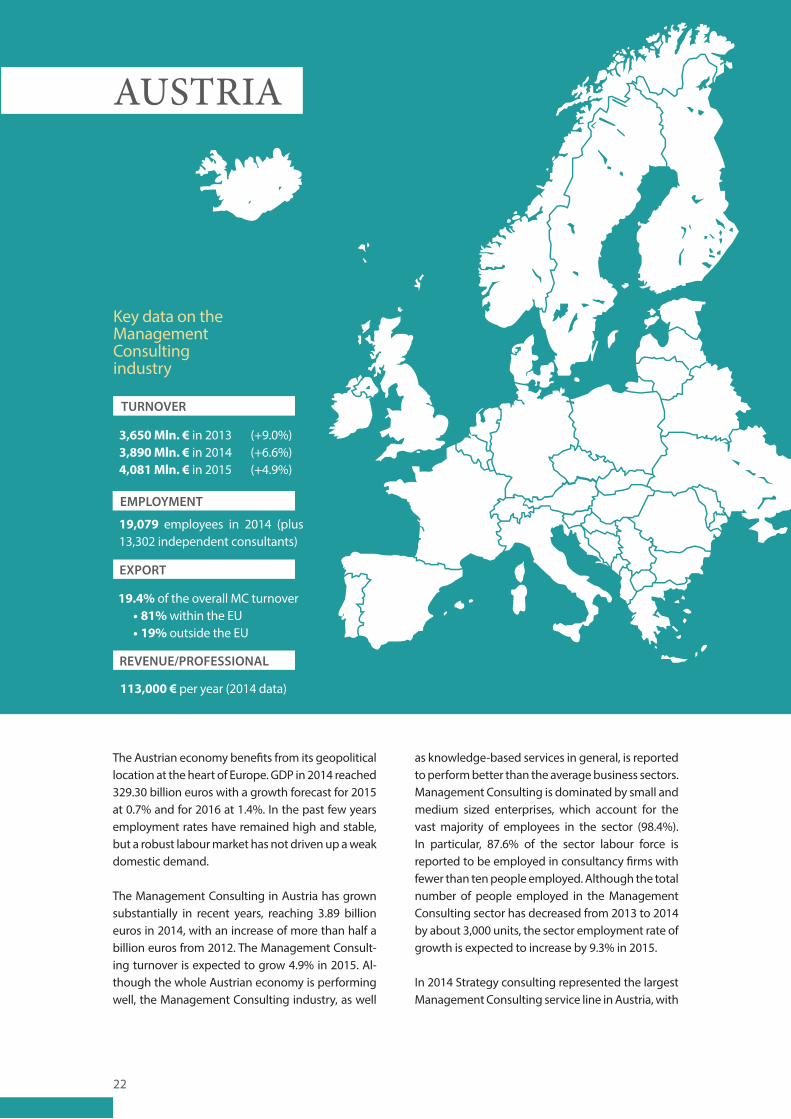
3,650 Mln. € in 2013 (+9.0%)3,890 Mln. € in 2014 (+6.6%)4,081 Mln. € in 2015 (+4.9%)
19.4% of the overall MC turnover• 81% within the EU• 19% outside the EU
19,079 employees in 2014 (plus 13,302 independent consultants)
TURNOVER
EMPLOYMENT
REVENUE/PROFESSIONAL
EXPORT
113,000 € per year (2014 data)
AUSTRIA
The Austrian economy benefits from its geopolitical location at the heart of Europe. GDP in 2014 reached 329.30 billion euros with a growth forecast for 2015 at 0.7% and for 2016 at 1.4%. In the past few years employment rates have remained high and stable, but a robust labour market has not driven up a weak domestic demand.
The Management Consulting in Austria has grown substantially in recent years, reaching 3.89 billion euros in 2014, with an increase of more than half a billion euros from 2012. The Management Consult-ing turnover is expected to grow 4.9% in 2015. Al-though the whole Austrian economy is performing well, the Management Consulting industry, as well
as knowledge-based services in general, is reported to perform better than the average business sectors. Management Consulting is dominated by small and medium sized enterprises, which account for the vast majority of employees in the sector (98.4%). In particular, 87.6% of the sector labour force is reported to be employed in consultancy firms with fewer than ten people employed. Although the total number of people employed in the Management Consulting sector has decreased from 2013 to 2014 by about 3,000 units, the sector employment rate of growth is expected to increase by 9.3% in 2015.
In 2014 Strategy consulting represented the largest Management Consulting service line in Austria, with
23
a share of 29% of the total industry turnover. Other relevant service lines are Operations (18.1%) and People and Change (17%). All these service lines, plus the Sales and Marketing consulting, are contin-uously growing as their turnovers are expected to increase by more than 5% in 2015.
The greatest share of Management Consulting cli-ents is represented by the Consumer and Industrial Products segment, which accounts for 39% of the whole Management Consulting turnover in 2014.
Management Consulting services are essentially tar-geted at the domestic market, with a share of 80.6% of the total sector turnover made within the Aus-trian borders, while exports within the EU totalled 15.8% and exports outside the EU 3.6% of the total turnover in 2014.
Current trends in the Austrian consulting industry in-clude: Disruptive Innovation Management, Change Management (on topics such as flexible workplace environment and changing demographics), Busi-ness Process Optimisation Management, Adaptive Management (mainly regarding mobility and inter-active marketing), IT-Strategy Management, Indus-try 4.0 Consulting and Resource Efficiency.
This country profile has been prepared by UBIT.
The Austrian Professional Association for Man-agement Consultancy, Accounting and Informa-
tion Technology (UBIT) was founded in 1985 as a self-governing subsidiary of the Austrian Federal Economic Chamber. Based on the Austrian Eco-nomic Chamber Act, membership of the association is regulated by law. Membership in 2014 reached 63,725 members, with 32,244 members in the Infor-mation Technology sector, 21,387 members in man-agement consultancy and 10,094 members who are accountants.
The main tasks for UBIT are representing the inter-ests of, as well as providing services for, UBIT Mem-bers. UBIT is actively responsible for developing and shaping the economic and regulatory backdrop in Austria. As such, UBIT develops and defends busi-ness interests, interacting with regulatory author-ities and government on a national and EU level. UBIT initiates, moderates and partners regional, national and global promotion activities for the benefit of the Austrian Consulting industry sector. Service is provided through information and advice for association members. Also, UBIT is the most im-portant training and education partner for the con-sulting firms.
UBIT Toolbox includes: Constantinus Award – award for best practices; Incite – academy for education and qualification; and Beratertag – main annual event.
AUSTRIA
Austrian Professional Association for Management Consultancy and Information Technology
www.ubit.at | www.incite.at
National Association
24
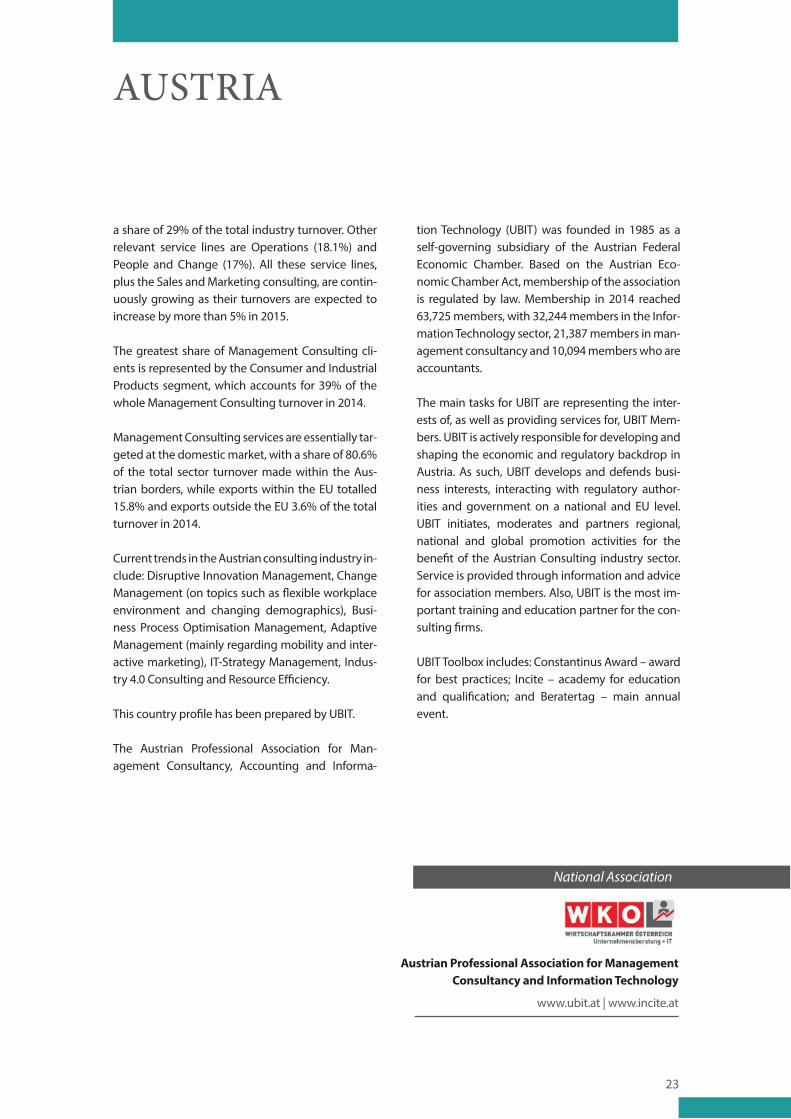
The Finnish economy is growing slowly: +1.2% in 2014 and an expected +0.8% in 2015. A marked decline in investment rates is the main determi-nant of its slow economic growth; however, positi-ve net exports have helped to improve the Finnish economy. In 2016 GDP is expected to grow more rapidly, thanks to general improvements in key in-dustries such as electronic and paper. In addition, wage reforms are thought to restore competitive-ness in the labour market and support consumer demand. A slight improvement of external demand and a marked decline in fuel prices are also expected to play a role in revamping the Finnish economy in the next years.
The Management Consulting turnover is increasing at higher rates than GDP: +5% both in 2014 and 2015. The total employment in the Management Consulting industry has increased by 8% in the last two years. In 2015, a further 2% increase in employ-ment is expected in countertrend to the overall country employment trend, where unemployment is expected to increase by almost 1% in 2015.
The Finnish Management Consulting turnover is 60% associated with large firms, with the remaining 40% shared equally among small and medium-sized firms.
Key data on the Management Consulting industry
30% of the overall MC turnover• 67% within the EU• 33% outside the EU
TURNOVER
EMPLOYMENT
REVENUE/PROFESSIONAL
EXPORT
249,000 € per year (avg. 2013-15)
10,700 employees in 2014• 80% professionals • 20% staff
2,000 Mln. € in 2013 (+0.0%)2,100 Mln. € in 2014 (+5.0%)2,205 Mln. € in 2015 (+5.0%)
FINLAND
25
FINLAND
In terms of service lines, most of the turnover is shared equally among three different segments: Strategy, Operations and People & Change, amounting to 20% each. Sales & Marketing and Finance & Risk represent 10% each of total Management Consulting turnover, while 5% of the market is covered by the Technology segment. Strategy and People & Change are expected to achieve the highest growth in 2015.
The Consumer & Industrial segment represents ap-proximately 20% of the total Management Consult-ing turnover, while the other segments account for about 10% each.
Finnish Management Consulting export is around 30% of the overall Management Consulting tur-nover: 2/3 of export towards EU countries and 1/3 towards countries outside the EU.
This country profile has been prepared based on the questionnaire provided by the Finnish Manage-ment Consultants Association (LJK).
LJK was formed in 1961 to represent the manage-ment consultancy industry towards its clients, the media and the Government. The association sup-ports its members by training, education, networ-king and public relations.
The Finnish Management Consultants Association (LJK) is a member of FEACO (European Federation of Management Consultancies Associations), ICMCI (International Council of Management Consulting Institutes) and ICC (International Chamber of Com-merce).
Liikkeenjohdon Konsultit LJK ry
www.ljk.fi
National Association
26
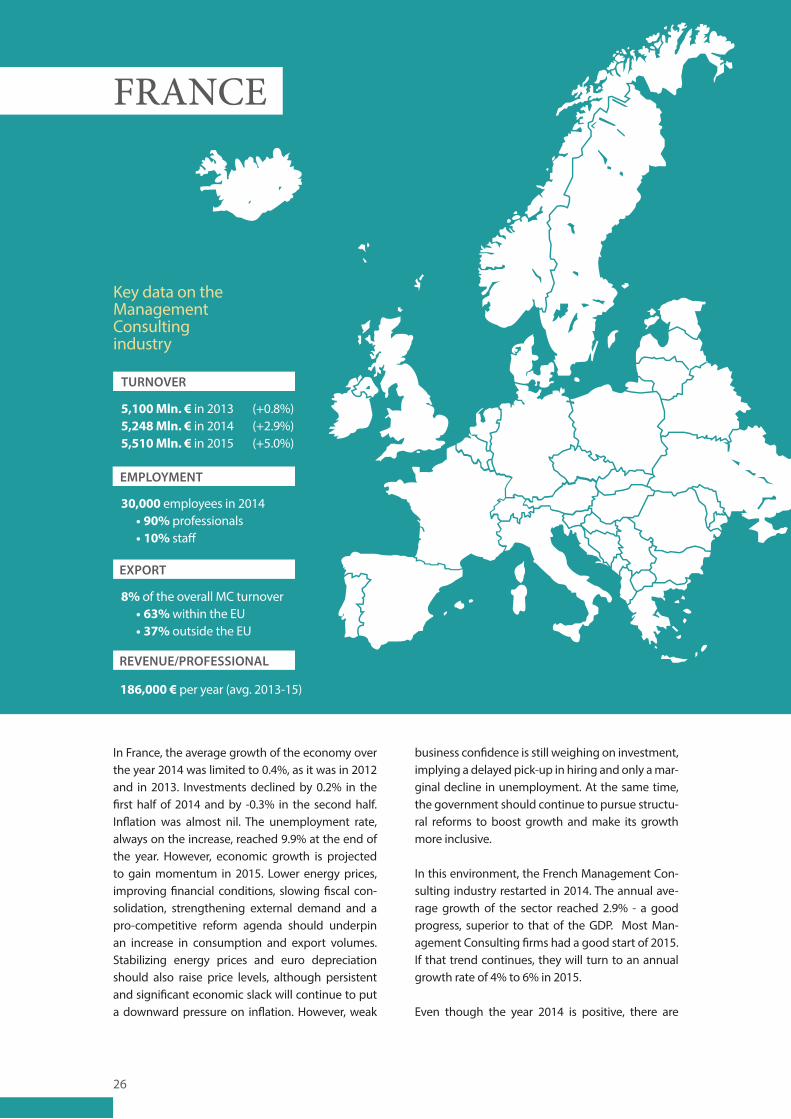
5,100 Mln. € in 2013 (+0.8%)5,248 Mln. € in 2014 (+2.9%)5,510 Mln. € in 2015 (+5.0%)
8% of the overall MC turnover• 63% within the EU• 37% outside the EU
30,000 employees in 2014• 90% professionals • 10% staff
186,000 € per year (avg. 2013-15)
In France, the average growth of the economy over the year 2014 was limited to 0.4%, as it was in 2012 and in 2013. Investments declined by 0.2% in the first half of 2014 and by -0.3% in the second half. Inflation was almost nil. The unemployment rate, always on the increase, reached 9.9% at the end of the year. However, economic growth is projected to gain momentum in 2015. Lower energy prices, improving financial conditions, slowing fiscal con-solidation, strengthening external demand and a pro-competitive reform agenda should underpin an increase in consumption and export volumes. Stabilizing energy prices and euro depreciation should also raise price levels, although persistent and significant economic slack will continue to put a downward pressure on inflation. However, weak
business confidence is still weighing on investment, implying a delayed pick-up in hiring and only a mar-ginal decline in unemployment. At the same time, the government should continue to pursue structu-ral reforms to boost growth and make its growth more inclusive.
In this environment, the French Management Con-sulting industry restarted in 2014. The annual ave-rage growth of the sector reached 2.9% - a good progress, superior to that of the GDP. Most Man-agement Consulting firms had a good start of 2015. If that trend continues, they will turn to an annual growth rate of 4% to 6% in 2015.
Even though the year 2014 is positive, there are
FRANCE
Key data on the Management Consulting industry
TURNOVER
EMPLOYMENT
REVENUE/PROFESSIONAL
EXPORT
27
still critical issues such as a stretched lead-time to get the projects and a decreased visibility on futu-re orders. The general feeling is that it is harder and harder to conduct business. Clients cut assignments in phases, they reduce the duration of missions and compact them, with an effect on the increase of the unemployment rate.
The French Management Consulting market is di-vided into three segments (low-cost, intermediate and value-added), characterised by positioning and differentiated fee rates. The current evolution, car-ried towards more added value and specialization, is in favour of both extremes. In 2014, the relative position of the intermediate segment is for the first time under the 50% threshold of the Management Consulting market.
In a difficult environment, the consulting firms that take the best advantage of the dynamics of the mar-ket are often medium-sized entities, created in the 2000s, still managed by their founders. On the other hand the large companies are in line with the avera-ge growth rate of the market.
Purchasing departments have become a compulsory step. There is, however, a major difference between those who are chosen at first by the end customer and who deal with buyers at the end of the process and the others for whom purchasing is their sole in-terface. In this case, the buyers-consultants relation-ship is considered to be conflictual, even if it tends to professionalise and normalise. Consultants consider themselves little understood by the buyers, whom they blame for not knowing how to recognise the value of their services, and for not having any other criterion than the daily fee rate.
The average daily fee rate almost did not evolve for several years and there is a general feeling of an in-sufficient level of profitability to finance investmen-ts. In 2014, the earnings before tax decreased with regard to the previous years.
The international activities constitute a significant part of the activity of French consulting firms. Even
if the export as such remains lower than 10%, the-re is practically no consulting firm which does not have a significant part of its activity linked to inter-national projects. French firms are traditionally acti-ve in close and French speaking geographies. For a few years there have been developments in more distant zones. Several French consulting firms now have offices in Canada but also in the USA, Asia and the Middle East.
The total employment in the Management Consult-ing industry is about 30,000 people. Just like the evolution of sales, there is a contrast between those companies, which have begun to recruit again, and a large number which do not recruit or which have recruited little. The average employment in 2014 decreased by -2%, highlighting the efforts to restore competitiveness. In 2015, most consulting compa-nies plan to recruit in proportions superior to 20% to face the surge of activities.
The distribution of the market by service lines con-firms an evolution of the demand in favour of the higher value-added services, supported by tech-nological issues and digital transformation. In this context, three domains record significant progress: strategy, information systems and innovation con-sulting. Other domains (organisation, change ma-nagement, performance improvement, HR, cost cutting) are stable or decline slightly.
The top client-industries are the Financial Services and the Industrial sector, both with a 27% market share. Consumer Goods, Aeronautics and Defence and Automobile come in the first positions and also Life Sciences continues to progress. The Insurance sector is particularly active due to statutory issues, consolidation movements and transformation projects. Energy and Utilities suffer from the rele-vant fall of oil prices, which impacts on the profita-bility of the sector and limits their investments and projects. The Public Sector remains chronically low, stable at 10%.
The wave of digital transformation has now arrived like a tsunami. It gradually submerges the whole
FRANCE
28
market and already represents more than 50% of the business. According to their culture, consulting companies approach digital in a more or less tech-nological mode. They are aware that it opens the game to new forms of competition.
In the value-added segment, it seems that there will always be room, beside the big international firms, for medium-sized consulting firms, “boutiques” of 50 or 60 people offering high-end services. In this segment, the big strategy firms are particularly chal-lenged by the entrance of the big international au-dit firms, whose financial means are very important. In the low-cost segment, the main issue concerns the pressure on fee rates. Purchasing departments tend to disregard the traditional distinction betwe-en Advisory, IT and Engineering, with the risk of le-velling the management advisory fee rates to the price lists of these sectors. The non-specialized con-sulting companies, positioned in the intermediate segment, are exposed potentially to the fall in de-mand and to the commoditization of their services; they have to specialize to resist. In this context, the technological themes can provide a good vector even if these tend to become commonplace and to go out gradually from the domain of the consulting portfolio.
This country report has been prepared by Con-sult’inFrance.
Consult’inFrance (formerly Syntec Conseil en Ma-nagement) is the French professional association representing strategy and Management Consulting firms in France. The association includes 80 consul-tancies, diverse in size and fields of expertise, which work both for the private and public sectors and ac-count, on the whole, for more than 60% of the mar-ket expressed in turnover and people.
FRANCE
Consult in Francewww.consultinfrance.fr
National Association
Consult’inFrance defends the interests of consultan-cies and represents the profession towards a wide range of stakeholders including public and govern-mental authorities.
As a union, Consult’inFrance is part of Federation Syntec, which regroups 1,250 companies in the fields of Engineering, IT Services, Professional Trai-ning, and Advisory. Federation Syntec represents companies with a total of 750,000 employees and 70 billion euros turnover.
29
Key data on the Management Consulting industry
TURNOVER
EMPLOYMENT
REVENUE/PROFESSIONAL
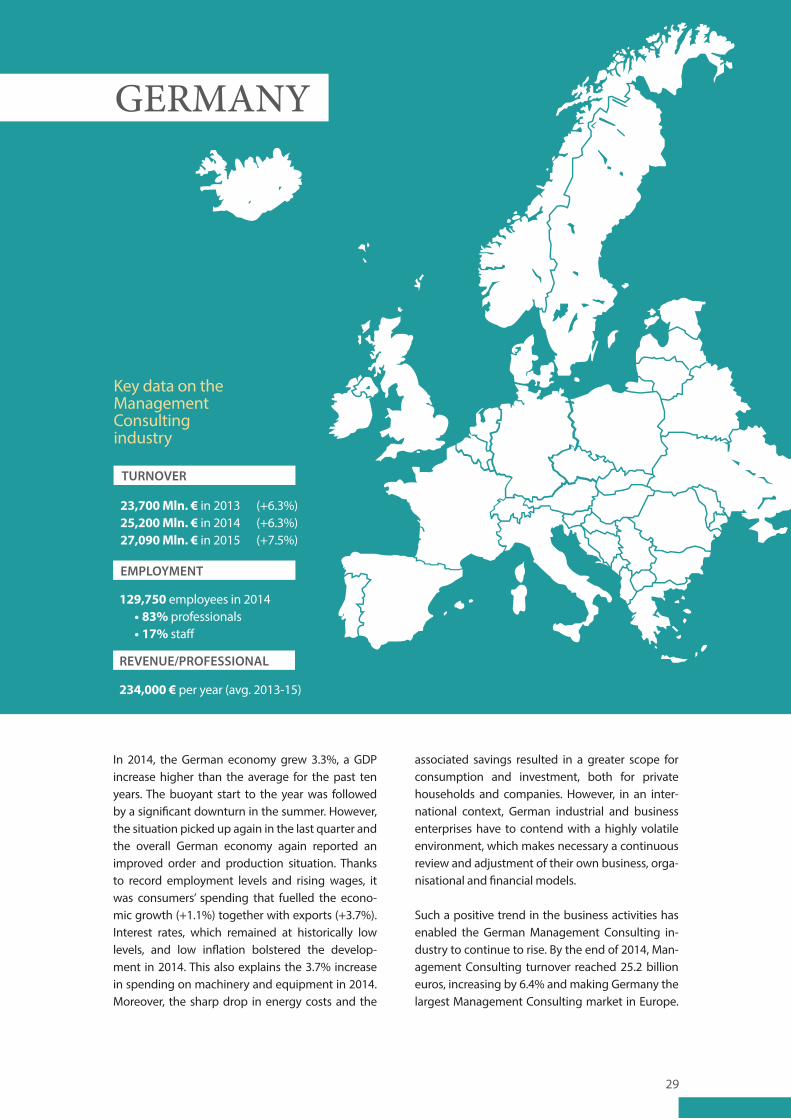
23,700 Mln. € in 2013 (+6.3%)25,200 Mln. € in 2014 (+6.3%)27,090 Mln. € in 2015 (+7.5%)
129,750 employees in 2014 • 83% professionals • 17% staff
234,000 € per year (avg. 2013-15)
GERMANY
In 2014, the German economy grew 3.3%, a GDP increase higher than the average for the past ten years. The buoyant start to the year was followed by a significant downturn in the summer. However, the situation picked up again in the last quarter and the overall German economy again reported an improved order and production situation. Thanks to record employment levels and rising wages, it was consumers’ spending that fuelled the econo-mic growth (+1.1%) together with exports (+3.7%). Interest rates, which remained at historically low levels, and low inflation bolstered the develop-ment in 2014. This also explains the 3.7% increase in spending on machinery and equipment in 2014. Moreover, the sharp drop in energy costs and the
associated savings resulted in a greater scope for consumption and investment, both for private households and companies. However, in an inter-national context, German industrial and business enterprises have to contend with a highly volatile environment, which makes necessary a continuous review and adjustment of their own business, orga-nisational and financial models.
Such a positive trend in the business activities has enabled the German Management Consulting in-dustry to continue to rise. By the end of 2014, Man-agement Consulting turnover reached 25.2 billion euros, increasing by 6.4% and making Germany the largest Management Consulting market in Europe.
30
This marks the fifth consecutive year of turnover growth since the international financial and econo-mic crisis caused a decrease in 2009.
Management Consulting employment in Germany is also continuously growing, with employment growth rates at 5% in 2013, 10% in 2014 and with an expected increase of 7.4% in 2015.
The analysis by service lines highlights the large do-minance of the Operations segment (38%), followed by Technology (21%) and Strategy (18%). All service lines are expected to grow more than 5% in 2015.
Consumer & Industrial Products is the main client industry with 34% of the Management Consulting turnover, followed by Financial Services (24%). The Public sector represents 9% of the market.
Many consulting projects are related to assisting clients to adjust to changing conditions. As a result, there is a strong focus on liquidity management, for example. On the one hand, this allows a financial cushion to be created for times of crisis and, on the other hand, scope for planned business growth or additional acquisitions. Many companies are cur-rently engaged in consulting projects with industry 4.0 character, especially in the mechanical and plant engineering sectors, and the automotive and che-mical industries. Often the focus is on the protection of one’s own core business. In addition, the new market opportunities arising due to the increasing digitalization and the changed market and compe-titive conditions, are a driving force for the manage-ment consultancy business.
Some top trends in the Management Consulting industry are related to the fact that clients are be-coming increasingly professional in their choice and use of consultants, and that digitalization is changing the project focuses and the structures of management consultancies. The consultants’ con-tribution to value added is increasingly subject to critical analysis, and the aims and benefits are being defined more clearly before the start of the project. Clients are also increasingly ensuring the specific
suitability of the project team and individual team members, if they plan to cooperate with the exter-nal experts, and do so regardless of the consultan-cy’s reputation. Furthermore, reliable implementa-tion successes are essential, which is giving rise to a growing number of functional and industry-orien-ted consulting specialists.
As to the impact of digitalization, the demand for support in the transformation to digital-oriented business models, applications and processes has in-tensified and become an important growth driver for the Management Consulting industry. In strategic and organisational terms, the consulting firms will have to develop the required thematic and solution expertise. Many large, internationally-oriented mar-ket participants have already implemented extensive activities in the direction of digital labs or think tanks.This reported has been prepared by BDU.The German Association of Management Consul-tants (Bundesverband Deutscher Unternehmen-sberater, BDU eV) currently comprises some 500 companies from the Management, HR and IT con-sulting industries. With these member companies, the association represents about 13,000 consultan-ts in Germany. This makes BDU one of the world’s top three trade and professional associations in the consulting industry.
The association’s work is based on two pillars: on the one hand, it represents the legal, political and me-dia interests of the industry as a whole, and on the other, it provides its members with services such as benchmarking, networking, professional develop-ment and a proof of quality for the end customers. At the same time, BDU qualifies as an independent, neutral pool of highly-qualified market participants.
GERMANY
Germany BDU e V, German Association of Management Consultants
www.bdu.de
National Association
31
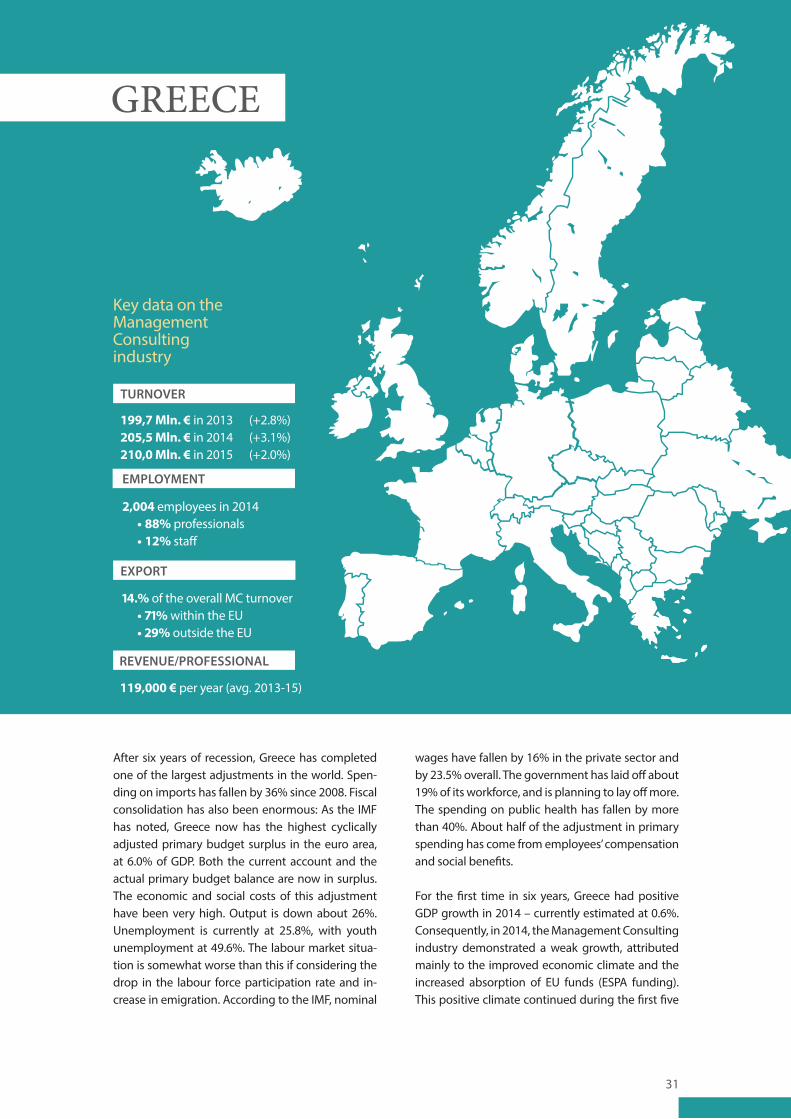
199,7 Mln. € in 2013 (+2.8%)205,5 Mln. € in 2014 (+3.1%)210,0 Mln. € in 2015 (+2.0%)
14.% of the overall MC turnover• 71% within the EU• 29% outside the EU
2,004 employees in 2014 • 88% professionals • 12% staff
119,000 € per year (avg. 2013-15)
After six years of recession, Greece has completed one of the largest adjustments in the world. Spen-ding on imports has fallen by 36% since 2008. Fiscal consolidation has also been enormous: As the IMF has noted, Greece now has the highest cyclically adjusted primary budget surplus in the euro area, at 6.0% of GDP. Both the current account and the actual primary budget balance are now in surplus. The economic and social costs of this adjustment have been very high. Output is down about 26%. Unemployment is currently at 25.8%, with youth unemployment at 49.6%. The labour market situa-tion is somewhat worse than this if considering the drop in the labour force participation rate and in-crease in emigration. According to the IMF, nominal
wages have fallen by 16% in the private sector and by 23.5% overall. The government has laid off about 19% of its workforce, and is planning to lay off more. The spending on public health has fallen by more than 40%. About half of the adjustment in primary spending has come from employees’ compensation and social benefits.
For the first time in six years, Greece had positive GDP growth in 2014 – currently estimated at 0.6%. Consequently, in 2014, the Management Consulting industry demonstrated a weak growth, attributed mainly to the improved economic climate and the increased absorption of EU funds (ESPA funding). This positive climate continued during the first five
Key data on the Management Consulting industry
TURNOVER
EXPORT
EMPLOYMENT
REVENUE/PROFESSIONAL
GREECE
32
GREECE
months of 2015, despite the change of government early in the year and the subsequent delay in EU funded projects.
The total market size for Management Consult-ing services in Greece is estimated at 206 million euros. This number includes rough estimations of the “freelance” individuals, who offer Management Consulting services in EU-related funding and ope-rational issues. The forecasted trend for 2015 varies considerably among respondents, as a result of the high volatility, with a prevailing expectation for growth of around 2%.
Total employment in the sector was around 2,000 in 2014, with an expected growth of 1.5% in 2015. Large firms were reported to employ the vast majo-rity of workers. In 2014, 88% of the total labour force were professionals and 12% support staff.
Pricing of Management Consulting services in Gre-ece lags behind most of the other EU countries and has further suffered during the recent years of au-sterity. In 2014, fees have demonstrated a modest increase and fee stagnation has ended; however, overall, the fee rates remain relatively low.
Exports, even though the degree of internationali-zation of Greek Management Consulting firms in-creased during the years of the recession, remain relatively low: 14% of the total reported turnover.
The Management Consulting sector in Greece is largely dependent on the Public sector, which ac-counts for almost 1/3 of the total industry turnover (31%), with private sector spending in Management Consulting that lags behind. Strategy is the leading service line for Management Consulting firms in Greece. More than 20% of Management Consulting firms report that over 50% of their total income co-mes from Strategy consulting, including Public sec-tor projects. The second most important service line is Operations, mainly from the Industrial and Consu-mer sectors of the economy. The third service line is Finance & Risk delivered to the Financial Sector.In an economy in deep recession for so long, it is no
wonder that issues of cost reduction are the “hot to-pics” in Management Consulting. Almost 50 of the Greek Management Consulting firms report cost re-duction initiatives as the most demanded projects. Of almost equal importance, are ranked projects re-lated to growth issues, depicting the overwhelming need for Greek firms to overcome the crisis and in-crease sales and income. Innovation is ranked third and Globalization/Market Expansion projects are ranked fourth.This country profile has been prepared by SESMA.The Hellenic Association of Management Consul-ting Firms (SESMA) was founded in 1991 by 23 le-ading Consultancies in Greece. Today there are 56 members of SESMA, including large Greek firms and international firms, which operate in Greece. SESMA members represent more than 70% of the total tur-nover of the consulting market in Greece and em-ploy more than 2,000 highly skilled and experien-ced consultants.
SESMA has extensive experience in the organisa-tion of conferences/forums networking events and training for its members as well as for consultants from other countries. In addition, SESMA is active in lobbying the government about issues that are re-levant to the consulting profession by taking part in working groups and committees, drafting position papers, preparing studies, and assisting in legisla-tion issues.
SESMA is a member of the European Federation of Management Consulting Associations (FEACO), the Federation of Greek Enterprises and the Federation of Industries of Northern Greece.
Hellenic Association of Management Consulting Firms (SESMA)
www.sesma.gr
National Association
33
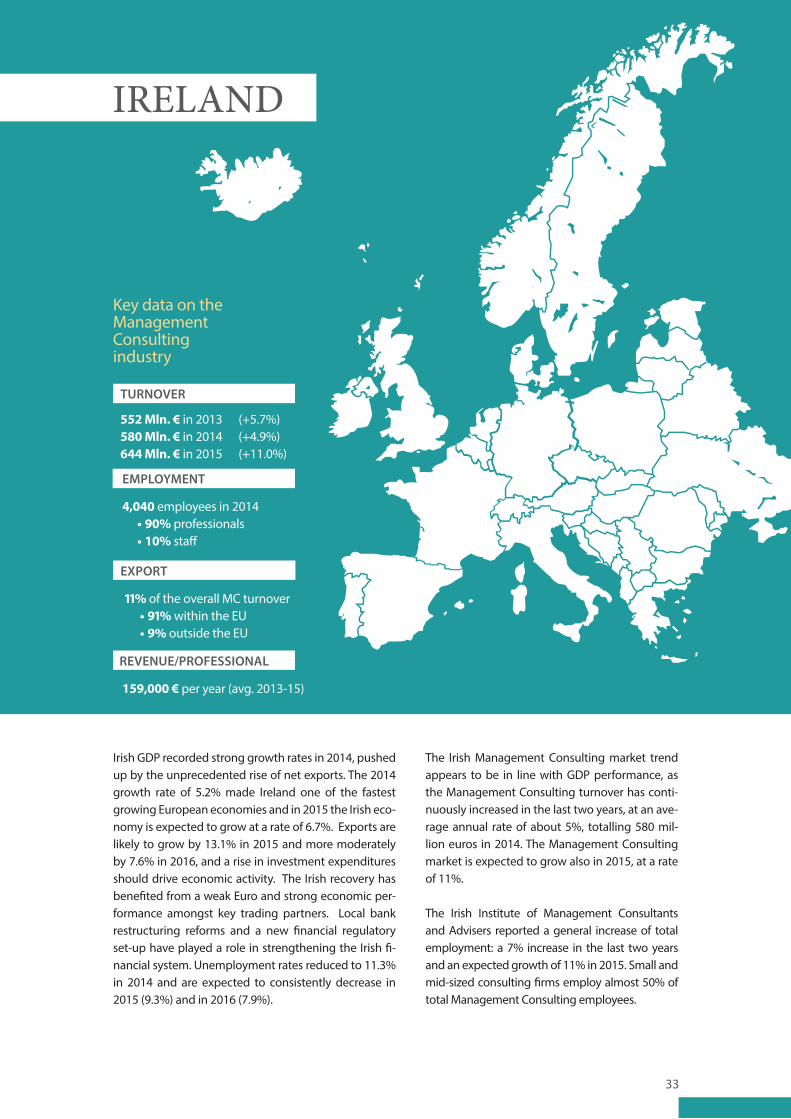
552 Mln. € in 2013 (+5.7%)580 Mln. € in 2014 (+4.9%)644 Mln. € in 2015 (+11.0%)
11% of the overall MC turnover• 91% within the EU• 9% outside the EU
4,040 employees in 2014 • 90% professionals • 10% staff
159,000 € per year (avg. 2013-15)
Irish GDP recorded strong growth rates in 2014, pushed up by the unprecedented rise of net exports. The 2014 growth rate of 5.2% made Ireland one of the fastest growing European economies and in 2015 the Irish eco-nomy is expected to grow at a rate of 6.7%. Exports are likely to grow by 13.1% in 2015 and more moderately by 7.6% in 2016, and a rise in investment expenditures should drive economic activity. The Irish recovery has benefited from a weak Euro and strong economic per-formance amongst key trading partners. Local bank restructuring reforms and a new financial regulatory set-up have played a role in strengthening the Irish fi-nancial system. Unemployment rates reduced to 11.3% in 2014 and are expected to consistently decrease in 2015 (9.3%) and in 2016 (7.9%).
The Irish Management Consulting market trend appears to be in line with GDP performance, as the Management Consulting turnover has conti-nuously increased in the last two years, at an ave-rage annual rate of about 5%, totalling 580 mil-lion euros in 2014. The Management Consulting market is expected to grow also in 2015, at a rate of 11%.
The Irish Institute of Management Consultants and Advisers reported a general increase of total employment: a 7% increase in the last two years and an expected growth of 11% in 2015. Small and mid-sized consulting firms employ almost 50% of total Management Consulting employees.
Key data on the Management Consulting industry
TURNOVER
EXPORT
EMPLOYMENT
REVENUE/PROFESSIONAL
IRELAND
34
The analysis by service lines highlights the predomi-nance of the Operations and Technology segments (30% and 23% respectively), followed by Strategy and People & Change at 17% and 11% respectively.
In terms of Client Industries, the Public Sector re-presents the largest share of the Irish Management Consulting turnover (25%), followed by Consumer & Industrial Products (22%) and Financial services (21%).
The geographic scope of the Irish Management Consulting consulting firms is mainly domestic (89%), with 10% exports towards EU countries and only 1% exports outside the EU.
This report has been prepared based on a question-naire provided by IMCA.
The Institute of Management Consultants and Ad-visers (IMCA) is the national and internationally recognised professional institute for management consultants and business advisers in Ireland.
IMCA’s mission is to foster and promote the value, quality and benefits of business consulting and ad-visory services in Ireland by establishing, supporting and measuring quality standards, by representing and supporting the profession and by promoting the value and benefits delivered to clients.
IMCA’s principal objective is to advance the profes-sions of management consultancy and business advice by establishing and maintaining the highest standards of performance and conduct by its mem-bers, and by promoting the knowledge and skills required for that purpose.
IRELAND
Ireland IMCA Institute of Management Consultants and Advisers
www.imca.ie
National Association
35
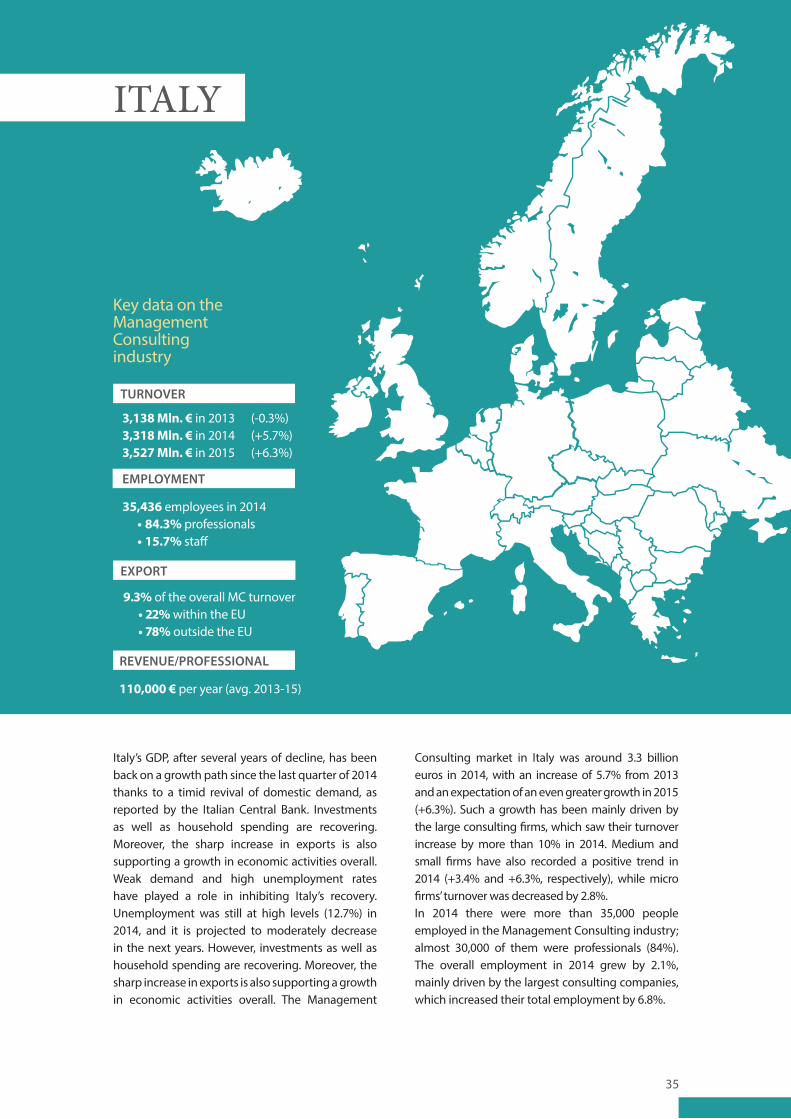
3,138 Mln. € in 2013 (-0.3%)3,318 Mln. € in 2014 (+5.7%)3,527 Mln. € in 2015 (+6.3%)
9.3% of the overall MC turnover• 22% within the EU• 78% outside the EU
35,436 employees in 2014• 84.3% professionals • 15.7% staff
110,000 € per year (avg. 2013-15)
Italy’s GDP, after several years of decline, has been back on a growth path since the last quarter of 2014 thanks to a timid revival of domestic demand, as reported by the Italian Central Bank. Investments as well as household spending are recovering. Moreover, the sharp increase in exports is also supporting a growth in economic activities overall. Weak demand and high unemployment rates have played a role in inhibiting Italy’s recovery. Unemployment was still at high levels (12.7%) in 2014, and it is projected to moderately decrease in the next years. However, investments as well as household spending are recovering. Moreover, the sharp increase in exports is also supporting a growth in economic activities overall. The Management
Consulting market in Italy was around 3.3 billion euros in 2014, with an increase of 5.7% from 2013 and an expectation of an even greater growth in 2015 (+6.3%). Such a growth has been mainly driven by the large consulting firms, which saw their turnover increase by more than 10% in 2014. Medium and small firms have also recorded a positive trend in 2014 (+3.4% and +6.3%, respectively), while micro firms’ turnover was decreased by 2.8%.In 2014 there were more than 35,000 people employed in the Management Consulting industry; almost 30,000 of them were professionals (84%). The overall employment in 2014 grew by 2.1%, mainly driven by the largest consulting companies, which increased their total employment by 6.8%.
Key data on the Management Consulting industry
TURNOVER
EXPORT
EMPLOYMENT
REVENUE/PROFESSIONAL
ITALY
36
The Management Consulting market in Italy is hi-ghly fragmented, with about 19,000 consulting firms – almost 85% of them employing fewer than three persons. At the same, the Management Con-sulting industry appears very concentrated, with the largest 35 firms totalling more than 50% of the total Italian Management Consulting turnover. In the past five years the large consulting firms and the micro firms have followed two radically diffe-rent trends. The large consulting companies have overcome the crisis and kept on growing in terms of turnover and employment: +4.3% and +4.6% re-spectively on average in the past five years. The mi-cro consulting companies are suffering a structural crisis, with a declining turnover and a rather stable employment (in large part self-employment): -3% and +0.7% on average over the past five years.
The turnover per professional is about 110,000 eu-ros per year. It has increased by 3.5% in 2014 but still remains significantly lower with respect to most of the other Western European countries. Such a low productivity is related to an average daily consul-ting fee of slightly less than 750 euros and a rather stable chargeability at around 150 days per year. The turnover per professional, however, is very dif-ferent across the different firms sizes: in micro firms the turnover of a professional is about 80,000 euros per year, while in a large firm it is about 185,000 eu-ros per year.
Exports account for slightly more than 9% of the Italian Management Consulting turnover. The lar-ge firms are more active in international markets, with a 13% share of their turnover due to exports. The contribution of exports to Italian firms’ turnover decreases with firms’ sizes: medium and small con-sulting enterprises are exporting around 8% of their turnover, while the export rate of micro consulting enterprises is slightly less than 2%.
In 2014 Strategy, People & Change, and Finance & Risk together covered slightly more than 60% of the Italian Management Consulting market, each of them having a market share of around 20% and a turnover of around 700 million euros. The Manage-
ment Consulting activities related to all the other company functions (mainly IT, Operations and Mar-keting) jointly represented slightly more than 30% of the market, with a value of around 1 billion eu-ros). Finance & Risk was the most dynamic service line, with a 10% increase in 2014.
The demand for Management Consulting services is 53% from Services, mainly from the Financial Servi-ces and Telecom & Media. The Manufacturing sector – both consumer and industrial – represents 38% of the Italian market, with Public Administration (inclu-ding the Health sector) representing just 9% of the market. In the past five years the service sector has driven the growth of the Management Consulting industry with an overall 17% increase in the period, while, in the corresponding period, consulting to the Public Administration has declined by almost 30%.
In an increasingly mature market, the consulting activities supporting digitization processes and gre-en management represent two important areas of innovation driving the growth of the Management Consulting industry in Italy.
Over 50% of consulting companies (and even more – 80% of the large consulting companies) are in-volved in supporting the adoption of new digital technologies. For over 25% of the Italian consulting companies, consulting for digitalization is a relevant area of business. Most projects are related to the implementation of ERP systems, in line with the de-mands of enterprises to modernize and strengthen their internal business systems. However, these projects more and more refer also to social media and mobile technology and, to a lesser extent, big data.
Almost 50% of the consulting companies (and even more – 80% of the large consulting companies) sup-port the adoption of green management practices. For over 15% of the Italian consulting companies, consulting on green management is a relevant area of business. Most projects are related to corporate social responsibility and green supply chain mana-
ITALY
37
gement and, in the case of small and medium con-sulting companies, the certification related to envi-ronmental and social responsibility.
The strong engagement of the large consulting firms in these new areas of activity contributes to explain their continued growth in the market place. Conversely, the limited presence of micro consul-ting firms can be considered an additional factor contributing to the severe crisis that these compa-nies are undergoing.
This country profile has been prepared by Assoconsult.
Assoconsult is the Italian Association of Manage-ment Consulting Firms, established in 1997 and based in Rome. The Association has as its members roughly 400 consulting firms of any size represen-ting around 50% of the overall Management Con-sulting turnover in Italy.
Assoconsult is committed to setting the standard regarding the consulting practice in Italy. Asso-consult develops themed meetings, conferences, knowledge-exchange initiatives, work groups, re-search projects, networks and events for their own fields of specialization.
Assoconsult is a member of Confindustria (the main Italian Association of Private Enterprises), and FEA-CO (the European Federation of Management Con-sultancies Associations).
ITALY
ASSOCONSULT- Italian Association of Management Consulting Firms
www.assoconsult.org
National Association
38
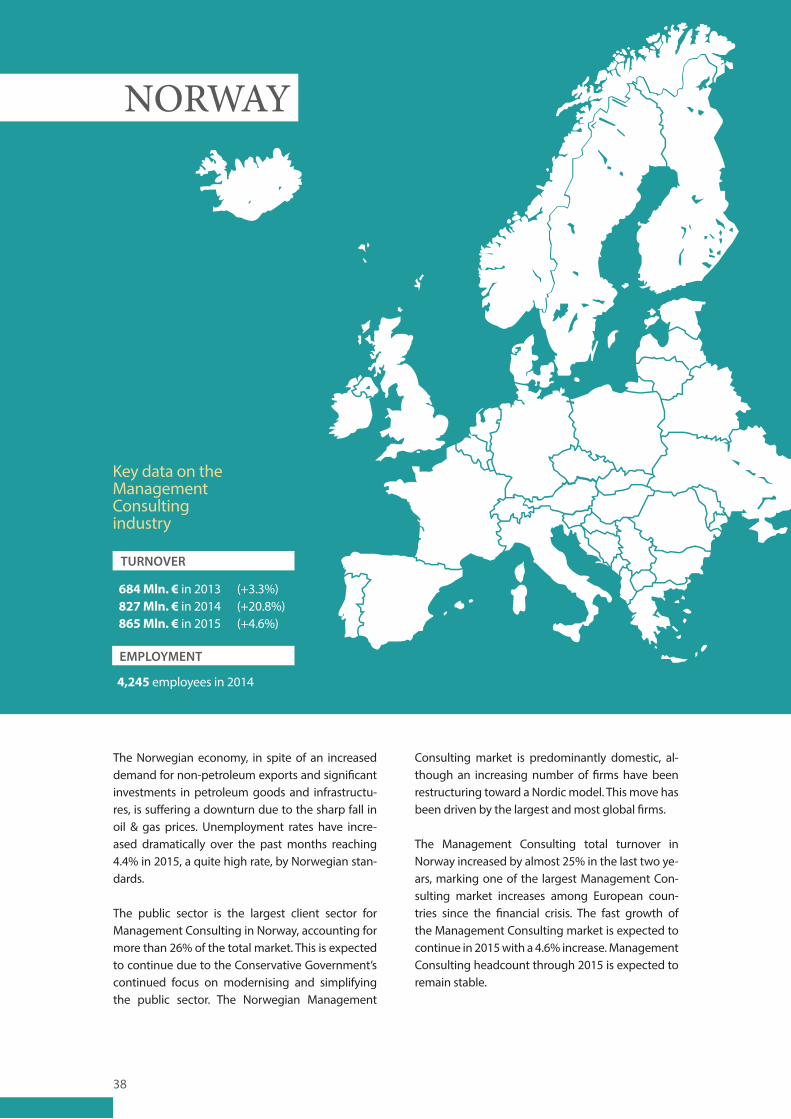
The Norwegian economy, in spite of an increased demand for non-petroleum exports and significant investments in petroleum goods and infrastructu-res, is suffering a downturn due to the sharp fall in oil & gas prices. Unemployment rates have incre-ased dramatically over the past months reaching 4.4% in 2015, a quite high rate, by Norwegian stan-dards.
The public sector is the largest client sector for Management Consulting in Norway, accounting for more than 26% of the total market. This is expected to continue due to the Conservative Government’s continued focus on modernising and simplifying the public sector. The Norwegian Management
Consulting market is predominantly domestic, al-though an increasing number of firms have been restructuring toward a Nordic model. This move has been driven by the largest and most global firms.
The Management Consulting total turnover in Norway increased by almost 25% in the last two ye-ars, marking one of the largest Management Con-sulting market increases among European coun-tries since the financial crisis. The fast growth of the Management Consulting market is expected to continue in 2015 with a 4.6% increase. Management Consulting headcount through 2015 is expected to remain stable.
Key data on the Management Consulting industry
4,245 employees in 2014
TURNOVER
EMPLOYMENT
NORWAY
684 Mln. € in 2013 (+3.3%)827 Mln. € in 2014 (+20.8%)865 Mln. € in 2015 (+4.6%)
39
Consulting Norwaywww.virke.no
National Association
In terms of service lines, the Management Consult-ing market in Norway in 2014 was driven by the Technology and Operations segments, which re-presented 34% and 27% of the total Management Consulting turnover respectively, followed by the Strategy segment (20%), Finance & Risk (11%) and People & Change (8%). Technology is the service line expected to grow most rapidly in 2015. The Management Consulting services split is expected to remain quite similar in 2015.
This country profile has been developed based on the questionnaire provided by Consulting Norge, part of the Norwegian Enterprise Federation – Virke.
Virke - the Norwegian Enterprise Federation - is an employers and industry lobbyist organization with over 20,000 member companies, spanning approxi-mately 250 industries, sectors and business seg-ments. Within Virke, Consulting Norge represents the Management Consulting industry association/group, with its own Board of Directors.
NORWAY
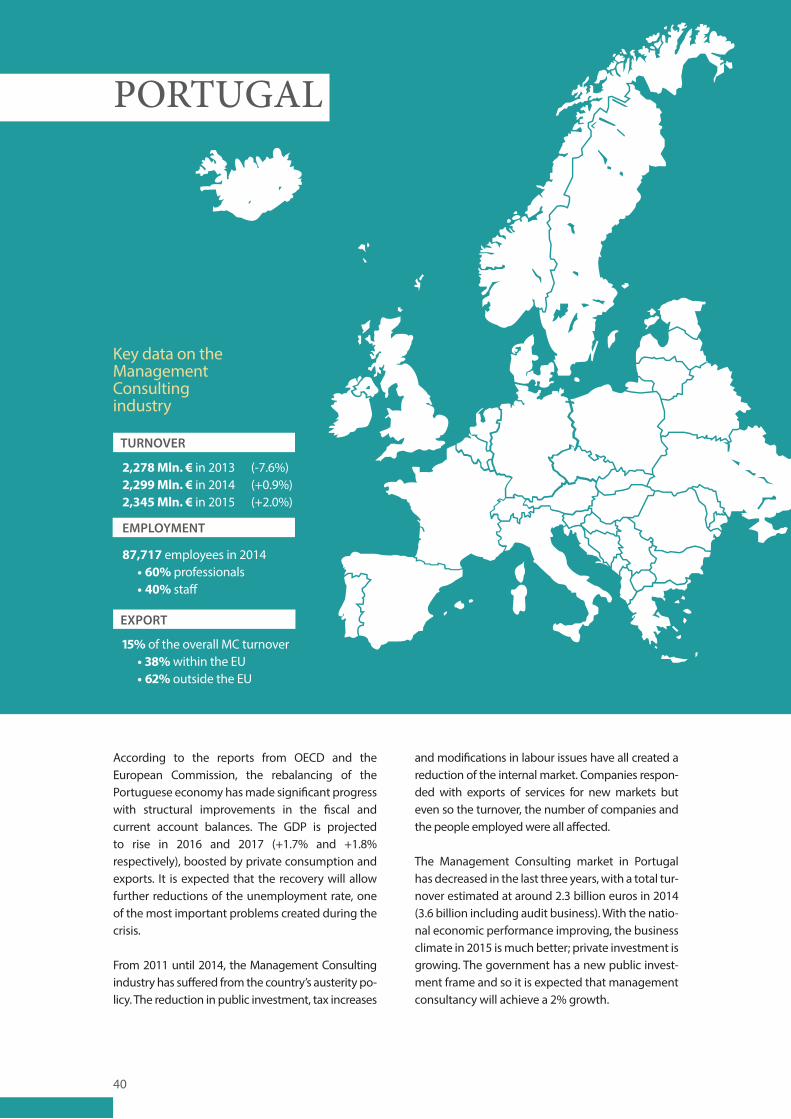
40
2,278 Mln. € in 2013 (-7.6%)2,299 Mln. € in 2014 (+0.9%)2,345 Mln. € in 2015 (+2.0%)
15% of the overall MC turnover• 38% within the EU• 62% outside the EU
87,717 employees in 2014• 60% professionals • 40% staff
According to the reports from OECD and the European Commission, the rebalancing of the Portuguese economy has made significant progress with structural improvements in the fiscal and current account balances. The GDP is projected to rise in 2016 and 2017 (+1.7% and +1.8% respectively), boosted by private consumption and exports. It is expected that the recovery will allow further reductions of the unemployment rate, one of the most important problems created during the crisis.
From 2011 until 2014, the Management Consulting industry has suffered from the country’s austerity po-licy. The reduction in public investment, tax increases
and modifications in labour issues have all created a reduction of the internal market. Companies respon-ded with exports of services for new markets but even so the turnover, the number of companies and the people employed were all affected.
The Management Consulting market in Portugal has decreased in the last three years, with a total tur-nover estimated at around 2.3 billion euros in 2014 (3.6 billion including audit business). With the natio-nal economic performance improving, the business climate in 2015 is much better; private investment is growing. The government has a new public invest-ment frame and so it is expected that management consultancy will achieve a 2% growth.
Key data on the Management Consulting industry
TURNOVER
EXPORT
EMPLOYMENT
PORTUGAL
41
PORTUGAL
The Management Consulting services pricing has been under strong pressure in recent years, mainly regarding the contracts with the public sector. In most of the public acquisitions, the price, and not the quality of the offers, was determinant, so Man-agement Consulting companies had to compete with the lowest prices, thus reducing their profits.
Portuguese Management Consulting companies traditionally have an international market in the Portuguese speaking countries. Having problems in the national market, the Management Consulting companies conceived new strategies, developing their traditional export markets and entering new markets, profiting also from European Commission funds.
This country profile has been provided by APPC.
APPC is a non-profit Trade Association representing the Portuguese Autonomous Sector of Enginee-ring, Architecture, Environment, Economics and Management Consultancy. Membership is restri-cted to companies. At present, APPC has around 140 member firms. APPC, as the representative of consulting companies, is engaged in strengthening consultants’ image and promoting fair competition in the market, contributing to the best performance of companies’ activities. The turnover of its member firms is around 400 million euros.
APPC is a full member and sole Portugal represen-tative in the major international federations of the sector: FEACO, EFCA, FIDIC and FEPAC.
Portuguese Association of Engineering and Management Consultants-APPC
www.appconsultores.pt
National Association
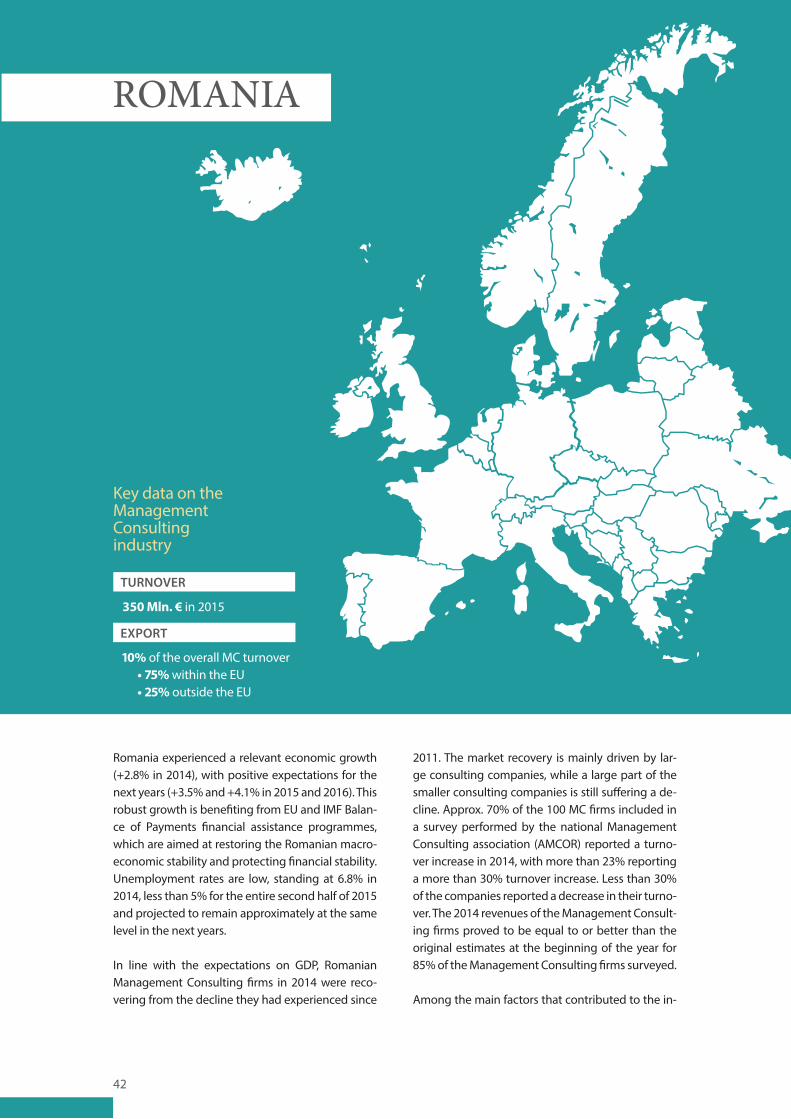
42
Romania experienced a relevant economic growth (+2.8% in 2014), with positive expectations for the next years (+3.5% and +4.1% in 2015 and 2016). This robust growth is benefiting from EU and IMF Balan-ce of Payments financial assistance programmes, which are aimed at restoring the Romanian macro-economic stability and protecting financial stability. Unemployment rates are low, standing at 6.8% in 2014, less than 5% for the entire second half of 2015 and projected to remain approximately at the same level in the next years.
In line with the expectations on GDP, Romanian Management Consulting firms in 2014 were reco-vering from the decline they had experienced since
2011. The market recovery is mainly driven by lar-ge consulting companies, while a large part of the smaller consulting companies is still suffering a de-cline. Approx. 70% of the 100 MC firms included in a survey performed by the national Management Consulting association (AMCOR) reported a turno-ver increase in 2014, with more than 23% reporting a more than 30% turnover increase. Less than 30% of the companies reported a decrease in their turno-ver. The 2014 revenues of the Management Consult-ing firms proved to be equal to or better than the original estimates at the beginning of the year for 85% of the Management Consulting firms surveyed.
Among the main factors that contributed to the in-
ROMANIA
350 Mln. € in 2015
10% of the overall MC turnover• 75% within the EU• 25% outside the EU
Key data on the Management Consulting industry
TURNOVER
EXPORT
43
ROMANIA
crease in the Management Consulting turnover in 2014 were the EU funding programmes (this was the case for more than 39% of the Management Consulting firms who responded to the questio-naire), diversification of consulting services offe-red to clients, and better promotion of the consul-tant-client relationship. The factors that worked against growth were economic contraction, decline in investments, and economic and legislative insta-bility.
The industry sector continues to be the largest con-tractor for consulting services in 2014 for more than 50% of the Management Consulting firms included in the survey, while the public administration (local and central) is the second largest for more than 30% of the Management Consulting firms surveyed.
The sectors that recorded the highest increases in request for Management Consulting services are the Industrial and NGO sectors, while agriculture is among the sectors with the largest decreases re-corded in recent years. Other sectors that registered declines are business services, tourism and central government, while construction, financial services, communications/media, trade, transport, public ad-ministration, public services and the EU have made minor changes.
The most demanded consulting assignments in 2014 included project management and strategic consulting, followed by operations management advisory services. Project management services were at the top of client requests for more than 55% of the Management Consulting firms included in the survey.EU funding programmes in 2014 were the main growth factor of Management Consulting firm’s tur-nover.
Asociatia Consultantilor in Management din Romania (AMCOR)
www.amcor.ro
National Association
Almost 70% of the Management Consulting firms surveyed estimate an increase in the turnover for 2015, with project management and strategy conti-nuing to be the top two consulting assignments re-quested by the market.
This country profile has been developed based on a questionnaire provided by AMCOR.
The Romanian Management Consultancies Associa-tion, AMCOR, has been active since 1992 and com-prises more than 80 companies active in the Roma-nian market, including several of the market leaders.
The AMCOR mission is to safeguard professionalism and ethics in the Romanian consulting market and to act as the single voice of the Romanian consul-tancies, in relation to the authorities, clients, the academic environment and other stakeholders. AMCOR organizes several regional conferences each year, as well as smaller “Professional Corner” events on specific issues relevant for the Manage-ment Consulting firms and Management Consult-ing market. AMCOR also organizes the national AMCOR Awards each year and promotes the CMC certification.

44
242.2 Mln. € in 2013 (-2.3%)239.5 Mln. € in 2014 (-1.1%)240.7 Mln. € in 2015 (+0.5%)
24% of the overall MC turnover• 71% within the EU• 29% outside the EU
2640 employees in 2014 • 91% professionals • 9% staff
99,000 € per year (avg. 2013-15)
The Slovenian economy has recently started recove-ring. In 2014, the GDP growth rate was about 4%, with a 6.9% increase in exports and a 2.4% increase in imports. In 2015 the GDP is expected to rise at a lower rate (+1.8%). External demand is expected to have a positive impact on economic growth, as exports are forecasted to increase by 5.5% and im-ports by 3.7%. Private consumption finally had a favourable impact on the economic activity. Hou-seholds in the domestic market increased their con-sumption of durable goods (+8.5%) as well as the consumption of other goods (+1.7%). On the other side, the growth in government’s final consumption (+0.4%) and in gross fixed investment (+0.1%) was still limited.
Despite the optimistic trends for the Slovenian eco-nomy, the Management Consulting market in Slo-venia has recorded a decline during the past five years. In 2014, the Management Consulting total turnover was about 239.5 million euros, with a de-cline of 1.1% with respect to 2013. However, in 2015 Management Consulting turnover is expected to be back to growth. The reasons behind the past decline of Manage-ment Consulting services are mainly related to a:
1. changed structure of the economy as a result of the economic crisis with a large decline in number and employment in medium-sized and large com-
SLOVENIA
Key data on the Management Consulting industry
TURNOVER
EXPORT
EMPLOYMENT
REVENUE/PROFESSIONAL
45
panies (over 20% in 2008-2013) and a turnover de-cline by 10%;
2. several-years trend of declining investments (very moderate growth started only recently);
3. high indebtedness of companies and resulting low credibility in raising commercial loans;
4. significant reduction in public investment in all areas (infrastructure projects, IT, public procure-ment of goods and services in general), particularly at the State level, which will be followed by local le-vel in 2015 and 2016.
Moreover, while the Management Consulting servi-ces supply significantly exceeds the demand, com-petition in the marketplace is additionally aggrava-ted by the emergence of new very small providers (one-man-bands) fighting for survival by offering very low prices.
The factors that are expected to support an increase in the demand for Management Consulting services are related to the moderate recovery of the natio-nal economy, with increasing exports, increased investments in the business sector, planned public investments and business projects to be submitted to structural funds tenders in the country in 2016 and, more generally, rising business optimism.
More than 80% of Management Consulting com-panies are small consulting firms. Management Consulting employment growth rates in 2014 and in 2015 are negative, even though the turnover is expected to grow by 0.5% in 2015. Most firms tried to retain consultants in view of expecting a better market situation in future years. There was little change in productivity, but the ratio input/output deteriorated: more work for lower prices and a lower income.
In terms of Service lines, the Operations segment dominates the Management Consulting industry with 32% of the Management Consulting turnover in 2014. Strategy takes second position with 22%.
Sales & Marketing and Finance & Risk accounted for 10% and 8% respectively of the total Management Consulting turnover. In 2015 Sales & Marketing, Te-chnology (driven by the Digital Agenda), Finance & Risk as well as the consulting for the Green Strate-gies are expected to achieve the most substantial growth. Consumer and Industrial Products are the main client industry, with 35% of the total MC turnover, followed by Financial Services (18%), Public Sector (13%) and Energy & Utilities (12%). No significant changes in the future are expected.
Slovenian consulting firms are aware of the limits of the domestic market. Expansion in other markets has become a priority, driving the exports growth rate in 2014 up to 26%.
Due to a general lack of investments in Slovenia, including also big infrastructure projects, Man-agement Consulting firms mostly receive orders for smaller projects. Many clients prefer to have projects prepared and implemented in phases. The average length of projects has decreased by more than 40%. Also, contracts based on success fees are much more common than a few years ago.
Clients expect consultants to be very well informed on all general aspects of their market and able to bring innovative approaches and proposals increa-sing their competitiveness. They also expect them to form teams and build successful partnerships for their needs. Cooperation with IT software providers will become a precondition for many industry and service projects.
SLOVENIA
Association of Management Consulting in Slovenia-AMCOS
http://amcos.gzs.si
National Association
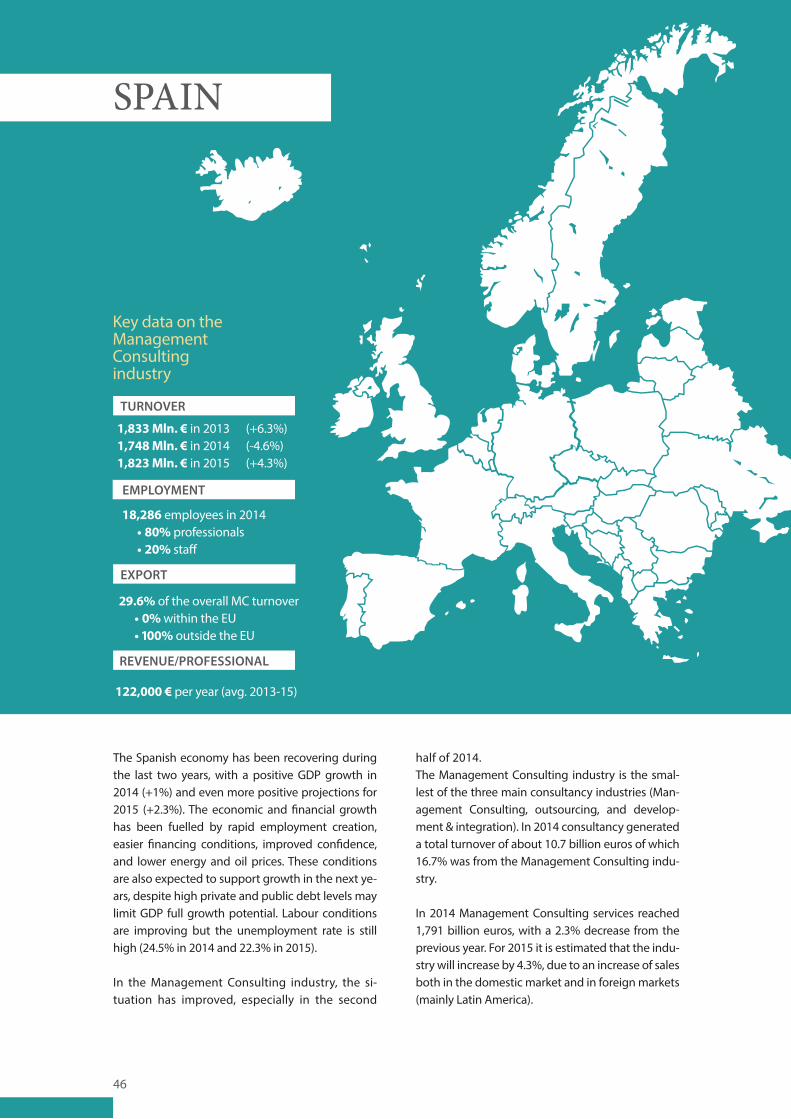
46
1,833 Mln. € in 2013 (+6.3%)1,748 Mln. € in 2014 (-4.6%)1,823 Mln. € in 2015 (+4.3%)
29.6% of the overall MC turnover• 0% within the EU• 100% outside the EU
18,286 employees in 2014• 80% professionals • 20% staff
122,000 € per year (avg. 2013-15)
The Spanish economy has been recovering during the last two years, with a positive GDP growth in 2014 (+1%) and even more positive projections for 2015 (+2.3%). The economic and financial growth has been fuelled by rapid employment creation, easier financing conditions, improved confidence, and lower energy and oil prices. These conditions are also expected to support growth in the next ye-ars, despite high private and public debt levels may limit GDP full growth potential. Labour conditions are improving but the unemployment rate is still high (24.5% in 2014 and 22.3% in 2015).
In the Management Consulting industry, the si-tuation has improved, especially in the second
half of 2014. The Management Consulting industry is the smal-lest of the three main consultancy industries (Man-agement Consulting, outsourcing, and develop-ment & integration). In 2014 consultancy generated a total turnover of about 10.7 billion euros of which 16.7% was from the Management Consulting indu-stry.
In 2014 Management Consulting services reached 1,791 billion euros, with a 2.3% decrease from the previous year. For 2015 it is estimated that the indu-stry will increase by 4.3%, due to an increase of sales both in the domestic market and in foreign markets (mainly Latin America).
Key data on the Management Consulting industry
TURNOVER
EXPORT
EMPLOYMENT
REVENUE/PROFESSIONAL
SPAIN
47
The total number of people employed in the sector also decreased last year, as the total labour force amounted to 23,000 people in 2014 (-2.7% with re-spect to 2013).
In terms of service lines, it is reported that the vast majority of Management Consulting business is re-ferred to Technology Services (62%), while only 38% is due to Strategy consultancy. Financial Services re-presents the major client industry, covering around 27% of the total Management Consulting turnover. Other major client segments are the Public Sector (17%) and Energy & Utilities (12%). In 2015, the client industries’ shares are expected to remain stable.
The domestic market represents 70% of sales, while exports represent 30%.
This report has been provided by AEC – Asociación Española de Empresas de Consultoría.
AEC, the Spanish Association of Consulting Compa-nies is a national, Madrid-based, non-commercial organisation, which has the major IT consulting companies in Spain as its members. Its 26 members represent more than 75% of the Management and Technology sector.
SPAIN
Asociación Española de Empresas de Consultoría (AEC)www.consultoras.org
National Association
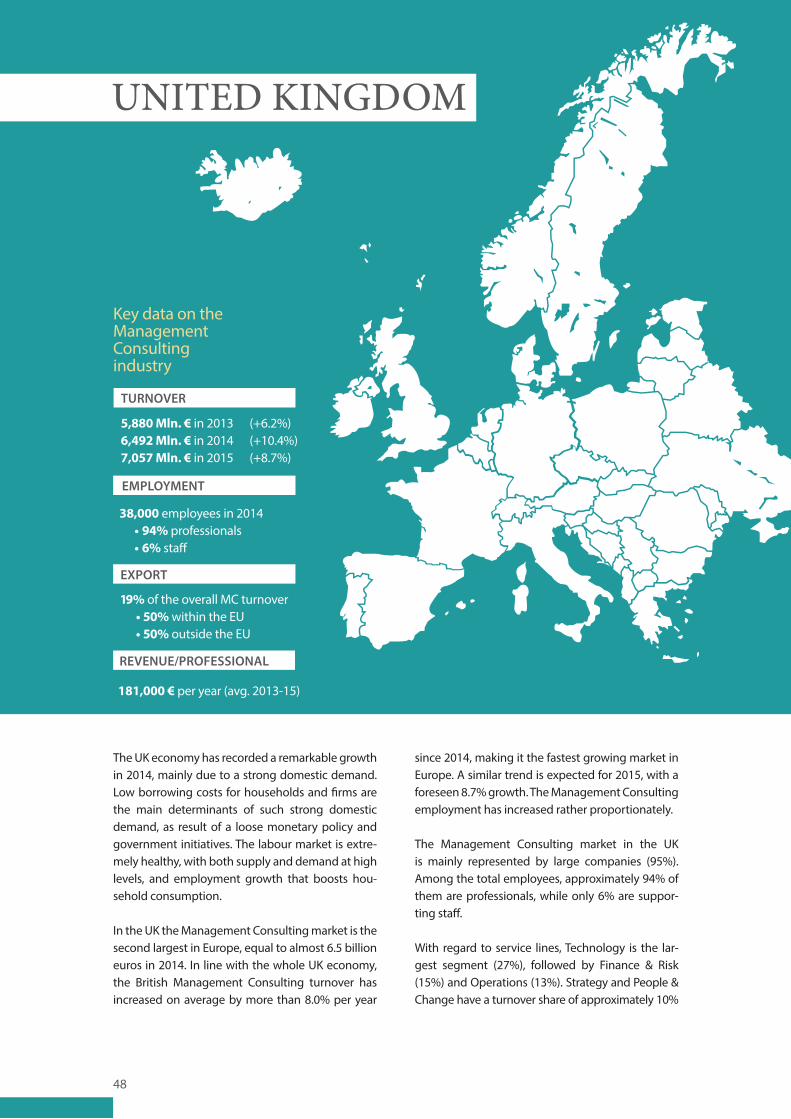
48
5,880 Mln. € in 2013 (+6.2%)6,492 Mln. € in 2014 (+10.4%)7,057 Mln. € in 2015 (+8.7%)
19% of the overall MC turnover• 50% within the EU• 50% outside the EU
38,000 employees in 2014• 94% professionals • 6% staff
181,000 € per year (avg. 2013-15)
The UK economy has recorded a remarkable growth in 2014, mainly due to a strong domestic demand. Low borrowing costs for households and firms are the main determinants of such strong domestic demand, as result of a loose monetary policy and government initiatives. The labour market is extre-mely healthy, with both supply and demand at high levels, and employment growth that boosts hou-sehold consumption.
In the UK the Management Consulting market is the second largest in Europe, equal to almost 6.5 billion euros in 2014. In line with the whole UK economy, the British Management Consulting turnover has increased on average by more than 8.0% per year
since 2014, making it the fastest growing market in Europe. A similar trend is expected for 2015, with a foreseen 8.7% growth. The Management Consulting employment has increased rather proportionately.
The Management Consulting market in the UK is mainly represented by large companies (95%). Among the total employees, approximately 94% of them are professionals, while only 6% are suppor-ting staff.
With regard to service lines, Technology is the lar-gest segment (27%), followed by Finance & Risk (15%) and Operations (13%). Strategy and People & Change have a turnover share of approximately 10%
Key data on the Management Consulting industry
TURNOVER
EXPORT
EMPLOYMENT
REVENUE/PROFESSIONAL
UNITED KINGDOM
49
each. In 2015 the Technology segment is expected to achieve the highest growth. On the other hand, Sales & Marketing and Finance & Risk are not expected to grow much.
In terms of Client industries, the largest part of the UK’s Management Consulting turnover is represen-ted by Financial Services (33%), followed by the Public Sector (21%) and Consumer or Industrial Pro-ducts (14%). With the exception of Financial Servi-ces, which are not expected to grow much in 2015, all other client segments are expected to grow rapi-dly in 2015.
Breaking down the Management Consulting tur-nover by geographic areas, 81% is related the do-mestic market, while only 19% is due to exports, equally split between exports within the EU and exports outside the EU.
This country profile has been developed based on the questionnaire provided by MCA.
The Management Consultancies Association (MCA) is the representative body for management consul-tancy firms in the UK and has been at the heart of the UK Consulting Industry since 1956. The MCA’s mission is to promote the value of management consultancy both for the economy and society as a whole. The MCA’s member companies comprise around 60% of the UK consulting industry, employ around 38,000 consultants and work with over 90 of the top FTSE 100 companies and almost all parts of the public sector. The UK consulting industry is amongst the best in the world and a vital part of the business landscape.
UNITED KINGDOM
UK MCA Management Consultancies Association
www.mca.org.uk
National Association
50
About FEACO, the EuropeanFederation of Management Consultancies Associations
FEACO, the European Federation of Management Consultancies Associations, a non-profit organisa-tion, was established in 1960 and has 14 national associations as members:
FULL MEMBERSAustria CroatiaFinlandFranceGreeceHungaryItalyPortugalRomaniaSloveniaSpainSwitzerland
ASSOCIATED MEMBERSBosnia and Herzegovina
AFFILIATE MEMBERSHong Kong
FEACO is a European organisation. Its general pur-pose is to assist in the promotion and development of the profession of Management Consultancy in Europe by providing support to its constituent Na-tional Association membership in those areas whe-re a collective voice is stronger than the sum of its individual members.
Main objectives of FEACO are:
The development of the Management Consultancy market, raising its image and profile at European and international levels, by the promotion of common pro-fessional ethics, quality and best practice.
The promotion of the interests of Manage-ment Consultancy with the different Euro-pean and International organisations, by maintaining a close relationship with the European Institutions and other pan-Eu-ropean and international organisations in order to ensure an awareness of and de-fend professional interests (not including lobbying for sales opportunities).
The development of a dynamic forum for networking and service provision, by en-couraging networking by members and between members through the sponsor-ship and organisation of conferences and meetings, the establishment of mutual in-terest working groups and through close cooperation with other consultancy orga-nisations.
This report was prepared for FEACO by:
Prof. Corrado Cerruti - University of Rome Tor Vergata and Dr. Giovanni Benedetto - FEACO with the contribution of Prof. Simone Borra, Dr. Andrea Appolloni and Dr. Gianpiero Mattera - University of Rome Tor Vergata.
FEACO has used its best effort in collecting the information published in The Survey of the European Management Consultancy Market 2014/2015. Data have been collected from the national Associations from June to October 2015. FEACO does not assume, and hereby disclaims any liability for any loss or damage caused by errors or omissions in their surveys, whether such errors result from negligence, accident or other causes.
Notice: No part of this publication may be reproduced, stored in a retrieval system or transmitted by any means, electronically or mechanically, without the prior written permission of FEACO.
3/4/5 Avenue des ArtsB-1210 Brussels (Belgium) [email protected] www.feaco.org
European Federation of Management Consultancies AssociationsFédération Européenne des Associations de Conseils en Organisation
Gra
phic
> A
rch.
Ste
fano
Teso
ni