Embed Size (px)
Citation preview

Facebook Q4 2014 Results
investor.fb.com
In addition to U.S. GAAP financials, this presentation includes certain non-GAAP financial measures. These
non-GAAP measures are in addition to, not a substitute for or superior to, measures of financial performance
prepared in accordance with U.S. GAAP. A reconciliation of non-GAAP financial measures to the
corresponding GAAP measures is provided in the appendix to this presentation.
2
Non-GAAP Measures
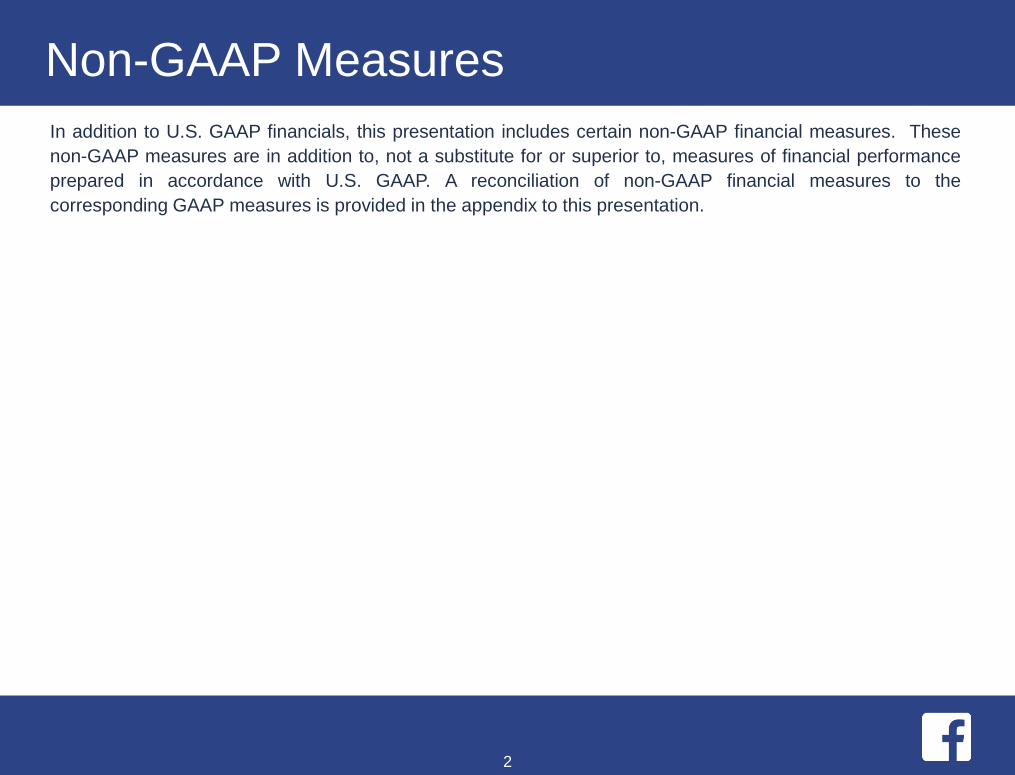
135 139 142 144 147 150 152 155 157
169 179 182 188 195 203 206 212 217
153 167 181 189 200 216 228 242 253161
180195 208
216233 244
256 263
618665
699728
757802
829864
890
Q4'12 Q1'13 Q2'13 Q3'13 Q4'13 Q1'14 Q2'14 Q3'14 Q4'14
Daily Active Users (DAUs)
DAUs / MAUs
Q4'12 Q1'13 Q2'13 Q3’13 Q4'13 Q1'14 Q2'14 Q3'14 Q4'14
59% 60% 61% 61% 62% 63% 63% 64% 64%
Please see Facebook's most recent quarterly or annual report filed with the SEC for definitions of user activity used to determine the number of our DAUs, mobile DAUs, MAUs,
and mobile MAUs. The number of DAUs, mobile DAUs, MAUs, and mobile MAUs do not include Instagram or WhatsApp users unless they would otherwise qualify as such users,
respectively, based on their other activities on Facebook.
In Millions
Rest of World
Asia-Pacific
Europe
US & Canada
3

374
425 469
507
556
609 654
703 745
Q4'12 Q1'13 Q2'13 Q3'13 Q4'13 Q1'14 Q2'14 Q3'14 Q4'14
Mobile Daily Active Users (Mobile DAUs)In Millions
4
Please see Facebook's most recent quarterly or annual report filed with the SEC for definitions of user activity used to determine the number of our DAUs, mobile DAUs, MAUs,
and mobile MAUs. The number of DAUs, mobile DAUs, MAUs, and mobile MAUs do not include Instagram or WhatsApp users unless they would otherwise qualify as such users,
respectively, based on their other activities on Facebook.
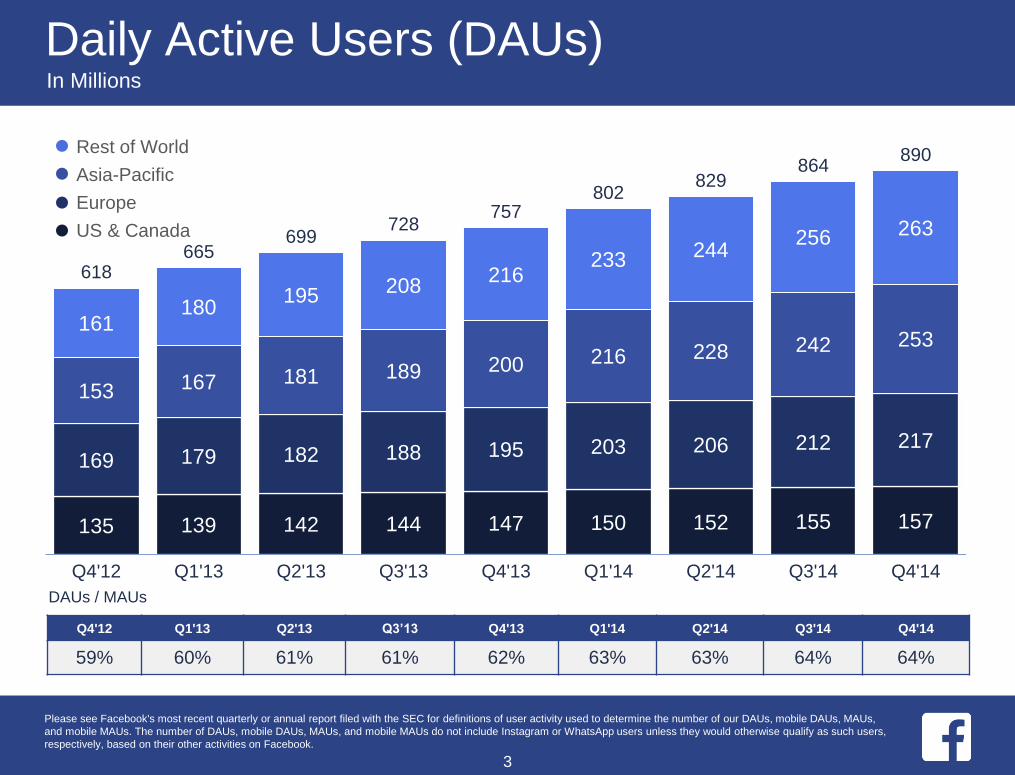
193 195 198 199 201 202 204 206 208
261 269 272 276 282 289 292 296 301
298 319 339 351 368 390 410 426 449
304327
346 362 376395 411 423
4361,056
1,1101,155 1,189
1,2281,276
1,3171,350
1,393
Q4'12 Q1'13 Q2'13 Q3'13 Q4'13 Q1'14 Q2'14 Q3'14 Q4'14
Monthly Active Users (MAUs)In Millions
Rest of World
Asia-Pacific
Europe
US & Canada
5
Please see Facebook's most recent quarterly or annual report filed with the SEC for definitions of user activity used to determine the number of our DAUs, mobile DAUs, MAUs,
and mobile MAUs. The number of DAUs, mobile DAUs, MAUs, and mobile MAUs do not include Instagram or WhatsApp users unless they would otherwise qualify as such users,
respectively, based on their other activities on Facebook.

680
751 819
874
945 1,008
1,070 1,124
1,189
Q4'12 Q1'13 Q2'13 Q3'13 Q4'13 Q1'14 Q2'14 Q3'14 Q4'14
Mobile Monthly Active Users (Mobile MAUs)In Millions
6
Please see Facebook's most recent quarterly or annual report filed with the SEC for definitions of user activity used to determine the number of our DAUs, mobile DAUs, MAUs,
and mobile MAUs. The number of DAUs, mobile DAUs, MAUs, and mobile MAUs do not include Instagram or WhatsApp users unless they would otherwise qualify as such users,
respectively, based on their other activities on Facebook.
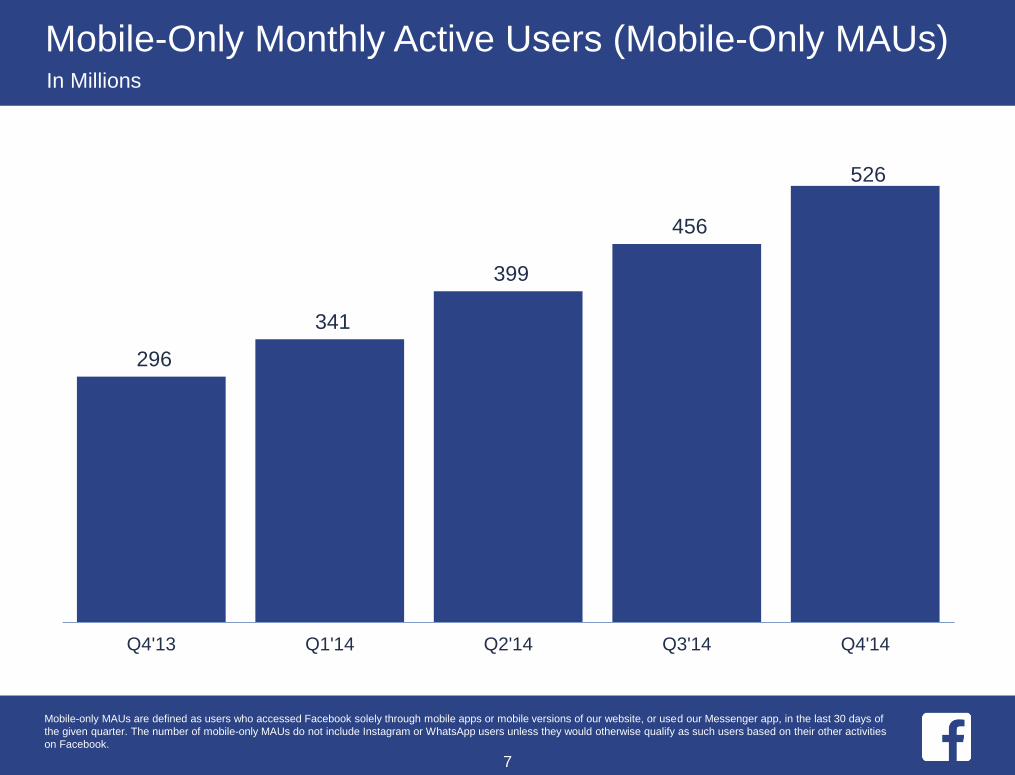
296
341
399
456
526
Q4'13 Q1'14 Q2'14 Q3'14 Q4'14
Mobile-Only Monthly Active Users (Mobile-Only MAUs)In Millions
7
Mobile-only MAUs are defined as users who accessed Facebook solely through mobile apps or mobile versions of our website, or used our Messenger app, in the last 30 days of
the given quarter. The number of mobile-only MAUs do not include Instagram or WhatsApp users unless they would otherwise qualify as such users based on their other activities
on Facebook.
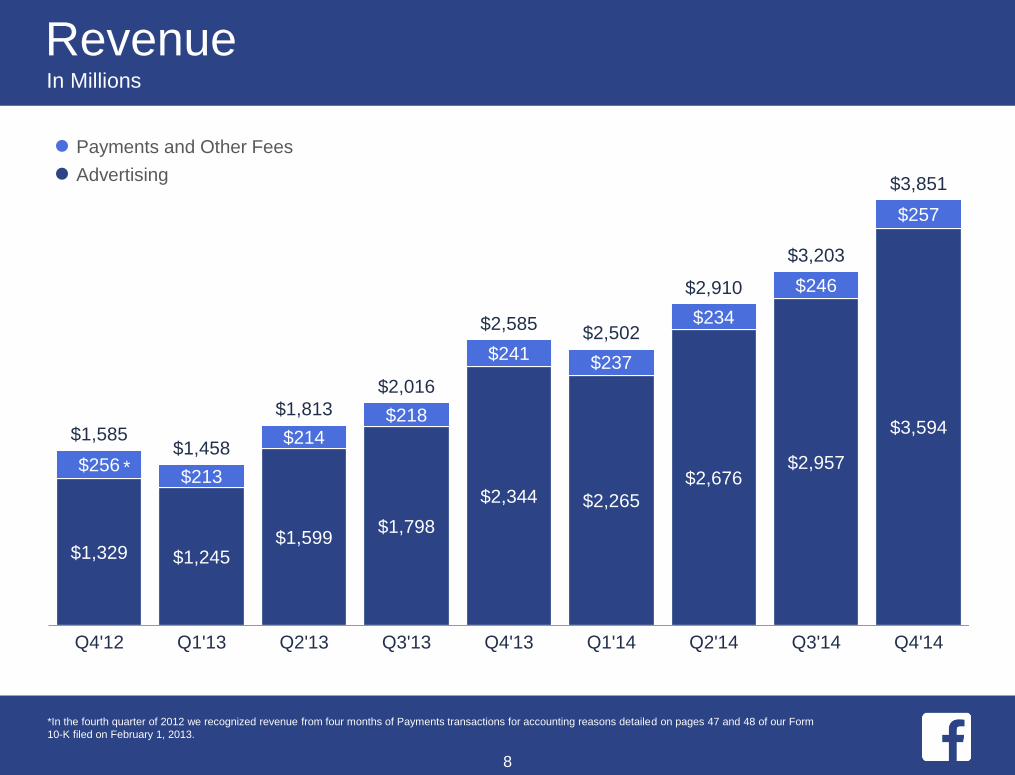
$1,329 $1,245$1,599
$1,798
$2,344 $2,265
$2,676$2,957
$3,594
$256$213
$214
$218
$241$237
$234
$246
$257
$1,585$1,458
$1,813
$2,016
$2,585$2,502
$2,910
$3,203
$3,851
Q4'12 Q1'13 Q2'13 Q3'13 Q4'13 Q1'14 Q2'14 Q3'14 Q4'14
*
RevenueIn Millions
*In the fourth quarter of 2012 we recognized revenue from four months of Payments transactions for accounting reasons detailed on pages 47 and 48 of our Form
10-K filed on February 1, 2013.
Payments and Other Fees
Advertising
8
*
$780 $679$848 $962
$1,206 $1,179 $1,308$1,514
$1,864$440$423
$505$538
$727 $698$824
$844
$1,030
$198$197
$247$278
$341 $354
$431
$492
$554
$167$159
$213$238
$311 $271
$347
$353
$403
$1,585$1,458
$1,813
$2,016
$2,585$2,502
$2,910
$3,203
$3,851
Q4'12 Q1'13 Q2'13 Q3'13 Q4'13 Q1'14 Q2'14 Q3'14 Q4'14
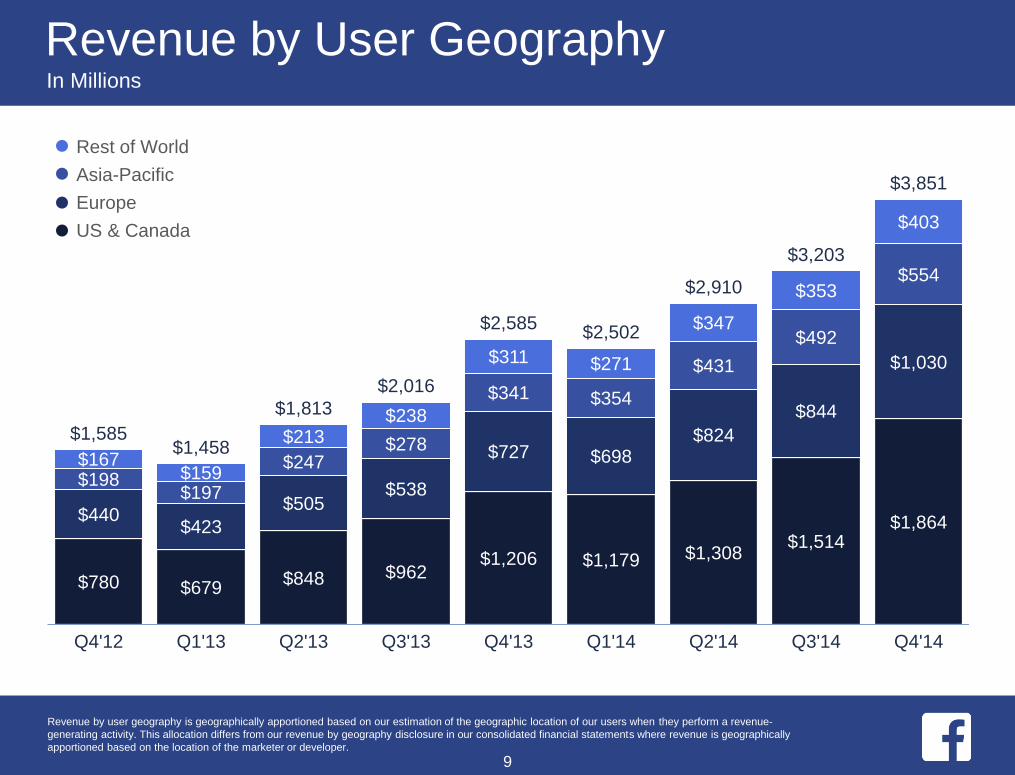
Revenue by User GeographyIn Millions
Revenue by user geography is geographically apportioned based on our estimation of the geographic location of our users when they perform a revenue-
generating activity. This allocation differs from our revenue by geography disclosure in our consolidated financial statements where revenue is geographically
apportioned based on the location of the marketer or developer.
Rest of World
Asia-Pacific
Europe
US & Canada
9

$631 $552$721 $832
$1,068 $1,039$1,175
$1,362
$1,709$374$367
$451$482
$658 $631
$757
$783
$960
$168$176
$225$255
$318 $333
$408
$469
$531
$156$150
$202
$229
$300 $262
$336
$343
$394
$1,329$1,245
$1,599
$1,798
$2,344$2,265
$2,676
$2,957
$3,594
Q4'12 Q1'13 Q2'13 Q3'13 Q4'13 Q1'14 Q2'14 Q3'14 Q4'14
Advertising Revenue by User GeographyIn Millions
Revenue by user geography is geographically apportioned based on our estimation of the geographic location of our users when they perform a revenue-
generating activity. This allocation differs from our revenue by geography disclosure in our consolidated financial statements where revenue is geographically
apportioned based on the location of the marketer or developer.
Rest of World
Asia-Pacific
Europe
US & Canada
10
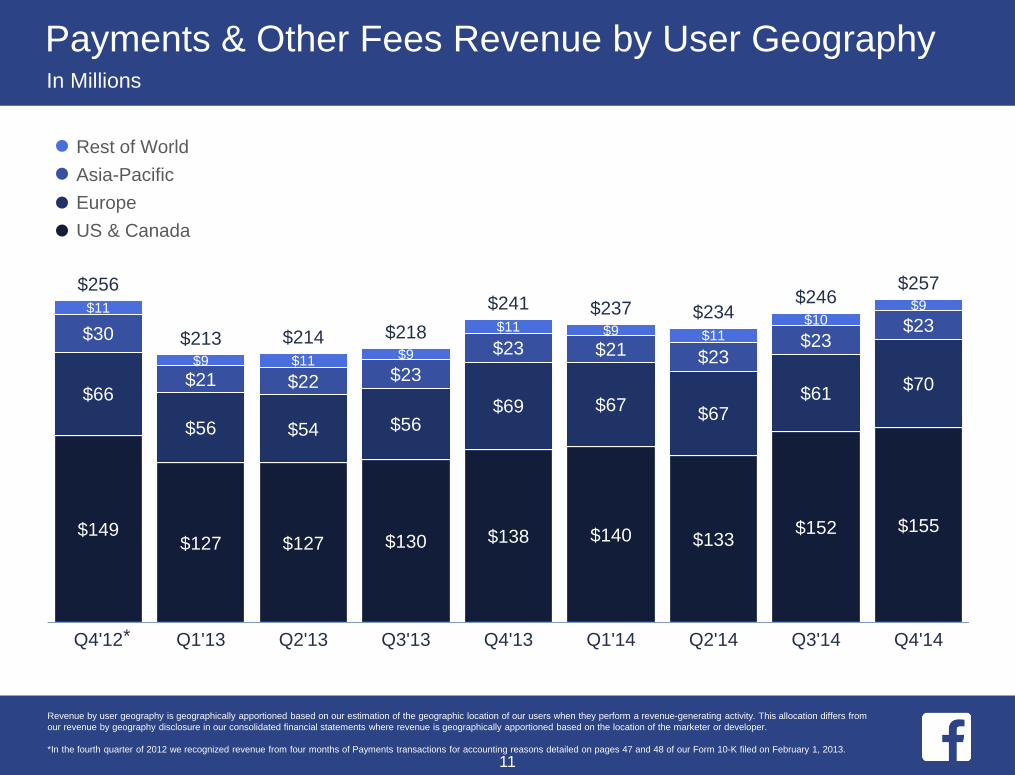
$149$127 $127 $130 $138 $140 $133
$152 $155
$66
$56 $54 $56$69 $67
$67$61
$70
$30
$21 $22 $23
$23 $21 $23$23
$23$11
$9 $11 $9
$11 $9 $11$10
$9
$256
$213 $214 $218
$241 $237 $234$246
$257
Q4'12 Q1'13 Q2'13 Q3'13 Q4'13 Q1'14 Q2'14 Q3'14 Q4'14
Payments & Other Fees Revenue by User GeographyIn Millions
Revenue by user geography is geographically apportioned based on our estimation of the geographic location of our users when they perform a revenue-generating activity. This allocation differs from
our revenue by geography disclosure in our consolidated financial statements where revenue is geographically apportioned based on the location of the marketer or developer.
*In the fourth quarter of 2012 we recognized revenue from four months of Payments transactions for accounting reasons detailed on pages 47 and 48 of our Form 10-K filed on February 1, 2013.
Rest of World
Asia-Pacific
Europe
US & Canada
11
*

12
$2.36 $2.21 $2.61 $2.66
$3.22
$0.25 $0.23
$0.23 $0.21
$0.23
$2.61 $2.44
$2.84 $2.87
$3.45
Q4'13 Q1'14 Q2'14 Q3'14 Q4'14
Europe
$0.88 $0.88 $1.02
$1.12 $1.21
$0.06 $0.06
$0.06
$0.06 $0.05
$0.95 $0.93
$1.08 $1.18
$1.27
Q4'13 Q1'14 Q2'14 Q3'14 Q4'14
Asia-Pacific
$0.81 $0.68
$0.83 $0.82 $0.92
$0.03
$0.02
$0.03 $0.02
$0.02 $0.84
$0.70
$0.86 $0.85
$0.94
Q4'13 Q1'14 Q2'14 Q3'14 Q4'14
Rest of World
$1.94 $1.81 $2.06 $2.22
$2.62
$0.20 $0.19
$0.18 $0.18
$0.19
$2.14 $2.00
$2.24 $2.40
$2.81
Q4'13 Q1'14 Q2'14 Q3'14 Q4'14
Worldwide
$5.34 $5.16 $5.79
$6.64
$8.26
$0.69 $0.69 $0.66
$0.74
$0.75
$6.03 $5.85 $6.44
$7.39
$9.00
Q4'13 Q1'14 Q2'14 Q3'14 Q4'14
US & Canada
Average Revenue per User (ARPU)
Revenue by user geography is geographically apportioned based on our estimation of the geographic location of our users when they perform
a revenue-generating activity. This allocation differs from our revenue by geography disclosure in our consolidated financial statements where revenue is
geographically apportioned based on the location of the marketer or developer. Please see Facebook’s most recent quarterly or annual report filed with the SEC
for the definition of ARPU.
Payments and Other Fees
Advertising
12
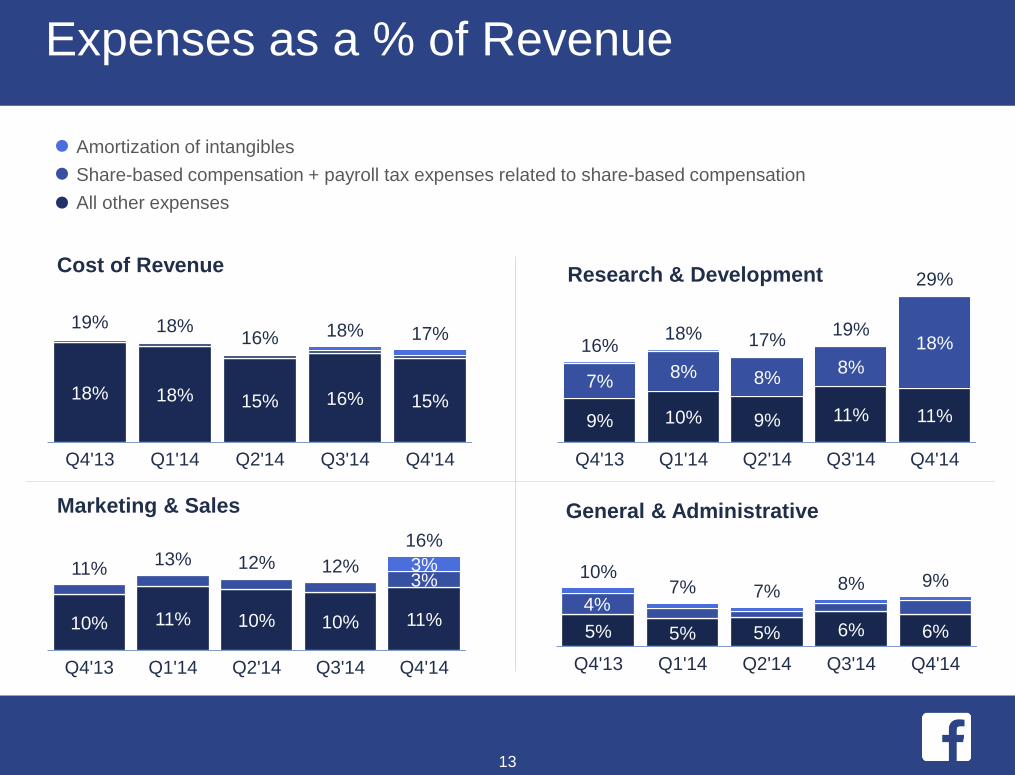
5% 5% 5% 6% 6%
10%7% 7% 8% 9%
Q4'13 Q1'14 Q2'14 Q3'14 Q4'14
General & Administrative
4%10% 11% 10% 10% 11%
3%3%11%
13% 12% 12%
16%
Q4'13 Q1'14 Q2'14 Q3'14 Q4'14
Marketing & Sales
9% 10% 9% 11% 11%
7%8% 8%
8%
18%16%18% 17%
19%
29%
Q4'13 Q1'14 Q2'14 Q3'14 Q4'14
Research & Development
18% 18% 15% 16% 15%
19% 18%16% 18% 17%
Q4'13 Q1'14 Q2'14 Q3'14 Q4'14
Cost of Revenue
Expenses as a % of Revenue
Amortization of intangibles
Share-based compensation + payroll tax expenses related to share-based compensation
All other expenses
13
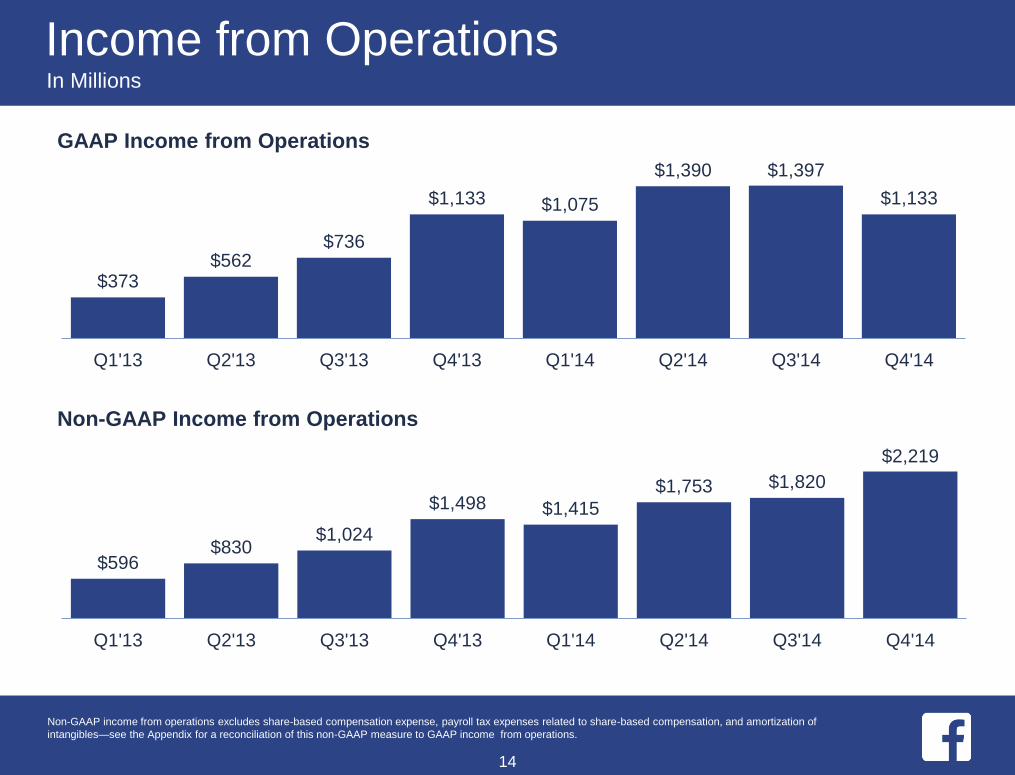
$373 $562
$736
$1,133 $1,075
$1,390 $1,397
$1,133
Q1'13 Q2'13 Q3'13 Q4'13 Q1'14 Q2'14 Q3'14 Q4'14
GAAP Income from Operations
$596 $830
$1,024
$1,498 $1,415
$1,753 $1,820
$2,219
Q1'13 Q2'13 Q3'13 Q4'13 Q1'14 Q2'14 Q3'14 Q4'14
Non-GAAP Income from Operations
14
Income from Operations
Non-GAAP income from operations excludes share-based compensation expense, payroll tax expenses related to share-based compensation, and amortization of
intangibles—see the Appendix for a reconciliation of this non-GAAP measure to GAAP income from operations.
In Millions

41% 46%
51% 58% 57% 60% 57% 58%
Q1'13 Q2'13 Q3'13 Q4'13 Q1'14 Q2'14 Q3'14 Q4'14
Non-GAAP Operating Margin
26% 31%
37% 44% 43%
48% 44%
29%
Q1'13 Q2'13 Q3'13 Q4'13 Q1'14 Q2'14 Q3'14 Q4'14
GAAP Operating Margin
Operating Margin
Non-GAAP operating margin excludes share-based compensation expense, payroll tax expenses related to share-based compensation, and amortization of
intangibles—see the Appendix for a reconciliation of this non-GAAP measure to GAAP operating margin.
15
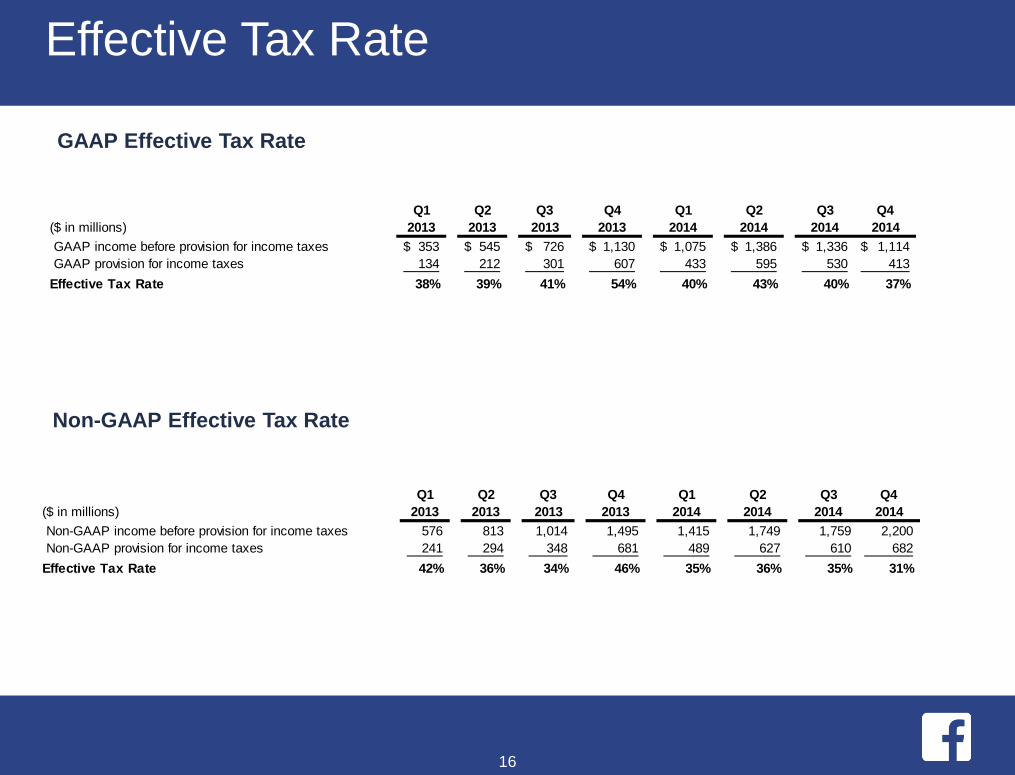
GAAP Effective Tax Rate
Non-GAAP Effective Tax Rate
Effective Tax Rate
16
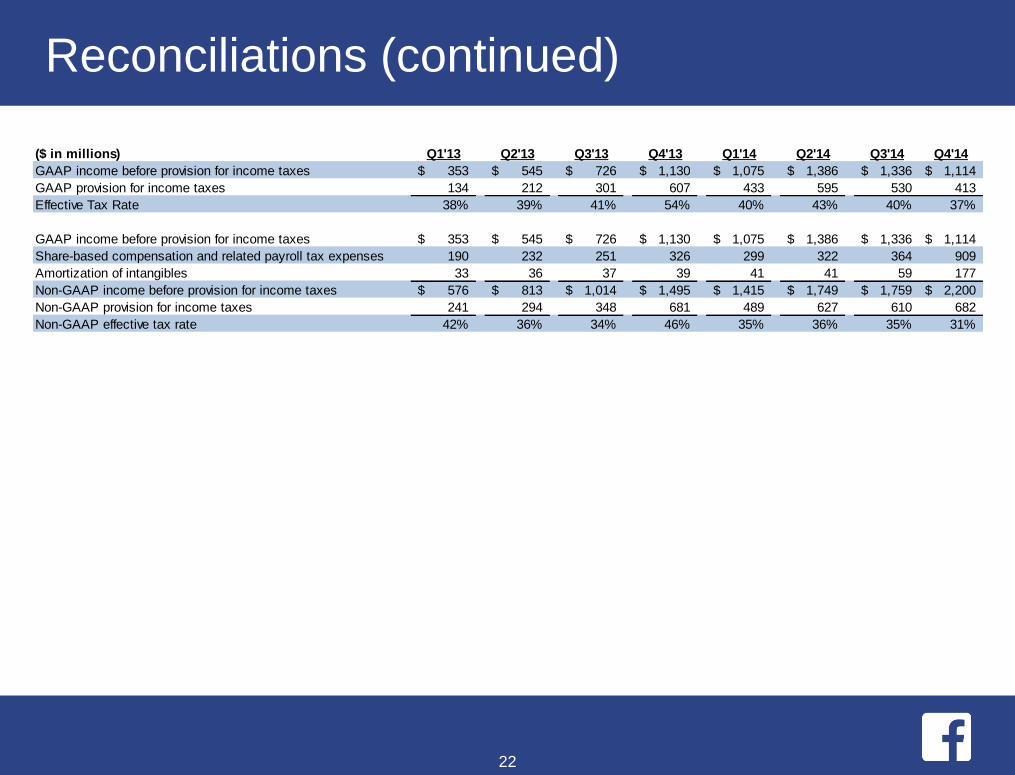
Q1 Q2 Q3 Q4 Q1 Q2 Q3 Q4
($ in millions) 2013 2013 2013 2013 2014 2014 2014 2014
GAAP income before provision for income taxes 353$ 545$ 726$ 1,130$ 1,075$ 1,386$ 1,336$ 1,114$
GAAP provision for income taxes 134 212 301 607 433 595 530 413
Effective Tax Rate 38% 39% 41% 54% 40% 43% 40% 37%
Q1 Q2 Q3 Q4 Q1 Q2 Q3 Q4
($ in millions) 2013 2013 2013 2013 2014 2014 2014 2014
Non-GAAP income before provision for income taxes 576 813 1,014 1,495 1,415 1,749 1,759 2,200
Non-GAAP provision for income taxes 241 294 348 681 489 627 610 682
Effective Tax Rate 42% 36% 34% 46% 35% 36% 35% 31%
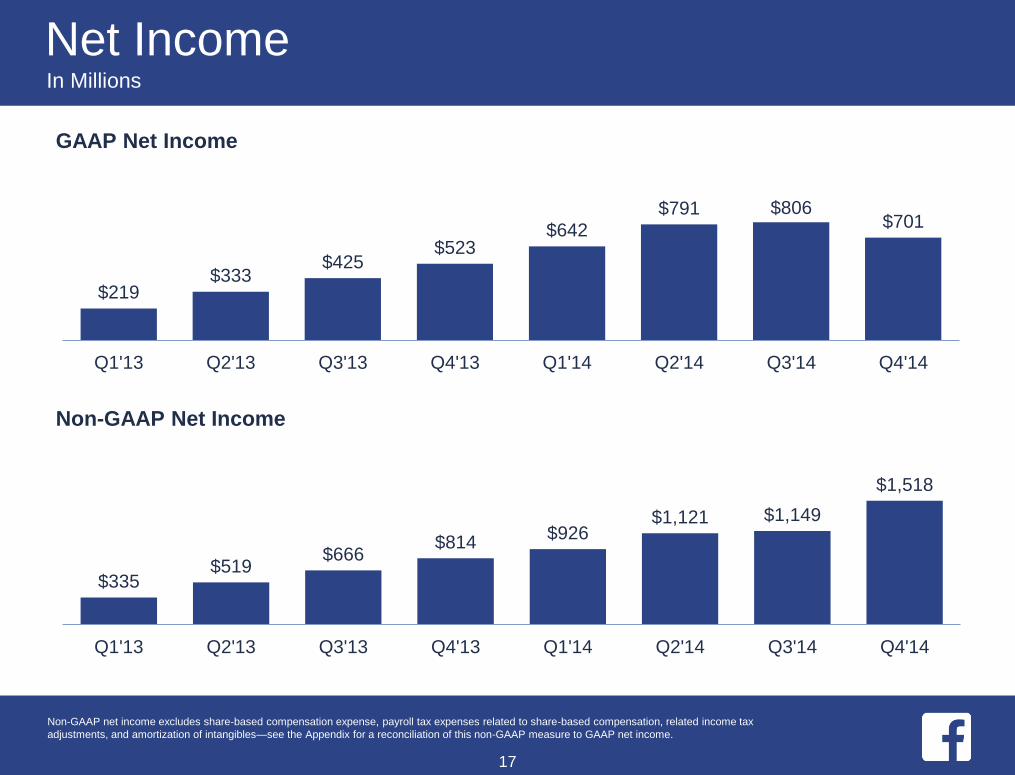
$219 $333
$425 $523
$642 $791 $806
$701
Q1'13 Q2'13 Q3'13 Q4'13 Q1'14 Q2'14 Q3'14 Q4'14
$335 $519
$666 $814
$926 $1,121 $1,149
$1,518
Q1'13 Q2'13 Q3'13 Q4'13 Q1'14 Q2'14 Q3'14 Q4'14
GAAP Net Income
Non-GAAP Net Income
Net Income
Non-GAAP net income excludes share-based compensation expense, payroll tax expenses related to share-based compensation, related income tax
adjustments, and amortization of intangibles—see the Appendix for a reconciliation of this non-GAAP measure to GAAP net income.
17
In Millions
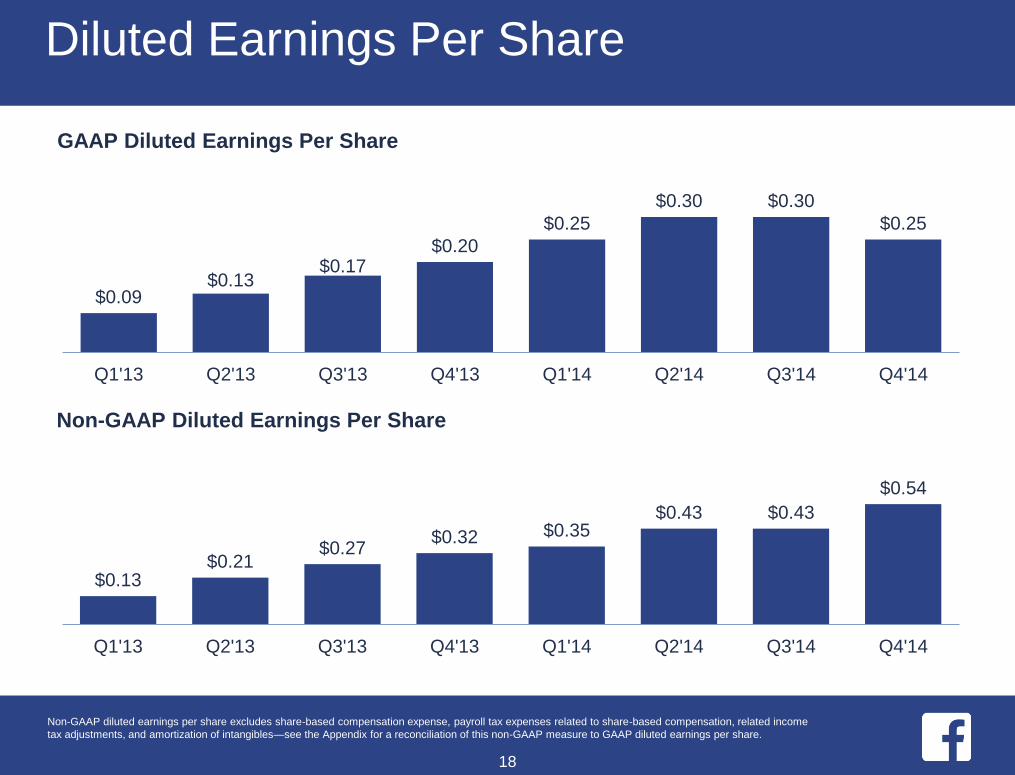
$0.09 $0.13
$0.17 $0.20
$0.25
$0.30 $0.30
$0.25
Q1'13 Q2'13 Q3'13 Q4'13 Q1'14 Q2'14 Q3'14 Q4'14
$0.13 $0.21
$0.27 $0.32 $0.35
$0.43 $0.43
$0.54
Q1'13 Q2'13 Q3'13 Q4'13 Q1'14 Q2'14 Q3'14 Q4'14
GAAP Diluted Earnings Per Share
Non-GAAP Diluted Earnings Per Share
Diluted Earnings Per Share
Non-GAAP diluted earnings per share excludes share-based compensation expense, payroll tax expenses related to share-based compensation, related income
tax adjustments, and amortization of intangibles—see the Appendix for a reconciliation of this non-GAAP measure to GAAP diluted earnings per share.
18
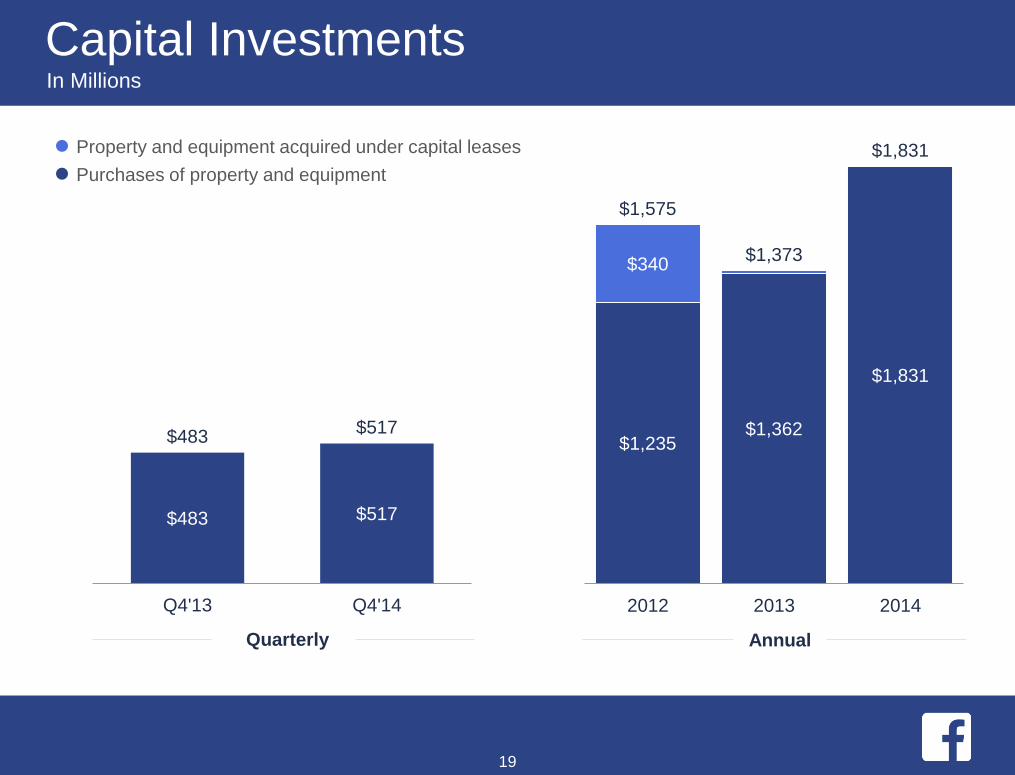
$1,235$1,362
$1,831
$340
$1,575
$1,373
$1,831
2012 2013 2014
Annual
$483 $517
$483$517
Q4'13 Q4'14
Quarterly
Capital InvestmentsIn Millions
Property and equipment acquired under capital leases
Purchases of property and equipment
19
Appendix

Reconciliations
21
Income from Operations (in millions) Q1'13 Q2'13 Q3'13 Q4'13 Q1'14 Q2'14 Q3'14 Q4'14
GAAP income from operations 373$ 562$ 736$ 1,133$ 1,075$ 1,390$ 1,397$ 1,133$
Share-based compensation expense 170 224 239 273 274 314 353 896
Payroll tax expenses related to share-based compensation 20 8 12 53 25 8 11 13
Amortization of intangible assets 33 36 37 39 41 41 59 177
Non-GAAP income from operations 596$ 830$ 1,024$ 1,498$ 1,415$ 1,753$ 1,820$ 2,219$
Operating Margin Q1'13 Q2'13 Q3'13 Q4'13 Q1'14 Q2'14 Q3'14 Q4'14
GAAP operating margin 26% 31% 37% 44% 43% 48% 44% 29%
Share-based compensation expense 12% 12% 12% 11% 11% 11% 11% 23%
Payroll tax expenses related to share-based compensation 1% 0% 1% 2% 1% 0% 0% 0%
Amortization of intangible assets 2% 2% 2% 2% 2% 1% 2% 5%
Non-GAAP operating margin 41% 46% 51% 58% 57% 60% 57% 58%
Net Income (in millions) Q1'13 Q2'13 Q3'13 Q4'13 Q1'14 Q2'14 Q3'14 Q4'14
GAAP net income 219$ 333$ 425$ 523$ 642$ 791$ 806$ 701$
Share-based compensation expense 170 224 239 273 274 314 353 896
Payroll tax expenses related to share-based compensation 20 8 12 53 25 8 11 13
Amortization of intangible assets 33 36 37 39 41 41 59 177
Income tax adjustments (107) (82) (47) (74) (56) (33) (80) (269)
Non-GAAP net income 335$ 519$ 666$ 814$ 926$ 1,121$ 1,149$ 1,518$
Diluted Earnings Per Share Q1'13 Q2'13 Q3'13 Q4'13 Q1'14 Q2'14 Q3'14 Q4'14
GAAP diluted earnings per share 0.09$ 0.13$ 0.17$ 0.20$ 0.25$ 0.30$ 0.30$ 0.25$
Non-GAAP adjustments to net income 0.04 0.08 0.10 0.12 0.10 0.13 0.13 0.29
Non-GAAP diluted earnings per share 0.13$ 0.21$ 0.27$ 0.32$ 0.35$ 0.43$ 0.43$ 0.54$
Reconciliations (continued)
22
($ in millions) Q1'13 Q2'13 Q3'13 Q4'13 Q1'14 Q2'14 Q3'14 Q4'14
GAAP income before provision for income taxes 353$ 545$ 726$ 1,130$ 1,075$ 1,386$ 1,336$ 1,114$
GAAP provision for income taxes 134 212 301 607 433 595 530 413
Effective Tax Rate 38% 39% 41% 54% 40% 43% 40% 37%
GAAP income before provision for income taxes 353$ 545$ 726$ 1,130$ 1,075$ 1,386$ 1,336$ 1,114$
Share-based compensation and related payroll tax expenses 190 232 251 326 299 322 364 909
Amortization of intangibles 33 36 37 39 41 41 59 177
Non-GAAP income before provision for income taxes 576$ 813$ 1,014$ 1,495$ 1,415$ 1,749$ 1,759$ 2,200$
Non-GAAP provision for income taxes 241 294 348 681 489 627 610 682
Non-GAAP effective tax rate 42% 36% 34% 46% 35% 36% 35% 31%
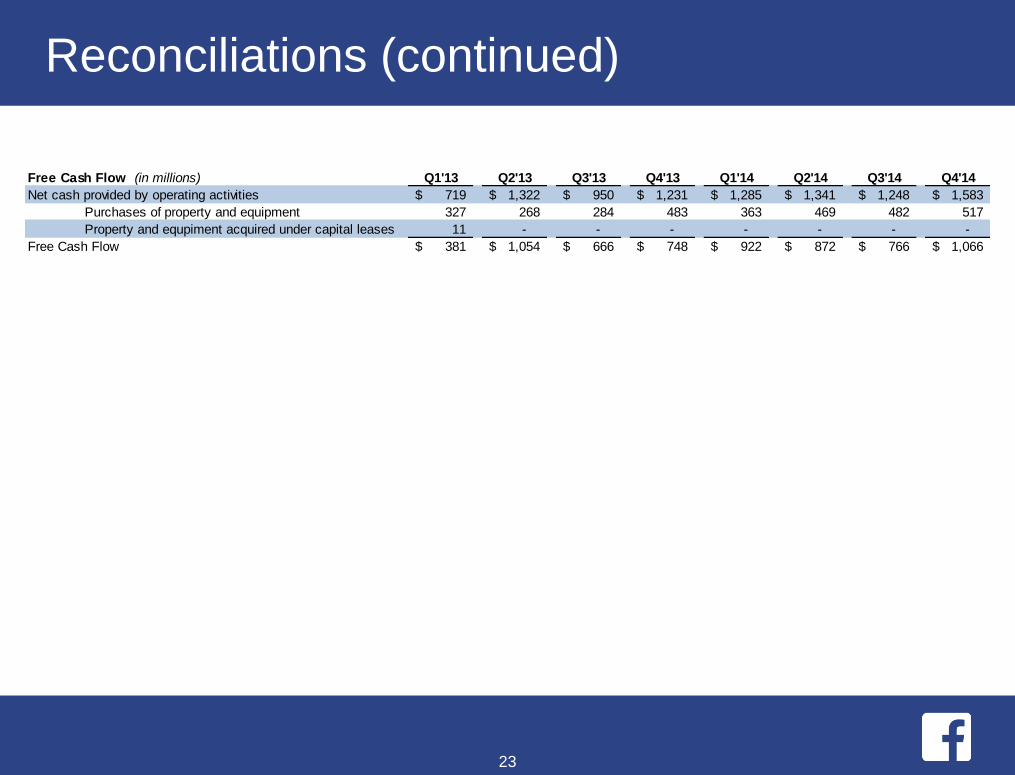
Reconciliations (continued)
23
Free Cash Flow (in millions) Q1'13 Q2'13 Q3'13 Q4'13 Q1'14 Q2'14 Q3'14 Q4'14
Net cash provided by operating activities 719$ 1,322$ 950$ 1,231$ 1,285$ 1,341$ 1,248$ 1,583$
Purchases of property and equipment 327 268 284 483 363 469 482 517
Property and equpiment acquired under capital leases 11 - - - - - - -
Free Cash Flow 381$ 1,054$ 666$ 748$ 922$ 872$ 766$ 1,066$

The numbers for our key metrics, which include our daily active users (DAUs), mobile DAUs, monthly active users (MAUs), mobile MAUs, and
average revenue per user (ARPU), as well as certain other metrics such as mobile-only DAUs and mobile-only MAUs, are calculated using internal
company data based on the activity of user accounts. While these numbers are based on what we believe to be reasonable estimates of our user base
for the applicable period of measurement, there are inherent challenges in measuring usage of our products across large online and mobile
populations around the world.
For example, there may be individuals who maintain one or more Facebook accounts in violation of our terms of service. We estimate, for example,
that "duplicate" accounts (an account that a user maintains in addition to his or her principal account) may have represented less than 5% of our
worldwide MAUs in 2014. We also seek to identify "false" accounts, which we divide into two categories: (1) user-misclassified accounts, where users
have created personal profiles for a business, organization, or non-human entity such as a pet (such entities are permitted on Facebook using a Page
rather than a personal profile under our terms of service); and (2) undesirable accounts, which represent user profiles that we determine are intended
to be used for purposes that violate our terms of service, such as spamming. In 2014, for example, we estimate user-misclassified and undesirable
accounts may have represented less than 2% of our worldwide MAUs. We believe the percentage of accounts that are duplicate or false is
meaningfully lower in developed markets such as the United States or United Kingdom and higher in developing markets such as India and Turkey.
However, these estimates are based on an internal review of a limited sample of accounts and we apply significant judgment in making this
determination, such as identifying names that appear to be fake or other behavior that appears inauthentic to the reviewers. As such, our estimation of
duplicate or false accounts may not accurately represent the actual number of such accounts. We are continually seeking to improve our ability to
identify duplicate or false accounts and estimate the total number of such accounts, and such estimates may change due to improvements or changes
in our methodology.
24
Limitations of Key Metrics and Other Data
24
25
Limitations of Key Metrics and Other Data (continued)
Our data limitations may affect our understanding of certain details of our business. For example, while user-provided data indicates a decline in
usage among younger users, this age data is unreliable because a disproportionate number of our younger users register with an inaccurate age.
Accordingly, our understanding of usage by age group may not be complete.
Some of our metrics have also been affected by applications on certain mobile devices that automatically contact our servers for regular updates with
no user action involved, and this activity can cause our system to count the user associated with such a device as an active user on the day such
contact occurs. The impact of this automatic activity on our metrics varies by geography because mobile usage varies in different regions of the world.
In addition, our data regarding the geographic location of our users is estimated based on a number of factors, such as the user's IP address and self-
disclosed location. These factors may not always accurately reflect the user's actual location. For example, a mobile-only user may appear to be
accessing Facebook from the location of the proxy server that the user connects to rather than from the user's actual location. The methodologies
used to measure user metrics may also be susceptible to algorithm or other technical errors. Our estimates for revenue by user location and revenue
by user device are also affected by these factors. We regularly review our processes for calculating these metrics, and from time to time we may
discover inaccuracies in our metrics or make adjustments to improve their accuracy, including adjustments that may result in the recalculation of our
historical metrics. We believe that any such inaccuracies or adjustments are immaterial unless otherwise stated. In addition, our DAU and MAU
estimates will differ from estimates published by third parties due to differences in methodology. For example, some third parties are not able to
accurately measure mobile users or do not count mobile users for certain user groups or at all in their analyses.
The numbers of DAUs, mobile DAUs, MAUs, mobile MAUs, mobile-only DAUs and mobile-only MAUs discussed in this presentation, as well as
ARPU, do not include users of Instagram or WhatsApp unless they would otherwise qualify as such users, respectively, based on their other activities
on Facebook.
25

Facebook Q4 2014 Results
investor.fb.com