Embed Size (px)
Citation preview

Reporting under IFRSsExample consolidated financial statements 2015 and guidance notes

Important Disclaimer:This document has been developed as an information resource. It is intended as a guide only and the application of its contents to specific situations will depend on the particular circumstances involved. While every care has been taken in its presentation, personnel who use this document to assist in evaluating compliance with International Financial Reporting Standards should have sufficient training and experience to do so. No person should act specifically on the basis of the material contained herein without considering and taking professional advice. “Grant Thornton” refers to the brand under which the Grant Thornton member firms provide assurance, tax and advisory services to their clients and/or refers to one or more member firms, as the context requires. Grant Thornton International Ltd (GTIL) and the member firms are not a worldwide partnership. GTIL and each member firm is a separate legal entity. Services are delivered by the member firms. GTIL does not provide services to clients. GTIL and its member firms are not agents of, and do not obligate, one another and are not liable for one another’s acts or omissions. Neither Grant Thornton International Ltd, nor any of its personnel nor any of its member firms or their partners or employees, accept any responsibility for any errors this document might contain, whether caused by negligence or otherwise, or any loss, howsoever caused, incurred by any person as a result of utilising or otherwise placing any reliance upon it.
Introduction iConsolidated statement of financial position 2Consolidated statement of profit or loss 4Consolidated statement of comprehensive income 5Consolidated statement of changes in equity 6Consolidated statement of cash flows 7Notes to the consolidated financial statements 81 Nature of operations 9 2 General information and statement of compliance with IFRSs 93 Changes in accounting policies 104 Summary of accounting policies 115 Acquisitions and disposals 266 Interests in subsidiaries 277 Investments accounted for using the equity method 318 Segment reporting 339 Goodwill 3610 Other intangible assets 3811 Property, plant and equipment 3912 Leases 4013 Investment property 4114 Financial assets and liabilities 4215 Deferred tax assets and liabilities 4716 Inventories 4817 Trade and other receivables 4918 Cash and cash equivalents 5019 Disposal groups classified as held for sale and discontinued operations 5020 Equity 5221 Employee remuneration 5422 Provisions 6023 Trade and other payables 6124 Other liabilities 6225 Finance costs and finance income 6226 Other financial items 6327 Tax expense 6428 Earnings per share and dividends 6429 Non-cash adjustments and changes in working capital 6530 Related party transactions 6631 Contingent liabilities 6732 Financial instruments risk 6733 Fair value measurement 7234 Capital management policies and procedures 7735 Post-reporting date events 7836 Authorisation of financial statements 78Appendix A: Organising the statement of profit or loss by function 80 of expenses Appendix B: Statement of comprehensive income presented in a 82 single statement
Contents
About usGrant Thornton is one of the world’s leading organisations of independent assurance, tax and advisory firms. These firms help dynamic organisations unlock their potential for growth by providing meaningful, forward looking advice. Proactive teams, led by approachable partners in these firms, use insights, experience and instinct to understand complex issues for privately owned, publicly listed and public sector clients and help them to find solutions. More than 35,000 Grant Thornton people, across over 100 countries, are focussed on making a difference to clients, colleagues and the communities in which we live and work.

Illustrative Corporation Group: Example Consolidated Financial Statements – 31 December 2015 i
Example Consolidated Financial Statements 2015The preparation of financial statements in accordance with International Financial Reporting Standards (‘IFRSs’) is challenging. Each year new Standards and Amendments are published by the International Accounting Standards Board (‘IASB’) with the potential to significantly impact both the presentation of the primary statements and the accompanying disclosures.
The member firms of Grant Thornton International Ltd (‘GTIL’) – one of the world’s leading organisations of independent assurance, tax and advisory firms – have extensive expertise in the application of IFRSs. GTIL, through its IFRS team, develops general guidance that supports its member firms’ commitment to high quality, consistent application of IFRSs and is therefore pleased to share these insights by publishing ‘Reporting under IFRSs – Example Consolidated Financial Statements 2015’ (the ‘Example Financial Statements’).
The Example Financial Statements are based on the activities and results of Illustrative Corporation and subsidiaries (the Group) – a fictional consulting, service and retail entity that has been preparing IFRS financial statements for several years. The form and content of IFRS financial statements depend on the activities and transactions of each reporting entity. Our objective in preparing the Example Financial Statements is to illustrate one possible approach to financial reporting by an entity engaging in transactions that are typical across a range of non-specialist sectors. However, as with any example, this illustration does not envisage every possible transaction and cannot therefore be regarded as comprehensive. Management is responsible for the fair presentation of financial statements and therefore may find other approaches more appropriate for its specific circumstances. The Example Financial Statements have been updated to reflect changes in IFRSs that are effective for the year ending 31 December 2015. No account has been taken of any new developments published after 31 July 2015.
Introduction

ii Illustrative Corporation Group: Example Consolidated Financial Statements – 31 December 2015
Using the Example Financial StatementsIn some areas, alternative presentation is also illustrated in the Appendices. For further guidance on the Standards and Interpretations applied, reference is made to IFRS sources throughout the Example Financial Statements on the left hand side of each page.
The Example Financial Statements do not address any jurisdictional or regulatory requirements in areas such as management commentary, remuneration reporting or audit reporting. Most importantly, the use of the Example Financial Statements is not a substitute for the use of a comprehensive and up to date disclosure checklist to ensure completeness of the disclosures in IFRS financial statements.
Grant Thornton International LtdAugust 2015
The Example Financial Statements have been updated to
reflect changes in IFRSs that are effective for the year ending 31 December 2015.
No account has been taken of any new developments published
after 31 July 2015.

Example Consolidated Financial Statements 2015International Financial Reporting Standards (IFRSs)Illustrative Corporation Group31 December 2015

Consolidated statement of financial position(expressed in thousands of Euroland currency units, except per share amounts)
Guidance note: Consolidated statement of financial positionThe Example Financial Statements use the terminology in IAS 1 ‘Presentation of Financial Statements’. However an entity may use other titles (eg ‘balance sheet’ instead of ‘statement of financial position’) for the primary financial statements (IAS 1.10). IFRS requires an entity to present, at a minimum, two statements of financial position (the current period and prior period).
IAS 1.10(f) and IAS 1.40A require an entity to present a statement of financial position as at the beginning of the preceding period (eg a third statement of financial position) if (i) it applies an accounting policy retrospectively, makes a retrospective restatement of items in its financial statements or reclassifies items in the financial statements and (ii) the retrospective application, retrospective restatement or the reclassification has a material effect on the information in the statement of financial position at the beginning of the preceding period. Even when a third statement of financial position is not required, an entity may still elect to include such a statement (IAS 1.38C). This approach allows an entity to maintain a more consistent format and layout from one year to the next and may therefore save on design and printing costs.
IAS 1.40C states that an entity required to present a third statement of financial position at the beginning of the preceding period need not present related notes for that statement. In contrast, IAS 1.38C states that entities electing to provide a third balance sheet, must also present related note information for that additional statement.
In the current year, Illustrative Corporation Group has elected to include an opening statement of financial position, although not required to do so under IAS 1.40A. Accordingly, the Example Financial Statements include a third statement of financial position and related notes as of 1 January 2014 (the beginning of the preceding period).
The statement of financial position reflects the separate classification of current and non-current assets and liabilities. When presentation based on liquidity is reliable and more relevant, the entity instead presents assets and liabilities in order of liquidity (IAS 1.60). Whichever method is used, however, the entity shall disclose the amount expected to be recovered or settled after more than twelve months for each asset and liability line item that combines amounts expected to be recovered or settled within and after more than 12 months (IAS 1.61).
2 Illustrative Corporation Group: Example Consolidated Financial Statements
IAS 1.51(c) Notes 31 Dec 31 Dec 1 JanIAS 1.51(d-e) 2015 2014 2014 AssetsIAS 1.60/66 Non-current IAS 1.57 Goodwill 9 5,041 3,537 1,234
IAS 1.54(c) Other intangible assets 10 17,424 13,841 10,664
IAS 1.54(a) Property, plant and equipment 11 22,199 20,397 20,746
IAS 1.54(e),
IAS 28.38 Investments accounted for using the equity method 7 860 467 104
IAS 1.54(b) Investment property 13 12,662 12,277 12,102
IAS 1.54(d) Other long-term financial assets 14.1 3,765 3,880 4,327
IAS 1.54(o),
IAS 1.56 Deferred tax assets 15 – 901 852
IAS 1.60 Non-current assets 61,951 55,300 50,029
IAS 1.60/66 Current IFRS 5.38, Assets included in disposal group classified as held 19 103 3,908 –
IAS 1.54(j) for sale
IAS 1.54(g) Inventories 16 18,298 17,226 18,571
IAS 1.54(h) Trade and other receivables 17 33,629 25,406 20,719
IAS 1.54(d)/55 Derivative financial instruments 14.5 582 212 490
IAS 1.54(d) Other short-term financial assets 14.1 655 649 631
IAS 1.54(n) Current tax assets – 337 –
IAS 1.54(i) Cash and cash equivalents 18 34,729 11,197 9,987
IAS 1.60 Current assets 87,996 58,935 50,398
IAS 1.55 Total assets 149,947 114,235 100,427

Consolidated statement of financial position(expressed in thousands of Euroland currency units, except per share amounts)
Illustrative Corporation Group: Example Consolidated Financial Statements 3
IAS 1.51(c) Notes 31 Dec 31 Dec 1 JanIAS 1.51(d-e) 2015 2014 2014 Equity and liabilities IAS 1.57 Equity Equity attributable to owners of the parent: IAS 1.54(r) Share capital 20 13,770 12,000 12,000
IAS 1.78(e) Share premium 20 19,645 3,050 3,050
IAS 1.78(e) Other components of equity 20 2,440 (657) 2,505
IAS 1.54(r) Retained earnings 51,674 39,024 25,428
Equity attributable to owners of the parent 87,529 53,417 42,983
IAS 1.54(q) Non-controlling interest 713 592 476
IAS 1.55 Total equity 88,242 54,009 43,459
Liabilities IAS 1.60/69 Non-current IAS 1.55 Pension and other employee obligations 21 10,386 13,642 8,932
IAS 1.54(m) Borrowings 14.6 21,000 21,265 21,405
IAS 1.54(k) Trade and other payables 23 4,060 4,459 4,765
IAS 1.54(o)/56 Deferred tax liabilities 15 1,907 – –
IAS 1.55 Other liabilities 24 2,020 1,500 1,600
IAS 1.60 Non-current liabilities 39,373 40,866 36,702
IAS 1.60/69 Current IFRS 5.38, Liabilities included in disposal group classified as 19 – 449 –
IAS 1.54(p) held for sale
IAS 1.54(l) Provisions 22 1,215 3,345 4,400
IAS 1.55 Pension and other employee obligations 21 1,467 1,496 1,336
IAS 1.54(m) Borrowings 14 4,815 3,379 3,818
IAS 1.54(k) Trade and other payables 23 9,009 7,056 7,672
IAS 1.54(n) Current tax liabilities 3,068 – 208
IAS 1.54(m) Derivative financial instruments 14.5 – 160 –
IAS 1.55 Other liabilities 24 2,758 3,475 2,832
IAS 1.60 Current liabilities 22,332 19,360 20,266
IAS 1.55 Total liabilities 61,705 60,226 56,968
IAS 1.55 Total equity and liabilities 149,947 114,235 100,427

Consolidated statement of profit or lossFor the years ended 31 December
(expressed in thousands of Euroland currency units, except per share amounts)
IAS 1.51(c) Notes 2015 2014IAS 1.51(d-e) IAS 1.82(a) Revenue 8 205,793 191,228
IAS 1.85 Other income 427 641
IAS 1.85 Changes in inventories (7,923) (5,623)
IAS 1.85 Costs of material (42,434) (40,485)
IAS 1.85 Employee benefits expense 21 (113,809) (109,515)
IAS 1.85 Change in fair value of investment property 13 310 175
IAS 1.85 Depreciation, amortisation and impairment of
non-financial assets (7,932) (6,051)
IAS 1.85 Other expenses (12,878) (11,276)
Operating profit 21,554 19,094
IAS 1.82(c) Share of profit from equity accounted investments 7 391 141
IAS 1.82(b) Finance costs 25 (1,490) (1,876)
IAS 1.85 Finance income 25 994 793
IAS 1.85 Other financial items 26 ,943 1,182
Profit before tax 22,392 19,334
IAS 1.82(d) Tax expense 27 (6,910) (5,763)
Profit for the year from continuing operations 15,482 13,571IAS 1.82(ea) Loss for the year from discontinued operations 19 (9) (325)
IAS 1.81A(a) Profit for the year 15,473 13,246
Profit for the year attributable to: IAS 1.81B(a)(i) Non-controlling interest 121 116
IAS 1.81B(a)(ii) Owners of the parent 15,352 13,130
15,473 13,246
CU CU Earnings per share 28
IAS 33.67A Basic earnings (loss) per share
IAS 33.66 From continuing operations 1.22 1.14
IAS 33.68A From discontinued operations (0.00) (0.03)
IAS 33.66 Total 1.22 1.11
IAS 33.67A Diluted earnings (loss) per share
IAS 33.66 From continuing operations 1.22 1.14
IAS 33.68A From discontinued operations (0.00) (0.03)
IAS 33.66 Total 1.22 1.11
Guidance note: Consolidated statement of profit or lossIAS 1 permits an entity to present a statement of profit or loss and comprehensive income as: • a single statement with profit or loss and other
comprehensive income presented in two sections, or • two statements: a separate statement of profit or
loss and a separate statement of comprehensive income. If so, the separate statement of profit or loss shall immediately precede the statement presenting comprehensive income, which shall begin with profit or loss (IAS 1.10A).
The Example Financial Statements illustrate a statement of profit or loss and comprehensive income in two statements. A single statement presentation is shown in Appendix B.
This statement of profit or loss format illustrates an example of the ‘nature of expense’ method. See Appendix A for a format illustrating the ‘function of expense’ or cost of sales method.
This statement of profit or loss presents an operating profit subtotal, which is commonly seen but is not required or defined in IFRS. Where this subtotal is provided, the figure disclosed should include items that would normally be considered to be operating. It is inappropriate to exclude items clearly related to operations (eg inventory write-downs and restructuring and relocation expenses) on the basis that they do not occur regularly or are unusual in amount (IAS 1.BC56).
This statement of profit or loss includes an amount representing the entity’s share of profit from equity accounted investments (after tax and, if applicable, non-controlling interest).
4 Illustrative Corporation Group: Example Consolidated Financial Statements

Consolidated statement of comprehensive incomeFor the years ended 31 December
(expressed in thousands of Euroland currency units, except per share amounts)
Guidance note: Consolidated statement of comprehensive incomeIAS 1 requires the entity to disclose reclassification adjustments (amounts previously recognised in other comprehensive income that are reclassified to profit or loss) and related tax effects (IAS 1.90-1.92). The Example Financial Statements present reclassification adjustments and current year gains and losses relating to other comprehensive income on the face of the statement of comprehensive income. An entity may instead present reclassification adjustments in the notes, in which case the components of other comprehensive income are presented after any related reclassification adjustments (IAS 1.94).
IAS 1.82A requires items to be grouped into those that will not be reclassified subsequently to profit or loss and those that will be reclassified subsequently to profit or loss when specific conditions are met.
IAS 1.90 permits a choice for disclosure of the amount of income tax relating to each component of other comprehensive income. In this example the entity presents components of other comprehensive income before tax with one amount shown for the aggregate amount of income tax relating to all components of other comprehensive income (IAS 1.91(b)). When an entity selects alternative (b) of IAS 1.91, it shall allocate the tax between the items that might be reclassified subsequently to the profit or loss section and those that will not be reclassified subsequently to the profit or loss section (IAS 1.91).
Alternatively, the entity may present each component of other comprehensive income net of related tax effects (IAS 1.91(a)).
If the tax effect of each component of other comprehensive income is not presented on the face of the statement, it is presented in the notes (IAS 1.90 – see Note 20.3).
IAS 1.51(c) Notes 2015 2014IAS 1.51(d-e) IAS 1.81A(a) Profit for the year 15,473 13,246
Other comprehensive income:IAS 1.82A(a) Items that will not be reclassified subsequently to profit or loss IAS 16.77(f) Revaluation of land 11 303 –
IAS 19.120(c) Remeasurement of net defined benefit liability 21 3,830 (3,541)
IAS 1.90/91(b) Income tax relating to items not reclassified 20.3 (1,240) 1,062
IAS 1.82A(b) Items that will be reclassified subsequently to profit or loss Cash flow hedging 14
IFRS 7.23(c-d) current year gains (losses) 367 (47)
IAS 1.92 reclassification to profit or loss 260 (425)
Available-for-sale financial assets 14
IFRS 7.20(a)(ii) current year gains 113 35
IAS 1.92 reclassification to profit or loss (50) –
IAS 21.52(b) Exchange differences on translating foreign operations (664) (341)
IAS 1.82A Share of other comprehensive income of equity
accounted investments 7 5 IAS 1.92 reclassification to profit or loss (3) –
IAS 1.90/91(b) Income tax relating to items that will be reclassified 20.3 176 95
IAS 1.81A(c) Other comprehensive income for the year, net of tax 3,097 (3,162)
IAS 1.81A(b) Total comprehensive income for the year 18,570 10,084
Total comprehensive income for the year attributable to: IAS 1.81B(b)(i) Non-controlling interest 121 116
IAS 1.81B(b)(ii) Owners of the parent 18,449 9,968
18,570 10,084
Illustrative Corporation Group: Example Consolidated Financial Statements 5

Consolidated statement of changes in equityFor the years ended 31 December
(expressed in thousands of Euroland currency units, except per share amounts)
Notes Share Share Other Retained Total Non- Total capital premium components earnings attributable controlling equityIAS 1.51(c) of equity to owners interestIAS 1.51(d-e) of parentIAS 1.106(d) Balance at 1 January 2015 12,000 3,050 (657) 39,024 53,417 592 54,009 Dividends 28 – – – (3,000) (3,000) – (3,000)
Issue of share capital on exercise of employee 21.2 270 1,415 – – 1,685 – 1,685
share options
Employee share-based compensation 21.2 – – – 298 298 – 298
Issue of share capital on private placement 20 1,500 15,180 – – 16,680 – 16,680
IAS 1.106(d)(iii) Transactions with owners 1,770 16,595 – (2,702) 15,663 – 15,663
IAS 1.106(d)(i) Profit for the year – – – 15,352 15,352 121 15,473
IAS 1.106(d)(ii),
IAS 1.106A Other comprehensive income 20.3 – – 3,097 – 3,097 – 3,097
IAS 1.106(a) Total comprehensive income for the year – – 3,097 15,352 18,449 121 18,570
IAS 1.106(d) Balance at 31 December 2015 13,770 19,645 2,440 51,674 87,529 713 88,242
IAS 1.106(d) Balance at 1 January 2014 12,000 3,050 2,505 25,428 42,983 476 43,459 Employee share-based compensation 21.2 – – – 466 466 – 466
IAS 1.106(d)(iii) Transactions with owners – – – 466 466 – 466
IAS 1.106(d)(i) Profit for the year – – – 13,130 13,130 116 13,246
IAS 1.106(d)(ii),
IAS 1.106A Other comprehensive income 20.3 – – (3,162) – (3,162) – (3,162)
IAS 1.106(a) Total comprehensive income for the year – – (3,162) 13,130 9,968 116 10,084
IAS 1.106(d) Balance at 31 December 2014 12,000 3,050 (657) 39,024 53,417 592 54,009
Guidance note: Consolidated statement of changes in equityIAS 1.106 provides a list of items to be presented on the face of the statement of changes in equity. Entities may present the required reconciliations for each component of other comprehensive income either (1) in the statement of changes in equity or (2) in the notes to the financial statements (IAS 1.106(d)(ii) and IAS 1.106A).
The Example Financial Statements present the reconciliations for each component of other comprehensive income in the notes to the financial statements (see Note 20.3). This reduces duplicated disclosures and presents more clearly the overall changes in equity.
IFRS 2 ‘Share-based Payment’ requires an entity to recognise equity-settled share-based payment transactions as changes in equity but does not specify how this is presented, eg in a separate reserve within equity or within retained earnings. In our view, either approach is allowed under IFRSs (although this may be subject to local regulations in some jurisdictions). In the Example Financial Statements, the changes in equity are credited to retained earnings.
6 Illustrative Corporation Group: Example Consolidated Financial Statements

Consolidated statement of cash flowsFor the years ended 31 December
(expressed in thousands of Euroland currency units, except per share amounts)
IAS 1.51(c) Notes 2015 2014IAS 1.51(d-e) IAS 7.10 Operating activities Profit before tax 22,392 19,334
Non-cash adjustments 29 7,937 7,278
Contributions to defined benefit plans (1,186) (1,273)
Net changes in working capital 29 (1,360) (344)
Settling of derivative financial instruments (33) 716
IAS 7.35 Taxes paid (1,761) (5,568)
Net cash from continuing operations 25,989 20,143
IFRS 5.33(c) Net cash from (used in) discontinued operations 19 (22) 811
Net cash from operating activities 25,967 20,954
IAS 7.10 Investing activities Purchase of property, plant and equipment (76) (3,281)
Proceeds from disposal of property, plant and equipment 86 –
Purchase of other intangible assets (3,666) (3,235)
Proceeds from disposal of other intangible assets 924 –
IAS 7.39, 7.42 Acquisition of subsidiaries, net of cash acquired 5 (15,491) (12,075)
IAS 7.39 Proceeds from sale of subsidiaries, net of cash sold 6.3 3,117 –
Proceeds from disposal and redemption of non-derivative financial assets 228 132
IAS 7.31 Interest received 25 752 447
IAS 7.31 Dividends received 25 62 21
IAS 7.35 Taxes paid (467) (140)
Net cash used in investing activities (14,531) (18,131)
IAS 7.10 Financing activities Proceeds from borrowings 1,441 –
Repayment of borrowings (3,778) (649)
Proceeds from issue of share capital 18,365 –
IAS 7.31 Interest paid 25 (1,015) (985)
IAS 7.31 Dividends paid 28 (3,000) – Net cash from (used in) financing activities 12,013 (1,634)
IAS 7.45 Net change in cash and cash equivalents 23,449 1,189
Cash and cash equivalents, beginning of year 11,219 9,987
IAS 7.28 Exchange differences on cash and cash equivalents 61 43
34,729 11,219 Cash and cash equivalents included in
disposal group 19 – (22)
IAS 7.45 Cash and cash equivalents, end of year 18 34,729 11,19 7
Illustrative Corporation Group: Example Consolidated Financial Statements 7

Notes to the Consolidated Financial Statements
Guidance note: Notes to the Consolidated Financial StatementsIAS 1 sets out the basic principles governing the form and content of financial statements and related notes. The notes shall be presented in a systematic manner, and disclose information about the specific accounting policies used, the basis of preparation of the financial statements, and any other information either required by other IFRSs, or necessary to the understanding of the statements.
Beyond this, entities should apply judgement to determine the best way to present the notes to maximize their usefulness. In December 2014, the IASB issued ‘Disclosure Initiative –Amendments to IAS 1 Presentation of Financial Statements’ which clarifies that:a) materiality applies to disclosures as well as to the primary financial statements, and hence there is no need to disclose immaterial information even if it is required by an IFRSb) companies have flexibility when determining the order of the notes, and need not follow the order specified in paragraph 114 of IAS 1c) entities should emphasise understandability and comparability when making decisions about the ordering of notes.
For convenience, the Example Financial Statements generally follow the order suggested by IAS 1.114 although entities are encouraged to consider alternatives that may enhance the understandability of the financial statements to readers. For example, in recent years there has been a growing trend towards integrating information about accounting policies and significant judgements and estimates with the related notes.
In complying with the requirement in paragraph 30 of IAS 8 to disclose the existence of new or amended IFRSs or Interpretations that are not yet effective and have not been adopted early by the entity, the Example Financial Statements describe only those new or amended IFRSs or Interpretations that are expected to have a material impact on the financial statements either upon initial adoption or at some foreseeable future date. An explicit statement to this effect is included in note 3.2. Depending on the needs of their stakeholders, other entities may prefer to include a complete list of all new or amended IFRSs and Interpretations when responding to the disclosure requirements of IAS 8.30. In addition, while a traditional narrative format has been adopted for use in the Example Financial Statements, entities should consider whether alternative presentation formats (such as presenting the information in a table) would enhance readers’ understanding.
Illustrative Corporation GroupFor the years ended 31 December 2015 and 2014(expressed in thousands of Euroland currency units, except per share amounts)
8 Illustrative Corporation Group: Example Consolidated Financial Statements

1. Nature of operations1
IAS 1.51(a) The principal activities of Illustrative Corporation Ltd and subsidiaries (the Group) include IAS 1.138(b) consulting on, servicing and sale of customised IT and telecommunications systems. These
activities are grouped into the following service lines: • consulting – focused on the design, development, and sale of customised phone and
intranet based applications and the customisation and integration of third party IT and telecommunication systems
• service – provides after-sale service and maintenance of IT and telecommunication systems • retail – involved in the on-line sales of hardware and software products of the Group’s
business partners.
2. General information and statement of compliance with IFRSs
IAS 1.138(a) Illustrative Corporation Ltd (Illustrative Corporation), the Group’s ultimate parent company, IAS 1.138(c) is a limited liability company incorporated and domiciled in Euroland. Its registered office
and principal place of business is 149 Great Place, 40237 Greatville, Euroland. Illustrative Corporation’s shares are listed on the Greatstocks Stock Exchange.
IAS 1.16 The consolidated financial statements of the Group have been prepared in accordance with IAS 1.51(b) International Financial Reporting Standards (IFRSs) as issued by the International Accounting
Standards Board (IASB). IAS 1.51(c) The consolidated financial statements for the year ended 31 December 2015 (including IAS 10.17 comparatives) were approved and authorised for issue by the board of directors on 8 March 2016
(see Note 36). Under the Security Regulations Act of Euroland, amendments to the financial statements are not permitted after approval.
In 2015 the group has not applied any new accounting policies (see Note 3.1 below) or made other retrospective changes that have a material effect on the consolidated statement of financial position as at 1 January 2014. Accordingly, the Group is not required to present a third statement of financial position as at that date. However, the Group has elected to provide this additional comparative information together with related notes as permitted by IAS 1 ‘Presentation of Financial Statements’.
1 The example notes to the Example financial statements only include disclosures that are relevant to the fictitious entity – Illustrative Corporation and subsidiaries. IFRSs may require additional disclosures in other situations. The disclosures should be tailored in all cases to reflect the entity’s specific facts and circumstances, based on a comprehensive and up to date disclosure checklist
Illustrative Corporation Group: Example Consolidated Financial Statements 9
Notes to the Consolidated Financial StatementsFor the years ended 31 December 2015 and 2014 (expressed in thousands of Euroland currency units, except per share amounts)

3. Changes in accounting policies2
3.1 New and revised standards that are effective for annual periods beginning on or after 1 January 20153
IAS 8.28(a)-(d) ‘Defined Benefit Plans: Employee Contributions’ (Amendments to IAS 19) came into mandatory effect for the first time in 2015 but the Group early adopted these Amendments in 2014. Other amendments to IFRSs that became mandatorily effective in 2015 have no material impact on the Group’s financial results or position. Accordingly, the Group have made no changes to its accounting policies in 2015.
3.2 Standards, amendments and interpretations to existing standards that are not yet effective and have not been adopted early by the Group
IAS 8.30 At the date of authorisation of these financial statements, certain new standards, and amendments IAS 8.31 to existing standards have been published by the IASB that are not yet effective, and have not been
adopted early by the Group. Information on those expected to be relevant to the Group’s financial statements is provided below.
Management anticipates that all relevant pronouncements will be adopted in the Group’s accounting policies for the first period beginning after the effective date of the pronouncement. New standards, interpretations and amendments not either adopted or listed below are not expected to have a material impact on the Group’s financial statements.
IFRS 9 ‘Financial Instruments’ (2014) The IASB recently released IFRS 9 ‘Financial Instruments’ (2014), representing the completion
of its project to replace IAS 39 ‘Financial Instruments: Recognition and Measurement’. The new standard introduces extensive changes to IAS 39’s guidance on the classification and measurement of financial assets and introduces a new ‘expected credit loss’ model for the impairment of financial assets. IFRS 9 also provides new guidance on the application of hedge accounting.
Management has started to assess the impact of IFRS 9 but is not yet in a position to provide quantified information. At this stage the main areas of expected impact are as follows:
• the classification and measurement of the Group’s financial assets will need to be reviewed based on the new criteria that considers the assets’ contractual cash flows and the business model in which they are managed
• an expected credit loss-based impairment will need to be recognised on the Group’s trade receivables (see note 14.1) and investments in debt-type assets currently classified as AFS and HTM (see note 14.1), unless classified as at fair value through profit or loss in accordance with the new criteria
• it will no longer be possible to measure equity investments at cost less impairment and all such investments will instead be measured at fair value. Changes in fair value will be presented in profit or loss unless the Group makes an irrevocable designation to present them in other comprehensive income. This will affect the Group’s investment in XY Ltd (see note 14.3) if still held on 1 January 2018
Notes to the Consolidated Financial StatementsFor the years ended 31 December 2015 and 2014 (expressed in thousands of Euroland currency units, except per share amounts)
10 Illustrative Corporation Group: Example Consolidated Financial Statements
2 The discussion of the initial application of IFRSs needs to be disclosed only in the first financial statements after the new or revised standards have been adopted by the entity.
3 The other amendments that are effective for the first time in 2015 (for entities with a 31 December 2015 year-end) are set out in ‘Annual Improvements 2010-2012’ cycle and ‘Annual Improvements 2011-2013’ cycle. We have assumed that these amendments do not effect Illustrative Corporation Group but they will of course impact some entities.

• if the Group continues to elect the fair value option for certain financial liabilities (see note 14.6), fair value movements will be presented in other comprehensive income to the extent those changes relate to the Group’s own credit risk.
IFRS 9 is effective for annual reporting periods beginning on or after 1 January 2018.
IFRS 15 ‘Revenue from Contracts with Customers’ IFRS 15 presents new requirements for the recognition of revenue, replacing IAS 18 ‘Revenue’,
IAS 11 ‘Construction Contracts’, and several revenue-related Interpretations. The new standard establishes a control-based revenue recognition model and provides additional guidance in many areas not covered in detail under existing IFRSs, including how to account for arrangements with multiple performance obligations, variable pricing, customer refund rights, supplier repurchase options, and other common complexities.
IFRS 15 is effective for annual reporting periods beginning on or after 1 January 20184. Management has started to assess the impact of IFRS 15 but is not yet in a position to provide quantified information.
Amendments to IFRS 11 Joint Arrangements These amendments provide guidance on the accounting for acquisitions of interests in joint
operations constituting a business. The amendments require all such transactions to be accounted for using the principles on business combinations accounting in IFRS 3 ‘Business Combinations’ and other IFRSs except where those principles conflict with IFRS 11. Acquisitions of interests in joint ventures are not impacted by this new guidance.
The Group’s only investment made to date in a joint arrangement (note 7.2) is characterised as a joint venture in which the Group has rights to a share of the arrangement’s net assets rather than direct rights to underlying assets and obligations for underlying liabilities. Accordingly, if adopted today, these amendments would not have a material impact on the consolidated financial statements.
The amendments are effective for reporting periods beginning on or after 1 January 2016.
4. Summary of accounting policies
IAS 1.114(b) 4.1 Overall considerationsIAS 1.117 The consolidated financial statements have been prepared using the significant accounting
policies and measurement bases summarised below.
4.2 Basis of consolidationIAS 1.117(a) The Group financial statements consolidate those of the parent company and all of its IAS 1.117(b) subsidiaries as of 31 December 2015. All subsidiaries have a reporting date of 31 December. IFRS 10.B92 All transactions and balances between Group companies are eliminated on consolidation, IAS 1.51(c) including unrealised gains and losses on transactions between Group companies. Where IFRS 10.B86(c) unrealised losses on intra-group asset sales are reversed on consolidation, the underlying asset is also tested for impairment from a group perspective. Amounts reported in the financial
statements of subsidiaries have been adjusted where necessary to ensure consistency with the accounting policies adopted by the Group.
Notes to the Consolidated Financial StatementsFor the years ended 31 December 2015 and 2014 (expressed in thousands of Euroland currency units, except per share amounts)
Illustrative Corporation Group: Example Consolidated Financial Statements 11
4 The deferral of the effective date of IFRS 15 from 1 January 2017 to 1 January 2018 was approved by the Board in July 2015, with the amendment to the standard expected to be released in September 2015.
IFRS 10.B88 Profit or loss and other comprehensive income of subsidiaries acquired or disposed of during the year are recognised from the effective date of acquisition, or up to the effective date of disposal, as applicable.
IFRS 10.22 The Group attributes total comprehensive income or loss of subsidiaries between the owners IFRS 10.B94 of the parent and the non-controlling interests based on their respective ownership interests.
4.3 Business combinationsIAS 1.117(a) The Group applies the acquisition method in accounting for business combinations. The IAS 1.117(b) consideration transferred by the Group to obtain control of a subsidiary is calculated as the
sum of the acquisition-date fair values of assets transferred, liabilities incurred and the equity interests issued by the Group, which includes the fair value of any asset or liability arising from a contingent consideration arrangement. Acquisition costs are expensed as incurred.
Assets acquired and liabilities assumed are generally measured at their acquisition-date fair values.
4.4 Investments in associates and joint venturesIAS 28.3 Investments in associates and joint ventures are accounted for using the equity method. IFRS 11.16 The carrying amount of the investment in associates and joint ventures is increased or IAS 28.10 decreased to recognise the Group’s share of the profit or loss and other comprehensive income IFRS 11.24 of the associate and joint venture, adjusted where necessary to ensure consistency with the
accounting policies of the Group. Unrealised gains and losses on transactions between the Group and its associates and joint
ventures are eliminated to the extent of the Group’s interest in those entities. Where unrealised losses are eliminated, the underlying asset is also tested for impairment.
4.5 Foreign currency translation Functional and presentation currencyIAS 21.53 The consolidated financial statements are presented in currency CU, which is also the functional IAS 1.51(d) currency of the parent company.
Foreign currency transactions and balancesIAS 1.117(a) Foreign currency transactions are translated into the functional currency of the respective Group IAS 1.117(b) entity, using the exchange rates prevailing at the dates of the transactions (spot exchange rate).
Foreign exchange gains and losses resulting from the settlement of such transactions and from the remeasurement of monetary items denominated in foreign currency at year-end exchange rates are recognised in profit or loss.
Non-monetary items are not retranslated at year-end and are measured at historical cost (translated using the exchange rates at the transaction date), except for non-monetary items measured at fair value which are translated using the exchange rates at the date when fair value was determined.
Foreign operationsIAS 21.47 In the Group’s financial statements, all assets, liabilities and transactions of Group entities IAS 21.48 with a functional currency other than the CU are translated into CU upon consolidation. The
functional currency of the entities in the Group has remained unchanged during the reporting period.
Notes to the Consolidated Financial StatementsFor the years ended 31 December 2015 and 2014 (expressed in thousands of Euroland currency units, except per share amounts)
12 Illustrative Corporation Group: Example Consolidated Financial Statements

On consolidation, assets and liabilities have been translated into CU at the closing rate at the reporting date. Goodwill and fair value adjustments arising on the acquisition of a foreign entity have been treated as assets and liabilities of the foreign entity and translated into CU at the closing rate. Income and expenses have been translated into CU at the average rate5 over the reporting period. Exchange differences are charged or credited to other comprehensive income and recognised in the currency translation reserve in equity. On disposal of a foreign operation, the related cumulative translation differences recognised in equity are reclassified to profit or loss and are recognised as part of the gain or loss on disposal.
4.6 Segment reportingIFRS 8.22(a) The Group has three operating segments: consulting, service and retail segments. In identifying IFRS 8.22(b) these operating segments, management generally follows the Group’s service lines representing
its main products and services (see Note 1). IFRS 8.27(a) Each of these operating segments is managed separately as each requires different
technologies, marketing approaches and other resources. All inter-segment transfers are carried out at arm’s length prices based on prices charged to unrelated customers in standalone sales of identical goods or services.
IFRS 8.27(b-d) For management purposes, the Group uses the same measurement policies as those used in its financial statements, except for certain items not included in determining the operating profit of the operating segments, as follows:
• post-employment benefit expenses • share-based payment expenses • research costs relating to new business activities • revenue, costs and fair value gains from investment property.
In addition, corporate assets which are not directly attributable to the business activities of any operating segment are not allocated to a segment. This primarily applies to the Group’s headquarters and the Illustrative Research Lab in Greatville.
4.7 RevenueIAS 18.35(a) Revenue arises from the sale of goods and the rendering of services. It is measured at the fair
value of consideration received or receivable, excluding sales taxes, and reduced by any rebates and trade discounts allowed.
The Group often enters into sales transactions involving a range of the Group’s products and services, for example for the delivery of hardware, software and related after-sales service. The Group applies the revenue recognition criteria set out below to each separately identifiable component of the sales transaction. The consideration received from these multiple-component transactions is allocated to each separately identifiable component in proportion to its relative fair value.
IAS 1.117(b) Sale of goods (hardware or software) A sale of goods is recognised when the Group has transferred to the buyer the significant risks
and rewards of ownership, generally when the customer has taken undisputed delivery of the goods.
The Group does not presently utilise electronic delivery methods for its retail software sales, and all such software is licensed for immediate use by the customer following installation. When the software is sold on a standalone basis, installation is performed by the customer and does not impact the timing of revenue recognition.
5 Note that the use of average rates is appropriate only if rates do not fluctuate significantly (IAS 21.40).
Notes to the Consolidated Financial StatementsFor the years ended 31 December 2015 and 2014 (expressed in thousands of Euroland currency units, except per share amounts)
Illustrative Corporation Group: Example Consolidated Financial Statements 13

Where the Group has agreed to perform significant tailoring, modification or integration services in connection with a product sale, revenue is recognised in the same way as construction contracts for telecommunication systems described below.
When goods are sold together with customer loyalty incentives, the consideration receivable is allocated between the sale of goods and sale of incentives based on their relative fair values. Revenue from the sale of incentives is recognised when they are redeemed by customers in exchange for products supplied by the Group.
IAS 1.117(b) Rendering of services The Group generates revenues from after-sales service and maintenance, consulting, and
construction contracts for telecommunication systems. Consideration received for these services is initially deferred, included in other liabilities, and is recognised as revenue in the period when the service is performed.
IAS 18.25 In recognising after-sales service and maintenance revenues, the Group determines the stage of completion by considering both the nature and timing of the services provided and its customer’s pattern of consumption of those services, based on historical experience. Where the promised services are characterised by an indeterminate number of acts over a specified period of time, revenue is recognised on a straight-line basis. Revenue from consulting services is recognised when the services are provided by reference to the contract’s stage of completion at the reporting date in the same way as construction contracts for telecommunication systems described below.
The Group also earns rental income from operating leases of its investment properties (see Note 13). Rental income is recognised on a straight-line basis over the term of the lease.
IAS 1.117(b) Construction contracts for telecommunication systems Construction contracts for telecommunication systems specify a fixed price for the design,
development and installation of IT and telecommunication systems.IAS 11.39(b) When the outcome can be assessed reliably, contract revenue and associated costs are IAS 18.35(a) recognised by reference to the stage of completion of the contract activity at the reporting date.
Contract revenue is measured at the fair value of consideration received or receivable. When the Group cannot measure the outcome of a contract reliably, revenue is recognised
only to the extent of contract costs that have been incurred and are recoverable. Contract costs are recognised in the period in which they are incurred.
In either situation, when it is probable that total contract costs will exceed total contract revenue, the expected loss is recognised immediately in profit or loss.
IAS 1.117(a) A construction contract’s stage of completion is assessed by management by comparing IAS 11.39(c) costs incurred to date with the total costs estimated for the contract (a procedure sometimes IAS 1.122 referred to as the cost-to-cost method). Only those costs that reflect work performed are IAS 11.31 included in costs incurred to date. The gross amount due from customers for contract work is presented within trade and other
receivables for all contracts in progress for which costs incurred plus recognised profits (less recognised losses) exceeds progress billings. The gross amount due to customers for contract work is presented within other liabilities for all contracts in progress for which progress billings exceed costs incurred plus recognised profits (less recognised losses).
Interest and dividendsIAS 18.30 Interest income and expenses are reported on an accrual basis using the effective interest method.
Dividends, other than those from investments in associates and joint ventures, are recognised at the time the right to receive payment is established.
Notes to the Consolidated Financial StatementsFor the years ended 31 December 2015 and 2014 (expressed in thousands of Euroland currency units, except per share amounts)
14 Illustrative Corporation Group: Example Consolidated Financial Statements

4.8 Operating expensesIAS 1.117(b) Operating expenses are recognised in profit or loss upon utilisation of the service or as incurred.
Expenditure for warranties is recognised when the Group incurs an obligation, which is typically when the related goods are sold.
4.9 Borrowing costsIAS 1.117(b) Borrowing costs directly attributable to the acquisition, construction or production of a
qualifying asset are capitalised during the period of time that is necessary to complete and prepare the asset for its intended use or sale. Other borrowing costs are expensed in the period in which they are incurred and reported in finance costs (see Note 25).
4.10 Profit or loss from discontinued operations A discontinued operation is a component of the Group that either has been disposed of, or
is classified as held for sale. Profit or loss from discontinued operations comprises the post-tax profit or loss of discontinued operations and the post-tax gain or loss resulting from the measurement and disposal of assets classified as held for sale (see also Notes 4.21 and 19).
4.11 GoodwillIAS 1.117(a) Goodwill represents the future economic benefits arising from a business combination that
are not individually identified and separately recognised. Goodwill is carried at cost less accumulated impairment losses. Refer to Note 4.15 for a description of impairment testing procedures.
4.12 Other intangible assets IAS 1.117(b) Initial recognition of other intangible assets Brand names and customer lists Brand names and customer lists acquired in a business combination that qualify for separate
recognition are recognised as intangible assets at their fair values (see Note 4.3).
Internally developed softwareIAS 1.117(b) Expenditure on the research phase of projects to develop new customised software for IT and
telecommunication systems is recognised as an expense as incurred.IAS 38.57 Costs that are directly attributable to a project’s development phase are recognised as
intangible assets, provided they meet the following recognition requirements: • the development costs can be measured reliably • the project is technically and commercially feasible • the Group intends to and has sufficient resources to complete the project • the Group has the ability to use or sell the software • the software will generate probable future economic benefits.
Development costs not meeting these criteria for capitalisation are expensed as incurred. Directly attributable costs include employee costs incurred on software development along
with an appropriate portion of relevant overheads and borrowing costs.
Notes to the Consolidated Financial StatementsFor the years ended 31 December 2015 and 2014 (expressed in thousands of Euroland currency units, except per share amounts)
Illustrative Corporation Group: Example Consolidated Financial Statements 15

Subsequent measurementIAS 38.118(a) All finite-lived intangible assets, including capitalised internally developed software, are IAS 38.118(b) accounted for using the cost model whereby capitalised costs are amortised on a straight-line
basis over their estimated useful lives. Residual values and useful lives are reviewed at each reporting date. In addition, they are subject to impairment testing as described in Note 4.15. The following useful lives are applied:
• software: 3-5 years • brand names: 15-20 years • customer lists: 4-6 years.
Any capitalised internally developed software that is not yet complete is not amortised but is subject to impairment testing as described in Note 4.15.
IAS 38.118(d) Amortisation has been included within depreciation, amortisation and impairment of non-financial assets.
IAS 1.117(b) Subsequent expenditures on the maintenance of computer software and brand names are expensed as incurred.
When an intangible asset is disposed of, the gain or loss on disposal is determined as the difference between the proceeds and the carrying amount of the asset, and is recognised in profit or loss within other income or other expenses.
4.13 Property, plant and equipment LandIAS 16.73(a) Land held for use in production is stated at revalued amounts. Revalued amounts are fair IAS 1.117(a) values based on appraisals prepared by external professional valuers once every two years or IAS 1.117(b) more frequently if market factors indicate a material change in fair value (see Note 33.2). Any revaluation surplus is recognised in other comprehensive income and credited to the revaluation
reserve in equity. To the extent that any revaluation decrease or impairment loss (see Note 4.15) has previously been recognised in profit or loss, a revaluation increase is credited to profit or loss with the remaining part of the increase recognised in other comprehensive income. Downward revaluations of land are recognised upon appraisal or impairment testing, with the decrease being charged to other comprehensive income to the extent of any revaluation surplus in equity relating to this asset and any remaining decrease recognised in profit or loss. Any revaluation surplus remaining in equity on disposal of the asset is transferred to retained earnings.
IAS 16.73(c) As no finite useful life for land can be determined, related carrying amounts are not depreciated.
Buildings, IT equipment and other equipmentIAS 16.73(a) Buildings, IT equipment and other equipment (comprising fittings and furniture) are initially IAS 1.117(a) recognised at acquisition cost or manufacturing cost, including any costs directly attributable to
bringing the assets to the location and condition necessary for them to be capable of operating in the manner intended by the Group’s management. Buildings and IT equipment also include leasehold property held under a finance lease (see Note 4.14). Buildings, IT equipment and other equipment are subsequently measured at cost less accumulated depreciation and impairment losses.
Notes to the Consolidated Financial StatementsFor the years ended 31 December 2015 and 2014 (expressed in thousands of Euroland currency units, except per share amounts)
16 Illustrative Corporation Group: Example Consolidated Financial Statements

IAS 16.73(b) Depreciation is recognised on a straight-line basis to write down the cost less estimated IAS 16.73(c) residual value of buildings, IT equipment and other equipment. The following useful lives are
applied: • buildings: 25-50 years • IT equipment: 2-5 years • other equipment: 3-12 years.
In the case of leasehold property, expected useful lives are determined by reference to comparable owned assets or over the term of the lease, if shorter.
Material residual value estimates and estimates of useful life are updated as required, but at least annually.
Gains or losses arising on the disposal of property, plant and equipment are determined as the difference between the disposal proceeds and the carrying amount of the assets and are recognised in profit or loss within other income or other expenses.
4.14 Leased assets Finance leasesIAS 1.117(a) Management applies judgment in considering the substance of a lease agreement and whether it IAS 1.117(b) transfers substantially all the risks and rewards incidental to ownership of the leased asset. Key IAS 17.10 factors considered include the length of the lease term in relation to the economic life of the
asset, the present value of the minimum lease payments in relation to the asset’s fair value, and whether the Group obtains ownership of the asset at the end of the lease term.
IAS 17.15A For leases of land and buildings, the minimum lease payments are first allocated to each IAS 17.16 component based on the relative fair values of the respective lease interests. Each component is
then evaluated separately for possible treatment as a finance lease, taking into consideration the fact that land normally has an indefinite economic life.
See Note 4.13 for the depreciation methods and useful lives for assets held under finance leases. The interest element of lease payments is charged to profit or loss, as finance costs over the
period of the lease. Operating leases All other leases are treated as operating leases. Where the Group is a lessee, payments on
operating lease agreements are recognised as an expense on a straight-line basis over the lease term. Associated costs, such as maintenance and insurance, are expensed as incurred.
4.15 Impairment testing of goodwill, other intangible assets and property, plant and
equipmentIAS 1.117(b) For impairment assessment purposes, assets are grouped at the lowest levels for which there
are largely independent cash inflows (cash-generating units). As a result, some assets are tested individually for impairment and some are tested at cash-generating unit level. Goodwill is allocated to those cash-generating units that are expected to benefit from synergies of a related business combination and represent the lowest level within the Group at which management monitors goodwill.
Cash-generating units to which goodwill has been allocated (determined by the Group’s management as equivalent to its operating segments) are tested for impairment at least annually. All other individual assets or cash-generating units are tested for impairment whenever events or changes in circumstances indicate that the carrying amount may not be recoverable.
Notes to the Consolidated Financial StatementsFor the years ended 31 December 2015 and 2014 (expressed in thousands of Euroland currency units, except per share amounts)
Illustrative Corporation Group: Example Consolidated Financial Statements 17

IAS 1.122 An impairment loss is recognised for the amount by which the asset’s (or cash-generating IAS 1.117(a) unit’s) carrying amount exceeds its recoverable amount, which is the higher of fair value less
costs of disposal and value-in-use. To determine the value-in-use, management estimates expected future cash flows from each cash-generating unit and determines a suitable discount rate in order to calculate the present value of those cash flows. The data used for impairment testing procedures are directly linked to the Group’s latest approved budget, adjusted as necessary to exclude the effects of future reorganisations and asset enhancements. Discount factors are determined individually for each cash-generating unit and reflect current market assessments of the time value of money and asset-specific risk factors.
Impairment losses for cash-generating units reduce first the carrying amount of any goodwill allocated to that cash-generating unit. Any remaining impairment loss is charged pro rata to the other assets in the cash-generating unit. With the exception of goodwill, all assets are subsequently reassessed for indications that an impairment loss previously recognised may no longer exist. An impairment loss is reversed if the asset’s or cash-generating unit’s recoverable amount exceeds its carrying amount.
4.16 Investment property IAS 40.75(a) Investment properties are properties held to earn rentals or for capital appreciation, or both, and
are accounted for using the fair value model.IAS 40.75(e) Investment properties are revalued annually with resulting gains and losses recognised in
profit or loss, and are included in the statement of financial position at their fair values. See Note 33.2.
4.17 Financial instruments Recognition, initial measurement and derecognitionIFRS 7.21 Financial assets and financial liabilities are recognised when the Group becomes a party to IAS 1.117(a) the contractual provisions of the financial instrument and are measured initially at fair value IAS 1.117(b) adjusted for transaction costs, except for those carried at fair value through profit or loss which
are measured initially at fair value. Subsequent measurement of financial assets and financial liabilities is described below.
IAS 1.117(b) Financial assets are derecognised when the contractual rights to the cash flows from the financial asset expire, or when the financial asset and substantially all the risks and rewards are transferred. A financial liability is derecognised when it is extinguished, discharged, cancelled or expires.
IAS 1.117(a) Classification and subsequent measurement of financial assets For the purpose of subsequent measurement financial assets, other than those designated
and effective as hedging instruments, are classified into the following categories upon initial recognition:
• loans and receivables • financial assets at fair value through profit or loss (FVTPL) • held-to-maturity (HTM) investments • available-for-sale (AFS) financial assets.
IFRS 7.B5(f) All financial assets except for those at FVTPL are reviewed for impairment at least at each reporting date to identify whether there is any objective evidence that a financial asset or a group of financial assets is impaired. Different criteria to determine impairment are applied for each category of financial assets, which are described below.
All income and expenses relating to financial assets that are recognised in profit or loss are presented within finance costs, finance income or other financial items, except for impairment of trade receivables which is presented within other expenses.
Notes to the Consolidated Financial StatementsFor the years ended 31 December 2015 and 2014 (expressed in thousands of Euroland currency units, except per share amounts)
18 Illustrative Corporation Group: Example Consolidated Financial Statements

IAS 1.117(a) Loans and receivablesIAS 1.117(b) Loans and receivables are non-derivative financial assets with fixed or determinable payments
that are not quoted in an active market. After initial recognition, these are measured at amortised cost using the effective interest method, less provision for impairment. Discounting is omitted where the effect of discounting is immaterial. The Group’s cash and cash equivalents, trade and most other receivables fall into this category of financial instruments.
IFRS 7.B5(f) Individually significant receivables are considered for impairment when they are past due or when other objective evidence is received that a specific counterparty will default. Receivables that are not considered to be individually impaired are reviewed for impairment in groups, which are determined by reference to the industry and region of the counterparty and other shared credit risk characteristics. The impairment loss estimate is then based on recent historical counterparty default rates for each identified group.
IAS 1.117(a) Financial assets at FVTPLIAS 1.117(b) Financial assets at FVTPL include financial assets that are either classified as held for trading IFRS 7.B5(a) or that meet certain conditions and are designated at FVTPL upon initial recognition. All
derivative financial instruments fall into this category, except for those designated and effective as hedging instruments, for which the hedge accounting requirements apply (see below).
IFRS 7.B5(e) Assets in this category are measured at fair value with gains or losses recognised in profit or loss. The fair values of financial assets in this category are determined by reference to active market transactions or using a valuation technique where no active market exists.
IAS 1.117(a) HTM investmentsIAS 1.117(b) HTM investments are non-derivative financial assets with fixed or determinable payments and
fixed maturity other than loans and receivables. Investments are classified as HTM if the Group has the intention and ability to hold them until maturity. The Group currently holds listed bonds designated into this category.
IFRS 7.B5(f) HTM investments are measured subsequently at amortised cost using the effective interest method. If there is objective evidence that the investment is impaired, determined by reference to external credit ratings, the financial asset is measured at the present value of estimated future cash flows. Any changes in the carrying amount of the investment, including impairment losses, are recognised in profit or loss.
IAS 1.117(a) AFS financial assetsIAS 1.117(b) AFS financial assets are non-derivative financial assets that are either designated to this category IFRS 7.B5(b) or do not qualify for inclusion in any of the other categories of financial assets. The Group’s
AFS financial assets include listed securities and debentures, and the equity investment in XY Ltd.
The equity investment in XY Ltd is measured at cost less any impairment charges, as its fair value cannot currently be estimated reliably. Impairment charges are recognised in profit or loss.
IAS 1.117(a) All other AFS financial assets are measured at fair value. Gains and losses are recognised IAS 1.117(b) in other comprehensive income and reported within the AFS reserve within equity, except for
interest and dividend income, impairment losses and foreign exchange differences on monetary assets, which are recognised in profit or loss. When the asset is disposed of or is determined to be impaired, the cumulative gain or loss recognised in other comprehensive income is reclassified from the equity reserve to profit or loss. Interest calculated using the effective interest method and dividends are recognised in profit or loss within finance income (see Note 4.7).
Reversals of impairment losses for AFS debt securities are recognised in profit or loss if the reversal can be objectively related to an event occurring after the impairment loss was recognised. For AFS equity investments impairment reversals are not recognised in profit loss and any subsequent increase in fair value is recognised in other comprehensive income.
Notes to the Consolidated Financial StatementsFor the years ended 31 December 2015 and 2014 (expressed in thousands of Euroland currency units, except per share amounts)
Illustrative Corporation Group: Example Consolidated Financial Statements 19

IAS 1.117(b) Classification and subsequent measurement of financial liabilities The Group’s financial liabilities include borrowings, trade and other payables and derivative
financial instruments.IAS 1.117(a) Financial liabilities are measured subsequently at amortised cost using the effective interest
method except for derivatives and financial liabilities designated at FVTPL, which are carried subsequently at fair value with gains or losses recognised in profit or loss (other than derivative financial instruments that are designated and effective as hedging instruments).
IAS 1.117(a) The Group has designated some financial liabilities at FVTPL to reduce significant IFRS 7.B5(a) measurement inconsistencies between investment properties in the United States and related
US-dollar bank loans with fixed interest rates. These investment properties are measured using the fair value model (see Note 4.16), with changes in the fair value recognised in profit or loss. The fair value of loans used to finance these assets correlates significantly with the valuation of the investment properties held by the Group, because both measures are highly reactive to the market interest rate for 30-year government bonds. The loans are managed and evaluated on a fair value basis through a quarterly management review in comparison with the investment property valuations. Therefore, the Group designates such fixed interest rate loans as at FVTPL if they are secured by specific investment property assets that are held by the Group. This accounting policy reduces significantly what would otherwise be an accounting mismatch.
IAS 1.117(b) All interest-related charges and, if applicable, changes in an instrument’s fair value that are reported in profit or loss are included within finance costs or finance income.
Derivative financial instruments and hedge accountingIAS 1.117(b) Derivative financial instruments are accounted for at FVTPL except for derivatives designated
as hedging instruments in cash flow hedge relationships, which require a specific accounting treatment. To qualify for hedge accounting, the hedging relationship must meet several strict conditions with respect to documentation, probability of occurrence of the hedged transaction and hedge effectiveness.
IFRS 7.22(a) For the reporting periods under review, the Group has designated certain forward currency IFRS 7.22(c) contracts as hedging instruments in cash flow hedge relationships. These arrangements have been
entered into to mitigate currency exchange risk arising from certain legally binding sales and purchase orders denominated in foreign currency.
IAS 1.117(a) All derivative financial instruments used for hedge accounting are recognised initially at fair value and reported subsequently at fair value in the statement of financial position.
IAS 1.117(b) To the extent that the hedge is effective, changes in the fair value of derivatives designated as hedging instruments in cash flow hedges are recognised in other comprehensive income and included within the cash flow hedge reserve in equity. Any ineffectiveness in the hedge relationship is recognised immediately in profit or loss.
At the time the hedged item affects profit or loss, any gain or loss previously recognised in other comprehensive income is reclassified from equity to profit or loss and presented as a reclassification adjustment within other comprehensive income. However, if a non-financial asset or liability is recognised as a result of the hedged transaction, the gains and losses previously recognised in other comprehensive income are included in the initial measurement of the hedged item.
If a forecast transaction is no longer expected to occur, any related gain or loss recognised in other comprehensive income is transferred immediately to profit or loss. If the hedging relationship ceases to meet the effectiveness conditions, hedge accounting is discontinued and the related gain or loss is held in the equity reserve until the forecast transaction occurs.
Notes to the Consolidated Financial StatementsFor the years ended 31 December 2015 and 2014 (expressed in thousands of Euroland currency units, except per share amounts)
20 Illustrative Corporation Group: Example Consolidated Financial Statements

4.18 InventoriesIAS 2.36(a) Inventories are stated at the lower of cost and net realisable value. Cost includes all expenses IAS 1.117(a) directly attributable to the manufacturing process as well as suitable portions of related
production overheads, based on normal operating capacity. Costs of ordinarily interchangeable items are assigned using the first in, first out cost formula. Net realisable value is the estimated selling price in the ordinary course of business less any applicable selling expenses.
4.19 Income taxesIAS 1.117(a) Tax expense recognised in profit or loss comprises the sum of deferred tax and current tax not IAS 1.117(b) recognised in other comprehensive income or directly in equity. Calculation of current tax is based on tax rates and tax laws that have been enacted or
substantively enacted by the end of the reporting period. Deferred income taxes are calculated using the liability method.
IAS 1.122 Deferred tax assets are recognised to the extent that it is probable that the underlying tax loss or deductible temporary difference will be utilised against future taxable income. This is assessed based on the Group’s forecast of future operating results, adjusted for significant non-taxable income and expenses and specific limits on the use of any unused tax loss or credit.
Deferred tax liabilities are generally recognised in full, although IAS 12 ‘Income Taxes’ specifies limited exemptions. As a result of these exemptions the Group does not recognise deferred tax on temporary differences relating to goodwill, or to its investments in subsidiaries.
4.20 Cash and cash equivalentsIAS 7.46 Cash and cash equivalents comprise cash on hand and demand deposits, together with other
short-term, highly liquid investments maturing within 90 days from the date of acquisition that are readily convertible into known amounts of cash and which are subject to an insignificant risk of changes in value.
4.21 Non-current assets and liabilities classified as held for sale and discontinued operationsIAS 1.117(a) Non-current assets classified as held for sale are presented separately and measured at the lower IAS 1.117(b) of their carrying amounts immediately prior to their classification as held for sale and their fair
value less costs to sell. However, some held for sale assets such as financial assets or deferred tax assets, continue to be measured in accordance with the Group’s relevant accounting policy for those assets. Once classified as held for sale, the assets are not subject to depreciation or amortisation.
Any profit or loss arising from the sale or remeasurement of discontinued operations is presented as part of a single line item, profit or loss from discontinued operations (see Note 4.10).
4.22 Equity, reserves and dividend paymentsIAS 1.79(b) Share capital represents the nominal (par) value of shares that have been issued. Share premium includes any premiums received on issue of share capital. Any transaction
costs associated with the issuing of shares are deducted from share premium, net of any related income tax benefits.
Other components of equity include the following: • revaluation reserve – comprises gains and losses from the revaluation of land (see Note 4.13) • remeasurement of net defined benefit liability – comprises the actuarial losses from changes
in demographic and financial assumptions and the return on plan assets (see Note 4.23) • translation reserve – comprises foreign currency translation differences arising from the
translation of financial statements of the Group’s foreign entities into CU (see Note 4.5) • reserves for AFS financial assets and cash flow hedges – comprises gains and losses relating
to these types of financial instruments (see Note 4.17).
Notes to the Consolidated Financial StatementsFor the years ended 31 December 2015 and 2014 (expressed in thousands of Euroland currency units, except per share amounts)
Illustrative Corporation Group: Example Consolidated Financial Statements 21
Retained earnings includes all current and prior period retained profits and share-based employee remuneration (see Note 4.24).
All transactions with owners of the parent are recorded separately within equity. Dividend distributions payable to equity shareholders are included in other liabilities when
the dividends have been approved in a general meeting prior to the reporting date.
4.23 Post-employment benefits and short-term employee benefits Post-employment benefit plansIAS 1.117(b) The Group provides post-employment benefits through various defined contribution and
defined benefit plans.
Defined contribution plans The Group pays fixed contributions into independent entities in relation to several state plans
and insurances for individual employees. The Group has no legal or constructive obligations to pay contributions in addition to its fixed contributions, which are recognised as an expense in the period that related employee services are received.
Defined benefit plansIAS 19.135(a) Under the Group’s defined benefit plans, the amount of pension benefit that an employee will
receive on retirement is defined by reference to the employee’s length of service and final salary. The legal obligation for any benefits remains with the Group, even if plan assets for funding the defined benefit plan have been set aside. Plan assets may include assets specifically designated to a long-term benefit fund as well as qualifying insurance policies.
IAS 19.135(b) The liability recognised in the statement of financial position for defined benefit plans is the present value of the defined benefit obligation (DBO) at the reporting date less the fair value of plan assets.
IAS 1.117(a) Management estimates the DBO annually with the assistance of independent actuaries. This is based on standard rates of inflation, salary growth rate and mortality. Discount factors are determined close to each year-end by reference to high quality corporate bonds that are denominated in the currency in which the benefits will be paid and that have terms to maturity approximating the terms of the related pension liability.
IAS 19.120 Service cost on the Group’s defined benefit plan is included in employee benefits expense. Employee contributions, all of which are independent of the number of years of service, are treated as a reduction of service cost. Net interest expense on the net defined benefit liability is included in finance costs. Gains and losses resulting from remeasurements of the net defined benefit liability are included in other comprehensive income.
Short-term employee benefits Short-term employee benefits, including holiday entitlement, are current liabilities included in
pension and other employee obligations, measured at the undiscounted amount that the Group expects to pay as a result of the unused entitlement.
Notes to the Consolidated Financial StatementsFor the years ended 31 December 2015 and 2014 (expressed in thousands of Euroland currency units, except per share amounts)
22 Illustrative Corporation Group: Example Consolidated Financial Statements
4.24 Share-based employee remunerationIAS 1.117(b) The Group operates equity-settled share-based remuneration plans for its employees. None of the
Group’s plans are cash-settled.IAS 1.117(a) All goods and services received in exchange for the grant of any share-based payment are
measured at their fair values. Where employees are rewarded using share-based payments, the fair value of employees’
services is determined indirectly by reference to the fair value of the equity instruments granted. This fair value is appraised at the grant date and excludes the impact of non-market vesting conditions (for example profitability and sales growth targets and performance conditions).
All share-based remuneration is ultimately recognised as an expense in profit or loss with a corresponding credit to retained earnings6. If vesting periods or other vesting conditions apply, the expense is allocated over the vesting period, based on the best available estimate of the number of share options expected to vest.
Non-market vesting conditions are included in assumptions about the number of options that are expected to become exercisable. Estimates are subsequently revised if there is any indication that the number of share options expected to vest differs from previous estimates. Any adjustment to cumulative share-based compensation resulting from a revision is recognised in the current period. The number of vested options ultimately exercised by holders does not impact the expense recorded in any period.
Upon exercise of share options, the proceeds received, net of any directly attributable transaction costs, are allocated to share capital up to the nominal (or par) value of the shares issued with any excess being recorded as share premium.
4.25 Provisions, contingent assets and contingent liabilitiesIAS 1.117(b) Provisions for product warranties, legal disputes, onerous contracts or other claims are recognised
when the Group has a present legal or constructive obligation as a result of a past event, it is probable that an outflow of economic resources will be required from the Group and amounts can be estimated reliably. Timing or amount of the outflow may still be uncertain.
Restructuring provisions are recognised only if a detailed formal plan for the restructuring exists and management has either communicated the plan’s main features to those affected or started implementation. Provisions are not recognised for future operating losses.
IAS 1.117(a) Provisions are measured at the estimated expenditure required to settle the present obligation, based on the most reliable evidence available at the reporting date, including the risks and uncertainties associated with the present obligation. Where there are a number of similar obligations, the likelihood that an outflow will be required in settlement is determined by considering the class of obligations as a whole. Provisions are discounted to their present values, where the time value of money is material.
Any reimbursement that the Group is virtually certain to collect from a third party with respect to the obligation is recognised as a separate asset. However, this asset may not exceed the amount of the related provision.
IAS 1.117(a) No liability is recognised if an outflow of economic resources as a result of present obligations is not probable. Such situations are disclosed as contingent liabilities unless the outflow of resources is remote.
6 IFRS 2 ‘Share-based Payment’ does not stipulate where in equity the credit entry in an equity-settled share-based payment transaction should be recognised. It is acceptable for the credit to be taken to retained earnings, however, this is subject to national law. Alternatively, it could be taken to a separate equity reserve. The accounting upon exercise of the share options may also depend on applicable national law relating to share capital.
Notes to the Consolidated Financial StatementsFor the years ended 31 December 2015 and 2014 (expressed in thousands of Euroland currency units, except per share amounts)
Illustrative Corporation Group: Example Consolidated Financial Statements 23

4.26 Significant management judgement in applying accounting policies and estimation uncertainty
When preparing the financial statements, management makes a number of judgements, estimates and assumptions about the recognition and measurement of assets, liabilities, income and expenses.
IAS 1.122 Significant management judgement The following are significant management judgements in applying the accounting policies of the
Group that have the most significant effect on the financial statements.
Recognition of service and construction contract revenues Determining when to recognise revenues from after-sales services requires an understanding of
both the nature and timing of the services provided and the customers’ pattern of consumption of those services, based on historical experience and knowledge of the market. Recognising construction contract revenue also requires significant judgment in determining actual work performed and the estimated costs to complete the work (see Note 4.7).
Capitalisation of internally developed software Distinguishing the research and development phases of a new customised software project and
determining whether the recognition requirements for the capitalisation of development costs are met requires judgement. After capitalisation, management monitors whether the recognition requirements continue to be met and whether there are any indicators that capitalised costs may be impaired (see Note 4.12).
Recognition of deferred tax assets The extent to which deferred tax assets can be recognised is based on an assessment of the
probability that future taxable income will be available against which the deductible temporary differences and tax loss carry-forwards can be utilised. In addition, significant judgement is required in assessing the impact of any legal or economic limits or uncertainties in various tax jurisdictions (see Note 4.19).
Control assessment See Note 6.1.
IAS 1.125 Estimation uncertainty Information about estimates and assumptions that have the most significant effect on recognition
and measurement of assets, liabilities, income and expenses is provided below. Actual results may be substantially different.
Impairment of non-financial assets and goodwill In assessing impairment, management estimates the recoverable amount of each asset or cash-
generating units based on expected future cash flows and uses an interest rate to discount them. Estimation uncertainty relates to assumptions about future operating results and the determination of a suitable discount rate (see Note 4.15). In 2015, the Group recognised an impairment loss on goodwill (see Note 9) and internally generated software (see Note 10).
Notes to the Consolidated Financial StatementsFor the years ended 31 December 2015 and 2014 (expressed in thousands of Euroland currency units, except per share amounts)
24 Illustrative Corporation Group: Example Consolidated Financial Statements

Notes to the Consolidated Financial StatementsFor the years ended 31 December 2015 and 2014 (expressed in thousands of Euroland currency units, except per share amounts)
Illustrative Corporation Group: Example Consolidated Financial Statements 25
Useful lives of depreciable assets Management reviews its estimate of the useful lives of depreciable assets at each reporting date,
based on the expected utility of the assets. Uncertainties in these estimates relate to technological obsolescence that may change the utility of certain software and IT equipment.
Inventories Management estimates the net realisable values of inventories, taking into account the most reliable
evidence available at each reporting date. The future realisation of these inventories may be affected by future technology or other market-driven changes that may reduce future selling prices.
Business combinations Management uses valuation techniques when determining the fair values of certain assets and
liabilities acquired in a business combination (see Note 4.3). In particular, the fair value of contingent consideration is dependent on the outcome of many variables including the acquirees’ future profitability (see Note 5.1).
Construction contract revenue Recognised amounts of construction contract revenues and related receivables reflect management’s
best estimate of each contract’s outcome and stage of completion. For more complex contracts in particular, costs to complete and contract profitability are subject to significant estimation uncertainty (see Note 4.7).
Defined benefit obligation (DBO) Management’s estimate of the DBO is based on a number of critical underlying assumptions such
as standard rates of inflation, mortality, discount rate and anticipation of future salary increases. Variation in these assumptions may significantly impact the DBO amount and the annual defined benefit expenses (as analysed in Note 21.3).
Fair value measurement Management uses valuation techniques to determine the fair value of financial instruments (where
active market quotes are not available) and non-financial assets. This involves developing estimates and assumptions consistent with how market participants would price the instrument. Management bases its assumptions on observable data as far as possible but this is not always available. In that case management uses the best information available. Estimated fair values may vary from the actual prices that would be achieved in an arm’s length transaction at the reporting date (see Note 33).

Notes to the Consolidated Financial StatementsFor the years ended 31 December 2015 and 2014 (expressed in thousands of Euroland currency units, except per share amounts)
26 Illustrative Corporation Group: Example Consolidated Financial Statements
5. Acquisitions and disposals
5.1 Acquisition of Goodtech GmbH in 2015IFRS 3.B64 (a-d) On 31 March 2015, the Group acquired 100% of the equity instruments of Goodtech GmbH
(Goodtech), a Hamburg (Euroland) based business, thereby obtaining control. The acquisition was made to enhance the Group’s position in the on-line retail market for computer and telecommunications hardware in Euroland. Goodtech is a significant business in Euroland in the Group’s targeted market.
The details of the business combination are as follows:
IFRS 3.B64(f) Fair value of consideration transferred IFRS 3.B64(f)(i) Amount settled in cash 16,058
IFRS 3.B64(f)(iii) Fair value of contingent consideration 600
IAS 7.40(a) Total 16,658
IFRS 3.B64(i) Recognised amounts of identifiable net assets IAS 7.40(d) Property, plant and equipment 4,622
Intangible assets 5,255
Investment property 75
Total non-current assets 9,952
Inventories 8,995
Trade and other receivables 7,792
IAS 7.40(c) Cash and cash equivalents 567
Total current assets 17,354
Borrowings (3,478)
Deferred tax liabilities (632)
Total non-current liabilities (4,110)
Provisions (1,320)
Other liabilities (2,312)
Trade and other payables (5,344)
Total current liabilities (8,976)
Identifiable net assets 14,220
Goodwill on acquisition 2,438
IAS 7.40(b) Consideration transferred settled in cash 16,058
IAS 7.40(c) Cash and cash equivalents acquired (567)
IAS 7.42 Net cash outflow on acquisition 15,491
Acquisition costs charged to expenses 223

Consideration transferredIFRS 3.B64(f)(i) The acquisition of Goodtech was settled in cash amounting to CU 16,058. IFRS 3.B64(g)(i-iii) The purchase agreement included an additional consideration of CU 1,310, payable only
if the average profits of Goodtech for 2015 and 2016 exceed a target level agreed by both parties. The additional consideration will be paid on 1 April 2017. The CU 600 fair value of the contingent consideration liability initially recognised represents the present value of the Group’s probability-weighted estimate of the cash outflow. It reflects management’s estimate of a 50% probability that the targets will be achieved and is discounted using an interest rate of 4.4%7. As
IFRS 3.B67 at 31 December 2015, there have been no changes in the estimate of the probable cash outflow (b)(i-iii) but the liability has increased to CU 620 due to the unwinding of the discount. Acquisition-related costs amounting to CU 223 are not included as part of consideration
transferred and have been recognised as an expense in the consolidated statement of profit or loss, as part of other expenses.
Identifiable net assetsIFRS 3.B64 The fair value of the trade and other receivables acquired as part of the business combination (h)(i-iii) amounted to CU 7,792, with a gross contractual amount of CU 7,867. As of the acquisition date,
the Group’s best estimate of the contractual cash flow not expected to be collected amounted to CU 75.
GoodwillIFRS 3.64(e) Goodwill of CU 2,438 is primarily related to growth expectations, expected future profitability, IAS 36.133 the substantial skill and expertise of Goodtech’s workforce and expected cost synergies. IFRS 3.B64(k) Goodwill has been allocated to the retail segment and is not expected to be deductible for tax
purposes.
Goodtech’s contribution to the Group resultsIFRS 3.B64 Goodtech incurred a loss of CU 20 for the 9 months from 31 March 2015 to the reporting date, (q)(i-ii) primarily due to integration costs. Revenue for the 9 months to 31 December 2015 was
CU 24,800. If Goodtech had been acquired on 1 January 2015, revenue of the Group for 2015 would
have been CU 212,000, and profit for the year would have increased by CU 350.
5.2 Acquisition of Good Buy Inc. in 2014IFRS 3.B64 On 30 June 2014, the Group acquired 100% of the equity instruments of Good Buy Inc. (a-d) (Good Buy), a Delaware (USA) based business, thereby obtaining control. The acquisition of
Good Buy was made to enhance the Group’s position as an on-line retailer for computer and telecommunications hardware in the US market.
7 The determination of the acquisition-date fair value of the contingent consideration should consider the expected outcome of the contingency. This example illustrates one possible approach in estimating the fair value of contingent consideration.
Notes to the Consolidated Financial StatementsFor the years ended 31 December 2015 and 2014 (expressed in thousands of Euroland currency units, except per share amounts)
Illustrative Corporation Group: Example Consolidated Financial Statements 27

Notes to the Consolidated Financial StatementsFor the years ended 31 December 2015 and 2014 (expressed in thousands of Euroland currency units, except per share amounts)
28 Illustrative Corporation Group: Example Consolidated Financial Statements
The details of the business combination are as follows:
IFRS 3.B64(f) Fair value of consideration transferred IFRS 3.B64(f)(i) Amount settled in cash 12,420 IAS 7.40(a)
IFRS 3.B64(i) Recognised amounts of identifiable net assets IAS 7.40(d) Property, plant and equipment 3,148
Intangible assets 3,005
Total non-current assets 6,153
Inventories 5,469
Trade and other receivables 5,200
IAS 7.40(c) Cash and cash equivalents 345
Total current assets 11,014
Deferred tax liabilities (435)
Non-current liabilities (435)
Provisions (1,234)
Other liabilities (657)
Trade and other payables (4,990)
Total current liabilities (6,881)
Identifiable net assets 9,851
Goodwill on acquisition 2,569
IAS 7.40(b) Consideration transferred settled in cash 12,420
IAS 7.40(c) Cash and cash equivalents acquired (345)
IAS 7.42 Net cash outflow on acquisition 12,075
Acquisition costs charged to expenses 76
Consideration transferredIFRS 3.B64(f)(i) The acquisition of Good Buy was settled in cash amounting to CU 12,420.IFRS 3.B64(m) Acquisition-related costs amounting to CU 76 are not included as part of consideration
transferred and have been recognised as an expense in the consolidated statement of profit or loss, as part of other expenses.
Identifiable net assetsIFRS 3.B64 The fair value of the trade and other receivables acquired as part of the business combination (h)(i-iii) amounted to CU 5,200, with a gross contractual amount of CU 5,350. As of the acquisition date,
the Group’s best estimate of the contractual cash flow not expected to be collected amounted to CU 150.
GoodwillIFRS 3.B64(e) Goodwill of CU 2,569 is primarily related to the sales force and the sales know-how of key IAS 36.133 personnel of Good Buy. Goodwill has been allocated to the retail segment and is not expected IFRS 3.B64(k) to be deductible for tax purposes.

Good Buy’s contribution to the Group resultsIFRS 3.B64(q)(i-ii) Good Buy contributed CU 9,540 of revenue and CU 400 to the consolidated profit for the
6 months from 1 July 2014 to 31 December 2014. If Good Buy had been acquired on 1 January 2014, revenue of the Group for 2014 would have been CU 196,000. However, due to lack of IFRS-specific data prior to the acquisition of Good Buy, pro-forma profit or loss of the combined entity for the complete 2014 reporting period cannot be determined reliably.
5.3 Disposal of Highstreet Ltd in 2015 See Note 6.3 below.
6. Interests in subsidiaries
6.1 Composition of the GroupIFRS 12.10(a)(i) Set out below details of the subsidiaries held directly by the Group:IFRS 12.12
Name of the Country of Principal activity Proportion of ownership Subsidiary incorporation interests held by the Group and principal at year end place of business 2015 2014 Goodtech GmbH Euroland On-line retailer of computer and 100% –
telecommunications hardware
Good Buy Inc. USA On-line retailer of computer and 100% 100%
telecommunications hardware
Tech Squad Ltd Euroland Design and sale of phone and 80% 80%
intranet applications
Data Corp UK On-line sales of hardware and 100% 100%
software products
Highstreet Ltd UK Design and sale of phone and – 100%
intranet applications
Significant judgements and assumptionsIFRS 12.9 The Group holds 45% of the ordinary shares and voting rights in Equipe Consultants S.A.
(Equipe). Two other investors each hold 15%. The remaining 25% is held by several other unrelated investors, none of whom own more than 2% individually. There are no arrangements for the other shareholders to consult one another or act collectively and past experience indicates that few of the other owners actually exercise their voting rights at all. The Group has appointed four of Equipe’s Board of Directors out of a total of eleven.
IFRS 10.B41 Management has reassessed its involvement in Equipe in accordance with IFRS 10’s revised -B46 control definition and guidance. It has concluded that it has significant influence but not outright
control. In making its judgement, management considered the Group’s voting rights, the relative size and dispersion of the voting rights held by other shareholders and the extent of recent participation by those shareholders in general meetings. Recent experience demonstrates that sufficient of the smaller shareholders participate such that they, along with the two other main shareholders, prevent the Group from having the practical ability to direct the relevant activities of Equipe unilaterally.
Notes to the Consolidated Financial StatementsFor the years ended 31 December 2015 and 2014 (expressed in thousands of Euroland currency units, except per share amounts)
Illustrative Corporation Group: Example Consolidated Financial Statements 29

Notes to the Consolidated Financial StatementsFor the years ended 31 December 2015 and 2014 (expressed in thousands of Euroland currency units, except per share amounts)
30 Illustrative Corporation Group: Example Consolidated Financial Statements
6.2 Subsidiary with material non-controlling interests The Group includes one subsidiary, Tech Squad Ltd, with material non-controlling interests
(NCI)8:
Name Proportion of ownership Total comprehensive Accumulated NCI interests and voting rights income allocated to NCI held by the NCI 2015 2014 2015 2014 2015 2014 Tech Squad Ltd 20% 20% 121 116 713 592
IFRS 12.B10(a) No dividends were paid to the NCI during the years 2015 and 2014. IFRS 12.12(g) Summarised financial information for Tech Squad Ltd, before intragroup eliminations, is set IFRS 12.B10(b) out below9:
2015 2014 Non-current assets 5,019 5,182
Current assets 3,924 3,452
Total assets 8,943 8,634
Non-current liabilities (3,806) (3,402)
Current liabilities (1,561) (2,268)
Total liabilities (5,367) (5,670)
Equity attributable to owners of the parent 2,863 2,372
Non-controlling interests 713 592
2015 2014 Revenue 7,658 7,116
Profit for the year attributable to owners of the parent 479 464
Profit for the year attributable to NCI 121 116
Profit for the year 600 580
Other comprehensive income for the year (all attributable to owners of the parent) 6 4
Total comprehensive income for the year attributable to owners of the parent 485 468
Total comprehensive income for the year attributable to NCI 121 116
Total comprehensive income for the year 606 584
2015 2014 Net cash from operating activities 957 779
Net cash used in investing activities (531) (673)
Net cash from (used in) financing activities 446 (61)
Net cash inflow 872 45
8 For the purpose of the Example Financial Statements it is assumed that the NCI are material to the Group. 9 The summarised financial information disclosed should be sufficient to enable users to understand the interests that NCI have in the Group’s
activities and cash flows. This might include but is not limited to the disclosures provided here (IFRS 12.B10(b)).

6.3 Losing control over a subsidiary during the reporting period On 30 September 2015, the Group disposed of its 100% equity interest in its subsidiary,
Highstreet Ltd (Highstreet). The subsidiary was classified as held for sale in the 2014 financial statements (see Note 19).
IAS 7.40(b) The consideration was received in 2015. At the date of disposal, the carrying amounts of IAS 7.40(d) Highstreet’s net assets were as follows:
Property, plant and equipment 2,475
Total non-current assets 2,475
Inventories 1,121
IAS 7.40(c) Cash and cash equivalents –
Total current assets 1,121
Provisions (232)
Borrowings (8)
Trade and other payables (210)
Total current liabilities (450)
Total net assets 3,146
IAS 7.40(a) Total consideration received in cash 3,117
Cash and cash equivalents disposed of –
IAS 7.42 Net cash received 3,117
IFRS 10.25 Loss on disposal (29)
IFRS 12.19(b) The loss on disposal is included in the loss for the year from discontinued operations in the consolidated statement of profit or loss (see Note 19).
6.4 Interests in unconsolidated structured entities IFRS 12.24 The Group has no interests in unconsolidated structured entities.
7. Investments accounted for using the equity method
The carrying amount of investments accounted for using the equity method is as follows:
2015 2014 Investment in joint venture 7.1 483 222
Investments in associates 7.2 377 245
Total investments accounted for using the equity method 860 467
The group’s share of profit from equity accounted investments is as follows:
2015 2014 Investment in joint venture 7.1 261 129
Investments in associates 7.2 130 12
Total share of profit from equity accounted investments 391 141
Notes to the Consolidated Financial StatementsFor the years ended 31 December 2015 and 2014 (expressed in thousands of Euroland currency units, except per share amounts)
Illustrative Corporation Group: Example Consolidated Financial Statements 31

Notes to the Consolidated Financial StatementsFor the years ended 31 December 2015 and 2014 (expressed in thousands of Euroland currency units, except per share amounts)
32 Illustrative Corporation Group: Example Consolidated Financial Statements
7.1 Investment in joint ventureIFRS 12.21(a) The Group has one material joint venture, Halftime Ltd (Halftime):
Name of the Country of Principal activity Proportion of ownership joint venture incorporation interests held by the Group and principal at year end place of business 2015 2014 Halftime Ltd UK On-line sales of hardware and 50% 50%
software products
IFRS 12.21(b)(i) The investment in Halftime is accounted for using the equity method in accordance with IAS 28. IFRS 12.21(b)(ii) Summarised financial information for Halftime is set out below:IFRS 12.B12-B13
2015 2014IFRS 12.B12(b)(ii) Non-current assets 838 500
IFRS 12.B12(b)(i) Current assets (a) 528 380
Total assets 1,366 880
IFRS 12.B12(b)(iv) Non-current liabilities (b) (240) (298)
IFRS 12.B12(b)(iii) Current liabilities (c) (160) (138)
Total liabilities (400) (436)
Net assets 966 444
IFRS 12.B13(a) a) Includes cash and cash equivalents 60 80
IFRS 12.B13(c) b) Includes financial liabilities (excluding trade and other payables and provisions) (100) –
IFRS 12.B13(b) c) Includes financial liabilities (excluding trade and other payables and provisions) (80) –
2015 2014
IFRS 12.B12(b)(v) Revenue 1,200 730
IFRS 12.B12(b)(vi)
IFRS 12.B12(b)(ix) Profit and total comprehensive income for the year 522 258
IFRS 12.B13(d) Depreciation and amortisation 30 20
IFRS 12.B13(g) Tax expense 68 58
IFRS 12.B14 A reconciliation of the above summarised financial information to the carrying amount of the investment in Halftime is set out below:
2015 2014 Total net assets of Halftime 966 444
Proportion of ownership interests held by the Group 50% 50%
Carrying amount of the investment in Halftime 483 222
IFRS 12.B12(a) No dividends were received from Halftime during the years 2015 and 2014.IFRS 12.21(b)(iii) Halftime is a private company, therefore no quoted market prices are available for its shares.

7.2 Investments in associatesIFRS 12.21(c) The Group has a 45% equity interest in Equipe and a 30% equity interest in Shopmore GmbH. IFRS 12.B16 Neither associate is individually material to the Group. Summarised aggregated financial information of the Group’s share in these associates: 2015 2014 Profit from continuing operations 130 12
Other comprehensive income 2 –
Total comprehensive income 132 12
Aggregate carrying amount of the Group’s interests in these associates 377 245
8. Segment reporting
IFRS 8.22(a) Management currently identifies the Group’s three service lines as its operating segments (see Note 4.6). These operating segments are monitored by the Group’s chief operating decision maker and strategic decisions are made on the basis of adjusted segment operating results.
IFRS 8.16 In addition, two minor operating segments are combined below under other segments. The main sources of revenue for this segment is the sale and disposal of used IT equipment that the Group collects from its customers.
Segment information for the reporting period is as follows10:
For the year endend 31 December 2015 Consulting Service Retail Other Total Revenue IFRS 8.23(a) From external customers 110,810 18,140 72,098 3,679 204,727
Discontinued operations – – 9,803 – 9,803
IFRS 8.23(b) From other segments 231 – – – 231
Segment revenues 111,041 18,140 81,901 3,679 214,761
Changes in inventories (4,794) – (3,129) – (7,923)
IFRS 8.23(f) Costs of material (17,368) (5,442) (22,040) (1,397) (46,247)
Employee benefits expense (54,224) (10,863) (46,359) (2,047) (113,493)
IFRS 8.23(e) Depreciation and amortisation of non-financial assets (3,378) (555) (2,205) (125) (6,263)
IAS 36.129(a) Impairment of non-financial assets (1,669) – – – (1,669)
Other expenses (9,456) (30) (1,333) (10) (10,829)
IFRS 8.23 Segment operating profit 20,152 1,250 6,835 100 28,337
IFRS 8.23 Segment assets 68,103 11,149 44,311 2,507 126,070
10 IFRS 8 requires the amount of each operating segment item to be disclosed using the measures reported to the chief operating decision maker (ie based on internal management information). The disclosures in the Example financial statements are therefore based on substantial assumptions (eg there is no measure of segment liabilities regularly reported to the chief operating decision maker), and so cannot be viewed as the only acceptable way of providing segment disclosures. It is therefore important to emphasise that segment reporting should be tailored on the basis of the entity’s internal management reporting.
Notes to the Consolidated Financial StatementsFor the years ended 31 December 2015 and 2014 (expressed in thousands of Euroland currency units, except per share amounts)
Illustrative Corporation Group: Example Consolidated Financial Statements 33

Notes to the Consolidated Financial StatementsFor the years ended 31 December 2015 and 2014 (expressed in thousands of Euroland currency units, except per share amounts)
34 Illustrative Corporation Group: Example Consolidated Financial Statements
For the year endend 31 December 2014 Consulting Service Retail Other Total Revenue IFRS 8.23(a) From external customers 109,302 17,832 59,310 3,756 190,200
Discontinued operations – – 11,015 – 11,015
IFRS 8.23(b) From other segments 110 – – – 110
Segment revenues 109,412 17,832 70,325 3,756 201,325 Changes in inventories (3,394) – (2,229) – (5,623)
IFRS 8.23(f) Costs of material (18,466) (5,350) (19,197) (1,319) (44,332)
Employee benefits expense (56,277) (10,498) (38,997) (2,108) (107,880)
IFRS 8.23(e) Depreciation and amortisation of non-financial assets (3,575) (587) (2,332) (132) (6,626)
IAS 36.129(a) Impairment of non-financial assets (190) – – – (190)
Other expenses (9,213) (100) (1,761) (20) (11,094)
IFRS 8.23 Segment operating profit 18,297 1,297 5,809 177 25,580
IFRS 8.23 Segment assets 51,615 8,450 33,583 1,900 95,548
As at 1 January 2014IFRS 8.23t Consulting Service Retail Other TotalIFRS 8.21 Segment assets 44,571 7,367 29,468 1,823 83,229
The Group’s revenues from external customers and its non-current assets (other than financial instruments, investments accounted for using the equity method, deferred tax assets and post-employment benefit assets) are divided into the following geographical areas:
31 Dec 2015 31 Dec 2014 1 Jan 2014IFRS 8.33(a) Revenue Non- Revenue Non- Non- current current current assets assets assets IFRS 8.33(b) Euroland (domicile) 164,102 46,053 152,452 40,242 35,711
United Kingdom 20,513 5,757 19,057 5,030 4,485
USA 18,461 5,181 17,151 4,527 4,079
Other countries 1,651 575 1,540 503 471
Total 204,727 57,566 190,200 50,302 44,746
IFRS 8.33(a) Revenues from external customers in the Group’s domicile, Euroland, as well as its major markets, the United Kingdom and the USA, have been identified on the basis of the customer’s geographical location. Non-current assets are allocated based on their physical location. The above table does not include discontinued operations (disposal groups), for which revenue and assets can be attributed to Euroland.
IFRS 8.34 During 2015, CU 24,744 or 12% (2014: CU 21,076 or 11%) of the Group’s revenues depended on a single customer in the consulting segment.
The totals presented for the Group’s operating segments reconcile to the key financial figures as presented in its financial statements as follows:

2015 2014 IFRS 8.28(a) Revenues Total reportable segment revenues 211,082 197,569
Other segment revenues 3,679 3,756
Rental income from investment property 1,066 1,028
Discontinued operations (9,803) (11,015)
Elimination of intersegment revenues (231) (110)
Group revenues 205,793 191,228
IFRS 8.28(b) Profit or loss Total reportable segment operating profit 28,237 25,403
Other segment profit 100 177
Rental income from investment property 1,066 1,028
Change in fair value of investment property 310 175
Share-based payment expenses (298) (466)
Post-employment benefit expenses (5,799) (6,373)
Research and development costs (1,690) (1,015)
Other income not allocated 427 483
Other expenses not allocated (668) (185)
Operating profit of discontinued operations (73) (106)
Elimination of intersegment profits (58) (27)
Group operating profit 21,554 19,094
Share of profits from equity accounted investments 391 141
Finance costs (1,490) (1,876)
Finance income 994 793
Other financial items 943 1,182
Group profit before tax 22,392 19,334
31 Dec 2015 31 Dec 2014 1 Jan 2014IFRS 8.28(c) Assets Total reportable segment assets 123,563 93,648 81,406
Other segment assets 2,507 1,900 1,823
Group headquarters 3,967 2,073 1,581
Investment property 12,662 12,277 12,102
Illustrative Research Lab 5,101 2,665 2,553
Other assets 3,281 2,264 1,912
Consolidation (1,134) (592) (950)
Group assets 149,947 114,235 100,427
IFRS 8.28 Unallocated operating income and expense mainly consist of research expenditure as well as post-employment benefits expenses. The Group’s corporate assets, consisting of its headquarters, investment properties and research facility, are not allocated to any segment’s assets.
IFRS 8.32 An analysis of the Group’s revenue for each major product and service category (excluding IAS 18.35(b) revenue from discontinued operations) is as follows:
Notes to the Consolidated Financial StatementsFor the years ended 31 December 2015 and 2014 (expressed in thousands of Euroland currency units, except per share amounts)
Illustrative Corporation Group: Example Consolidated Financial Statements 35

Notes to the Consolidated Financial StatementsFor the years ended 31 December 2015 and 2014 (expressed in thousands of Euroland currency units, except per share amounts)
36 Illustrative Corporation Group: Example Consolidated Financial Statements
2015 2014IFRS 8.32 Sale of hardware 47,585 39,145
Sale of software 24,513 20,165
Other 3,679 3,756
IAS 18.35(b)(i) Sale of goods 75,777 63,066
After-sales service and maintenance 18,140 17,832
Consulting 59,837 60,116
IAS 11.39(a) Construction contracts for telecommunication systems 50,973 49,186
IAS 40.75(f) Rental income 1,066 1,028
IAS 18.35(b)(ii) Rendering of services 130,016 128,162
Group revenue 205,793 191,228
9. Goodwill
IFRS 3.B67(d) The movements in the net carrying amount of goodwill are as follows:
2015 2014 Gross carrying amount IFRS 3.B67(d)(i) Balance 1 January 3,727 1,234
IFRS 3.B67(d)(ii) Acquired through business combination 2,438 2,569
IFRS 3.B67(d)(vi) Net exchange difference (135) (76)
IFRS 3.B67(d)(viii) Balance 31 December 6,030 3,727
Accumulated impairment IFRS 3.B67(d)(i) Balance 1 January (190) –
IFRS 3.B67(d)(v) Impairment loss recognised (799) (190)
IFRS 3.B67(d)(viii) Net exchange difference – –
IFRS 3.B67(d)(viii) Balance 31 December (989) (190)
Carrying amount at 31 December 5,041 3,537
Impairment testingIAS 36.134 For the purpose of annual impairment testing, goodwill is allocated to the operating segments
expected to benefit from the synergies of the business combinations in which the goodwill arises, as follows:
31 Dec 2015 31 Dec 2014 1 Jan 2014IAS 36.134 Retail 4,796 2,493 –
Consulting 245 1,044 1,234
5,041 3,537 1,234
IAS 36.134(c-d) The recoverable amount of each segment was determined based on value-in-use calculations, IAS 36.130(e) covering a detailed three-year forecast, followed by an extrapolation of expected cash flows
for the remaining useful lives using a declining growth rate determined by management. The recoverable amount of each operating segment is set out below:
2015 2014 Retail 41,835 30,679
Consulting 62,562 48,354
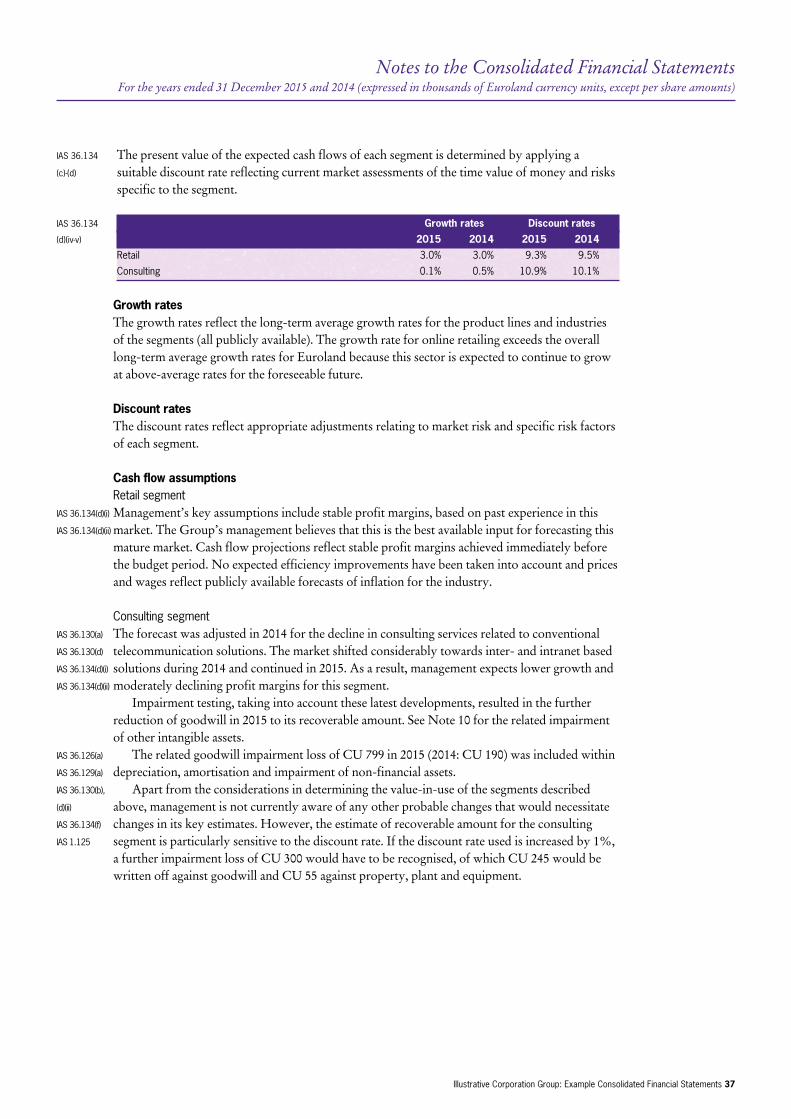
IAS 36.134 The present value of the expected cash flows of each segment is determined by applying a (c)-(d) suitable discount rate reflecting current market assessments of the time value of money and risks
specific to the segment.
IAS 36.134 Growth rates Discount rates (d)(iv-v) 2015 2014 2015 2014 Retail 3.0% 3.0% 9.3% 9.5%
Consulting 0.1% 0.5% 10.9% 10.1%
Growth rates The growth rates reflect the long-term average growth rates for the product lines and industries
of the segments (all publicly available). The growth rate for online retailing exceeds the overall long-term average growth rates for Euroland because this sector is expected to continue to grow at above-average rates for the foreseeable future.
Discount rates The discount rates reflect appropriate adjustments relating to market risk and specific risk factors
of each segment.
Cash flow assumptions Retail segmentIAS 36.134(d)(i) Management’s key assumptions include stable profit margins, based on past experience in this IAS 36.134(d)(ii) market. The Group’s management believes that this is the best available input for forecasting this
mature market. Cash flow projections reflect stable profit margins achieved immediately before the budget period. No expected efficiency improvements have been taken into account and prices and wages reflect publicly available forecasts of inflation for the industry.
Consulting segmentIAS 36.130(a) The forecast was adjusted in 2014 for the decline in consulting services related to conventional IAS 36.130(d) telecommunication solutions. The market shifted considerably towards inter- and intranet based IAS 36.134(d)(i) solutions during 2014 and continued in 2015. As a result, management expects lower growth and IAS 36.134(d)(ii) moderately declining profit margins for this segment. Impairment testing, taking into account these latest developments, resulted in the further
reduction of goodwill in 2015 to its recoverable amount. See Note 10 for the related impairment of other intangible assets.
IAS 36.126(a) The related goodwill impairment loss of CU 799 in 2015 (2014: CU 190) was included withinIAS 36.129(a) depreciation, amortisation and impairment of non-financial assets.IAS 36.130(b), Apart from the considerations in determining the value-in-use of the segments described (d)(ii) above, management is not currently aware of any other probable changes that would necessitate IAS 36.134(f) changes in its key estimates. However, the estimate of recoverable amount for the consulting IAS 1.125 segment is particularly sensitive to the discount rate. If the discount rate used is increased by 1%, a further impairment loss of CU 300 would have to be recognised, of which CU 245 would be written off against goodwill and CU 55 against property, plant and equipment.
Notes to the Consolidated Financial StatementsFor the years ended 31 December 2015 and 2014 (expressed in thousands of Euroland currency units, except per share amounts)
Illustrative Corporation Group: Example Consolidated Financial Statements 37

Notes to the Consolidated Financial StatementsFor the years ended 31 December 2015 and 2014 (expressed in thousands of Euroland currency units, except per share amounts)
38 Illustrative Corporation Group: Example Consolidated Financial Statements
10. Other intangible assets
Details of the Group’s other intangible assets and their carrying amounts are as follows:
Acquired Internally Brand Customer Total software developed names lists licences software IAS 38.118 Gross carrying amount IAS 38.118(c) Balance at 1 January 2015 13,608 14,794 760 374 29,536
IAS 38.118(e)(i) Addition, separately acquired 440 – – – 440
IAS 38.118(e)(i) Addition, internally developed – 3,306 – – 3,306
IAS 38.118(e)(i) Acquisition through business combination 3,653 – 215 1,387 5,255
IAS 38.118(e)(ii) Disposals (1,159) – – – (1,159)
IAS 38.118(e)(vii) Net exchange differences (73) (54) – – (127)
IAS 38.118(c) Balance at 31 December 2015 16,469 18,046 975 1,761 37,251
Amortisation and impairment IAS 38.118(c) Balance at 1 January 2015 (6,063) (9,381) (162) (89) (15,695)
IAS 38.118(e)(vi) Amortisation (1,978) (1,315) (125) (110) (3,528)
IAS 38.118(e)(iv) Impairment losses – (870) – – (870)
IAS 38.118(e)(ii) Disposals 350 – – – 350
IAS 38.118(e)(vii) Net exchange differences (48) (36) – – (84)
IAS 38.118(c) Balance at 31 December 2015 (7,739) (11,602) (287) (199) (19,827)
Carrying amount 31 December 2015 8,730 6,444 688 1,562 17,424
Acquired Internally Brand Customer Total software developed names lists licences software IAS 38.118 Gross carrying amount IAS 38.118(c) Balance at 1 January 2014 8,672 14,600 – – 23,272
IAS 38.118(e)(i) Addition, separately acquired 3,097 – – – 3,097
IAS 38.118(e)(i) Addition, internally developed – 216 – – 216
IAS 38.118(e)(i) Acquisition through business combination 1,859 – 768 378 3,005
IAS 38.118(e)(vii) Net exchange differences (20) (22) (8) (4) (54)
IAS 38.118(c) Balance at 31 December 2014 13,608 14,794 760 374 29,536
Amortisation and impairment IAS 38.118(c) Balance at 1 January 2014 (4,442) (8,166) – – (12,608)
IAS 38.118(e)(vi) Amortisation (1,607) (1,201) (156) (87) (3,051)
IAS 38.118(e)(vii) Net exchange differences (14) (14) (6) (2) (36)
IAS 38.118(c) Balance at 31 December 2014 (6,063) (9,381) (162) (89) (15,695)
Carrying amount 31 December 2014 7,545 5,413 598 285 13,841
IAS 38.126 Additions to internally developed software include capitalised borrowing costs of CU 80 (2014: CU 78). In addition, research and development costs of CU 1,690 (2014: CU 1,015) were recognised as other expenses.

IAS 36.130(b) An impairment loss of CU 870 (2014: Nil) was recognised for internally developed software IAS 36.130(c)(i) used to provide certain after-sales and maintenance services within the consulting segment IAS 36.130(c)(ii) (see Note 8). The recoverable amount of the asset is its value-in-use, determined based on IAS 36.130(a) management’s expectation that the market will shift considerably towards other alternative IAS 36.130(e) software products and will significantly reduce future revenues and profits in the next two to IAS 36.130(g) three years (see Note 9 for the growth and discount rates used). Should the shift in the market to other software products occur more rapidly, the carrying amount of the software of CU 100
(2014: CU 970) would be reduced to CU Nil.IAS 38.118(d) All amortisation and impairment charges are included within depreciation, amortisation and IAS 36.126(a) impairment of non-financial assets.IAS 38.122(e) During the year, the Group entered into an agreement to acquire enterprise resource planning
software, to support the planning and administration of the Group’s operations. Minimum contractual commitments resulting from this agreement are CU 97 payable during 2016. No other material contractual commitments at 31 December 2015 (2014: None).
11. Property, plant and equipment
Details of the Group’s property, plant and equipment and their carrying amounts are as follows:
Land Buildings IT Other Total equipment equipment Gross carrying amount IAS 16.73(d) Balance 1 January 2015 7,697 19,362 5,579 2,334 34,972
IAS 16.73(e)(i) Additions – 76 – – 76
IAS 16.73(e)(iii) Acquisition through business combination 730 1,221 2,306 365 4,622
IAS 16.73(e)(ii) Disposals – (401) – – (401)
IAS 16.73(e)(iv) Revaluation increase 303 – – – 303
IAS 16.73(e)(viii) Net exchange differences (21) (81) (79) (54) (235)
IAS 16.73(d) Balance 31 December 2015 8,709 20,177 7,806 2,645 39,337
Depreciation and impairment IAS 16.73(d) Balance 1 January 2015 – (12,159) (1,503) (913) (14,575)
IAS 16.73(e)(ii) Disposals – 315 – – 315
IAS 16.73(e)(viii) Net exchange differences – (54) (53) (36) (143)
IAS 16.73(e)(vii) Depreciation – (1,315) (890) (530) (2,735)
IAS 16.73(d) Balance 31 December 2015 – (13,213) (2,446) (1,479) (17,138)
Carrying amount 31 December 2015 8,709 6,964 5,360 1,166 22,199
Notes to the Consolidated Financial StatementsFor the years ended 31 December 2015 and 2014 (expressed in thousands of Euroland currency units, except per share amounts)
Illustrative Corporation Group: Example Consolidated Financial Statements 39

Notes to the Consolidated Financial StatementsFor the years ended 31 December 2015 and 2014 (expressed in thousands of Euroland currency units, except per share amounts)
40 Illustrative Corporation Group: Example Consolidated Financial Statements
Land Buildings IT Other Total equipment equipment Gross carrying amount IAS 16.73(d) Balance 1 January 2014 7,697 23,067 4,316 966 36,046
IAS 16.73(e)(i) Additions – 1,001 1,390 890 3,281
IAS 16.73(e)(iii) Acquisition through business combination – – 2,310 838 3,148
IAS 16.73(e)(ii) Held for sale or included in disposal group – (4,598) (2,422) (348) (7,368)
IAS 16.73(e)(viii) Net exchange differences – (108) (15) (12) (135)
IAS 16.73(d) Balance 31 December 2014 7,697 19,362 5,579 2,334 34,972
Depreciation and impairment IAS 16.73(d) Balance 1 January 2014 – (12,944) (1,805) (551) (15,300)
IAS 16.73(e)(viii) Net exchange differences – (72) (10) (8) (90)
IAS 16.73(e)(ii) Held for sale or included in disposal group – 3,200 990 200 4,390
IAS 16.73(e)(vii) Depreciation – (2,343) (678) (554) (3,575)
IAS 16.73(d) Balance 31 December 2014 – (12,159) (1,503) (913) (14,575)
Carrying amount 31 December 2014 7,697 7,203 4,076 1,421 20,397
IAS 36.126(a) All depreciation and impairment charges are included within depreciation, amortisation and IAS 36.126(b) impairment of non-financial assets. IAS 16.74(a) Land and buildings have been pledged as security for the Group’s other bank borrowings
(see Note 14.6).IAS 16.74(c) The Group has a contractual commitment to acquire IT equipment of CU 1,304 payable
in 2016. There were no other material contractual commitments to acquire property, plant and equipment at 31 December 2015 (2014: None).
IAS 16.77(e) If the cost model had been used, the carrying amounts of the revalued land, including the IAS 16.77(f) fair value adjustment upon acquisition of Goodtech, would be CU 7,421 (2014: CU 6,712). The
revalued amounts include a revaluation surplus of CU 1,288 before tax (2014: CU 985), which is not available for distribution to the shareholders of Illustrative Corporation.
IFRS 13.91(a) Fair value measurement of the landIFRS 13.93(d) See Note 33.2.
12. Leases
12.1 Finance leases as lesseeIAS 17.31(a) The Group’s main warehouse and related facilities and certain IT equipment are held under
finance lease arrangements. As of 31 December 2015, the net carrying amount of the warehouse and related facilities is CU 3,362 (2014: CU 3,723), included as part of buildings and of the IT equipment is CU 231 (2014: CU 480), included as part of IT equipment (see Note 11).
Finance lease liabilities (see Note 23) are secured by the related assets held under finance leases. Future minimum finance lease payments at 31 December were as follows:

Minimum lease payments due within 1 1 to 5 after 5 Total year years years 31 December 2015
IAS 17.31(b) Lease payments 727 1,415 3,539 5,681
Finance charges (215) (330) (564) (1,109)
Net present values 512 1,085 2,975 4,572
31 December 2014
IAS 17.31(b) Lease payments 726 1,432 4,072 6,230
Finance charges (220) (336) (709) (1,265)
Net present values 506 1,096 3,363 4,965
IAS 17.31(e) The lease agreement for the main warehouse includes fixed lease payments and a purchase option at the end of the 10 year lease term. The agreement is non-cancellable and does not contain any further restrictions.
12.2 Operating leases as lessee The Group leases an office and production building under an operating lease. The future
minimum lease payments are as follows:
Minimum lease payments due within 1 1 to 5 after 5 Total year years yearsIAS 17.35(a) 31 December 2015 4,211 12,567 25,678 42,456
31 December 2014 3,431 12,100 24,342 39,873
IAS 17.35(c) Lease expense during the period amounts to CU 3,568 (2014: CU 3,398), representing the minimum lease payments.
IAS 17.35(d) The rental contract has a non-cancellable term of 15 years. The building was subject to a sale and lease back transaction in 2005. A related gain was included in other liabilities (see Note 24) and is being amortised over the remaining lease term.
12.3 Operating leases as lessor The Group leases out investment properties under operating leases (see Note 13).
13. Investment property
Investment property includes real estate properties in Euroland and in the United States, which are owned to earn rentals and for capital appreciation.
IFRS 13.93(a) Note 33.2 sets out how the fair value of the investment properties has been determined. Changes to the carrying amounts are as follows:
Notes to the Consolidated Financial StatementsFor the years ended 31 December 2015 and 2014 (expressed in thousands of Euroland currency units, except per share amounts)
Illustrative Corporation Group: Example Consolidated Financial Statements 41

Notes to the Consolidated Financial StatementsFor the years ended 31 December 2015 and 2014 (expressed in thousands of Euroland currency units, except per share amounts)
42 Illustrative Corporation Group: Example Consolidated Financial Statements
2015 2014 IAS 40.76 Carrying amount 1 January 12,277 12,102
Additions:
IAS 40.76(b) Through business combination 75 –
Change in fair value:
IAS 40.76(d) Net gain 288 150
IAS 40.76(e) Net exchange differences 22 25
IAS 40.76(d) Total change in fair value 310 175
IAS 40.76 Carrying amount 31 December 12,662 12,277
IAS 40.75(g) Investment properties valued at CU 8,327 are pledged as security for related borrowings (2014: CU 8,113).
Most properties are leased out on operating leases. Rental income amounts to CU 1,066 (2014: CU 1,028) included within revenue. Direct operating expenses of CU 213 (2014: CU 206) were reported within other expenses, of which CU 18 (2014: CU 12) was incurred on vacant properties that did not generate rental income.
IAS 17.56(c) The lease contracts are all non-cancellable for 8 years from the commencement of the lease. Future minimum lease rentals are as follows:
Minimum lease income due within 1 1 to 5 after 5 Total year years yearsIAS 17.56(a) 31 December 2015 1,075 5,375 2,090 8,540
31 December 2014 1,030 5,150 1,978 8,158
14. Financial assets and liabilities
14.1 Categories of financial assets and financial liabilitiesIFRS 7.25 Note 4.17 provides a description of each category of financial assets and financial liabilities and
the related accounting policies. The carrying amounts of financial assets and financial liabilities in each category are as follows:
Note AFS Held for Derivatives HTM Loans and Total (FV) trading (FV) used (amortised receivables (FVTPL) for hedging cost) (amortised cost) 31 December 2015 Financial assets IFRS 7.8(b) Bonds 14.2 – – – 2,814 – 2,814
IFRS 7.8(d) Other investments (a) 14.3 951 – – – – 951
Other long-term financial assets 951 – – 2,814 – 3,765
IFRS 7.8(a)(ii) Other short-term financial assets 14.4 – 655 – – – 655
IFRS 7.8(a)(ii) Derivative financial instruments 14.5 – 115 467 – – 582
IFRS 7.8(c) Trade and other receivables (b) 17 – – – – 30,945 30,945
IFRS 7.8(c) Cash and cash equivalents 18 – – – – 34,729 34,729
951 770 467 2,814 65,674 70,676

Note Derivatives Designated Other Other Total (FV) used for at FVTPL liabilities liabilities hedging at FVTPL (amortised cost) 31 December 2015 Financial liabilities IFRS 7.8(e)(i) Non-current borrowings 14.6 – 7,700 – 13,300 21,000
IFRS 7.8(e)(i),
IFRS 7.8(f) Current borrowings 14.6 – 250 – 4,565 4,815
IFRS 7.8(f) Trade and other payables 23 – – – 13,069 13,069
IFRS 7.8(e)(ii) Contingent consideration 24 – – 620 – 620
– 7,950 620 30,934 39,504
Note AFS Held for Derivatives HTM Loans and Total (FV) trading (FV) used (amortised receivables (FVTPL) for hedging cost) (amortised cost) 31 December 2014 Financial assets IFRS 7.8(b) Bonds 14.2 – – – 2,992 – 2,992
IFRS 7.8(d) Other investments (a) 14.3 888 – – – – 888
Other long-term financial assets 888 – – 2,992 – 3,880
IFRS 7.8(a)(ii) Other short-term financial assets 14.4 – 649 – – – 649
IFRS 7.8(a)(ii) Derivative financial instruments 14.5 – 212 – – – 212
IFRS 7.8(c) Trade and other receivables (b) 17 – – – – 23,441 23,441
IFRS 7.8(c) Cash and cash equivalents 18 – – – – 11,197 11,197
888 861 – 2,992 34,638 39,379
Note Derivatives Designated Other Total (FV) used for at FVTPL liabilities hedging (amortised cost) 31 December 2014
Financial liabilities IFRS 7.8(e)(i) Non-current borrowings 14.6 – 7,965 13,300 21,265
IFRS 7.8(e)(i),
IFRS 7.8(f) Current borrowings 14.6 – 255 3,124 3,379
IFRS 7.8(f) Trade and other payables 23 – – 11,515 11,515
IFRS 7.7 Derivative financial instruments 14.5 160 – – 160
160 8,220 27,939 36,319
Notes to the Consolidated Financial StatementsFor the years ended 31 December 2015 and 2014 (expressed in thousands of Euroland currency units, except per share amounts)
Illustrative Corporation Group: Example Consolidated Financial Statements 43

Notes to the Consolidated Financial StatementsFor the years ended 31 December 2015 and 2014 (expressed in thousands of Euroland currency units, except per share amounts)
44 Illustrative Corporation Group: Example Consolidated Financial Statements
Note AFS Held for Derivatives HTM Loans and Total (FV) trading (FV) used (amortised receivables (FVTPL) for hedging cost) (amortised cost) 1 January 2014 Financial assets IFRS 7.8(b) Bonds 14.2 – – – 3,065 – 3,065
IFRS 7.8(d) Other investments (a) 14.3 1,262 – – – – 1,262
Other long-term financial assets 1,262 – – 3,065 – 4,327
IFRS 7.8(a)(ii) Other short-term financial assets 14.4 – 631 – – – 631
IFRS 7.8(a)(ii) Derivative financial instruments 14.5 – 490 – – – 490
IFRS 7.8(c) Trade and other receivables (b) 17 – – – – 19,258 19,258
IFRS 7.8(c) Cash and cash equivalents 18 – – – – 9,987 9,987
1,262 1,121 – 3,065 29,245 34,693
Note Derivatives Designated Other Total (FV) used for at FVTPL liabilities hedging (amortised cost) 1 January 2014 Financial liabilities IFRS 7.8(e)(i) Non-current borrowings 14.6 – 8,105 13,300 21,405
IFRS 7.8(e)(i),
IFRS 7.8(f) Current borrowings 14.6 – 275 3,543 3,818
IFRS 7.8(f) Trade and other payables 23 – – 12,437 12,437
IFRS 7.7 Derivative financial instruments 14.5 – – – –
– 8,380 29,280 37,660
a) includes an equity investment carried at cost less impairment charges because fair value cannot be determined reliably
(see Note 14.3).
b) these amounts only represent trade receivables that are financial assets (see Note 17).
IFRS 7.33 A description of the Group’s financial instrument risks, including risk management objectives and policies is given in Note 32.
The methods used to measure financial assets and liabilities reported at fair value are described in Note 33.1.
14.2 HTM investmentsIFRS 7.7 HTM investments comprise publicly traded zero coupon and US straight bonds with fixed
interest rates between 5.5% and 6.2%. They mature in 2017 and 2018. The carrying amounts (measured at amortised cost) and fair values of these bonds are as follows:
31 Dec 2015 31 Dec 2014 1 Jan 2014 Carrying amount at amortised cost:
Zero coupon bonds 1,110 1,189 1,177
US straight bonds 1,704 1,803 1,888
IFRS 7.8(b) 2,814 2,992 3,065
Fair value:
IFRS 7.25 Zero coupon bonds 1,190 1,186 1,180
US straight bonds 1,705 1,809 1,891
2,895 2,995 3,071

IFRS 13.97 Fair values of these bonds have been estimated by reference to quoted bid prices in active markets at the reporting date and are categorised within Level 1 of the fair value hierarchy. The fair value of the US straight bonds also reflects the US-dollar spot rate as at the reporting date.
14.3 AFS financial assets The details and carrying amounts of AFS financial assets are as follows:
31 Dec 2015 31 Dec 2014 1 Jan 2014IFRS 7.25 Listed equity securities 421 343 365
IFRS 7.25 Listed debentures 97 112 114
Total AFS financial assets at fair value 518 455 479
Investment in XY Ltd 433 433 783
IFRS 7.8(d) 951 888 1,262
The equity securities and debentures are denominated in CU and are publicly traded in
Euroland. IFRS 7.30(a)-(d) The investment in XY Ltd represents a 15% equity interest in an unlisted company, one of
the Group’s suppliers. XY Ltd has been undertaking a major restructuring process since 2014, which has triggered possible litigation by third parties. Due to these uncertainties, the fair value of the Group’s investment in this entity cannot be reliably measured. Therefore, it has been stated at cost less impairment charges. In 2014, an impairment charge of CU 350 was recognised within finance cost. The Group plans to continue to hold its investment in XY Ltd while it secures other supply lines.
IFRS 7.20(a)(ii) During 2015 a gain of CU 113 (2014: CU 35) was recognised in other comprehensive income. During 2015 a gain of CU 50 (2014: nil) was reclassified from equity into profit or loss
within revenue. The cumulative gain recorded in equity is CU 98 (2014: CU 35).
14.4 Financial assets held for tradingIFRS 7.B5(a)(i) Financial assets held for trading consists of various investments in money market funds
(presented as other short-term financial assets) that are held by the Group for short-term trading and certain derivative financial investments (see Note 14.5). All of these money market funds are publicly traded on stock exchanges in Euroland.
14.5 Derivative financial instruments The Group’s derivative financial instruments are measured at fair value and are summarised
below:
31 Dec 2015 31 Dec 2014 1 Jan 2014IFRS 7.22(b) US-dollar forward contracts – cash flow hedge 467 – –
Other forward exchange contracts – held-for-trading 115 212 490
Derivative financial assets 582 212 490
IFRS 7.22(b) US-dollar forward contracts – cash flow hedge – (160) –
Derivative financial liabilities – (160) –
IFRS 7.22(a) The Group uses forward foreign exchange contracts to mitigate exchange rate exposure arising IFRS 7.22(b) from forecast sales in US dollars and other currencies. All US-dollar forward exchange contracts IFRS 7.22(c) have been designated as hedging instruments in cash flow hedges in accordance with IAS 39. Other forward exchange contracts are considered by management to be part of economic
hedge arrangements but have not been formally designated.
Notes to the Consolidated Financial StatementsFor the years ended 31 December 2015 and 2014 (expressed in thousands of Euroland currency units, except per share amounts)
Illustrative Corporation Group: Example Consolidated Financial Statements 45

Notes to the Consolidated Financial StatementsFor the years ended 31 December 2015 and 2014 (expressed in thousands of Euroland currency units, except per share amounts)
46 Illustrative Corporation Group: Example Consolidated Financial Statements
IFRS 7.23(a) The Group’s US-dollar forward contracts relate to cash flows that have been forecasted for IFRS 7.23(b) October - December 2016. All forecast transactions for which hedge accounting has been used
are expected to occur. IFRS 7.23(c) During 2015 a gain of CU 367 (2014: loss of CU 47) was recognised in other comprehensive
income. The cumulative gain recorded in equity is CU 467 (2013: cumulative loss of CU 160). IFRS 7.23(d) During 2015 a loss of CU 260 (2014: gain of CU 425) was reclassified from equity into IFRS 7.23(e) profit or loss within revenue. The cumulative gain recorded in equity is CU 467 (2014: cumulative loss of CU 160).
14.6 Borrowings Borrowings include the following financial liabilities:
Current Non-current 31 Dec 31 Dec 1 Jan 31 Dec 31 Dec 1 Jan 2015 2014 2014 2015 2014 2014IFRS 7.8(e)(i) Designated at FVTPL:
US-dollar loans 250 255 275 7,700 7,965 8,105
IFRS 7.8(f) Carrying amount at amortised cost:
Other bank borrowings 4,565 3,124 3,543 – – –
Non-convertible bond – – – 8,300 8,300 8,300
Subordinated shareholder loan – – – 5,000 5,000 5,000
4,565 3,124 3,543 13,300 13,300 13,300
IFRS 7.8(f) Fair value:
Other bank borrowings 4,565 3,124 3,543 – – –
Non-convertible bond – – – 8,259 8,383 8,287
Subordinated shareholder loan – – – 4,975 5,050 4,995
4,565 3,124 3,543 13,234 13,433 13,282
IFRS 7.25 Other than the US-dollar loans, all borrowings are denominated in CU.
US-dollar loans at FVTPL US-dollar loans are designated at FVTPL to significantly reduce measurement inconsistencies
(see Note 4.17). The interest rate is fixed at 4%. Movements in the carrying amount of these US-dollar loans are presented below:
2015 2014
Carrying amount 1 January 8,220 8,380
Repayments (300) (230)
Change in fair values:
IFRS 7.10(a) changes in credit risk – –
other market factors 30 70
IFRS 7.25 Carrying amount 31 December 7,950 8,220
IFRS 7.10(a) The cumulative changes since the designation of these borrowings at FVTPL attributable to IFRS 7.11(a) changes in credit risk are CU Nil (2014: Nil). The Group estimates the credit-risk related
change in fair value on a residual basis, as the difference between fair value changes specifically attributable to the appropriate benchmark interest rates and the total change in fair value. At year-end the estimate shows an insignificant change attributable to credit risk.
IFRS 7.10(b) The total undiscounted amount repayable at maturity in respect of the loan, converted at year-end exchange rates is CU 7,755 (2014: CU 8,055), equivalent to a difference between the carrying amount and the amount repayable of CU 195 (2014: CU 165).
The fair value of the loans is measured as described in Note 33.1.

Borrowings at amortised costIAS 16.74(a) Other bank borrowings are secured by land and buildings owned by the Group (see Note 11). IFRS 7.29 Current interest rates are variable and average 4.0 % (2014: 4.1%). The carrying amount of the IFRS 7.31 other bank borrowings is considered to be a reasonable approximation of the fair value. IFRS 13.93(d) The Group’s non-convertible bond with a fixed interest rate of 5.0% matures on 20 May IFRS 13.97 2018 and is therefore classified as non-current. The estimated fair value of the non-convertible bond is categorised within Level 2 of the fair value hierarchy. The fair value estimate has been
determined from the perspective of a market participant, that holds these non-convertible bonds as assets at 31 December 2015. The CU 8,259 is estimated using a present value technique, by discounting the contractual cash flows using implied yields of non-convertible bonds of pan entity with a similar standing and marketability.
The most significant input being the discount rate that reflects the credit risk of counterparties.
IAS 24.17 The subordinated shareholder loan was provided by Illustrative Corporation’s main IFRS 13.93(d) shareholder, LOM Investment Trust, in 2011. It is perpetual and carries a fixed coupon of 4.0%. IFRS 13.97 It is repayable only upon liquidation of Illustrative Corporation. The estimated fair value of the
subordinated shareholder loan is categorised within Level 3 of the fair value hierarchy. The fair value estimate has been determined using a present value technique. The CU 4,975 is estimated by discounting the contractual cash flows at 4.1%. The discount rate has been determined using the interest rate that the entity would pay to unrelated party, at the reporting date, adjusted to reflect the subordination feature.
The most significant input is the discount rate of 4.1%.
14.7 Other financial instrumentsIFRS 7.29 The carrying amount of the following financial assets and liabilities is considered a reasonable
approximation of fair value: • trade and other receivables • cash and cash equivalents • trade and other payables.
15. Deferred tax assets and liabilities
Deferred taxes arising from temporary differences and unused tax losses are summarised as follows:
IAS 12.81(g) Deferred tax liabilities(assets) 1 January Recognised Recognised Recognised 31 2015 in other in business in profit December comprehensive combination or loss 2015 income Non-current assets
Other intangible assets 847 (63) 444 30 1,258
Property, plant and equipment 2,130 (22) 188 406 2,702
Other long-term financial assets (95) – – 19 (76)
Investment property 1,914 – – 93 2,007
Current assets
Trade and other receivables (168) – – 38 (130)
Current liabilities
Provisions (1,003) – – 639 (364)
Pension and other employee obligations (4,451) 1,149 – (188) (3,490)
Unused tax losses (75) – – 75 –
(901) 1,064 632 1,112 1,907
Notes to the Consolidated Financial StatementsFor the years ended 31 December 2015 and 2014 (expressed in thousands of Euroland currency units, except per share amounts)
Illustrative Corporation Group: Example Consolidated Financial Statements 47

Notes to the Consolidated Financial StatementsFor the years ended 31 December 2015 and 2014 (expressed in thousands of Euroland currency units, except per share amounts)
48 Illustrative Corporation Group: Example Consolidated Financial Statements
The amounts recognised in other comprehensive income relate to revaluation of land, exchange differences on translating foreign operations and the remeasurement of net defined benefit liability. See Note 20.3 for the amount of the income tax relating to these components of other comprehensive income.
IAS 12.81(f) A deferred tax liability of CU 1 (31 Dec 2014: CU 2; 1 Jan 2014: CU 2) associated with an investment in a domestic subsidiary has not been recognised, as the Group controls the timing of the reversal and it is probable that the temporary difference will not reverse in the foreseeable future. The tax value is equivalent to a temporary difference of CU 3 (31 Dec 2014: CU 7; 1 Jan 2014: CU 8).
IAS 12.81(e) All deferred tax assets (including tax losses and other tax credits) have been recognised in the statement of financial position.
16. Inventories
Inventories consist of the following:
IAS 1.77 31 Dec 2015 31 Dec 2014 1 Jan 2014IAS 1.78(c)
IAS 2.36(b) Raw materials and consumables 7,737 7,907 8,367
Merchandise 10,561 9,319 10,204
18,298 17,226 18,571
IAS 2.36(d) In 2015, a total of CU 35,265 (2014: CU 32,907) of inventories was included in profit or IAS 2.36(e) loss as an expense. This includes an amount of CU 361 (2014: CU 389) resulting from
write-down of inventories.
IAS 12.81(g) Deferred tax liabilities(assets) 1 January Recognised Included in Recognised Recognised 31 2014 in other disposal in business in profit December comprehensive group combination or loss 2014 income Non-current assets
Other intangible assets 409 (27) – 210 255 847
Property, plant and equipment 1,528 (68) – 225 445 2,130
Other long-term financial assets – – – – (95) (95)
Investment property 1,861 – – – 53 1,914
Current assets
Trade and other receivables (34) – – – (134) (168)
Current liabilities
Provisions (1,320) – 74 – 243 (1,003)
Pension and other employee obligations (2,996) (1,062) – – (393) (4,451)
Unused tax losses (300) – – – 225 (75)
(852) (1,157) 74 435 599 (901)

17. Trade and other receivables
Trade and other receivables consist of the following:
IAS 1.77 31 Dec 2015 31 Dec 2014 1 Jan 2014IAS 1.78(c) Trade receivables, gross 31,265 23,889 19,481
Allowance for credit losses (432) (560) (335)
Trade receivables 30,833 23,329 19,146
Receivable due from ABC Ltd 112 112 112
Financial assets 30,945 23,441 19,258
Social security and other taxes 1,012 676 614
Construction contracts for telecommunication systems 1,374 974 560
Prepayments 298 315 287
Non-financial assets 2,684 1,965 1,461
33,629 25,406 20,719
IFRS 7.25 All amounts are short-term. The net carrying value of trade receivables is considered a IFRS 7.29 reasonable approximation of fair value. The receivable due from ABC Ltd relates to the remaining consideration due on the sale of
a former subsidiary in 2012. The carrying amount of the receivable is considered a reasonable approximation of fair value as this financial asset (which is measured at amortised cost) is expected to be paid within six months, such that the effect of any difference between the effective interest rate applied and the estimated current market rate is not significant.
IFRS 7.37(b) All of the Group’s trade and other receivables have been reviewed for indicators of impairment. Certain trade receivables were found to be impaired and an allowance for credit losses of CU 72 (2014: CU 514) has been recorded accordingly within other expenses. The impaired trade receivables are mostly due from customers in the business-to-business market that are experiencing financial difficulties.
IFRS 7.16 The movements in the allowance for credit losses is presented below:
2015 2014
IFRS 7.16 Balance 1 January 560 112
Amounts written off (uncollectable) (200) (66)
Impairment loss 72 514
Balance 31 December 432 560
IFRS 7.20(e) An analysis of unimpaired trade receivables that are past due is given in Note 32.2.
17.1 Construction contractsIAS 11.39(a) Revenue of CU 50,973 (2014: CU 49,186) relating to construction contracts for
telecommunication systems has been included in revenue for the current reporting period.IAS 11.39(b)-(c) The amounts recognised in the statement of financial position relate to construction
contracts in progress at the end of the reporting period. The amounts are calculated as the net amounts of costs incurred plus recognised profits, less recognised losses and progress billings. The carrying amounts of assets and liabilities are analysed as follows:
Notes to the Consolidated Financial StatementsFor the years ended 31 December 2015 and 2014 (expressed in thousands of Euroland currency units, except per share amounts)
Illustrative Corporation Group: Example Consolidated Financial Statements 49
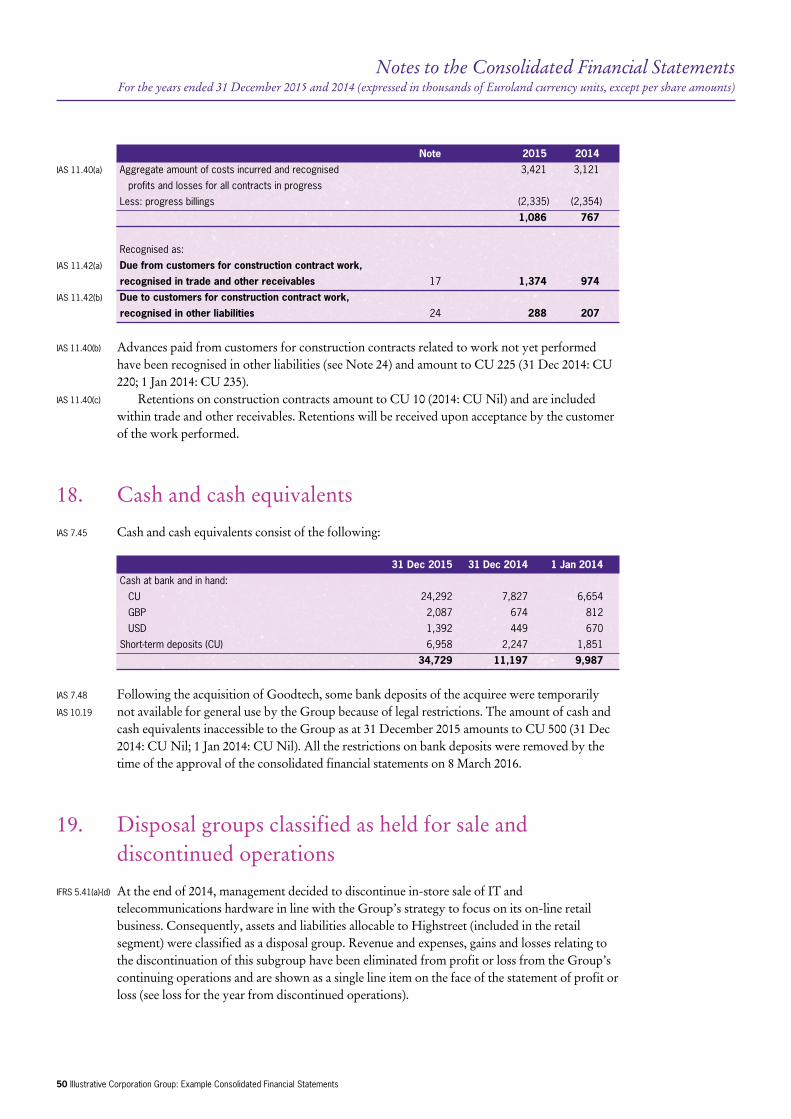
Notes to the Consolidated Financial StatementsFor the years ended 31 December 2015 and 2014 (expressed in thousands of Euroland currency units, except per share amounts)
50 Illustrative Corporation Group: Example Consolidated Financial Statements
Note 2015 2014IAS 11.40(a) Aggregate amount of costs incurred and recognised 3,421 3,121
profits and losses for all contracts in progress
Less: progress billings (2,335) (2,354)
1,086 767
Recognised as:
IAS 11.42(a) Due from customers for construction contract work, recognised in trade and other receivables 17 1,374 974IAS 11.42(b) Due to customers for construction contract work, recognised in other liabilities 24 288 207
IAS 11.40(b) Advances paid from customers for construction contracts related to work not yet performed have been recognised in other liabilities (see Note 24) and amount to CU 225 (31 Dec 2014: CU 220; 1 Jan 2014: CU 235).
IAS 11.40(c) Retentions on construction contracts amount to CU 10 (2014: CU Nil) and are included within trade and other receivables. Retentions will be received upon acceptance by the customer of the work performed.
18. Cash and cash equivalents
IAS 7.45 Cash and cash equivalents consist of the following:
31 Dec 2015 31 Dec 2014 1 Jan 2014 Cash at bank and in hand:
CU 24,292 7,827 6,654
GBP 2,087 674 812
USD 1,392 449 670
Short-term deposits (CU) 6,958 2,247 1,851
34,729 11,197 9,987
IAS 7.48 Following the acquisition of Goodtech, some bank deposits of the acquiree were temporarily IAS 10.19 not available for general use by the Group because of legal restrictions. The amount of cash and
cash equivalents inaccessible to the Group as at 31 December 2015 amounts to CU 500 (31 Dec 2014: CU Nil; 1 Jan 2014: CU Nil). All the restrictions on bank deposits were removed by the time of the approval of the consolidated financial statements on 8 March 2016.
19. Disposal groups classified as held for sale and discontinued operations
IFRS 5.41(a)-(d) At the end of 2014, management decided to discontinue in-store sale of IT and telecommunications hardware in line with the Group’s strategy to focus on its on-line retail business. Consequently, assets and liabilities allocable to Highstreet (included in the retail segment) were classified as a disposal group. Revenue and expenses, gains and losses relating to the discontinuation of this subgroup have been eliminated from profit or loss from the Group’s continuing operations and are shown as a single line item on the face of the statement of profit or loss (see loss for the year from discontinued operations).

IAS 7.40(a) On 30 September 2015, Highstreet was sold for a total of CU 3,117 in cash resulting in a loss of CU 29 before tax primarily due to related selling costs (see Note 6.3). Operating profit of Highstreet until the date of disposal and the profit or loss from re-measurement and disposal of assets and liabilities classified as held for sale are summarised as follows:
2015 2014IFRS 5.33(b)(i) Revenue 9,803 11,015
Costs of material (3,540) (3,633)
Employee benefits expense (6,100) (6,411)
Depreciation and amortisation – (765)
Other expenses (90) (100)
Operating profit 73 106
Finance costs (56) (60)
Profit from discontinued operations before tax 17 46
IFRS 5.33(b)(ii) Tax expense (5) (14)
IAS 12.81(h)
Profit for year 12 32
Loss on remeasurement and disposal
IFRS 5.33(b)(iii) Loss before tax on remeasurement to fair value less costs to sell – (510)
Loss before tax on disposal (29) –
IFRS 5.33(b)(ii) Tax recovery 8 153
IAS 12.81(h)
Total loss (21) (357)
Loss for the year from discontinued operations (9) (325)
IFRS 5.41(b) Most of the assets and all of the liabilities have been disposed of in this transaction, however, the Group continues to own some former Highstreet storage facilities. Management expects to sell these remaining assets during 2016.
IFRS 5.38 The carrying amounts of assets and liabilities in this disposal group are summarised as follows:
2015 2014 Non-current assets
Property, plant and equipment 103 2,578
Deferred tax – 227
Current assets
Inventories – 1,081
Cash and cash equivalents – 22
Assets classified as held for sale 103 3,908
Current liabilities
Provisions – (245)
Trade and other payables – (190)
Current tax liabilities – (14)
Liabilities classified as held for sale – (449)
IFRS 5.33(c) Cash flows generated by Highstreet for the reporting periods under review until its disposal are as follows:
Notes to the Consolidated Financial StatementsFor the years ended 31 December 2015 and 2014 (expressed in thousands of Euroland currency units, except per share amounts)
Illustrative Corporation Group: Example Consolidated Financial Statements 51

Notes to the Consolidated Financial StatementsFor the years ended 31 December 2015 and 2014 (expressed in thousands of Euroland currency units, except per share amounts)
52 Illustrative Corporation Group: Example Consolidated Financial Statements
2015 2014 Operating activities (22) 811
Investing activities 3,117 –
Cash flows from discontinued operations 3,095 811
Cash flows from investing activities relate solely to the proceeds from the sale of Highstreet.
20. Equity
20.1 Share capitalIAS 1.79(a)(iii) The share capital of Illustrative Corporation consists only of fully paid ordinary shares with IAS 1.79(a)(v) a nominal (par) value of CU 1 per share. All shares are equally eligible to receive dividends
and the repayment of capital and represent one vote at shareholders’ meetings of Illustrative Corporation.
2015 2014IAS 1.79(a)(iv) Shares issued and fully paid:
Beginning of the year 12,000,000 12,000,000
Issued on exercise of employee share options 270,000 –
Share issue, private placement 1,500,000 –
IAS 1.79(a)(ii) Shares issued and fully paid 13,770,000 12,000,000
Shares authorised for share based payments 600,000 600,000
IAS 1.79(a)(i) Total shares authorised at 31 December 14,370,000 12,600,000
Additional shares were issued during 2015 relating to share-based payments (see Note 21.2 for details on the Group’s share-based employee remuneration programmes).
The Group issued 1,500,000 shares on 30 October 2015, corresponding to 12.5% of total shares issued. Each share has the same right to receive dividends and the repayment of capital and represents one vote at shareholders’ meetings of Illustrative Corporation.
IAS 1.79(a)(vii) The authorised shares that have not yet been issued have been authorised solely for use in the Group’s share-based remuneration programmes (see Note 21.2).
20.2 Share premium Proceeds received in addition to the nominal value of the shares issued during the year have
been included in share premium, less registration and other regulatory fees and net of related tax benefits. Costs of new shares charged to equity amounted to CU 70 (2014: CU Nil).
Share premium has also been recorded in respect of the issue of share capital related to employee share-based payment (see Note 21.2).

20.3 Other components of equityIAS 1.106(d)(ii) The details of other components of equity are as follows:IAS 1.106A
Translation Revaluation AFS Cash-flow Net defined Total reserve reserve financial hedges benefit assets liability IAS 1.106(d) Balance at 1 January 2015 (359) 689 35 (160) (862) (657)
Other comprehensive income for the year (all attributable to owners of the parent):
IAS 19.120(c) Remeasurement of net – – – – 3,830 3,830
defined benefit liability
Cash flow hedges
IFRS 7.23(c)-(d) current year gains – – – 367 – 367
IAS 1.92 reclassification to profit or loss – – – 260 – 260
IFRS 7.20(a)(ii) AFS financial assets –
current year gains – – 113 – – 113
IAS 1.92 reclassification to profit or loss – – (50) – – (50)
IAS 16.77(f) Revaluation of land – 303 – – – 303
IAS 21.52(b) Exchange differences on
translating foreign operations (664) – – – – (664)
Equity accounted investments – – – 5 – 5
IAS 1.92 reclassification to profit or loss – – – (3) – (3)
IAS 1.91(b) Before tax (664) 303 63 629 3,830 4,161
IAS 12.81(a),
IAS 1.90 Tax benefit (expense) 176 (91) – – (1,149) (1,064)
Net of tax (488) 212 63 629 2,681 3,097
IAS 1.106(d) Balance at 31 December 2015 (847) 901 98 469 1,819 2,440
Translation Revaluation AFS Cash-flow Net defined Total reserve reserve financial hedges benefit assets liabilityIAS 1.106(d) Balance at 1 January 2014 (113) 689 – 312 1,617 2,505
Other comprehensive income for the year (all attributable to owners of the parent):
IAS 19.120(c) Remeasurement of net – – – – (3,541) (3,541)
defined benefit liability
Cash flow hedges
IFRS 7.23(c)-(d) current year losses – – – (47) – (47)
IAS 1.92 reclassification to profit or loss – – – (425) – (425)
IFRS 7.20(a)(ii) AFS financial assets –
current year gains – – 35 – – 35
IAS 21.52(b) Exchange differences on
translating foreign operations (341) – – – – (341)
IAS 1.91(b) Before tax (341) – 35 (472) (3,541) (4,319)
IAS 12.81(a),
IAS 1.90 Tax benefit 95 – – – 1,062 1,157
Net of tax (246) – 35 (472) (2,479) (3,162)
IAS 1.106(d) Balance at 31 December 2014 (359) 689 35 (160) (862) (657)
Notes to the Consolidated Financial StatementsFor the years ended 31 December 2015 and 2014 (expressed in thousands of Euroland currency units, except per share amounts)
Illustrative Corporation Group: Example Consolidated Financial Statements 53

Notes to the Consolidated Financial StatementsFor the years ended 31 December 2015 and 2014 (expressed in thousands of Euroland currency units, except per share amounts)
54 Illustrative Corporation Group: Example Consolidated Financial Statements
21. Employee remuneration
21.1 Employee benefits expense Expenses recognised for employee benefits are analysed below:
2015 2014 Wages, salaries 96,483 91,168
Social security costs 11,229 10,608
IFRS 2.51(a) Share-based payments 298 466
IAS 19.120 Pensions – defined benefit plans 1,308 1,930
IAS 19.53 Pensions – defined contribution plans 4,491 5,343
113,809 109,515
21.2 Share-based employee remuneration As at 31 December 2015, the Group maintained two share-based payment schemes for employee
remuneration, the Star Programme and the Stay Programme. Both programmes will be settled in equity.
IFRS 2.45(a) The Star Programme is part of the remuneration package of the Group’s senior management. Options under this programme will vest if certain conditions, as defined in the programme, are met. It is based on the performance of the Illustrative Corporation’s shares compared to other companies in the Greatstocks Stock Exchange within a specified period. In addition, participants in this programme have to be employed until the end of the agreed vesting period. Upon vesting, each option allows the holder to purchase one ordinary share at a discount of 20-25% of the market price determined at grant date.
IFRS 2.45(a) The Stay Programme is part of the remuneration package of the Group’s research and development and sales personnel. Options under this programme will vest if the participant remains employed for the agreed vesting period. The maximum term of the options granted under the Stay Programme ends on 31 January 2016. Upon vesting, each option allows the holder to purchase one ordinary share at a discount of 15-20% of the market price determined at grant date.
Share options and weighted average exercise prices are as follows for the reporting periods presented:
IFRS 2.45(b) Star Programme Stay Programme Number Weighted Number Weighted of shares average of shares average exercise exercise price per price per share shareIFRS 2.45(b)(i) Outstanding at 1 January 2014 300,000 6.24 95,250 5.81
IFRS 2.45(b)(ii) Granted – – – –
IFRS 2.45(b)(iii) Forfeited (513) 6.24 (1,012) 5.81
IFRS 2.45(b)(iv) Exercised – – – –
IFRS 2.45(b)(vi) Outstanding at 31 December 2014 299,487 6.24 94,238 5.81 IFRS 2.45(b)(ii) Granted 100,000 7.81 – –
IFRS 2.45(b)(iii) Forfeited (312) 6.24 (3,489) 5.81
IFRS 2.45(b)(iv) Exercised (270,000) 6.24 – –
IFRS 2.45(b)(vi) Outstanding at 31 December 2015 129,175 7.45 90,749 5.81
IFRS 2.45(b)(vii) Exercisable at 31 December 2014 – – – –
IFRS 2.45(b)(vii) Exercisable at 31 December 2015 29,175 6.24 – –

IFRS 2.45(c) The weighted average share price per share at the date of exercise was CU 11.19 (no options were exercised in 2014).
IFRS 2.47(a)(i) The fair values of options granted were determined using a variation of the binomial option pricing model that takes into account factors specific to the share incentive plans, such as the vesting period. The performance condition related to the Star Programme, being a market condition, has been incorporated into the measurement by means of actuarial modelling. The following principal assumptions were used in the valuation:
The Star Programme The Stay ProgrammeIFRS 2.47(a)(i) Grant date 1 Jan 2012 1 Feb 2015 5 Jan 2011
Vesting period ends 31 Dec 2014 31 Jan 2018 31 Jan 2016
Share price at date of grant CU 8.00 CU 10.01 CU 7.00
Volatility 50% 50% 50%
Option life 5 years 5 years 7 years
Dividend yield 1% 1% 1%
Risk-free investment rate 4% 4% 4%
Fair value at grant date CU 4.00 CU 6.70 CU 5.30
Exercise price at date of grant CU 6.08 CU 7.61 CU 5.81
Exercisable from/to 1 Jan 2015/ 1 Feb 2018/ 1 Feb 2016/
31 Dec 2016 31 Dec 2020 4 Jan 2018
IFRS 2.45(d) Weighted average remaining contractual life 1.0 years 4.1 years 2.0 years
IFRS 2.47(a)(ii) The underlying expected volatility was determined by reference to historical data of the IFRS 2.47(a)(iii) Company’s shares over a period of time since its flotation on the Greatstocks Stock Exchange.
No special features inherent to the options granted were incorporated into measurement of fair value.
IFRS 2.51(a) In total, CU 298 (2014: CU 466) of employee remuneration expense (all of which related to equity-settled share-based payment transactions) has been included in profit or loss and credited to retained earnings.
21.3 Pensions and other employee obligations The liabilities recognised for pensions and other employee remuneration consist of the following
amounts11:
31 Dec 2015 31 Dec 2014 1 Jan 2014 Non-current:
Defined benefit liability (net) 10,386 13,642 8,932
Current:
Defined benefit liability 1,246 1,193 1,156
Other short term employee obligations 221 303 180
1,467 1,496 1,336
11 In the statement of financial position, the current and non-current portion of the defined benefit obligation are presented separately to comply with IAS 1.60. However, paragraph 133 of IAS 19 ‘Employee Benefits’ does not specify whether this disaggregation is needed. Therefore, an entity is also allowed to present the obligation as non-current in its entirety.
Notes to the Consolidated Financial StatementsFor the years ended 31 December 2015 and 2014 (expressed in thousands of Euroland currency units, except per share amounts)
Illustrative Corporation Group: Example Consolidated Financial Statements 55

Notes to the Consolidated Financial StatementsFor the years ended 31 December 2015 and 2014 (expressed in thousands of Euroland currency units, except per share amounts)
56 Illustrative Corporation Group: Example Consolidated Financial Statements
IAS 1.69 The current portion of these liabilities represents the Group’s obligations to its current and former employees that are expected to be settled during 2016. Other short-term employee obligations arise mainly from accrued holiday entitlement at the reporting date and expected pension payments in the next 12 months (without deduction of plan assets). As none of the employees are eligible for early settlement of pension arrangements, the remaining part of pension obligations for defined benefit plans is considered non-current. The non-current portion of the defined benefit liability is presented net of plan assets.
Defined benefit planIAS 19.139(a) The Group has set up a partly funded pension scheme for mid to senior management, mainly in
Euroland, the UK and the US. The scheme is available to certain senior workers after completing five years’ service.
According to the plan, a certain percentage of the current salary is converted into a pension component each year until retirement. Pensions under this scheme are paid out when a beneficiary has reached the age of 65. The pensionable salary is limited to CU 100 for a year. Eligible employees are required to contribute a stated percentage of pensionable salary.
In Euroland and the UK, the pension payments are linked to the consumer price index (CPI), although certain limitations apply.
IAS 19.139(a) The plan assets are managed by a pension fund that is legally separated from the Group. The board of trustees of the pension fund is required by its articles of association to act in the best interest of the fund and it is responsible for setting the investment policies. The Group has no representation on the board of the fund.
IAS 19.139(b) The plan exposes the Group to actuarial risks such as interest rate risk, investment risk, longevity risk and inflation risk.
Interest rate risk The present value of the defined benefit liability is calculated using a discount rate determined by
reference to market yields of high quality corporate bonds. The estimated term of the bonds is consistent with the estimated term of the defined benefit obligation and it is denominated in CU. A decrease in market yield on high quality corporate bonds will increase the Group’s defined benefit liability, although it is expected that this would be offset partially by an increase in the fair value of certain of the plan assets.
Investment risk The plan assets at 31 December 2015 are predominantly real estate, equity and debt instruments.
The fair value of the plan assets is exposed to the real estate market (in Euroland and the US). The equity instruments are significantly weighted towards the finance and pharmaceuticals sectors in Euroland.
Longevity risk The Group is required to provide benefits for life for the members of the defined benefit
liability. Increase in the life expectancy of the members, particularly in Euroland and in the UK where the pension payments are linked to CPI, will increase the defined benefit liability.
Inflation risk A significant proportion of the defined benefit liability is linked to inflation. An increase in the
inflation rate will increase the Group’s liability. A portion of the plan assets are inflation-linked debt securities which will mitigate some of the effects of inflation.

A reconciliation of the Group’s defined benefit obligation (DBO) and plan assets to the amounts presented in the statement of financial position for each of the reporting periods is presented below:
31 Dec 2015 31 Dec 2014 1 Jan 2014IAS 19.140 Defined benefit obligation 53,874 47,410 38,889
Fair value of plan assets (42,242) (32,575) (28,801)
11,632 14,835 10,088
Classified as:
Non-current liability 10,386 13,642 8,932 Current liability 1,246 1,193 1,156 11,632 14,835 10,088
Defined benefit obligation The details of the Group’s DBO are as follows:
2015 2014IAS 19.140(a)(ii) Defined benefit obligation 1 January 47,410 38,889
IAS 19.141(a) Current service cost before deduction of beneficiary contributions 1,966 2,180
IAS 19.141(b) Interest expense 2,488 2,267
IAS 19.141(c)(ii) Remeasurement – actuarial losses from changes in demographic assumptions 916 1,091
IAS 19.141(c)(ii) Remeasurement – actuarial losses from changes in financial assumptions 2,345 2,670
IAS 19.141(g) Benefits paid (1,251) (1,187)
IAS 19.141(d) Past service cost – 1,500
IAS 19.140(a)(ii) Defined benefit obligation 31 December 53,874 47,410
IAS 19.138(e) Unfunded – –
Partly or wholly funded 53,874 47,410
Plan assets The reconciliation of the balance of the assets held for the Group’s defined benefit plan is
presented below:
2015 2014IAS 19.140(a)(i) Fair value of plan assets 1 January 32,575 28,801
IAS 19.141(b) Interest income 1,983 1,718
IAS 19.141(c)(i) Return on plan assets (excluding amounts included in net interest) 7,091 220
IAS 19.141(f) Contributions by the Group 1,186 1,273
IAS 19.141(f) Contributions by beneficiaries 658 1,750
IAS 19.141(g) Benefits paid (1,251) (1,187)
IAS 19.140(a)(i) Fair value of plan assets 31 December 42,242 32,575
Notes to the Consolidated Financial StatementsFor the years ended 31 December 2015 and 2014 (expressed in thousands of Euroland currency units, except per share amounts)
Illustrative Corporation Group: Example Consolidated Financial Statements 57

Notes to the Consolidated Financial StatementsFor the years ended 31 December 2015 and 2014 (expressed in thousands of Euroland currency units, except per share amounts)
58 Illustrative Corporation Group: Example Consolidated Financial Statements
The actual return on plan assets was CU 9,074 in 2015 (2014: CU 1,938).IAS 19.143 Plan assets do not comprise any of the Group’s own financial instruments or any assets
used by Group companies. Plan assets can be broken down into the following categories of investments:
Total plan assets 31 Dec 2015 31 Dec 2014 1 Jan 2014IAS 19.142(a) Cash and cash equivalents 3,442 2,075 2,200
IAS 19.142(b) Equity instruments:
Financial institutions 9,800 7,600 7,300
Pharmaceuticals 8,100 4,300 3,600
Oil and gas industry 1,600 1,700 2,700
Manufacturing industry 1,500 1,200 1,600
21,000 14,800 15,200
IAS 19.142(c) Debt instruments:
Euroland government bonds 4,800 5,800 5,300
Corporate bonds (rated AA and above) 3,100 5,600 2,800
7,900 11,400 8,100
IAS 19.142(d) Real estate:
in Euroland 6,700 2,500 1,801
in the US 3,200 1,800 1,500
9,900 4,300 3,301
Total 42,242 32,575 28,801
IAS 19.142 All equity and debt instruments have quoted prices in active markets (Level 1). Fair values of real estate investments do not have quoted prices and have been determined based on professional appraisals that would be classified as Level 3 of the fair value hierarchy as defined in IFRS 13 Fair Value Measurement.
IAS 19.138(a) The defined benefit obligation and plan assets are composed by geographical locations as follows:
31 December 2015 Euroland UK US Others Total Defined benefit obligation 24,482 17,321 11,529 542 53,874
Fair value of plan assets (18,586) (13,057) (10,427) (172) (42,242)
5,896 4,264 1,102 370 11,632
31 December 2014 Euroland UK US Others Total Defined benefit obligation 21,594 15,063 10,256 497 47,410
Fair value of plan assets (14,123) (9,748) (8,553) (151) (32,575)
7,471 5,315 1,703 346 14,835
1 January 2014 Euroland UK US Others Total Defined benefit obligation 16,501 12,879 9,123 386 38,889
Fair value of plan assets (12,357) (8,632) (7,665) (147) (28,801)
4,144 4,247 1,458 239 10,088

IAS 19.144 The significant actuarial assumptions used for the valuation are as follows12:
31 Dec 2015 31 Dec 2014 1 Jan 2014 Discount rate at date shown 5.3% 5.5% 5.6%
Salary growth rate 3.0% 3.2% 2.8%
Average life expectancies:
Male, 45 years of age at reporting date 84.5 84.5 84.5
Female, 45 years of age at reporting date 87.5 87.5 87.5
Male, 65 years of age at reporting date 82.5 82.5 82.5
Female, 65 years of age at reporting date 84.5 84.5 84.5
IAS 1.125(a) These assumptions were developed by management with the assistance of independent actuaries. Discount factors are determined close to each year-end by reference to market yields of high quality corporate bonds that are denominated in the currency in which the benefits will be paid and that have terms to maturity approximating to the terms of the related pension obligation. Other assumptions are based on current actuarial benchmarks and management’s historical experience.
IAS 19.67 The present value of the DBO was measured using the projected unit credit method.
IAS 19.120 Defined benefit plan expenses Amounts recognised in profit or loss related to the Group’s defined benefit plans are as follows:
2015 2014IAS 19.120(a) Current service cost 1,308 430
IAS 19.120(a) Past service cost – 1,500
IAS 19.120(b) Net interest expense 505 549
Total expenses recognised in profit or loss 1,813 2,479
IAS 19.134 The current service cost and the past service cost are included in employee benefits expense. The net interest expense is included in finance costs.
IAS 19.120 Amounts recognised in other comprehensive income related to the Group’s defined benefit plans are as follows:
2015 2014IAS 19.127(a) Actuarial losses from changes in demographic assumptions (916) (1,091)
IAS 19.127(a) Actuarial losses from changes in financial assumptions (2,345) (2,670)
IAS 19.127(b) Return on plan assets (excluding amounts included in net interest) 7,091 220
Total income (expenses) recognised in other comprehensive income 3,830 (3,541)
IAS 19.122 All the expenses summarised above were included within items that will not be reclassified subsequently to profit or loss in the statement of other comprehensive income.
Other defined benefit plan informationIAS 19.147(a) Employees of the Group are required to contribute a fixed 5% of the pensionable salary. The
remaining contribution is partly funded by the Group’s subsidiaries. The funding requirements are based on the pension fund’s actuarial measurement framework as set out in the funding policies.
12 For the purposes of these Example financial statements, it is assumed that the significant actuarial assumptions for the different geographical locations are the same. In practice, it is likely that there will be differences in the significant actuarial assumptions in different geographical locations, which will require their disclosure.
Notes to the Consolidated Financial StatementsFor the years ended 31 December 2015 and 2014 (expressed in thousands of Euroland currency units, except per share amounts)
Illustrative Corporation Group: Example Consolidated Financial Statements 59

Notes to the Consolidated Financial StatementsFor the years ended 31 December 2015 and 2014 (expressed in thousands of Euroland currency units, except per share amounts)
60 Illustrative Corporation Group: Example Consolidated Financial Statements
IAS 19.147(b) Based on historical data, the Group expects contributions of CU 2,500 to be paid for 2016.IAS 19.147(c) The weighted average duration of the defined benefit obligation at 31 December 2015 is 23.3
years (2014: 23.2 years).IAS 19.144 The significant actuarial assumptions for the determination of the defined benefit obligation IAS 19.173(b) are the discount rate, the salary growth rate and the average life expectancy. The calculation of the
net defined benefit liability is sensitive to these assumptions. The following table summarises the effects of changes in these actuarial assumptions on the defined benefit liability at 31 December 2015:
Changes in the significant actuarial assumptions
IAS 19.145(a) 2015 2014 Discount rate Increase to Decrease to Increase to Decrease to 6.3% 4.3% 6.5% 4.5% Increase (decrease) in the defined benefit liability (2,000) 2,100 (1,900) 2,000
Salary growth rate Increase to Decrease to Increase to Decrease to 4% 2% 4.2% 2.2% Increase (decrease) in the defined benefit liability 950 (780) 900 (730)
Average life expectancies of males Increase of Decrease of Increase of Decrease of one year one year one year one year Increase (decrease) in the defined benefit liability 1,140 (930) 1,120 (910)
Average life expectancies of females Increase of Decrease of Increase of Decrease of one year one year one year one year Increase (decrease) in the defined benefit liability 1,280 (1,090) 1,250 (1,060)
IAS 19.145(b) The present value of the defined benefit obligation calculated with the same method (project unit credit) as the defined benefit obligation recognised in the statement of financial position. The sensitivity analyses are based on a change in one assumption while not changing all other assumptions. This analysis may not be representative of the actual change in the defined benefit obligation as it is unlikely that the change in the assumptions would occur in isolation of one another as some of the assumptions may be correlated.
22. Provisions
IAS 1.69 All provisions are considered current. The carrying amounts and the movements in the provision account are as follows:
Restructuring Other TotalIAS 37.84(a) Carrying amount 1 January 2015 2,110 1,235 3,345
IAS 37.84(b) Additional provisions – 1,570 1,570
IAS 37.84(c) Amount utilised (876) (2,211) (3,087)
IAS 37.84(d) Reversals (510) (103) (613)
IAS 37.84(a)
IAS 1.125(b) Carrying amount 31 December 2015 724 491 1,215
Provisions recognised at acquisition date in a business combination are included in additions (see Note 5.1). Provisions classified as held for sale are included within amount utilised (see Note 19).

IAS 37.85(a) The provision for restructuring relates to the Phoenix programme, which was initiated in IAS 37.85(b) late 2012 and carried out predominantly in 2014 and 2015. The Group’s management expects IAS 37.85(c) to settle the remaining termination remuneration for former employees and legal fees relating to
the restructuring programme in 2016. The Group is not eligible for any reimbursement by third parties in this regard.
IAS 1.125(a) The restructuring provision as at 31 December 2015 was reduced due to the outcome of several lawsuits brought against the Group during 2015 by former employees. Out of court settlements based on the outcome of earlier settlements are expected for most of the remaining claims.
IAS 37.85(a) Other provisions relate to various legal and other claims by customers, such as warranties for which customers are covered for the cost of repairs.
IAS 37.85(b) Usually, these claims are settled between 3 and 18 months from initiation, depending on IAS 1.61/69 the procedures used for negotiating the claims. As the timing of settlement of these claims is
to a large extent dependent on the pace of negotiation with various counterparties and legal authorities, the Group cannot reliably estimate the amounts that will eventually be paid in settlement after more than 12 months from the reporting date. Therefore, the amount is classified as current.
IAS 1.125 The majority of the other provisions recognised at 31 December 2014 related to claims IAS 37.92 initiated in 2014 that were settled during 2015. Management, on the advice of counsel, does not
expect that the outcome of any of the remaining cases will give rise to any significant loss beyond the amounts recognised at 31 December 2015. None of the provisions will be discussed here in further detail so as to not seriously prejudice the Group’s position in the related disputes.
23. Trade and other payables
Trade and other payables consist of the following:
31 Dec 2015 31 Dec 2014 1 Jan 2014 Current
Trade payables 7,843 6,472 6,985
Short-term bank overdrafts 654 78 212
Finance lease liabilities 512 506 475
9,009 7,056 7,672
Non-current
Finance lease liabilities 4,060 4,459 4,765
13,069 11,515 12,437
IFRS 7.25 With the exception of the non-current part of finance lease liabilities, all amounts are short-term. IFRS 7.29 The carrying values of trade payables and short-term bank overdrafts are considered to be a
reasonable approximation of fair value. The fair value of the Group’s finance lease liabilities has been estimated at CU 4,572 (31
December 2014: CU 4,965; 1 January 2014: CU 5,240). This amount reflects present value and takes into account interest rates available on secured bank borrowings on similar terms. See Note 12.1 for further information.
Notes to the Consolidated Financial StatementsFor the years ended 31 December 2015 and 2014 (expressed in thousands of Euroland currency units, except per share amounts)
Illustrative Corporation Group: Example Consolidated Financial Statements 61

Notes to the Consolidated Financial StatementsFor the years ended 31 December 2015 and 2014 (expressed in thousands of Euroland currency units, except per share amounts)
62 Illustrative Corporation Group: Example Consolidated Financial Statements
24. Other liabilities
Other liabilities consist of the following:
31 Dec 2015 31 Dec 2014 1 Jan 2014 Due to customers for construction contract work 288 207 252
Advances received for construction contract work 225 220 235
Deferred service income 2,123 2,291 2,047
Other 22 657 198
Deferred gain 100 100 100
Other liabilities – current 2,758 3,475 2,832
Contingent consideration for the acquisition of Goodtech 620 – –
Deferred gain 1,400 1,500 1,600
Other liabilities – non-current 2,020 1,500 1,600
The deferred gain relates to a sale and leaseback of an office and production building in 2006. The excess of proceeds received over fair value was deferred and is being amortised over the lease term of 15 years. In 2015, deferred income of CU 100 (2014: CU 100) was recognised in profit or loss relating to this transaction. The subsequent leasing agreement is treated as an operating lease (see Note 12.2). The non-current part of the deferred gain will be amortised between 2017 and the end of the lease term.
IAS 1.69 All amounts recognised relating to deferred service income are considered current as the IAS 1.61 timing of service commitments is not at the discretion of the Group. Assuming an average
remaining term of service on service contracts at 31 December 2015 of 32 months (2014: 38 months) and constant service activity over the remaining term, the Group expects to amortise CU 796 of deferred service income during 2016 (2015: CU 723; 2014: CU 772), and CU1,327 after that time (2015: CU1,568; 2014: CU1,781).
The amounts recognised in respect of construction contracts will generally be utilised within the next reporting period (see Note 17.1).
25. Finance costs and finance income
Finance costs for the reporting periods consist of the following:
2015 2014IFRS 7.20(b) Interest expense for borrowings at amortised cost:
Subordinated shareholder loan 200 200
Other borrowings at amortised cost 595 555
795 755
Interest expense for finance lease arrangements 220 230
IFRS 7.20(b) Total interest expense for financial liabilities not at FVTPL 1,015 985
IAS 23.26(a) Less: interest expense capitalised into intangible assets (80) (78)
935 907
IAS 19.141(b) Net interest expense on defined benefit liability 505 549
Unwinding of discount relating to contingent consideration liability 20 –
IFRS 7.20(a)(i) Loss on foreign currency financial liabilities designated at FVTPL 30 70
IFRS 7.20(e) Impairment of investment in XY Ltd (AFS) – 350
1,490 1,876

IAS 23.26(b) The average capitalisation rate for interest expense included in the cost of intangible assets was 4.4% (2014: 4.5%).
IFRS 7.B5(e) The loss on foreign currency financial liabilities designated at FVTPL takes account of interest payments on these loans.
IFRS 7.20(e) An impairment loss was recognised in 2014 for the investment in XY Ltd, which is carried at cost less impairment charges as its fair value cannot be measured reliably (see Note 14.3).
Finance income for the reporting periods consists of the following:
2015 2014IAS 18.35(b)(iii) Interest income from cash and cash equivalents 583 266
IFRS 7.20(b) Interest income on financial assets carried at amortised
cost and AFS financial assets 169 181
IFRS 7.20(b) Total interest income for financial assets not at FVTPL 752 447
IAS 18.35(b)(v) Dividend income from XY Ltd (AFS) 40 –
IAS 18.35(b)(v) Dividend income from listed equity securities (AFS) 22 21
IFRS 7.20(a)(i) Fair value gains on forward exchange contracts held for trading 130 325
IFRS 7.20(a)(ii) Gains on AFS assets reclassified from other comprehensive income 50 –
994 793
26. Other financial items
Other financial items consist of the following:
2015 2014IFRS 7.20(a)(i) Gain from financial assets classified as held for trading (FVTPL) 6 18
IAS 21.52(a),
IFRS 7.20(a)(iv) Gain from exchange differences on loans and receivables 937 1,164
943 1,182
Notes to the Consolidated Financial StatementsFor the years ended 31 December 2015 and 2014 (expressed in thousands of Euroland currency units, except per share amounts)
Illustrative Corporation Group: Example Consolidated Financial Statements 63

Notes to the Consolidated Financial StatementsFor the years ended 31 December 2015 and 2014 (expressed in thousands of Euroland currency units, except per share amounts)
64 Illustrative Corporation Group: Example Consolidated Financial Statements
27. Tax expense
The major components of tax expense13 and the reconciliation of the expected tax expense based on the domestic effective tax rate of Illustrative Corporation at 30% (2014: 30%) and the reported tax expense in profit or loss are as follows:
2015 2014IAS 12.81(c)(i) Profit before tax 22,392 19,334
IAS 12.85 Domestic tax rate for Illustrative Corporation 30% 30%
Expected tax expense 6,718 5,800
IAS 12.84 Adjustment for tax-rate differences in foreign jurisdictions 16 18
IAS 12.84 Adjustment for tax-exempt income:
Relating to equity accounted investments (18) (4)
Other tax-exempt income (63) (117)
IAS 12.84 Adjustment for non-deductible expenses:
Relating to goodwill impairment 240 57
Other non-deductible expenses 17 9
Actual tax expense 6,910 5,763
IAS 12.79,
IAS 12.80 Tax expense comprises:
IAS 12.80(a) Current tax expense 5,798 5,164
Deferred tax expense:
IAS 12.80(c) Origination and reversal of temporary differences 1,037 374
Utilisation of previously recognised tax loss carry forwards 75 225
Tax expense 6,910 5,763
Deferred tax expense (income), recognised directly in other comprehensive income 1,064 (1,157)
IAS 12.81(ab) Note 15 provides information on deferred tax assets and liabilities. Note 20.3 provides information on deferred income tax recognised directly in each component of other comprehensive income.
28. Earnings per share and dividends
Earnings per shareIAS 33.70(a) Both the basic and diluted earnings per share have been calculated using the profit attributable
to shareholders of the parent company (Illustrative Corporation) as the numerator, ie no adjustments to profit were necessary in 2014 or 2015.
IAS 33.70(b) The reconciliation of the weighted average number of shares for the purposes of diluted earnings per share to the weighted average number of ordinary shares used in the calculation of basic earnings per share is as follows:
Amounts in thousand shares: 2015 2014 Weighted average number of shares used in basic earnings per share 12,520 12,000
Shares deemed to be issued for no consideration in respect of share-based payments 17 21
Weighted average number of shares used in diluted earnings per share 12,537 12,021
13 Examples of major components of tax expense are included in IAS 12.80.

Dividends During 2015, Illustrative Corporation paid dividends of CU 3,000 (2014: CU Nil) to its equity
shareholders. This represents a payment of CU 0.25 per share (2014: CU Nil per share). IAS 1.137(a) Also during 2015, the directors proposed the payment of a dividend of CU 6,885 (CU 0.50 IAS 12.81(i) per share). As the distribution of dividends by Illustrative Corporation requires approval at the
shareholders’ meeting, no liability in this respect is recognised in the 2015 consolidated financial statements. No income tax consequences are expected to arise as a result of this transaction at the level of Illustrative Corporation.
29. Non-cash adjustments and changes in working capital
IAS 7.20 The following non-cash flow adjustments and adjustments for changes in working capital have been made to profit before tax to arrive at operating cash flow:
Adjustments: 2015 2014 Depreciation, amortisation and impairment of non-financial assets 7,932 6,051
Foreign exchange gains (937) (1,164)
Interest and dividend income (814) (468)
Fair value gains on financial assets recognised in profit or loss (186) (343)
Cash flow hedges reclassified from equity 260 (425)
Interest expense 955 907
Impairment of financial assets 72 864
Fair value loss on financial liabilities recognised in profit or loss 30 70
Gain on disposal of non-financial assets (115) –
Share-based payment expenses 298 466
Net interest on defined benefit liability 505 549
Current and past service costs 1,308 1,930
Result from equity accounted investments (391) (141)
Change in fair value of investment property (310) (175)
Other (670) (843)
Total adjustments 7,937 7,278
Net changes in working capital: 2015 2014 Change in inventories 7,923 5,573
Change in trade and other receivables 995 1,202
Change in trade and other payables (4,278) (5,750)
Change in other liabilities (3,112) –
Change in other employee obligations 876 772
Change in provisions (3,450) (2,044)
Change in construction contracts and related liabilities (314) (97)
Total changes in working capital (1,360) (344)
IAS 7.43 In 2015, the consideration transferred for the Group’s acquisition of Goodtech (see Note 5.1) included a contingent payment arrangement amounting to CU 600 as of the acquisition date. The initial recognition of this liability and the subsequent unwinding of the discount of CU 20 (2014: Nil) are non-cash transactions excluded from the statement of cash flows.
Notes to the Consolidated Financial StatementsFor the years ended 31 December 2015 and 2014 (expressed in thousands of Euroland currency units, except per share amounts)
Illustrative Corporation Group: Example Consolidated Financial Statements 65

Notes to the Consolidated Financial StatementsFor the years ended 31 December 2015 and 2014 (expressed in thousands of Euroland currency units, except per share amounts)
66 Illustrative Corporation Group: Example Consolidated Financial Statements
30. Related party transactions
The Group’s related parties include its associates and joint venture, key management, post-employment benefit plans for the Group’s employees and others as described below. In addition, Illustrative Corporation has a subordinated loan from its main shareholder, the LOM Investment Trust (see Note 14.6 for information on terms and conditions), on which interest of CU 200 (2014: CU 200) is paid.
IAS 24.18(b)(i) Unless otherwise stated, none of the transactions incorporate special terms and conditions IAS 24.18(b)(ii) and no guarantees were given or received. Outstanding balances are usually settled in cash.
IAS 24.19(d) 30.1 Transactions with associatesIAS 24.18(a) In order to meet peak demands by its customers, some of the Group’s consulting services are IAS 24.18(b) sub-contracted to its associate, Equipe. During 2015, Equipe provided services valued at CU 568
(2014: CU 590). The outstanding balance of CU 20 (31 December 2014: CU 22; 1 January 2014: CU 18) due to Equipe is included in trade payables.
IAS 24.19(e) 30.2 Transactions with joint venturesIAS 24.18(a) During 2015, Halftime provided services valued at CU 10 (2014: CU 3). There is no IAS 24.18(b) outstanding balance as at 31 December 2015 (31 December 2014: Nil; 1 January 2014: Nil).
IAS 24.19(f) 30.3 Transactions with key management personnel Key management of the Group are the executive members of Illustrative Corporation’s board
of directors and members of the executive council. Key management personnel remuneration includes the following expenses:
2015 2014IAS 24.17(a) Short-term employee benefits:
Salaries including bonuses 2,420 2,210
Social security costs 70 34
Company car allowance 220 190
2,710 2,434
IAS 24.17(b) Post-employment benefits:
Defined benefit pension plans 312 299
Defined contribution pension plans 25 12
337 311
IAS 24.17(d) Termination benefits 100 –
IAS 24.17(e) Share-based payments 103 175
Total remuneration 3,250 2,920
IAS 24.18 During 2015, certain key management personnel exercised share options with total exercise price of CU 1,685 (2014: Nil) granted in the Group’s Star Programme.
IAS 24.18(a) The Group allows its employees to take up limited short-term loans to fund merchandise IAS 24.18(b) and other purchases through the Group’s business contacts. This facility is also available to the
Group’s key management personnel. During 2015, the Group’s key management received short term loans totalling CU 40 (2014: CU 38). The outstanding balance of CU 1 (31 December 2014: CU 1; 1 January 2014: CU 1) has been included in trade and other receivables.
During 2015, the Group obtained legal services from a law firm over which one of the directors exercises significant influence. The amount billed related to this legal service amounted to CU 21 (2014: Nil), based on normal market rates and was fully paid as of the reporting date.

30.4 Transactions with the defined benefit planIAS 24.9(b)(v) The defined benefit plan is a related party. The defined benefit plan does not hold shares in
Illustrative Corporation. The Group’s only transaction with the defined benefit plan relate to contributions paid to the plan (see Note 21.3).
31. Contingent liabilities
IAS 1.114(d)(i) Various warranty and legal claims were brought against the Group during the year. Unless IAS 37.86 recognised as a provision (see Note 22), management considers these claims to be unjustified
and the probability that they will require settlement at the Group’s expense to be remote. This evaluation is consistent with external independent legal advice.
IAS 37.92 Further information on these contingencies is omitted so as not to seriously prejudice the Group’s position in the related disputes.
32. Financial instruments risk
IAS 1.114(d)(ii) Risk management objectives and policiesIFRS 7.33 The Group is exposed to various risks in relation to financial instruments. The Group’s financial
assets and liabilities by category are summarised in Note 14.1. The main types of risks are market risk, credit risk and liquidity risk.
IFRS 7.IG15 The Group’s risk management is coordinated at its headquarters, in close cooperation with the board of directors, and focuses on actively securing the Group’s short to medium-term cash flows by minimising the exposure to volatile financial markets. Long-term financial investments are managed to generate lasting returns.
The Group does not actively engage in the trading of financial assets for speculative purposes nor does it write options. The most significant financial risks to which the Group is exposed are described below.
32.1 Market risk analysis The Group is exposed to market risk through its use of financial instruments and specifically to
currency risk, interest rate risk and certain other price risks, which result from both its operating and investing activities.
IFRS 7.33(a) Foreign currency sensitivity Most of the Group’s transactions are carried out in CU. Exposures to currency exchange rates
arise from the Group’s overseas sales and purchases, which are primarily denominated in US dollars (USD) and Pounds Sterling (GBP). The Group also holds an investment in a USD bond. Further, the Group has a USD loan designated at fair value through profit or loss, which has been used to fund the purchase of investment property in the United States.
IFRS 7.33(b) To mitigate the Group’s exposure to foreign currency risk, non-CU cash flows are IFRS 7.IG15 monitored and forward exchange contracts are entered into in accordance with the Group’s
risk management policies. Generally, the Group’s risk management procedures distinguish short-term foreign currency cash flows (due within 6 months) from longer-term cash flows (due after 6 months). Where the amounts to be paid and received in a specific currency are expected to largely offset one another, no further hedging activity is undertaken. Forward exchange contracts are mainly entered into for significant long-term foreign currency exposures that are not expected to be offset by other same-currency transactions.
Notes to the Consolidated Financial StatementsFor the years ended 31 December 2015 and 2014 (expressed in thousands of Euroland currency units, except per share amounts)
Illustrative Corporation Group: Example Consolidated Financial Statements 67
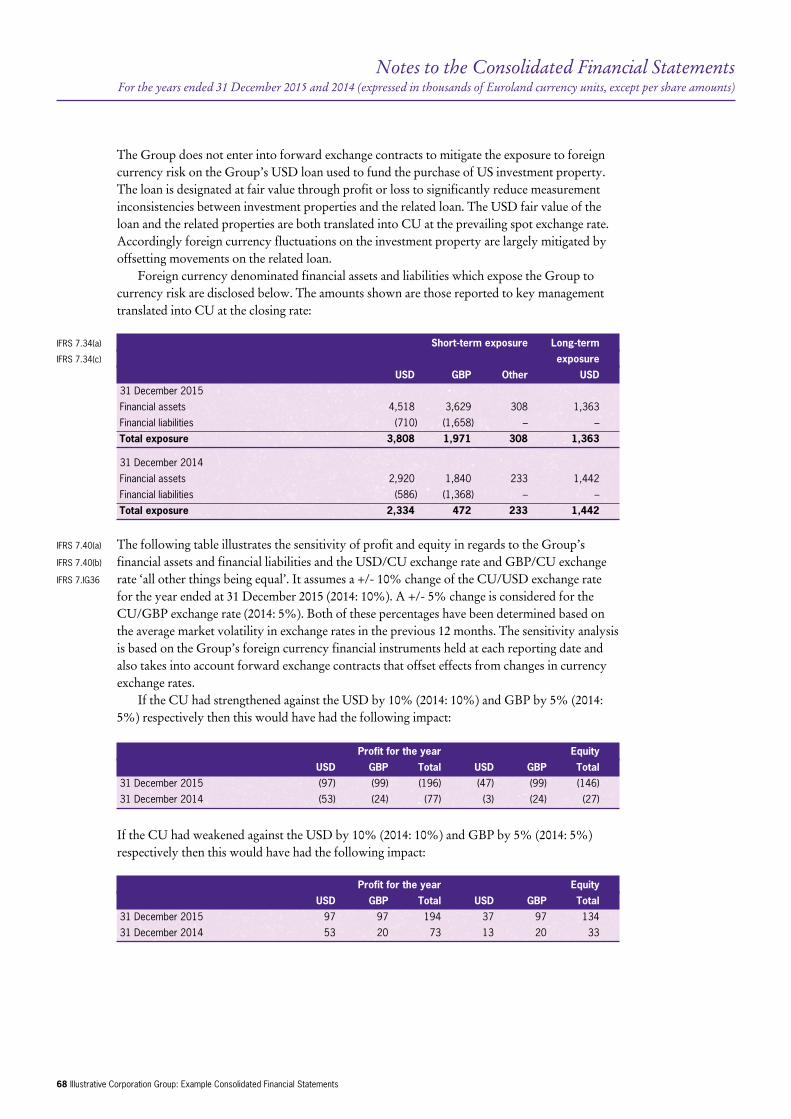
Notes to the Consolidated Financial StatementsFor the years ended 31 December 2015 and 2014 (expressed in thousands of Euroland currency units, except per share amounts)
68 Illustrative Corporation Group: Example Consolidated Financial Statements
The Group does not enter into forward exchange contracts to mitigate the exposure to foreign currency risk on the Group’s USD loan used to fund the purchase of US investment property. The loan is designated at fair value through profit or loss to significantly reduce measurement inconsistencies between investment properties and the related loan. The USD fair value of the loan and the related properties are both translated into CU at the prevailing spot exchange rate. Accordingly foreign currency fluctuations on the investment property are largely mitigated by offsetting movements on the related loan.
Foreign currency denominated financial assets and liabilities which expose the Group to currency risk are disclosed below. The amounts shown are those reported to key management translated into CU at the closing rate:
IFRS 7.34(a) Short-term exposure Long-term IFRS 7.34(c) exposure USD GBP Other USD 31 December 2015
Financial assets 4,518 3,629 308 1,363
Financial liabilities (710) (1,658) – –
Total exposure 3,808 1,971 308 1,363
31 December 2014
Financial assets 2,920 1,840 233 1,442
Financial liabilities (586) (1,368) – –
Total exposure 2,334 472 233 1,442
IFRS 7.40(a) The following table illustrates the sensitivity of profit and equity in regards to the Group’s IFRS 7.40(b) financial assets and financial liabilities and the USD/CU exchange rate and GBP/CU exchange IFRS 7.IG36 rate ‘all other things being equal’. It assumes a +/- 10% change of the CU/USD exchange rate
for the year ended at 31 December 2015 (2014: 10%). A +/- 5% change is considered for the CU/GBP exchange rate (2014: 5%). Both of these percentages have been determined based on the average market volatility in exchange rates in the previous 12 months. The sensitivity analysis is based on the Group’s foreign currency financial instruments held at each reporting date and also takes into account forward exchange contracts that offset effects from changes in currency exchange rates.
If the CU had strengthened against the USD by 10% (2014: 10%) and GBP by 5% (2014: 5%) respectively then this would have had the following impact:
Profit for the year Equity USD GBP Total USD GBP Total 31 December 2015 (97) (99) (196) (47) (99) (146)
31 December 2014 (53) (24) (77) (3) (24) (27)
If the CU had weakened against the USD by 10% (2014: 10%) and GBP by 5% (2014: 5%) respectively then this would have had the following impact:
Profit for the year Equity USD GBP Total USD GBP Total 31 December 2015 97 97 194 37 97 134
31 December 2014 53 20 73 13 20 33

IFRS 7.42 Exposures to foreign exchange rates vary during the year depending on the volume of overseas transactions. Nonetheless, the analysis above is considered to be representative of the Group’s exposure to currency risk.
IFRS 7.33(a) Interest rate sensitivityIFRS 7.33(b) The Group’s policy is to minimise interest rate cash flow risk exposures on long-term financing. Longer-term borrowings are therefore usually at fixed rates. At 31 December 2015, the Group
is exposed to changes in market interest rates through bank borrowings at variable interest rates. Other borrowings are at fixed interest rates. The Group’s investments in bonds all pay fixed interest rates. The exposure to interest rates for the Group’s money market funds is considered immaterial.
IFRS 7.40(b) The following table illustrates the sensitivity of profit and equity to a reasonably possible IFRS 7.IG36 change in interest rates of +/- 1% (2014: +/- 1%). These changes are considered to be reasonably
possible based on observation of current market conditions. The calculations are based on a change in the average market interest rate for each period, and the financial instruments held at each reporting date that are sensitive to changes in interest rates. All other variables are held constant.
Profit for the year Equity +1% -1% +1% -1%
IFRS 7.40(a) 31 December 2015 36 (36) 26 (16)
31 December 2014 32 (32) 23 (14)
IFRS 7.33(a) Other price sensitivity The Group is exposed to other price risk in respect of its listed equity securities, the investment
in XY Ltd and debentures (see Note 14.3). IFRS 7.40(a) For the listed equity securities, an average volatility of 20% has been observed during 2015 IFRS 7.40(b) (2014: 18%). This volatility figure is considered to be a suitable basis for estimating how profit
or loss and equity would have been affected by changes in market risk that were reasonably possible at the reporting date. If the quoted stock price for these securities increased or decreased by that amount, other comprehensive income and equity would have changed by CU 85 (2014: CU 62). The listed securities are classified as AFS so there would be no effect on profit or loss unless any decline in fair value below cost is determined to be an impairment (for example if the decline is significant or prolonged).
IFRS 7.40(b) The Group’s sensitivity to price risk in regards to its investment in XY Ltd cannot be reliably determined due to numerous uncertainties regarding the future development of this company (see Note 14.3 for further information).
IFRS 7.33(b) The investments in listed equity securities and in XY Ltd are considered long-term, strategic investments. In accordance with the Group’s policies, no specific hedging activities are undertaken in relation to these investments. The investments are continuously monitored and voting rights arising from these equity instruments are utilised in the Group’s favour.
IFRS 7.40(a) The average volatility of the listed debentures was 15% in 2015 (2014: 13%). If the market IFRS 7.40(b) price had increased or decreased by this amount, other comprehensive income and equity would
have increased/decreased by CU 15 (2014: CU 15). As none of the debentures classified as AFS were sold during any of the periods under review, no effect on profit or loss would have occurred (unless any decline in fair value to below cost is considered to result from impairment of the asset).
Notes to the Consolidated Financial StatementsFor the years ended 31 December 2015 and 2014 (expressed in thousands of Euroland currency units, except per share amounts)
Illustrative Corporation Group: Example Consolidated Financial Statements 69
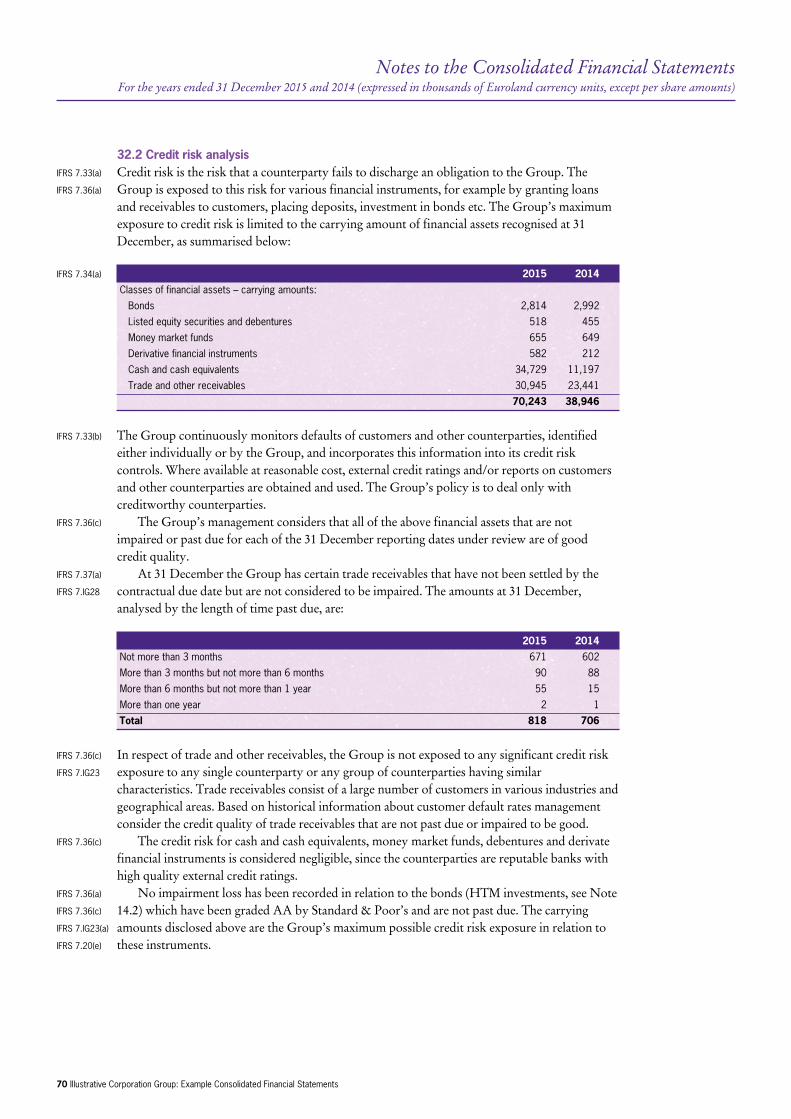
Notes to the Consolidated Financial StatementsFor the years ended 31 December 2015 and 2014 (expressed in thousands of Euroland currency units, except per share amounts)
70 Illustrative Corporation Group: Example Consolidated Financial Statements
32.2 Credit risk analysisIFRS 7.33(a) Credit risk is the risk that a counterparty fails to discharge an obligation to the Group. The IFRS 7.36(a) Group is exposed to this risk for various financial instruments, for example by granting loans
and receivables to customers, placing deposits, investment in bonds etc. The Group’s maximum exposure to credit risk is limited to the carrying amount of financial assets recognised at 31 December, as summarised below:
IFRS 7.34(a) 2015 2014 Classes of financial assets – carrying amounts:
Bonds 2,814 2,992
Listed equity securities and debentures 518 455
Money market funds 655 649
Derivative financial instruments 582 212
Cash and cash equivalents 34,729 11,197
Trade and other receivables 30,945 23,441
70,243 38,946
IFRS 7.33(b) The Group continuously monitors defaults of customers and other counterparties, identified either individually or by the Group, and incorporates this information into its credit risk controls. Where available at reasonable cost, external credit ratings and/or reports on customers and other counterparties are obtained and used. The Group’s policy is to deal only with creditworthy counterparties.
IFRS 7.36(c) The Group’s management considers that all of the above financial assets that are not impaired or past due for each of the 31 December reporting dates under review are of good credit quality.
IFRS 7.37(a) At 31 December the Group has certain trade receivables that have not been settled by the IFRS 7.IG28 contractual due date but are not considered to be impaired. The amounts at 31 December,
analysed by the length of time past due, are:
2015 2014 Not more than 3 months 671 602
More than 3 months but not more than 6 months 90 88
More than 6 months but not more than 1 year 55 15
More than one year 2 1
Total 818 706
IFRS 7.36(c) In respect of trade and other receivables, the Group is not exposed to any significant credit risk IFRS 7.IG23 exposure to any single counterparty or any group of counterparties having similar
characteristics. Trade receivables consist of a large number of customers in various industries and geographical areas. Based on historical information about customer default rates management consider the credit quality of trade receivables that are not past due or impaired to be good.
IFRS 7.36(c) The credit risk for cash and cash equivalents, money market funds, debentures and derivate financial instruments is considered negligible, since the counterparties are reputable banks with high quality external credit ratings.
IFRS 7.36(a) No impairment loss has been recorded in relation to the bonds (HTM investments, see Note IFRS 7.36(c) 14.2) which have been graded AA by Standard & Poor’s and are not past due. The carrying IFRS 7.IG23(a) amounts disclosed above are the Group’s maximum possible credit risk exposure in relation to IFRS 7.20(e) these instruments.

32.3 Liquidity risk analysisIFRS 7.33(a) Liquidity risk is that the Group might be unable to meet its obligations. The Group manages IFRS 7.33(b) its liquidity needs by monitoring scheduled debt servicing payments for long-term financial IFRS 7.39(c) liabilities as well as forecast cash inflows and outflows due in day-to-day business. The data used
for analysing these cash flows is consistent with that used in the contractual maturity analysis below. Liquidity needs are monitored in various time bands, on a day-to-day and week-to-week basis, as well as on the basis of a rolling 30-day projection. Long-term liquidity needs for a 180-day and a 360-day lookout period are identified monthly. Net cash requirements are compared to available borrowing facilities in order to determine headroom or any shortfalls. This analysis shows that available borrowing facilities are expected to be sufficient over the lookout period.
IFRS 7.39(c) The Group’s objective is to maintain cash and marketable securities to meet its liquidity IFRS 7.B11F requirements for 30-day periods at a minimum. This objective was met for the reporting
periods. Funding for long-term liquidity needs is additionally secured by an adequate amount of committed credit facilities and the ability to sell long-term financial assets.
The Group considers expected cash flows from financial assets in assessing and managing liquidity risk, in particular its cash resources and trade receivables. The Group’s existing cash resources and trade receivables (see Note 14) significantly exceed the current cash outflow requirements. Cash flows from trade and other receivables are all contractually due within six months.
As at 31 December 2015, the Group’s non-derivative financial liabilities have contractual maturities (including interest payments where applicable) as summarised below:
IFRS 7.39(a) 31 December 2015 Current Non-currentIFRS 7.B11 within 6 6 to 12 1 to 5 later than months months years 5 years US-dollar loans 280 280 1,761 8,215
Other bank borrowings 4,565 – – –
Non-convertible bond 208 208 8,888 –
Finance lease obligations 364 364 1,415 3,539
Trade and other payables 8,547 – – –
Total 13,964 852 12,064 11,754
This compares to the maturity of the Group’s non-derivative financial liabilities in the previous
reporting periods as follows:
IFRS 7.39(a) 31 December 2014 Current Non-currentIFRS 7.B11 within 6 6 to 12 1 to 5 later than months months years 5 years US-dollar loans 289 289 1,781 8,508
Other bank borrowings 3,124 – – –
Non-convertible bond 208 208 9,303 –
Finance lease obligations 363 363 1,432 4,072
Trade and other payables 6,590 – – –
Total 10,574 860 12,516 12,580
Notes to the Consolidated Financial StatementsFor the years ended 31 December 2015 and 2014 (expressed in thousands of Euroland currency units, except per share amounts)
Illustrative Corporation Group: Example Consolidated Financial Statements 71

Notes to the Consolidated Financial StatementsFor the years ended 31 December 2015 and 2014 (expressed in thousands of Euroland currency units, except per share amounts)
72 Illustrative Corporation Group: Example Consolidated Financial Statements
The above amounts reflect the contractual undiscounted cash flows, which may differ to the carrying values of the liabilities at the reporting date. The subordinated shareholder loan amounting to CU 5,000 throughout all reporting periods is not included as this is only repayable upon liquidation of Illustrative Corporation. Annual interest payments amount to CU 200.
In assessing and managing liquidity risks of its derivative financial instruments, the Group considers both contractual inflows and outflows. As at 31 December 2015, the contractual cash flows of the Group’s derivative financial assets and liabilities are as follows:
IFRS 7.39(b) 31 December 2015 CurrentIFRS 7.B11 within 6 6 to 12 months months Gross-settled forward contracts
Cash outflow (212) (6,978)
Cash inflow 300 7,509
Total 88 531
IFRS 7.34(a) This compares to the contractual cash flows of the Group’s derivative financial assets and liabilities in the previous reporting periods as follows:
IFRS 7.39(b) 31 December 2014 CurrentIFRS 7.B11 within 6 6 to 12 months months Gross-settled forward contracts
Cash outflow (190) (7,100)
Cash inflow 203 7,050
Total 13 (50)
Derivative financial instruments reflect forward exchange contracts (see Note 14.5) that will be settled on a gross basis.
33. Fair value measurement
33.1 Fair value measurement of financial instruments Financial assets and financial liabilities measured at fair value in the statement of financial
position are grouped into three Levels of a fair value hierarchy. The three Levels are defined based on the observability of significant inputs to the measurement, as follows:
• Level 1: quoted prices (unadjusted) in active markets for identical assets or liabilities • Level 2: inputs other than quoted prices included within Level 1 that are observable for the
asset or liability, either directly or indirectly • Level 3: unobservable inputs for the asset or liability.
The following table shows the Levels within the hierarchy of financial assets and liabilities measured at fair value on a recurring basis at 31 December 2015, 31 December 2014, and 1 January 2014:
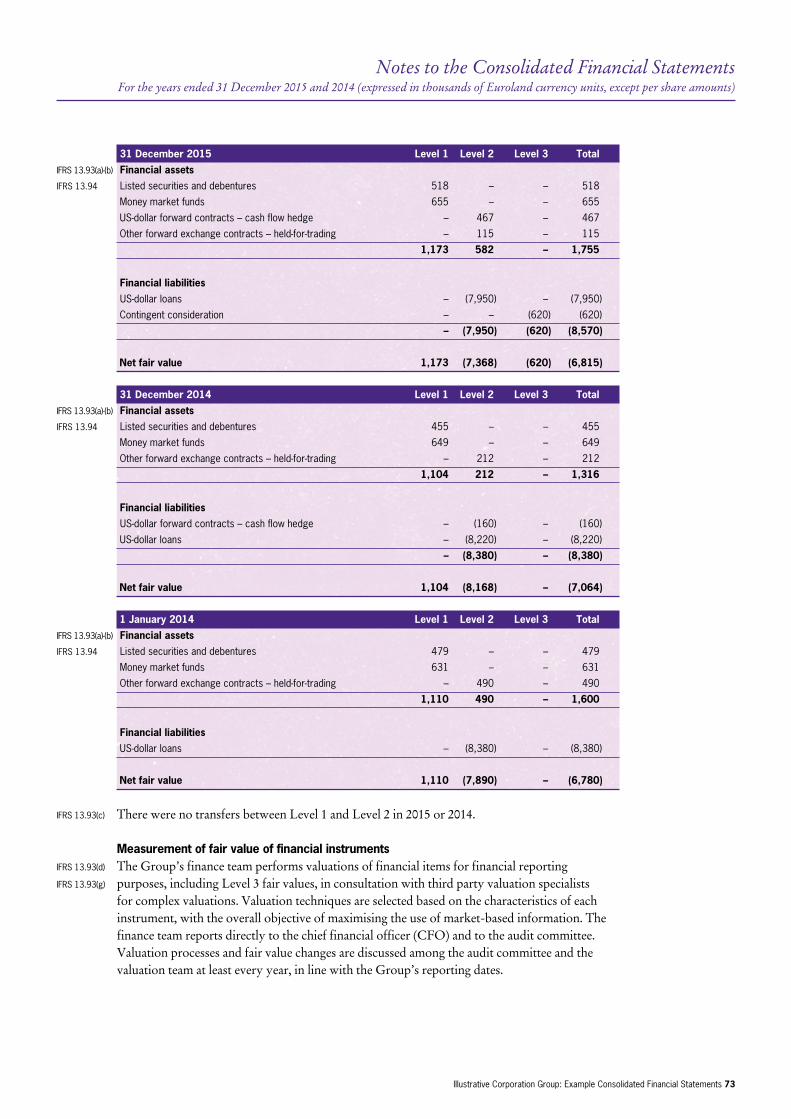
31 December 2015 Level 1 Level 2 Level 3 TotalIFRS 13.93(a)-(b) Financial assets IFRS 13.94 Listed securities and debentures 518 – – 518
Money market funds 655 – – 655
US-dollar forward contracts – cash flow hedge – 467 – 467
Other forward exchange contracts – held-for-trading – 115 – 115
1,173 582 – 1,755
Financial liabilities US-dollar loans – (7,950) – (7,950)
Contingent consideration – – (620) (620)
– (7,950) (620) (8,570)
Net fair value 1,173 (7,368) (620) (6,815) 31 December 2014 Level 1 Level 2 Level 3 TotalIFRS 13.93(a)-(b) Financial assets IFRS 13.94 Listed securities and debentures 455 – – 455
Money market funds 649 – – 649
Other forward exchange contracts – held-for-trading – 212 – 212
1,104 212 – 1,316
Financial liabilities US-dollar forward contracts – cash flow hedge – (160) – (160)
US-dollar loans – (8,220) – (8,220)
– (8,380) – (8,380)
Net fair value 1,104 (8,168) – (7,064) 1 January 2014 Level 1 Level 2 Level 3 TotalIFRS 13.93(a)-(b) Financial assets IFRS 13.94 Listed securities and debentures 479 – – 479
Money market funds 631 – – 631
Other forward exchange contracts – held-for-trading – 490 – 490
1,110 490 – 1,600
Financial liabilities US-dollar loans – (8,380) – (8,380)
Net fair value 1,110 (7,890) – (6,780)
IFRS 13.93(c) There were no transfers between Level 1 and Level 2 in 2015 or 2014.
Measurement of fair value of financial instrumentsIFRS 13.93(d) The Group’s finance team performs valuations of financial items for financial reporting IFRS 13.93(g) purposes, including Level 3 fair values, in consultation with third party valuation specialists
for complex valuations. Valuation techniques are selected based on the characteristics of each instrument, with the overall objective of maximising the use of market-based information. The finance team reports directly to the chief financial officer (CFO) and to the audit committee. Valuation processes and fair value changes are discussed among the audit committee and the valuation team at least every year, in line with the Group’s reporting dates.
Notes to the Consolidated Financial StatementsFor the years ended 31 December 2015 and 2014 (expressed in thousands of Euroland currency units, except per share amounts)
Illustrative Corporation Group: Example Consolidated Financial Statements 73

Notes to the Consolidated Financial StatementsFor the years ended 31 December 2015 and 2014 (expressed in thousands of Euroland currency units, except per share amounts)
74 Illustrative Corporation Group: Example Consolidated Financial Statements
The valuation techniques used for instruments categorised in Levels 2 and 3 are described below:
Foreign currency forward contracts (Level 2) The Group’s foreign currency forward contracts are not traded in active markets. These have
been fair valued using observable forward exchange rates and interest rates corresponding to the maturity of the contract. The effects of non-observable inputs are not significant for foreign currency forward contracts.
US-dollar loans (Level 2) The fair values of the US-dollar loans are estimated using a discounted cash flow approach,
which discounts the contractual cash flows using discount rates derived from observable market interest rates of similar loans with similar risk. The interest rate used for this calculation is 3.9% (2014 – 3.9%).
Contingent consideration (Level 3)IFRS 13.93(d) The fair value of contingent consideration related to the acquisition of Goodtech (see Note 5.1) IFRS 13.93(h) is estimated using a present value technique. The CU 620 fair value is estimated by probability-
weighting the estimated future cash outflows, adjusting for risk and discounting at 4.4%. The probability-weighted cash outflows before discounting are CU 655 and reflect management’s estimate of a 50% probability that the contract’s target level will be achieved. The discount rate used is 4.4%, based on the Group’s estimated incremental borrowing rate for unsecured liabilities at the reporting date, and therefore reflects the Group’s credit position. The effects on the fair value of risk and uncertainty in the future cash flows are dealt with by adjusting the estimated cash flows rather than adjusting the discount rate.
The following table provides information about the sensitivity of the fair value measurement to changes in the most significant inputs:
Significant Estimate of Sensitivity of the fair value measurement to input unobservable input the input Probability of meeting 50% An increase to 60% (decrease to 40%) would increase (decrease)
target fair value by CU 125.
Level 3 fair value measurements The reconciliation of the carrying amounts of financial instruments classified within Level 3 is as
follows:
Contingent consideration 2015 2014IFRS 13.93(e) Balance at 1 January 2015 – –
IFRS 13.93 (e)(iii) Acquired through business combination (600) –
IFRS 13.93(e)(i) Amount recognised in profit or loss under finance costs (20) –
Balance at 31 December 2015 (620) –
IFRS 13.93(f) Total amount included in profit or loss for unrealised losses (20) –
on Level 3 instruments under finance costs
Financial instruments measured at amortised cost for which the fair value is disclosedIFRS 13.97 See Notes 14.2 and 14.6.

33.2 Fair value measurement of non-financial assets The following table shows the Levels within the hierarchy of non-financial assets measured at
fair value on a recurring basis at 31 December 2015, 31 December 2014, and 1 January 2014:
IFRS 13.93 31 December 2015 Level 1 Level 2 Level 3 Total(a)-(b) IFRS 13.94 Property, plant and equipment: land held for production in Euroland – – 7,979 7,979
Goodtech land – – 730 730
Investment property: office building in Euroland – – 4,552 4,552
Goodtech investment property – – 75 75
office building in the US – – 8,035 8,035
IFRS 13.93 31 December 2014 Level 1 Level 2 Level 3 Total(a)-(b) IFRS 13.94 Property, plant and equipment: land held for production in Euroland – – 7,697 7,697
Goodtech land – – – –
Investment property: office building in Euroland – – 4,366 4,366
office building in the US – – 7,911 7,911
IFRS 13.93 1 January 2014 Level 1 Level 2 Level 3 Total(a)-(b) IFRS 13.94 Property, plant and equipment: land held for production in Euroland – – 7,697 7,697
Goodtech land – – – –
Investment property: office building in Euroland – – 4,293 4,293
office building in the US – – 7,809 7,809
IFRS 13.93(d) Fair value of the Group’s main property assets is estimated based on appraisals performed by IAS 40.75(e) independent, professionally-qualified property valuers. The significant inputs and assumptions IAS 16.77(b) are developed in close consultation with management. The valuation processes and fair value
changes are reviewed by the board of directors and audit committee at each reporting date. Further information is set out below.
Land held for production in Euroland (Level 3)IFRS 13.93(d) The appraisal was carried out using a market approach that reflects observed prices for recent IFRS 13.93(g) market transactions for similar properties and incorporates adjustments for factors specific to the IAS 16.77(a) land in question, including plot size, location, encumbrances and current use. In 2015, a negative adjustment of 7.5% was incorporated for these factors. The land was revalued on 23 November
2015. The land was previously revalued in November 2012. IFRS 13.93(h) The significant unobservable input is the adjustment for factors specific to the land in
question. The extent and direction of this adjustment depends on the number and characteristics of the observable market transactions in similar properties that are used as the starting point for valuation. Although this input is a subjective judgement, management considers that the overall valuation would not be materially affected by reasonably possible alternative assumptions.
IFRS 13.93(d) Land with a fair value of CU 730, recognised upon the acquisition of Goodtech in March 2015 (see Note 5.1), was not revalued at the reporting date. Management determined that the effect of changes in fair values between the acquisition and reporting date is immaterial.
Notes to the Consolidated Financial StatementsFor the years ended 31 December 2015 and 2014 (expressed in thousands of Euroland currency units, except per share amounts)
Illustrative Corporation Group: Example Consolidated Financial Statements 75

Notes to the Consolidated Financial StatementsFor the years ended 31 December 2015 and 2014 (expressed in thousands of Euroland currency units, except per share amounts)
76 Illustrative Corporation Group: Example Consolidated Financial Statements
Office buildings in Euroland and the US (Level 3)IFRS 13.93(d) The fair values of the office buildings are estimated using an income approach which capitalises
the estimated rental income stream, net of projected operating costs, using a discount rate derived from market yields implied by recent transactions in similar properties. When actual rent differs materially from the estimated rents, adjustments has been made to the estimated rental value. The estimated rental stream takes into account current occupancy level, estimates of future vacancy levels, the terms of in-place leases and expectations for rentals from future leases over the remaining economic life of the buildings. The office buildings are revalued annually on 31 December.
IFRS 13.93(h) The most significant inputs, all of which are unobservable, are the estimated rental value, assumptions about vacancy levels, and the discount rate. The estimated fair value increases if the estimated rental increases, vacancy levels decline or if discount rate (market yields) decline. The overall valuations are sensitive to all three assumptions. Management considers the range of reasonably possible alternative assumptions is greatest for rental values and vacancy levels and that there is also an interrelationship between these inputs. The inputs used in the valuations at 31 December 2015 were:
Euroland US Rental value CU 108/sqm USD 65/sqm
Vacancy levels 9% 11%
Discount rate (market yield) 4.4% 3.7%
IFRS 13.93(d) An investment property with a fair value of CU 75, recognised upon the acquisition of Goodtech (see Note 5.1) in March 2015, was not revalued at the reporting date. Management determined that the effect of changes in fair values between the acquisition and reporting date is immaterial.
The reconciliation of the carrying amounts of non-financial assets classified within Level 3 is as follows:
PP&E Investment properties Land held Euroland US for production IFRS 13.93(e) Balance at 1 January 2015 7,697 4,366 7,911
IFRS 13.93(e)(i) Gains recognised in profit or loss:
increase in fair value of investment property – 186 124
IFRS 13.93(e)(ii) Gains recognised in other comprehensive income:
revaluation of land 303 – –
exchange differences on translating foreign operations (21) – –
IFRS 13.93(e)(iii) Acquired in business combination 730 75 –
Balance at 31 December 2015 8,709 4,627 8,035
IFRS 13.93(f) Total amount included in profit or loss for unrealised gains on Level 3 assets – 186 124

PP&E Investment properties Land held Euroland US for production IFRS 13.93(e) Balance at 1 January 2014 7,697 4,293 7,809
IFRS 13.93(e)(i) Gains recognised in profit or loss:
increase in fair value of investment property – 73 102
IFRS 13.93(e)(ii) Gains recognised in other comprehensive income:
revaluation of land – – –
exchange differences on translating foreign operations – – –
Balance at 31 December 2014 7,697 4,366 7,911
IFRS 13.93(f) Total amount included in profit or loss for unrealised gains on Level 3 assets – 73 102
34. Capital management policies and procedures
IAS 1.134 The Group’ s capital management objectives are: • to ensure the Group’s ability to continue as a going concern • to provide an adequate return to shareholders
by pricing products and services commensurately with the level of risk.IAS 1.135(a)(i) The Group monitors capital on the basis of the carrying amount of equity plus its
subordinated loan, less cash and cash equivalents as presented on the face of the statement of financial position and cash flow hedges recognised in other comprehensive income.
IAS 1.135(a)(ii) The Group’s goal in capital management is to maintain a capital-to-overall financing ratio of 1:6 to 1:4. This is in line with the Group’s covenants resulting included in the terms of the subordinated loan from its main shareholder advanced in 2011 (see Note 14.6).
IAS 1.135(a)(iii) Management assesses the Group’s capital requirements in order to maintain an efficient overall financing structure while avoiding excessive leverage. This takes into account the subordination levels of the Group’s various classes of debt. The Group manages the capital structure and makes adjustments to it in the light of changes in economic conditions and the risk characteristics of the underlying assets. In order to maintain or adjust the capital structure, the Group may adjust the amount of dividends paid to shareholders, return capital to shareholders, issue new shares, or sell assets to reduce debt.
The amounts managed as capital by the Group for the reporting periods under review are summarised as follows:
IAS 1.135(b) 2015 2014 Total equity 88,242 54,009
Subordinated loan 5,000 5,000
Cash flow hedges (469) 160
Cash and cash equivalents (34,729) (11,197)
Capital 58,044 47,972
Total equity 88,242 54,009
Borrowings 25,815 24,644
Overall financing 114,057 78,653
Capital-to-overall financing ratio 0.51 0.61
Notes to the Consolidated Financial StatementsFor the years ended 31 December 2015 and 2014 (expressed in thousands of Euroland currency units, except per share amounts)
Illustrative Corporation Group: Example Consolidated Financial Statements 77

Notes to the Consolidated Financial StatementsFor the years ended 31 December 2015 and 2014 (expressed in thousands of Euroland currency units, except per share amounts)
78 Illustrative Corporation Group: Example Consolidated Financial Statements
IAS 1.135(d) The Group has honoured its covenant obligations, including maintaining capital ratios, since the subordinated loan was taken out in 2011. The ratio-reduction during 2015 is primarily a result of financing the acquisition of Goodtech (see Note 5.1).
35. Post-reporting date events
IAS 10.3 No adjusting or significant non-adjusting events have occurred between the 31 December reporting date and the date of authorisation.
36. Authorisation of financial statements
IAS 10.17 The consolidated financial statements for the year ended 31 December 2015 (including comparatives) were approved by the board of directors on 8 March 2016.
C Executive C Finance (Board member 1) (Board member 2)

AppendicesInternational Financial Reporting Standards (IFRSs)Illustrative Corporation Group31 December 2015
Illustrative Corporation Group: Example Consolidated Financial Statements 79

Appendix A: Organising the statement of profit or loss by function of expenses
IAS 1.99 IAS 1.99 allows a statement of profit or loss format analysing expenses using a classification based on either the nature of expenses (NOE) or based on the function of expenses (FOE) within the entity. This depends on management’s assessment of which format provides information that is reliable and more relevant.
The NOE format is illustrated in the main body of the Example financial statements. The FOE format is illustrated in this appendix. This appendix presents a separate statement of profit or loss, ie other comprehensive income is presented in a separate statement of comprehensive income (see the main body of the Example financial statements).
If the entity presents a single statement of comprehensive income (see Appendix B), the FOE format included in this appendix may replace the NOE format presented in in Appendix B.
The FOE or NOE formats do not affect the presentation requirements for other comprehensive income. Only the statement of profit or loss is affected.
Presenting the statement of profit or loss in the FOE format requires additional considerations:
IAS 1.104 • additional disclosures of the nature of certain expenses are required, including employee benefit expenses and depreciation, amortisation and impairment of non-financial assets
• the disclosures of the specific line items in the statement of profit or loss where certain transactions or amounts are recognised (for example, see Note 9, Note 10 and Note 21 of the Example financial statements) should reflect the actual line items presented in the FOE statement of profit or loss.
In addition, when an entity includes the analysis of profit or loss from a discontinued operation in the notes to the financial statements (see Note 19), such information should be presented in the same format as the main statement of profit or loss. This will facilitate a better understanding of the financial effects of the discontinued operations.
80 Illustrative Corporation Group: Example Consolidated Financial Statements

Consolidated statement of profit or loss
IAS 1.51(c) Notes 2015 2014IAS 1.51(d-e) IAS 1.82(a) Revenue 8 205,793 191,228
IAS 1.85 Costs of sales (109,342) (103,292)
IAS 1.85 Gross profit 96,451 87,936 IAS 1.85 Other income 427 641
IAS 1.85 Distribution costs (12,213) (11,473)
IAS 1.85 Administrative expenses (48,853) (45,894)
IAS 1.85 Research and development costs (1,690) (1,015)
IAS 1.85 Change in fair value of investment property 13 310 175
IAS 1.85 Other expenses (12,878) (11,276)
Operating profit 21,554 19,094
IAS 1.82(c) Share of profit from equity accounted investments 7 391 141
IAS 1.82(b) Finance costs 25 (1,490) (1,876)
IAS 1.85 Finance income 25 994 793
IAS 1.85 Other financial items 26 943 1,182
Profit before tax 22,392 19,334
IAS 1.82(d) Tax expense 27 (6,910) (5,763)
Profit for the year from continuing operations 15,482 13,571IAS 1.82(ea) Loss for the year from discontinued operations 19 (9) (325)
IAS 1.81A(a) Profit for the year 15,473 13,246
Profit for the year attributable to: IAS 1.81B(a)(i) Non-controlling interest 121 116
IAS 1.81B(a)(ii) Owners of the parent 15,352 13,130
15,473 13,246
CU CU Earnings per share 28
IAS 33.67A Basic earnings (loss) per share
IAS 33.66 Earnings from continuing operations 1.22 1.14
IAS 33.68A Loss from discontinued operations (0.00) (0.03)
IAS 33.66 Total 1.22 1.11
IAS 33.67A Diluted earnings (loss) per share IAS 33.66 Earnings from continuing operations 1.22 1.14
IAS 33.68A Loss from discontinued operations (0.00) (0.03)
IAS 33.66 Total 1.22 1.11
Illustrative Corporation Group: Example Consolidated Financial Statements 81

Appendix B: Statement of comprehensive income presented in a single statement
The main body in these Example financial statements presents the statement of comprehensive income in two statements (see guidance note to the consolidated statement of profit or loss). In this appendix, the alternative of presenting a single statement of comprehensive income is presented (using the NOE format).
Disclosure requirements, however, remain unchanged (see guidance note to the consolidated statement of comprehensive income).
In general, notes to the financial statements will need to be tailored so that they refer to the statement of comprehensive income and not the statement of profit or loss, where appropriate. For example tailoring is necessary to reflect that discontinued operations are shown as a separate line item in the statement of comprehensive income (see Note 4.10). However, it should be noted that the term profit or loss continues to apply.
The illustrative single statement of comprehensive income is shown below.
Consolidated statement of comprehensive income
IAS 1.51(c) Notes 2015 2014IAS 1.51(d-e) IAS 1.82(a) Revenue 8 205,793 191,228
IAS 1.85 Other income 427 641
IAS 1.85 Changes in inventories (7,923) (5,623)
IAS 1.85 Costs of material (42,434) (40,485)
IAS 1.85 Employee benefits expense 21 (113,809) (109,515)
IAS 1.85 Change in fair value of investment property 13 310 175
IAS 1.85 Depreciation, amortisation and impairment of non-financial assets (7,932) (6,051)
IAS 1.85 Other expenses (12,878) (11,276)
Operating profit 21,554 19,094
IAS 1.82(c) Share of profit from equity accounted investments 7 391 141
IAS 1.82(b) Finance costs 25 (1,490) (1,876)
IAS 1.85 Finance income 25 994 793
IAS 1.85 Other financial items 26 943 1,182
Profit before tax 22,392 19,334
IAS 1.82(d) Tax expense 27 (6,910) (5,763)
Profit for the year from continuing operations 15,482 13,571IAS 1.82(ea) Loss for the year from discontinued operations 19 (9) (325)
IAS 1.81A(a) Profit for the year 15,473 13,246
82 Illustrative Corporation Group: Example Consolidated Financial Statements

Other comprehensive income:IAS 1.82A(a) Items that will not be reclassified subsequently to profit or loss IAS 16.77(f) Revaluation of land 11 303 –
IAS 19.120(c) Remeasurement of net defined benefit liability 21 3,830 (3,541)
IAS 1.90/91(b) Income tax relating to items not reclassified 15 (1,240) 1,062
IAS 1.82A(b) Items that will be reclassified subsequently to profit or loss Cash flow hedging 14
IFRS 7.23(c-d) current year gains (losses) 367 (47)
IAS 1.92 reclassification to profit or loss 260 (425)
Available-for-sale financial assets 14
IFRS 7.20(a)(ii) current year gains (losses) 113 35
IAS 1.92 reclassification to profit or loss (50) –
IAS 21.52(b) Exchange differences on translating foreign operations (664) (341)
IAS 1.82A Share of other comprehensive income of equity accounted investments 7 5 –
IAS 1.92 reclassification to profit or loss (3) –
IAS 1.90/91(b) Income tax relating to items that will be reclassified 15 176 95
IAS 1.81A Other comprehensive income for the year, net of tax 3,097 (3,162)
IAS 1.81A Total comprehensive income for the year 18,570 10,084
Profit for the year attributable to: IAS 1.81B(a)(i) Non-controlling interest 121 116
IAS 1.81B(a)(ii) Owners of the parent 15,352 13,130
15,473 13,246
Total comprehensive income attributable to: IAS 1.81B(b)(i) Non-controlling interest 121 116
IAS 1.81B(b)(ii) Owners of the parent 18,449 9,968
18,570 10,084
CU CU Earnings per share 28
IAS 33.67A Basic earnings (loss) per share
IAS 33.66 Earnings from continuing operations 1.22 1.14
IAS 33.68A Loss from discontinued operations (0.00) (0.03)
IAS 33.66 Total 1.22 1.11
IAS 33.67A Diluted earnings (loss) per share IAS 33.66 Earnings from continuing operations 1.22 1.14
IAS 33.68A Loss from discontinued operations (0.00) (0.03)
IAS 33.66 Total 1.22 1.11
Illustrative Corporation Group: Example Consolidated Financial Statements 83

www.grantthornton.global
© 2015 Grant Thornton International Ltd. “Grant Thornton” refers to the brand under which the Grant Thornton member firms provide assurance, tax and advisory services to their clients and/or refers to one or more member firms, as the context requires. “GTIL” refers to Grant Thornton International Ltd (GTIL). GTIL and each member firm of GTIL is a separate legal entity. GTIL is a non-practicing, international umbrella entity organised as a private company limited by guarantee incorporated in England and Wales. GTIL does not deliver services in its own name or at all. Services are delivered by the member firms. GTIL and its member firms are not agents of, and do not obligate, one another and are not liable for one another’s acts or omissions. The name “Grant Thornton”, the Grant Thornton logo, including the Mobius symbol/device, and “Instinct for Growth” are trademarks of GTIL. All copyright is owned by GTIL, including the copyright in the Grant Thornton logo; all rights are reserved.
Grant Thornton International Ltd is a company limited by guarantee incorporated in England and Wales.Registered number: 05523714Registered office: Grant Thornton House, 22 Melton Street, Euston Square, London NW1 2EP