Embed Size (px)
Citation preview
RIZVI INSTITE OF MANAGEMENT STUDIES & RESEARCH
COMPANY: AMARA RAJA BATTERIES
SUBMITED TO: Prof. SANJEEV PATKAR
SUBMITED BY
NAME: ABBAS BADAMI
ROLL NO.: 7
CLASS: MMS-A (FINANCE)
SEMESTER: IV
BATCH: 2011-2013
Table of Contents
Q1. 5 years Balance Sheet & Profit & Loss Account with 2years Forecasted ................... 1
Q2. Business Model & Cost Sheet as defined by Goldratt ................................................... 6
Q3. Profit Model....................................................................................................................... 8
Q4. Companies competitive position using Porters’ Model ................................................. 9
Q5. Buffets Four Tenants ...................................................................................................... 11
Q6. Business Arbitrage & Kelly’s Formula......................................................................... 14
Q7. Competition Comparison ............................................................................................... 16
Q8. FCFE, FCFF & Intrinsic Value of the Company ........................................................ 17
Q9. FCFE, FCFF & Intrinsic Value of the Company ........................................................ 19
Q10. FCFE, FCFF & Intrinsic Value of the Company ...................................................... 21
1 | P a g e
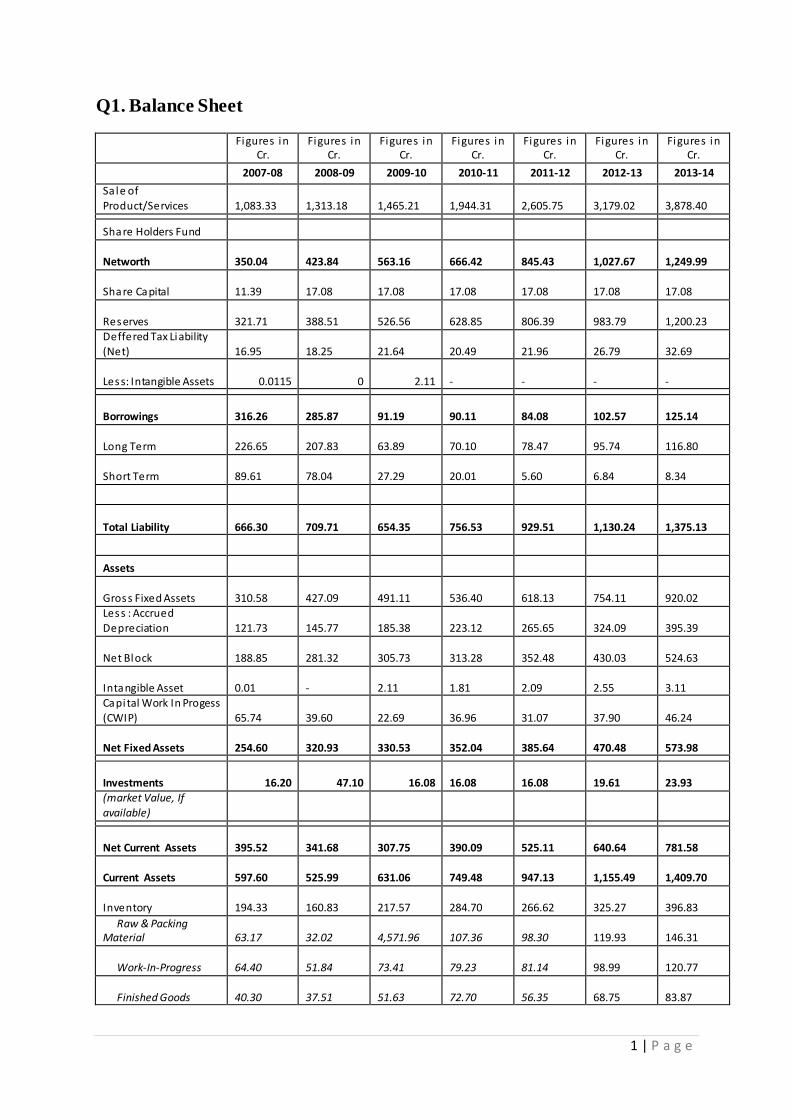
Q1. Balance Sheet
Figures in Cr.
Figures in Cr.
Figures in Cr.
Figures in Cr.
Figures in Cr.
Figures in Cr.
Figures in Cr.
2007-08 2008-09 2009-10 2010-11 2011-12 2012-13 2013-14
Sale of
Product/Services
1,083.33
1,313.18
1,465.21
1,944.31
2,605.75
3,179.02
3,878.40
Share Holders Fund
Networth
350.04
423.84
563.16
666.42
845.43
1,027.67
1,249.99
Share Capital
11.39
17.08
17.08
17.08
17.08
17.08
17.08
Reserves
321.71
388.51
526.56
628.85
806.39
983.79
1,200.23 Deffered Tax Liability (Net)
16.95
18.25
21.64
20.49
21.96
26.79
32.69
Less: Intangible Assets 0.0115 0 2.11 -
-
-
-
Borrowings
316.26
285.87
91.19
90.11
84.08
102.57
125.14
Long Term 226.65
207.83
63.89
70.10
78.47
95.74
116.80
Short Term
89.61
78.04
27.29
20.01
5.60
6.84
8.34
Total Liability 666.30
709.71
654.35
756.53
929.51
1,130.24
1,375.13
Assets
Gross Fixed Assets
310.58
427.09
491.11
536.40
618.13
754.11
920.02
Less : Accrued
Depreciation
121.73
145.77
185.38
223.12
265.65
324.09
395.39
Net Block
188.85
281.32
305.73
313.28
352.48
430.03
524.63
Intangible Asset 0.01
-
2.11
1.81
2.09
2.55
3.11
Capital Work In Progess (CWIP)
65.74
39.60
22.69
36.96
31.07
37.90
46.24
Net Fixed Assets
254.60
320.93
330.53
352.04
385.64
470.48
573.98
Investments 16.20 47.10 16.08
16.08
16.08
19.61
23.93 (market Value, If
available)
Net Current Assets 395.52
341.68
307.75
390.09
525.11
640.64
781.58
Current Assets 597.60
525.99
631.06
749.48
947.13
1,155.49
1,409.70
Inventory 194.33
160.83
217.57
284.70
266.62
325.27
396.83
Raw & Packing Material
63.17
32.02
4,571.96
107.36
98.30
119.93
146.31
Work-In-Progress 64.40
51.84
73.41
79.23
81.14
98.99
120.77
Finished Goods 40.30
37.51
51.63
72.70
56.35
68.75
83.87
2 | P a g e
Stock in Trade 12.92
24.63
27.87
2.20
4.47
5.45
6.65
Stores & Spares 13.55
14.83
18.94
22.11
25.28
30.84
37.63
Loose Tools -
-
-
0.56
0.52
0.63
0.77
Secondary Packing Material and Others
-
-
-
0.55
0.56
0.69
0.84
Debtors 226.47
207.85
242.30
307.92
320.26
390.72
476.68
more than 6 months 1.66
3.32
4.45
10.67
1.16
1.42
1.73
Cash & Bank 51.15
70.29
62.47
45.12
229.22
279.65
341.17
Loans & Advances
Long Term 108.37
11.57
14.46
14.52
12.29
14.99
18.28
Short Term 16.47
75.46
94.27
94.67
118.27
144.29
176.03
Other Current Assets 0.80
-
-
2.55
0.47
0.57
0.70
Current Liabilities
202.07
184.31
323.31
359.39
422.01
514.85
628.12
Long Term Provisions
99.34
70.51
153.45
10.42
14.62
17.83
21.76
Trade Payables -
-
4.23
105.38
88.85
108.40
132.24
Other Current Liability 102.74
113.80
165.64
96.79
112.46
137.20
167.38
Unclaimed Dividend 0.31
0.30
0.32
0.77
0.87
1.06
1.30
Employee Related
Payable
-
-
-
16.23
22.05
26.90
32.82 Outstanding
Liabilities
11.39
12.67
17.32
29.34
39.97
48.77
59.50
Short Term Provision -
-
-
146.80
206.09
251.43
306.74
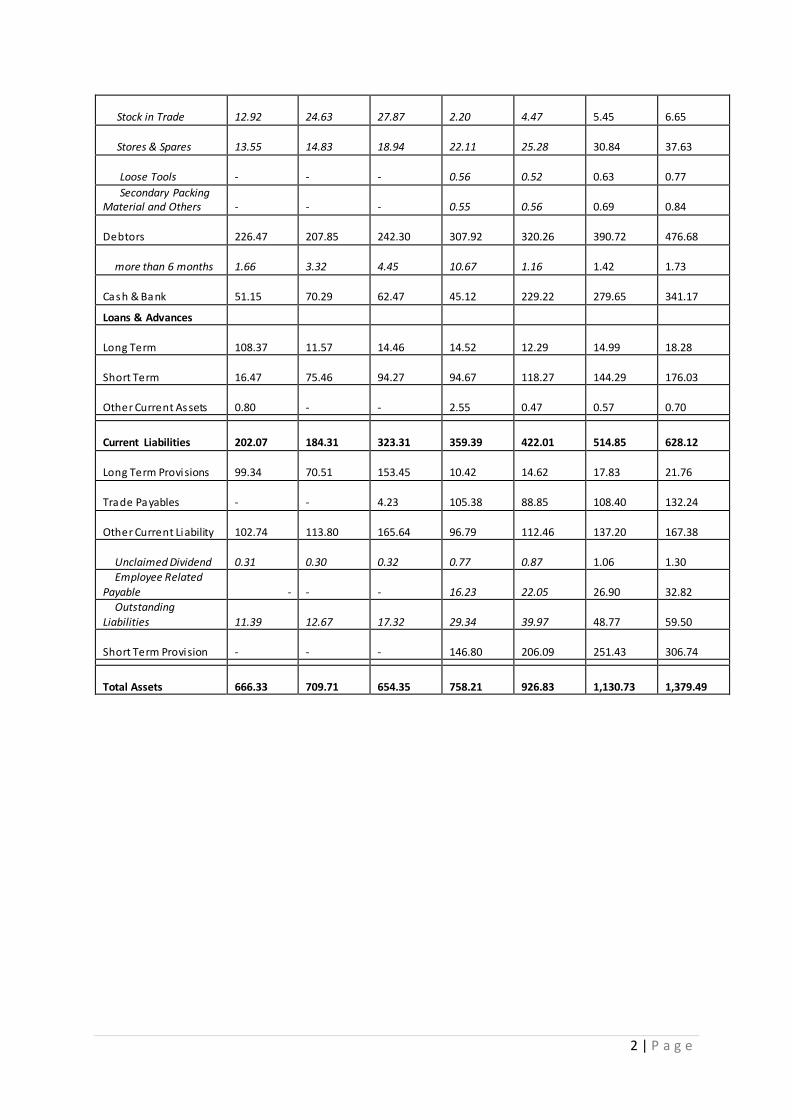
Total Assets
666.33
709.71
654.35
758.21
926.83
1,130.73
1,379.49
3 | P a g e
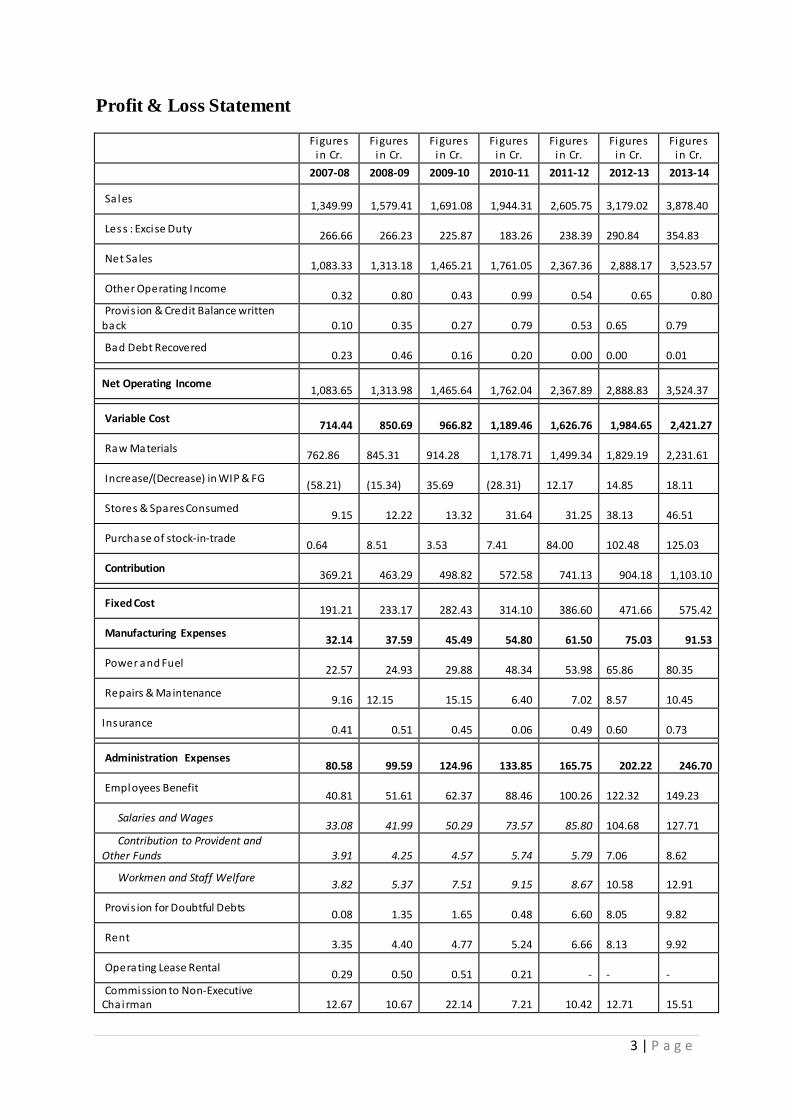
Profit & Loss Statement
Figures
in Cr. Figures
in Cr. Figures
in Cr. Figures
in Cr. Figures
in Cr. Figures
in Cr. Figures
in Cr.
2007-08 2008-09 2009-10 2010-11 2011-12 2012-13 2013-14
Sa les
1,349.99
1,579.41
1,691.08
1,944.31
2,605.75
3,179.02
3,878.40
Less : Excise Duty
266.66
266.23
225.87
183.26
238.39 290.84
354.83
Net Sa les
1,083.33
1,313.18
1,465.21
1,761.05
2,367.36
2,888.17
3,523.57
Other Operating Income
0.32
0.80
0.43
0.99
0.54
0.65
0.80 Provis ion & Credit Balance written
back
0.10
0.35
0.27
0.79
0.53
0.65
0.79
Bad Debt Recovered
0.23
0.46
0.16
0.20
0.00
0.00
0.01
Net Operating Income
1,083.65
1,313.98
1,465.64
1,762.04
2,367.89
2,888.83
3,524.37
Variable Cost
714.44
850.69
966.82
1,189.46
1,626.76
1,984.65
2,421.27
Raw Materials 762.86
845.31
914.28
1,178.71
1,499.34
1,829.19
2,231.61
Increase/(Decrease) in WIP & FG (58.21)
(15.34)
35.69
(28.31)
12.17
14.85
18.11
Stores & Spares Consumed
9.15
12.22
13.32
31.64
31.25 38.13
46.51
Purchase of stock-in-trade 0.64
8.51
3.53
7.41
84.00
102.48
125.03
Contribution
369.21
463.29
498.82
572.58
741.13
904.18
1,103.10
Fixed Cost
191.21
233.17
282.43
314.10
386.60
471.66
575.42
Manufacturing Expenses
32.14
37.59
45.49
54.80
61.50
75.03
91.53
Power and Fuel
22.57
24.93
29.88
48.34
53.98 65.86
80.35
Repairs & Maintenance
9.16 12.15
15.15
6.40
7.02
8.57
10.45
Insurance
0.41
0.51
0.45
0.06
0.49 0.60
0.73
Administration Expenses
80.58
99.59
124.96
133.85
165.75
202.22
246.70
Employees Benefit
40.81
51.61
62.37
88.46
100.26 122.32
149.23
Salaries and Wages
33.08
41.99
50.29
73.57
85.80 104.68
127.71
Contribution to Provident and
Other Funds
3.91
4.25
4.57
5.74
5.79
7.06
8.62
Workmen and Staff Welfare
3.82
5.37
7.51
9.15
8.67 10.58
12.91
Provis ion for Doubtful Debts
0.08
1.35
1.65
0.48
6.60 8.05
9.82
Rent
3.35
4.40
4.77
5.24
6.66 8.13
9.92
Operating Lease Rental
0.29
0.50
0.51
0.21
- -
-
Commission to Non-Executive Chairman
12.67
10.67
22.14
7.21
10.42
12.71
15.51
4 | P a g e
Payment To Auditors
0.12
0.13
0.14
0.18
0.22 0.27
0.33
Research & Development Expenses
0.28
0.31
0.25
0.21
0.73 0.89
1.08
Donations
1.09
1.41
5.42
4.51
6.47 7.89
9.63
Pol i tical Donation
-
-
0.23
0.10
0.10 0.12
0.15
Travel & Conveyance
7.81
8.68
8.19
8.37
10.03 12.23
14.92
Communication Expenses
1.05
1.19
1.26
1.36
1.35 1.65
2.01
Consultancy Charges
-
-
-
1.72
3.60 4.39
5.35
Information Technology Expenses
-
-
-
2.73
1.87
2.28
2.78
Office Maintenance Expenses
-
-
-
3.78
5.31
6.48
7.90
Sundry Expenses
8.00
12.18
12.54
6.14
7.72 9.42
11.49
Bad Debts and Irrecoverable Advances
0.60
0.67
0.74
0.35
0.15 0.19
0.23
Assets Written Off
0.52
1.97
1.07
0.73
0.38 0.47
0.57
Premium on Forward Contracts
0.52
0.65
0.46
0.00
0.06
0.07
0.08
Rates, Taxes and Licenses
0.27
0.21
0.25
0.43
0.28
0.34
0.42
Duties and Taxes
1.59
1.78
1.81
1.63
3.53 4.31
5.25
Wealth Tax
0.01
0.01
0.01
0.02
0.02 0.02
0.03
Bank Charges
1.50
1.86
1.15
-
-
-
-
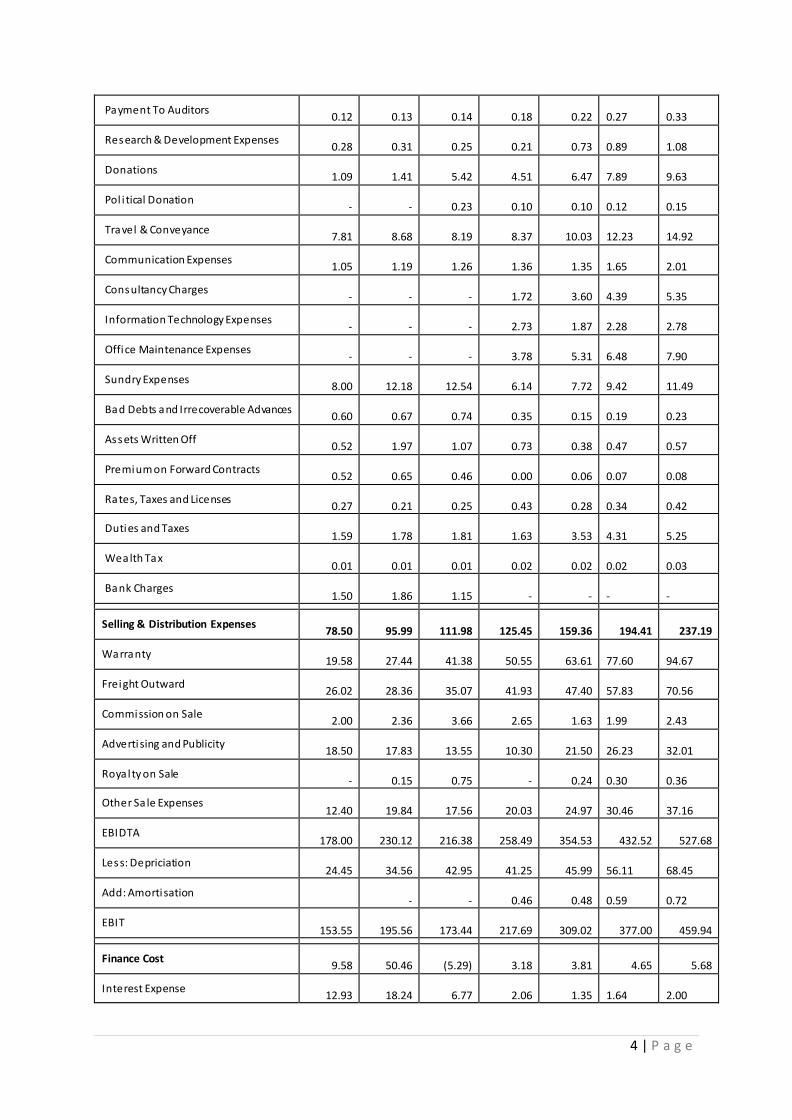
Selling & Distribution Expenses
78.50
95.99
111.98
125.45
159.36
194.41
237.19
Warranty
19.58
27.44
41.38
50.55
63.61
77.60
94.67
Freight Outward
26.02
28.36
35.07
41.93
47.40 57.83
70.56
Commission on Sale
2.00
2.36
3.66
2.65
1.63 1.99
2.43
Advertising and Publicity
18.50
17.83
13.55
10.30
21.50 26.23
32.01
Royalty on Sale
-
0.15
0.75
-
0.24
0.30
0.36
Other Sa le Expenses
12.40
19.84
17.56
20.03
24.97
30.46
37.16
EBIDTA
178.00
230.12
216.38
258.49
354.53
432.52
527.68
Less: Depriciation
24.45
34.56
42.95
41.25
45.99 56.11
68.45
Add: Amortisation
-
-
0.46
0.48
0.59
0.72
EBIT
153.55
195.56
173.44
217.69
309.02
377.00
459.94
Finance Cost
9.58
50.46
(5.29)
3.18
3.81
4.65
5.68
Interest Expense
12.93
18.24
6.77
2.06
1.35 1.64
2.00
5 | P a g e
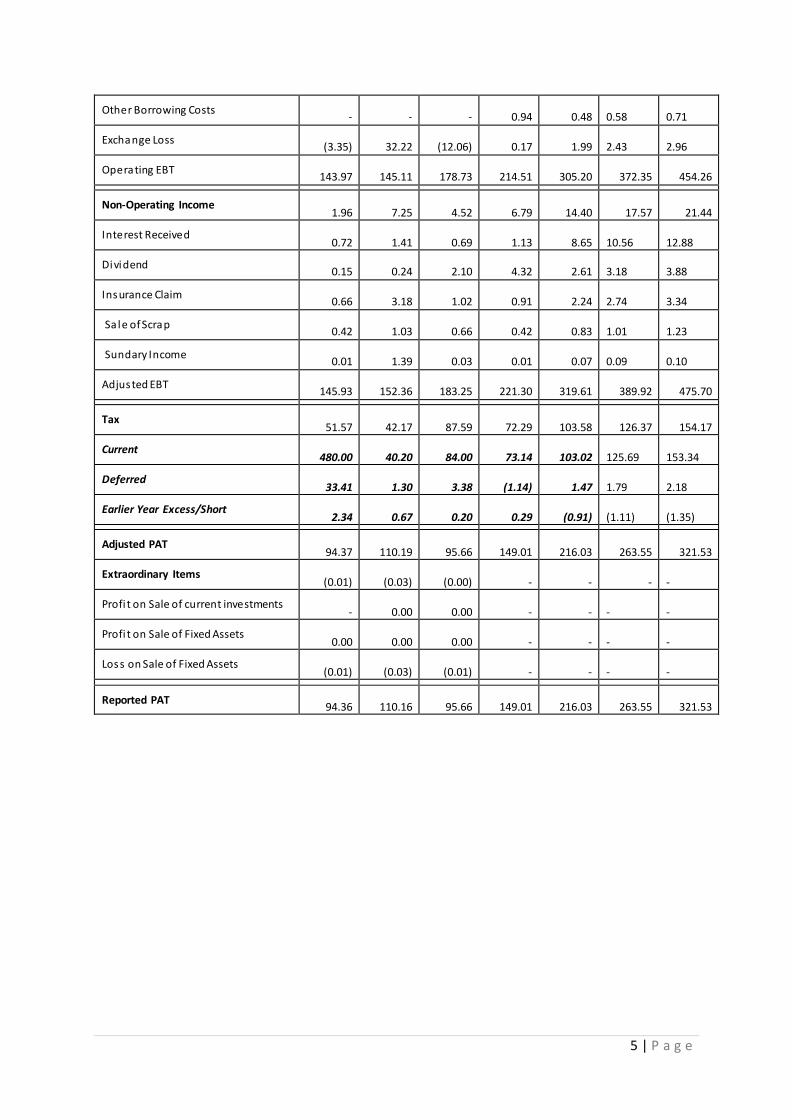
Other Borrowing Costs
-
-
-
0.94
0.48 0.58
0.71
Exchange Loss
(3.35)
32.22
(12.06)
0.17
1.99 2.43
2.96
Operating EBT
143.97
145.11
178.73
214.51
305.20
372.35
454.26
Non-Operating Income
1.96
7.25
4.52
6.79
14.40
17.57
21.44
Interest Received
0.72
1.41
0.69
1.13
8.65
10.56
12.88
Dividend
0.15
0.24
2.10
4.32
2.61 3.18
3.88
Insurance Claim
0.66
3.18
1.02
0.91
2.24 2.74
3.34
Sa le of Scrap
0.42
1.03
0.66
0.42
0.83 1.01
1.23
Sundary Income
0.01
1.39
0.03
0.01
0.07 0.09
0.10
Adjusted EBT
145.93
152.36
183.25
221.30
319.61
389.92
475.70
Tax
51.57
42.17
87.59
72.29
103.58
126.37
154.17
Current
480.00
40.20
84.00
73.14
103.02 125.69
153.34
Deferred
33.41
1.30
3.38
(1.14)
1.47 1.79
2.18
Earlier Year Excess/Short
2.34
0.67
0.20
0.29
(0.91)
(1.11)
(1.35)
Adjusted PAT
94.37
110.19
95.66
149.01
216.03
263.55
321.53
Extraordinary Items
(0.01)
(0.03)
(0.00)
-
-
-
-
Profi t on Sale of current investments
-
0.00
0.00
-
- -
-
Profi t on Sale of Fixed Assets
0.00
0.00
0.00
-
- -
-
Loss on Sale of Fixed Assets
(0.01)
(0.03)
(0.01)
-
-
-
-
Reported PAT
94.36
110.16
95.66
149.01
216.03
263.55
321.53
6 | P a g e
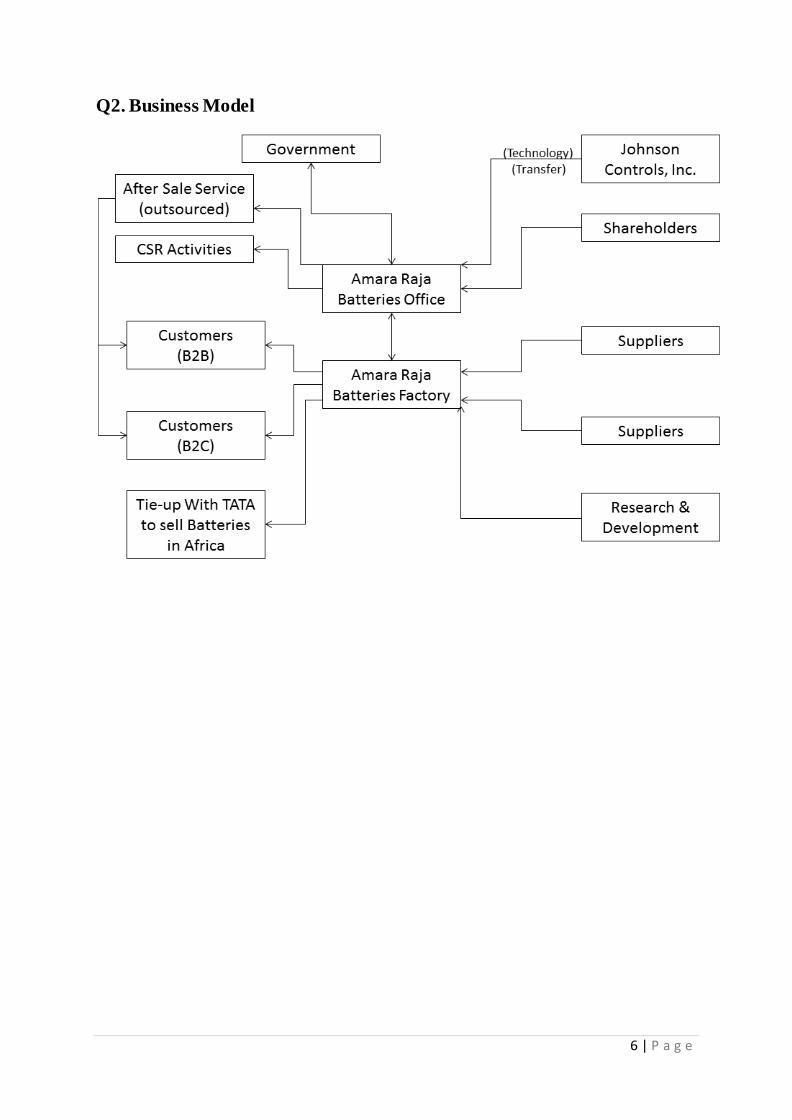
Q2. Business Model
7 | P a g e
Goldratt’s theory applied to determine the determinants of cost sheet of Amara Raja
Batteries
The financing constraint theory (Goldratt, 1990) argues that firms which do not make profit and
thus does not have a buffer to invest, will not be able to finance their growth or at least their
sustainability, and will finally disappear. Here, the buffer is the retained earnings, which will be
small if the company does not make profit or decides to allocate all of its profit to the
shareholders. This buffer equals to the internal capital, which is preferred to external capital
according to the pecking order theory. In case of Amara Raja Batteries profit after tax are
increasing year on year and hence it implies that it is making profits.
A decrease in firm size weakens the impact of profitability on growth. This theoretical line of
thinking is linked to the famous theory of constraints (Goldratt, 1990).
According to the theory of constraints, large companies have less financial constraints, whereas
small firms face constraining elements. In case of Amara Raja Batteries in the year 2009 it issued
new shares and reduced its dependence on borrowed funds and thus not facing the financial
constraints hence it can easily finance its expansion, even if their promoters are not putting in
their personal finance.
Cost sheet mainly consists of prime cost which is purely variable and hence varies with the
output, various other aspects are selling and distribution cost, administration cost as well as the
overheads. In case of the Amara Raja Batteries these costs are increasing their research &
development department as well as it has increased its staff in order to service their clients
effectively.
Increase Throughput that is increasing the sales turnover and converting inventory into sales.
It can be seen that Amara Raja Batteries has increased its sales over the years.
(in rs. Lacs) FY 08 FY 09 FY 10 FY 11 FY 12
Sales Turnover 134,998.67 157,940.99 169108.37 194,431.40 260,575.00
Reduce Inventory is the second principle of Goldratt, so that inventory turnover is high and
cash flows into the system quickly.
(in rs. Lacs) FY 08 FY 09 FY 10 FY 11 FY 12
Inventory 19,433.36 16,082.69 21,757.24 28,469.70 26,661.70
Reduce Operational expenses is the 3rd principle which aims at maximising the efficiency
of the operations it is also can be called as learning curve effects.
(in rs. Lacs) FY 08 FY 09 FY 10 FY 11 FY 12
Total expenses 96299.76 119857.7 122759.2 154844.7 206389.6
8 | P a g e
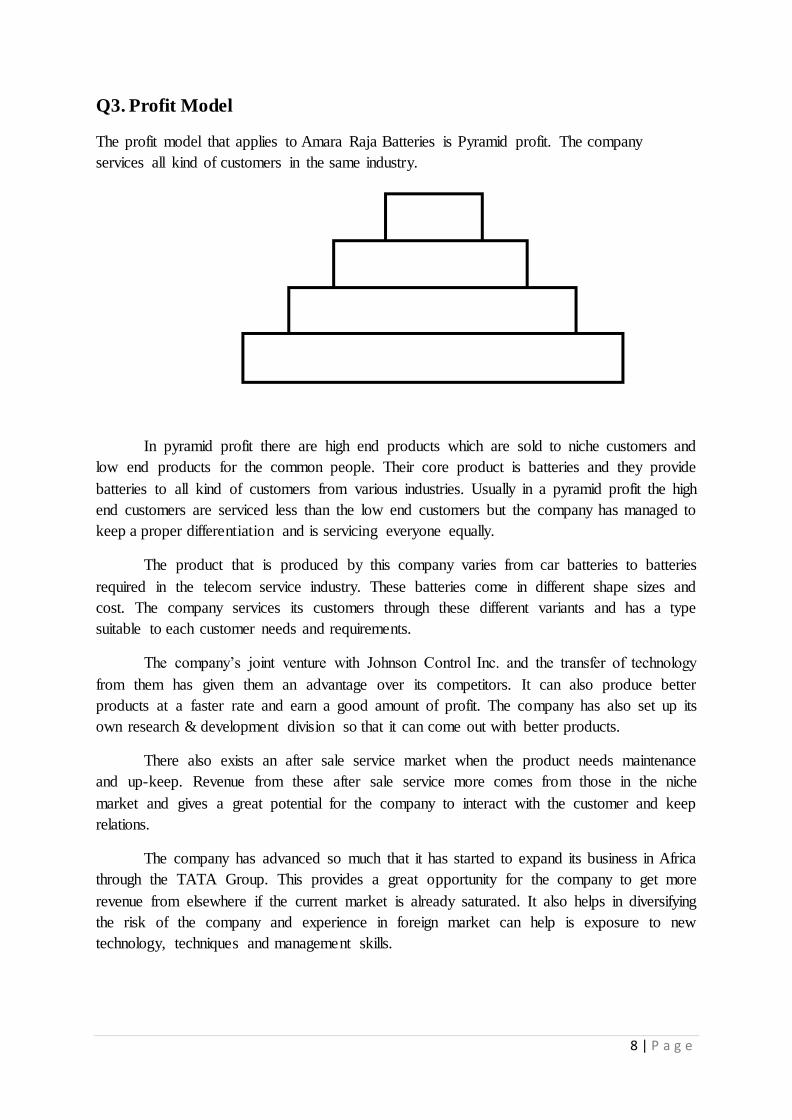
Q3. Profit Model
The profit model that applies to Amara Raja Batteries is Pyramid profit. The company
services all kind of customers in the same industry.
In pyramid profit there are high end products which are sold to niche customers and
low end products for the common people. Their core product is batteries and they provide
batteries to all kind of customers from various industries. Usually in a pyramid profit the high
end customers are serviced less than the low end customers but the company has managed to
keep a proper differentiation and is servicing everyone equally.
The product that is produced by this company varies from car batteries to batteries
required in the telecom service industry. These batteries come in different shape sizes and
cost. The company services its customers through these different variants and has a type
suitable to each customer needs and requirements.
The company’s joint venture with Johnson Control Inc. and the transfer of technology
from them has given them an advantage over its competitors. It can also produce better
products at a faster rate and earn a good amount of profit. The company has also set up its
own research & development division so that it can come out with better products.
There also exists an after sale service market when the product needs maintenance
and up-keep. Revenue from these after sale service more comes from those in the niche
market and gives a great potential for the company to interact with the customer and keep
relations.
The company has advanced so much that it has started to expand its business in Africa
through the TATA Group. This provides a great opportunity for the company to get more
revenue from elsewhere if the current market is already saturated. It also helps in diversifying
the risk of the company and experience in foreign market can help is exposure to new
technology, techniques and management skills.
9 | P a g e
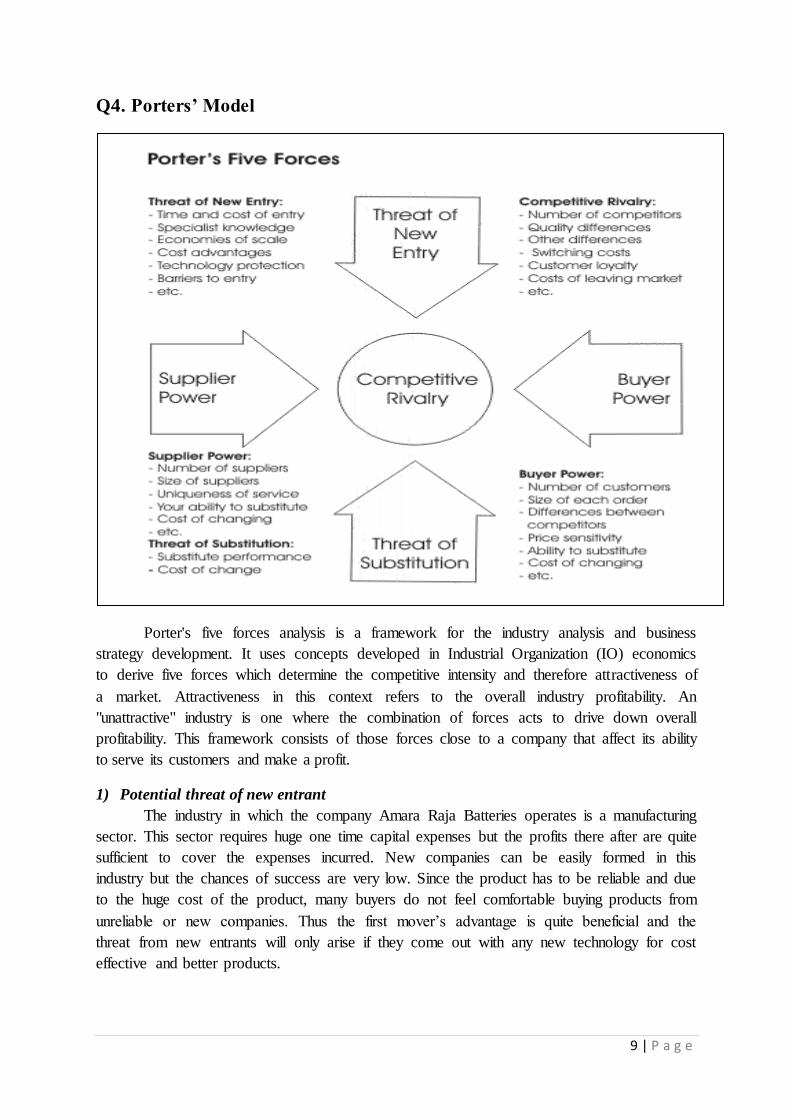
Q4. Porters’ Model
Porter's five forces analysis is a framework for the industry analysis and business
strategy development. It uses concepts developed in Industrial Organization (IO) economics
to derive five forces which determine the competitive intensity and therefore attractiveness of
a market. Attractiveness in this context refers to the overall industry profitability. An
"unattractive" industry is one where the combination of forces acts to drive down overall
profitability. This framework consists of those forces close to a company that affect its ability
to serve its customers and make a profit.
1) Potential threat of new entrant
The industry in which the company Amara Raja Batteries operates is a manufacturing
sector. This sector requires huge one time capital expenses but the profits there after are quite
sufficient to cover the expenses incurred. New companies can be easily formed in this
industry but the chances of success are very low. Since the product has to be reliable and due
to the huge cost of the product, many buyers do not feel comfortable buying products from
unreliable or new companies. Thus the first mover’s advantage is quite beneficial and the
threat from new entrants will only arise if they come out with any new technology for cost
effective and better products.
10 | P a g e
2) Bargaining power of buyers
The buyers of the Company/Industry want quality product, since the product cost is
huge they would want to spend the money only once. There are many players is the market
like Exide, Bosch, Motherson Sumi, etc. Even though the company is not a market leader in
all its variants, its products are quite reliable and can be bought at a cheaper price than its
competitors.
3) Bargaining power of suppliers
The product that Amara Raja Batteries produces requires raw material of hazardous
and rare in nature. The production of these raw materials is done by few players and the
product needs to be of the highest grade or else it is non-usable. These raw materials needs to
be produced in a plant with special government approval since they are a major safety hazard
and is a great environmental concern. Transportation and distribution of these material needs
to be done by a careful and trained crew.
4) Threat of substitute products
There are no immediate substitutes for batteries since they are the most portable,
efficient and safe way of using electricity. The closest substitute is an individual electric
power generator which requires constant care and attention. They are also not feasible in
nature nor are they safe. The future substitute for these products can be a new technology
which uses more powerful raw material which is cost affective.
5) Industry competitors
The competition in this industry is fierce. There are many huge players with much
better products and much more advanced technology. Their bargaining power is higher than
the company and has most of the market share. Competition from these companies will only
keep growing due to their advanced expertise and product knowledge. Some of these
companies are MNC’s and have support from foreign entities.
11 | P a g e
Q5. Warren Buffet Tenets
I. BUSINESS TENETS: These are the basic characteristics of the business itself. It
contains four basic principles which are as follows:
1) Is the business simple and understandable?
Amara Raja Batteries supplies and services different kinds of customers at the same
time. It has different products for different type of customers, who are from different
industries and have different needs and uses for the product. The customers vary from
common motorist to big automobile manufacturing companies to telecom industry. The
size, shape and capacity of the batteries supplied the company varies from its uses. The
business is not only servicing other businesses but also a small number of customers. This
business is easily understandable due to the standard product but in different shapes and
sizes.
2) Does the business have a consistent operating history?
The Company has a consistently growing operating profit. The growth in sales is
calculated at a compounded annual growth rate (CAGR) of 22%. This kind of growth in a
manufacturing sector for a consistent period of 5 years is profitable. The consistent profit
can prove to be beneficial in adding value to the company and giving fair returns to its
shareholders.
The costs of the company also have to be taken into consideration also, which is not
directly related to the sale of goods. These costs are also high giving only a profit of 9%
of sales to the company. However in a manufacturing concern such as this the costs
incurred is more to do with relation to the manufacturing of the product and cannot be
excluded. Thus we can say that the company has a fairly good operating history.
Fig. in Cr. 2007-08 2008-09 2009-10 2010-11 2011-12
Net Operating Income 1,083.65 1,313.98 1,465.64 1,762.04 2,367.89
3) Does the business have favorable long-term prospects?
The company Amara Raja Batteries is one of the leading companies in the sector of
producing and supplying car batteries to industrial grade batteries for companies. Most of
the demand comes from other industries which are growing constantly. However the
competition is fierce and growing. Companies are fighting for market share with cheaper
and more advanced products, yet the demand for Amara Raja Batteries’ product has only
been growing. This can be attributed to the technology acquired in the joint venture of
Johson Technology. This technology is applied and more research and development is
being done by the company to come out with better products. So there is a favorable long-
term prospect for the company.
12 | P a g e
II. MANAGEMENT TENETS: These are three important qualities that senior managers
must display.
1) Is management rational?
In case of Amara Raja Batteries the company’s management has been increasing
inventory at a slower rate than that of the sales, which means it is not investing too much
towards keeping excess inventory. The long-term and short-term borrowings have been
reduced slightly, which means it is using its own cash for its operations and ploughing
back its profit towards its working capital. Investments are increasing and so is the loans
given out which brings in excess cash into the business from non-operating activities.
2) Is management candid with its shareholders?
Managers of Amara Raja Batteries provide all the company information in its annual
report. The company adheres to the GAAP and provides all information regarding its
CSR activities in a separate section of the annual report. The 10-years financial
performance is also provided by the company giving a trend analysis of the performance
of the company.
3) Does management resist the institutional imperative?
Amara Raja Batteries has high competitive expertise and are always in forefront in
forming policies and rules and are accountable. The managers are in line with the industry
practices but do not imitate a competitor. The managers adhere to the company and
corporate laws strictly and try to innovate as much as possible.
III. FINANCIAL TENETS: Four critical financial decisions that the company must
maintain at all time.
1) Focus on return on equity, not earnings per share
The company Amara Raja Batteries has a focused objective of providing its
shareholders return on their investment. The return on equity of the company is 26%,
which is considerably quite high and gives the shareholder its money back in a short
period of time.
2) What are the company’s “owner earnings”?
Owner Earnings = Net Income + Depreciation/Amortization – Capital Expenditures
and Additional Working Capital needed. The Company has an owners earning of 235 Cr
and is comparatively very good.
3) What are the profit margins?
In the company Amara Raja Batteries the company tries to increase its profit margin
by reducing costs. The profit margin in the past 5-years has increased at a faster rate than
that of sales. In 2008 the profit margin is 8.7% and in 2012 the profit margin is 9%.
13 | P a g e
4) Has the company created at least one dollar of market value for every dollar retained?
The company has increased a lot of its cash by retaining its earnings. This cash is
being invested into the companies’ working capital, loans given out and other
investments. The price of the share is rising in proportion to the earnings so we can say
successfully that the company is creating a dollar of market value for each dollar retained.
IV. VALUE TENETS: Two interrelated guidelines about purchase price
1) What is the value of the company?
The company Amara Raja batteries tries to create value in the company. This value is
determined by the cost at which the company can be valued at. This value can be
determined by discounting the company at its proper discount rate. The appropriate
discount rate is the risk-free rate. Hence in our case it should be around 8.14%.
2) Can it be purchased at a significant discount to its value?
The company Amara Raja Batteries is a much underpriced company. Since its P/E is
only 18.84 as compared to and industry P/E of 22.76 the company can be purchased at a
cheaper price than its competitors. The company’s operations are good but execution is
lacking and could be a bargaining point for the buyer.
14 | P a g e
6) Dhandho Framework – Business Arbitrage
Pabrai advises investors to "fixate on arbitrage", especially those situations where
downside risk is eliminated, even if upside potential is limited. He discusses the following
types of arbitrage, with particular emphasis on the last one:
•Traditional: Buying gold on one exchange and selling it for a higher price on another
•Correlated: Buying shares of a Class B stock while shorting the Class A if there's a
price/value discrepancy
•Merger: Buying a company about to be bought-out by another. It's important to note that this
type of arbitrage is generally not risk-free.
•Dhandho Arbitrage
Dhandho arbitrage allows businesses to earn above normal profits for a limited time,
before competitors or substitutes enter and destroy these higher returns. An enduring Dhadho
arbitrage is what Buffett would call a moat. Pabrai goes on to describe the Dhandho arbitrage
spreads of several businesses. Some have spreads of just a few months, while others have
spreads that span decades. While Pabrai argues that the "Dhandho arbitrage spreads" of all
businesses will eventually be eroded, two important factors can allow investors to earn
excellent returns in the interim: the size of the spread (or moat), and its duration.
In Case of Amara Raja Batteries, the company has enjoyed Dhandho Arbitrage as it
has been one of the early entrants in the industrial grade electric battery business and hence it
had managed to squeeze the supernormal profits before the competitors entered the markets.
The company has a good brand name which it has developed in over 2 decades.
Also it gives advice and guidance and financial help to its vendors which is a positive
differentiator for them and helps to keep competitors at bay. It has some of the products
which serve the niche segments at a competitive rate. As a result, it can earn the excess
riskless profits, which is not available to its competitors.
Currently the share price of Amara Raja Batteries seems to be undervalued at Rs.
47.9. As P/E ratio of Amara Raja Batteries is lower as compared to the industry P/E. I would
invest in the shares of Amara Raja Batteries at current price level or upto a price of Rs.50.
15 | P a g e
Kelly Formula:-
Kelly Formula is a mathematical formula that is used to maximize the long-term
growth rate of a series of repeated bets that have a positive expected value. The Kelly
Formula basically figures out how much to bet if the odds are in your favour the Kelly
Formula tells that the maximum one should bet is 25% of your money. Doing so will give
maximum long-term growth with minimum downside. Although there is no "perfect" system
to avoid all loses. All we can do is minimize losses, maximize gains, and optimize bankrolls.
The Kelly Formula insures that you'll never lose everything; still, it doesn't guarantee that you
won't lose sometimes.
Kelly % = W – [(1 – W) / R]
R = Win/loss ratio,
W = Winning probability
So, if given Rs 1mn, I should not invest more than Rs 0.25mn in a particular stock and
should diversify.
Example:
Current Capital – Rs 1mn
Security Price – Rs 50
Kelly - 0.20 assumed
Maximal Loss at trade - 25% assumed (it's calculated on the basis of the historical data)
In this case I can buy (0.2 * 1,000,000/0.25)/50 = 16,000 shares and hence I can invest
Rs. 800,000 but it is more than 25% of the amount hence restrict to 20% to 25% of the total
amount we have available for investment.
16 | P a g e
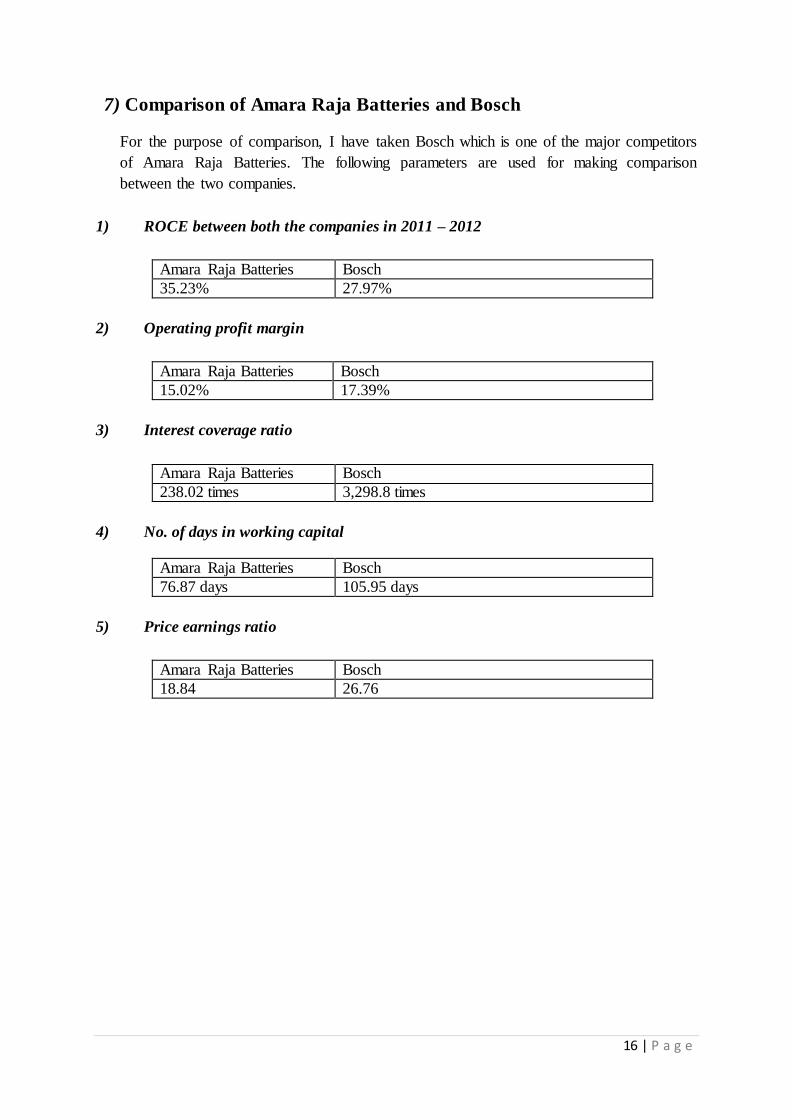
7) Comparison of Amara Raja Batteries and Bosch
For the purpose of comparison, I have taken Bosch which is one of the major competitors
of Amara Raja Batteries. The following parameters are used for making comparison
between the two companies.
1) ROCE between both the companies in 2011 – 2012
Amara Raja Batteries Bosch
35.23% 27.97%
2) Operating profit margin
Amara Raja Batteries Bosch
15.02% 17.39%
3) Interest coverage ratio
Amara Raja Batteries Bosch
238.02 times 3,298.8 times
4) No. of days in working capital
Amara Raja Batteries Bosch
76.87 days 105.95 days
5) Price earnings ratio
Amara Raja Batteries Bosch
18.84 26.76
17 | P a g e
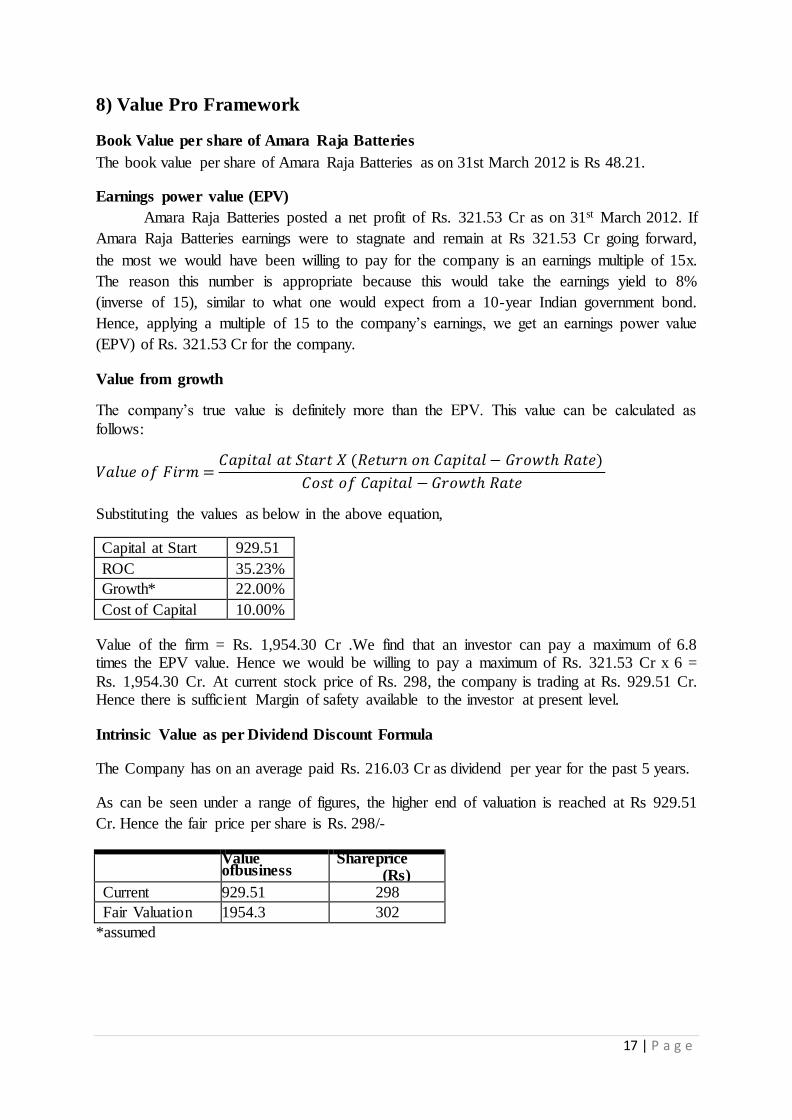
8) Value Pro Framework
Book Value per share of Amara Raja Batteries
The book value per share of Amara Raja Batteries as on 31st March 2012 is Rs 48.21.
Earnings power value (EPV)
Amara Raja Batteries posted a net profit of Rs. 321.53 Cr as on 31st March 2012. If
Amara Raja Batteries earnings were to stagnate and remain at Rs 321.53 Cr going forward,
the most we would have been willing to pay for the company is an earnings multiple of 15x.
The reason this number is appropriate because this would take the earnings yield to 8%
(inverse of 15), similar to what one would expect from a 10-year Indian government bond.
Hence, applying a multiple of 15 to the company’s earnings, we get an earnings power value
(EPV) of Rs. 321.53 Cr for the company.
Value from growth
The company’s true value is definitely more than the EPV. This value can be calculated as
follows:
𝑉𝑎𝑙𝑢𝑒 𝑜𝑓 𝐹𝑖𝑟𝑚 =𝐶𝑎𝑝𝑖𝑡𝑎𝑙 𝑎𝑡 𝑆𝑡𝑎𝑟𝑡 𝑋 (𝑅𝑒𝑡𝑢𝑟𝑛 𝑜𝑛 𝐶𝑎𝑝𝑖𝑡𝑎𝑙 − 𝐺𝑟𝑜𝑤𝑡ℎ 𝑅𝑎𝑡𝑒)
𝐶𝑜𝑠𝑡 𝑜𝑓 𝐶𝑎𝑝𝑖𝑡𝑎𝑙 − 𝐺𝑟𝑜𝑤𝑡ℎ 𝑅𝑎𝑡𝑒
Substituting the values as below in the above equation,
Capital at Start 929.51
ROC 35.23%
Growth* 22.00%
Cost of Capital 10.00%
Value of the firm = Rs. 1,954.30 Cr .We find that an investor can pay a maximum of 6.8 times the EPV value. Hence we would be willing to pay a maximum of Rs. 321.53 Cr x 6 =
Rs. 1,954.30 Cr. At current stock price of Rs. 298, the company is trading at Rs. 929.51 Cr. Hence there is sufficient Margin of safety available to the investor at present level.
Intrinsic Value as per Dividend Discount Formula
The Company has on an average paid Rs. 216.03 Cr as dividend per year for the past 5 years.
As can be seen under a range of figures, the higher end of valuation is reached at Rs 929.51
Cr. Hence the fair price per share is Rs. 298/-
Value ofbusiness (Rs Cr)
Shareprice (Rs)
Current 929.51 298
Fair Valuation 1954.3 302
*assumed
18 | P a g e
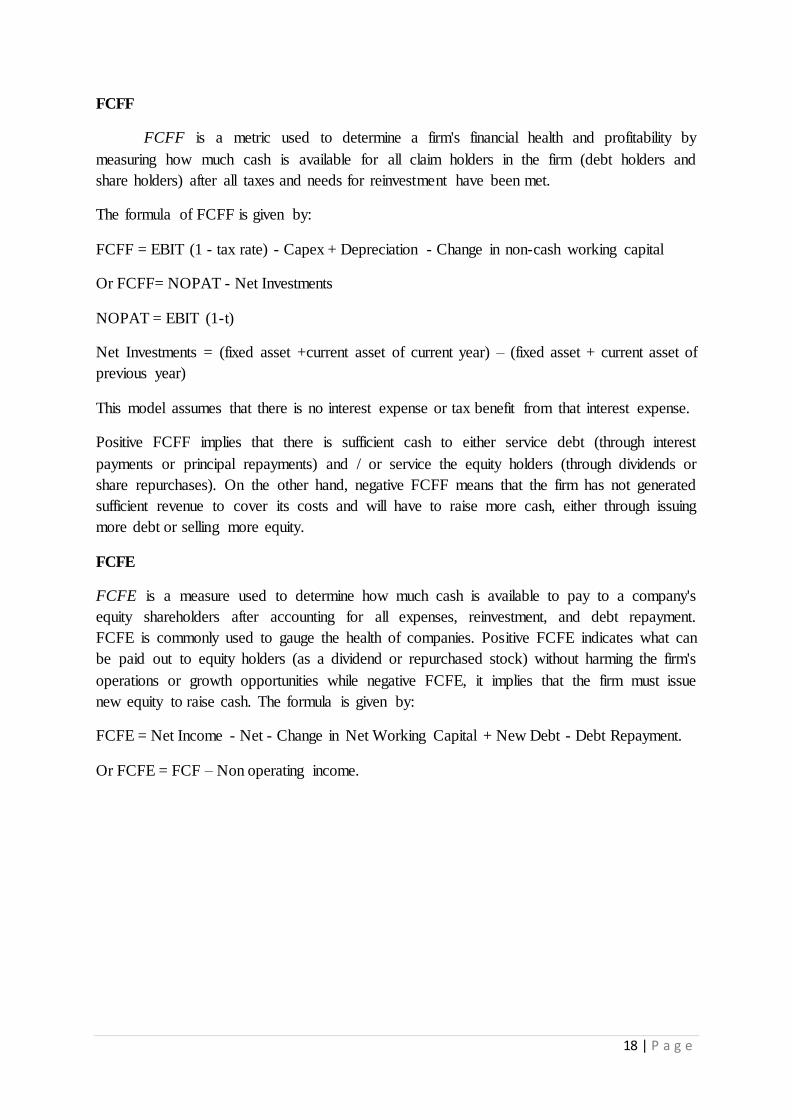
FCFF
FCFF is a metric used to determine a firm's financial health and profitability by
measuring how much cash is available for all claim holders in the firm (debt holders and
share holders) after all taxes and needs for reinvestment have been met.
The formula of FCFF is given by:
FCFF = EBIT (1 - tax rate) - Capex + Depreciation - Change in non-cash working capital
Or FCFF= NOPAT - Net Investments
NOPAT = EBIT (1-t)
Net Investments = (fixed asset +current asset of current year) – (fixed asset + current asset of
previous year)
This model assumes that there is no interest expense or tax benefit from that interest expense.
Positive FCFF implies that there is sufficient cash to either service debt (through interest
payments or principal repayments) and / or service the equity holders (through dividends or
share repurchases). On the other hand, negative FCFF means that the firm has not generated
sufficient revenue to cover its costs and will have to raise more cash, either through issuing
more debt or selling more equity.
FCFE
FCFE is a measure used to determine how much cash is available to pay to a company's
equity shareholders after accounting for all expenses, reinvestment, and debt repayment.
FCFE is commonly used to gauge the health of companies. Positive FCFE indicates what can
be paid out to equity holders (as a dividend or repurchased stock) without harming the firm's
operations or growth opportunities while negative FCFE, it implies that the firm must issue
new equity to raise cash. The formula is given by:
FCFE = Net Income - Net - Change in Net Working Capital + New Debt - Debt Repayment.
Or FCFE = FCF – Non operating income.
19 | P a g e
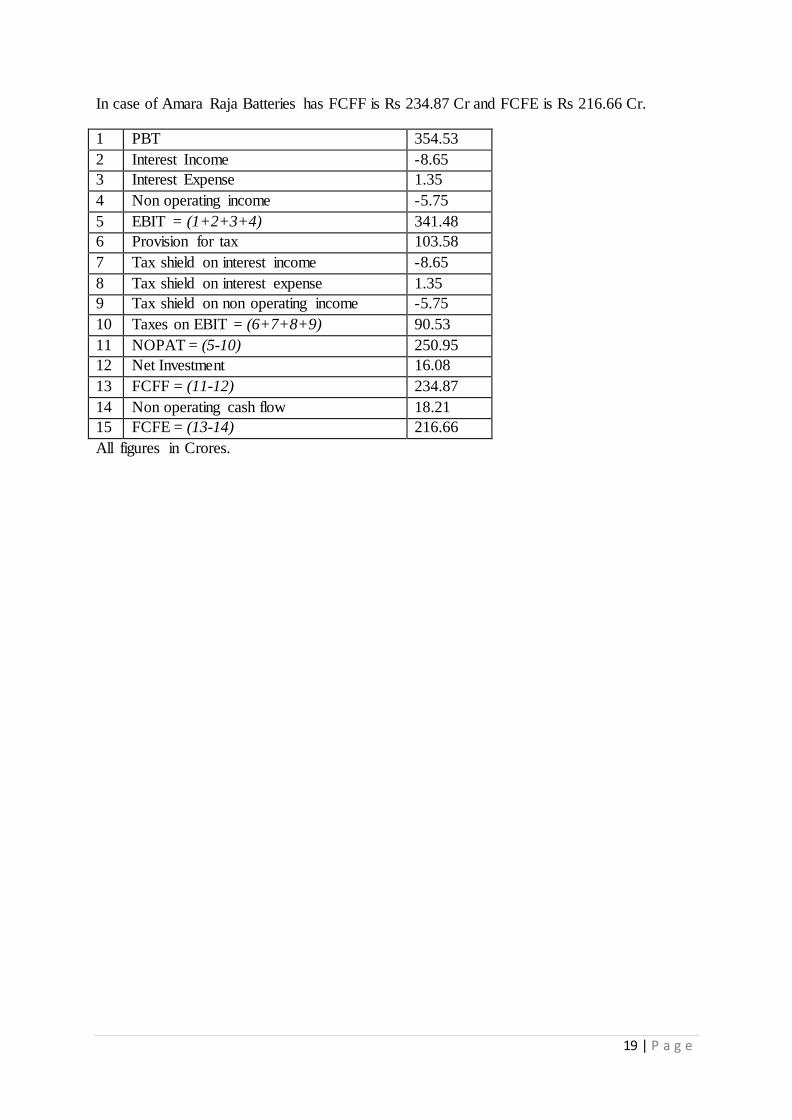
In case of Amara Raja Batteries has FCFF is Rs 234.87 Cr and FCFE is Rs 216.66 Cr.
1 PBT 354.53
2 Interest Income -8.65
3 Interest Expense 1.35
4 Non operating income -5.75
5 EBIT = (1+2+3+4) 341.48
6 Provision for tax 103.58
7 Tax shield on interest income -8.65
8 Tax shield on interest expense 1.35
9 Tax shield on non operating income -5.75
10 Taxes on EBIT = (6+7+8+9) 90.53
11 NOPAT = (5-10) 250.95
12 Net Investment 16.08
13 FCFF = (11-12) 234.87
14 Non operating cash flow 18.21
15 FCFE = (13-14) 216.66
All figures in Crores.
20 | P a g e
9) Morning Star Model – Business Moat
Moats are important to investors because any time a company develops a useful
product or service. It isn't long before other firms try to capitalize on that opportunity by
producing a similar--if not better--product. Basic economic theory says that in a perfectly
competitive market, rivals will eventually eat up any excess profits earned by a successful
business. In other words, competition makes it difficult for most firms to generate strong
growth and margins over an extended period of time. Amara Raja Batteries falls into the
network effect.
The Network Effect: The network effect occurs when the value of a particular good or
service increases for both new and existing users as more people use that good or service. It
can also occur when other firms design products that compliment an existing product, thereby
enhancing that product's value. For example, the fact that there are literally millions of people
using eBay (EBAY) is the thing that both makes eBay's service incredibly valuable and
makes it all but impossible for another company to duplicate its service. The moat is a wide
moat according to me
The “distributor” status doesn’t restrict Amara Raja Batteies by being a mere member
of the channel, value addition is provided at every step of the process elevating Amara Raja
Batteires from being a distributor to a marketing partner. Amara Raja batteries does not
distribute it contributes. Amara raja batteries has dedicated business and sales teams for
developing the business for every brand it distributes and these professionals act as an
extension of business development team of the vendors.
Amara Raja Batteies have end to end supply chain capabilities starting from import,
warehousing, and stock movement across geographies to packing / repacking, order
processing and delivery to the parts of the world where we operate, together with Amara Raja
Batteies door delivery infrastructure. Amara Raja Batteies also provide our customers with
project based delivery services which require a highly coordinated activity of delivery of
multiple products to multiple locations and in some cases installing them as well. The wide
spectrum of products offered from multiple vendors helps Amara Raja Batteies to provide the
customers a single sourcing point.
Amara Raja Batteies provides differentiated value offerings up and down the supply
chain, in some or the other touching everyone in the chain from the vendor to the end
customer. Customer does not mean only to whom Amara Raja Batteies sells its products but
also at time vendors who sells their products to Amara Raja Batteies also become customer of
it as they do purchase from Amara Raja Batteies.
Hence, it would be difficult for the competitor’s to imitate the wide and diversified
although related service, which benefits the users.
21 | P a g e
10) CANSLIM Investment strategy
The stock market can make or break dreams in a single afternoon. As with any
investment, the stock market carries with it a certain degree of risk, regardless of which stock
strategy investors choose. Equally true is the fact that some stock strategies are superior and
safer than others. Originally developed by William O'Neil, the CANSLIM stock strategy
employs a prudent analysis of earnings and other financial information while also assessing
the relative strength of the company and its potential for future growth in earnings. In other
words, the CANSLIM strategy looks at both tangible and intangible items when screening
potential stock purchases.
C=Current Earnings
Earnings may not be the only important indicator of the current strength of a company
but they certainly provide useful information to help in the decision-making process. The
CANSLIM stock strategy requires a careful analysis of the most recent earnings per share
(EPS) reported by the company. Earning should rise at least 20% over previous financial
year. In case of Amara raja batteries India EPS in Mar '12 is 25.18 and Mar '11 was 17.34.
However, it has increased but not by 20%.
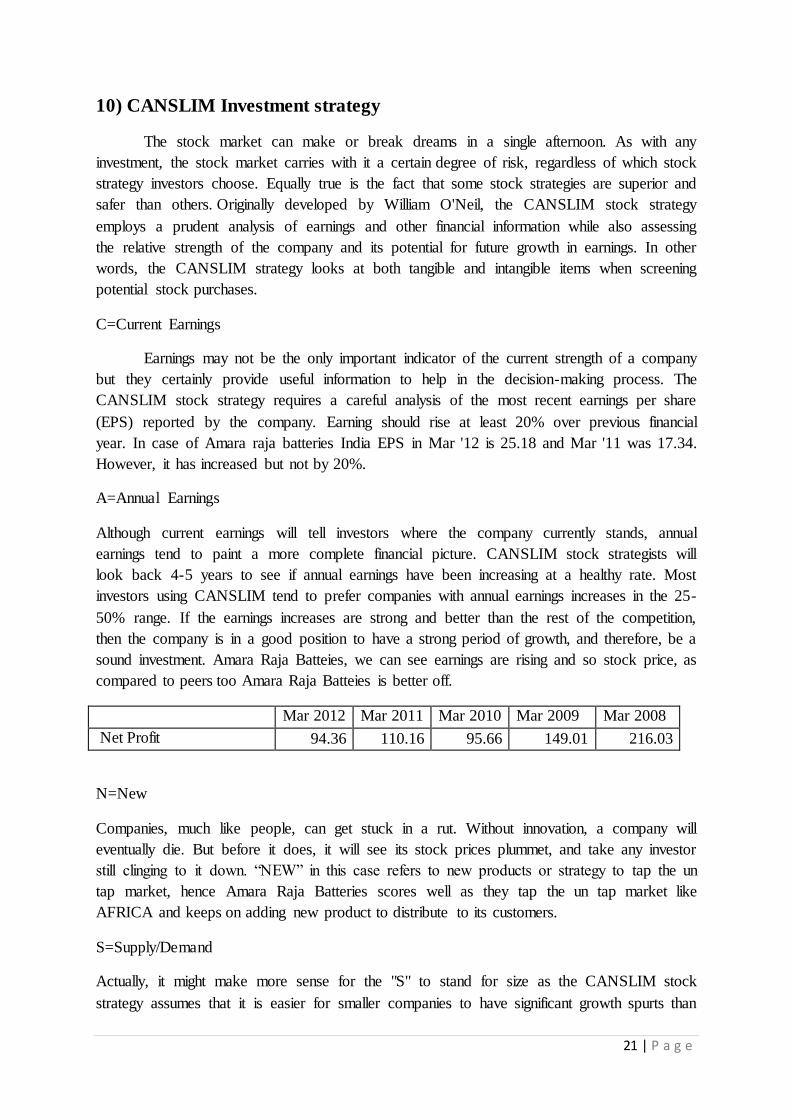
A=Annual Earnings
Although current earnings will tell investors where the company currently stands, annual
earnings tend to paint a more complete financial picture. CANSLIM stock strategists will
look back 4-5 years to see if annual earnings have been increasing at a healthy rate. Most
investors using CANSLIM tend to prefer companies with annual earnings increases in the 25-
50% range. If the earnings increases are strong and better than the rest of the competition,
then the company is in a good position to have a strong period of growth, and therefore, be a
sound investment. Amara Raja Batteies, we can see earnings are rising and so stock price, as
compared to peers too Amara Raja Batteies is better off.
Mar 2012 Mar 2011 Mar 2010 Mar 2009 Mar 2008
Net Profit 94.36 110.16 95.66 149.01 216.03
N=New
Companies, much like people, can get stuck in a rut. Without innovation, a company will
eventually die. But before it does, it will see its stock prices plummet, and take any investor
still clinging to it down. “NEW” in this case refers to new products or strategy to tap the un
tap market, hence Amara Raja Batteries scores well as they tap the un tap market like
AFRICA and keeps on adding new product to distribute to its customers.
S=Supply/Demand
Actually, it might make more sense for the "S" to stand for size as the CANSLIM stock
strategy assumes that it is easier for smaller companies to have significant growth spurts than
22 | P a g e
larger ones. Amara Raja Batteries has grown huge in last 2 decades and hence it is difficult to
have the same percentage of growth as compared to its peers in small cap as they have a
small base to compare with, hence, growth of Amara Raja Batteries is good.
L=Leader or Loser
Investors in the stock market must be able to discern the market leaders from those pulling up
the rear. Companies that manage to continually lead their industry typically have great
returns, and are fundamentally sound. Investors can identify leaders from losers by looking at
the Relative Price Strength (RPS). The relative price strength looks at companies over a given
period of time and then ranks them from 1-99. A business with an RPS of 75 indicates that
the stock of this company has outperformed 75% of the stocks in the market group. However,
CANSLIM stock strategy does not recommend companies with an RPS of less than 70.
Amara Raja Batteries has the considerable market share; hence it cannot be said as a market
leader based on marcap.
I=Institutional Sponsor
Every growing business needs the sponsorship of institutional investors in order to be taken
seriously as a sound investment opportunity. However, too many institutional investors can
be a problem as well. When this happens, the stock can potentially become more volatile in
the event of a natural disaster or crisis, because institutional investors are apt to sell off. Since
such investors tend to buy large chunks of stock at a time, too many sell-offs could send stock
prices crashing. Therefore, CANSLIM stock strategy includes staying away from any
company with more than 10 institutional investors. Amara Raja Batteries has more than 10
institutional investors hence fails in this criteria in form of MF’s, financial institution and
FII’s
M=Market Direction
For instance, investors who buy in just before a bear market emerges can literally be wiped
out if they are not careful. While the long-term prospects may be bright, short-term losses
will likely add up quickly. It may be years, if ever, before the stock prices recover to where
they were when the investment was initially made. At this point of time Indian stock markets
are really bullish on their view as it is growing and hence great chance to buy the stock as
number of FII entering markets are high as well as volumes are also on rise.
Hence, Amara Raja Batteries performs pretty well on most of the parameters of the
CANSLIM strategy of investing, Hence it would be a better deal to invest in stocks.
Truthfully, no stock investment strategy will guarantee a profit. Although the CANSLIM
stock strategy does require some personal judgment on the part of investors, it remains a
highly structured, well-researched, and proven system. And, while there may be no
guarantees, the CANSLIM stock strategy does remove the guesswork from choosing stock
investments to a certain extent, and provides investors with a solid foundation from which to
base future decisions.

1 | P a g e