Embed Size (px)
Citation preview
Equity Discussion in a Law Firm
March 2015
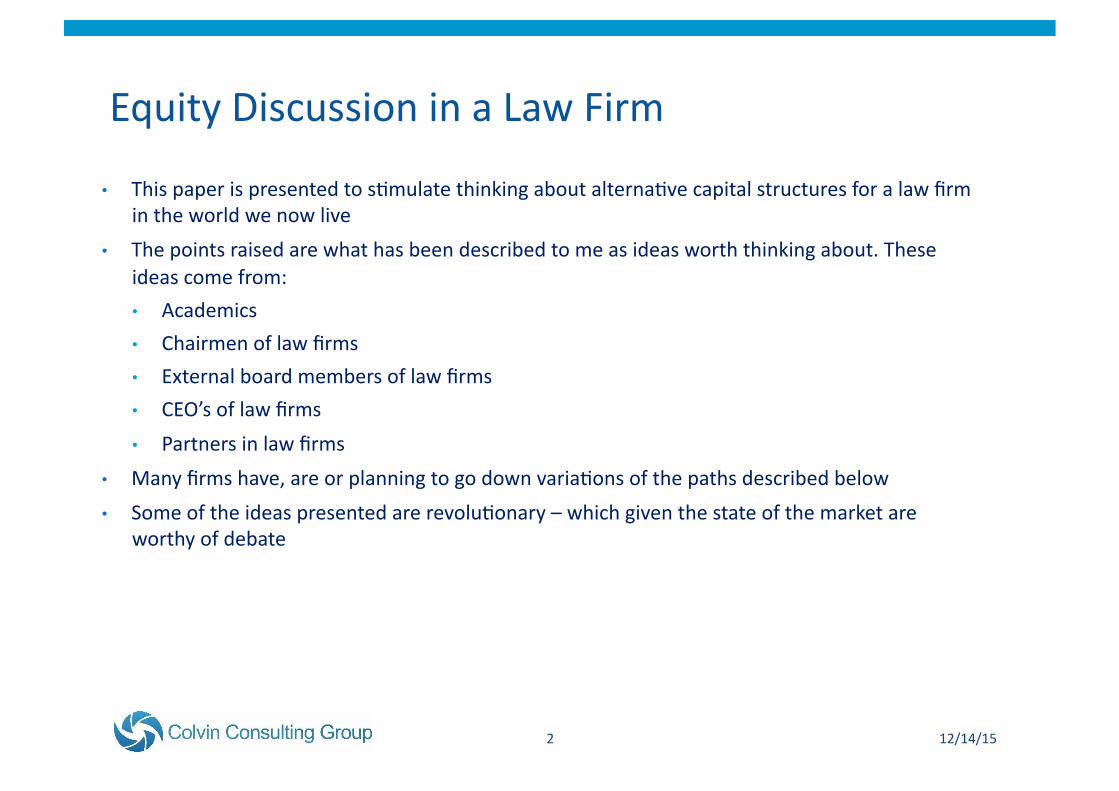
Equity Discussion in a Law Firm
• This paper is presented to s8mulate thinking about alterna8ve capital structures for a law firm in the world we now live
• The points raised are what has been described to me as ideas worth thinking about. These ideas come from:
• Academics
• Chairmen of law firms
• External board members of law firms
• CEO’s of law firms
• Partners in law firms
• Many firms have, are or planning to go down varia8ons of the paths described below
• Some of the ideas presented are revolu8onary – which given the state of the market are worthy of debate
12/14/15 2
Equity Discussion in a Law Firm
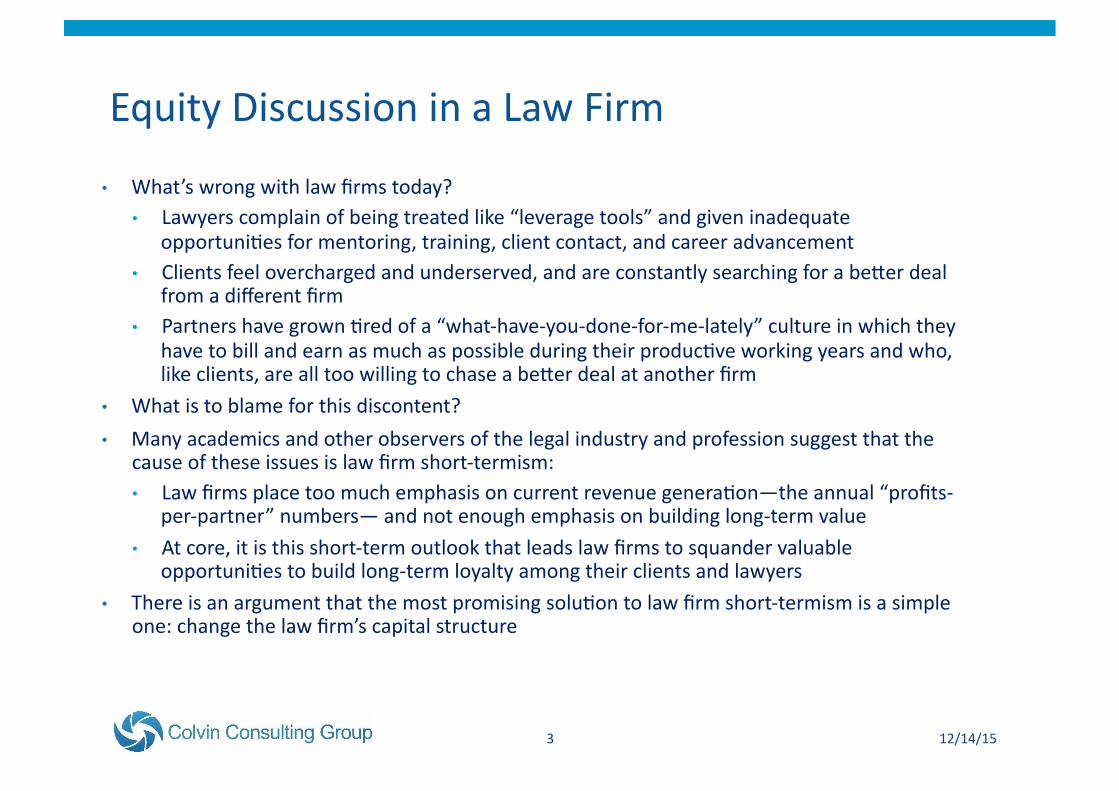
• What’s wrong with law firms today? • Lawyers complain of being treated like “leverage tools” and given inadequate
opportuni8es for mentoring, training, client contact, and career advancement • Clients feel overcharged and underserved, and are constantly searching for a beUer deal
from a different firm • Partners have grown 8red of a “what-‐have-‐you-‐done-‐for-‐me-‐lately” culture in which they
have to bill and earn as much as possible during their produc8ve working years and who, like clients, are all too willing to chase a beUer deal at another firm
• What is to blame for this discontent?
• Many academics and other observers of the legal industry and profession suggest that the cause of these issues is law firm short-‐termism: • Law firms place too much emphasis on current revenue genera8on—the annual “profits-‐
per-‐partner” numbers— and not enough emphasis on building long-‐term value
• At core, it is this short-‐term outlook that leads law firms to squander valuable opportuni8es to build long-‐term loyalty among their clients and lawyers
• There is an argument that the most promising solu8on to law firm short-‐termism is a simple one: change the law firm’s capital structure
12/14/15 3
Equity Discussion in a Law Firm
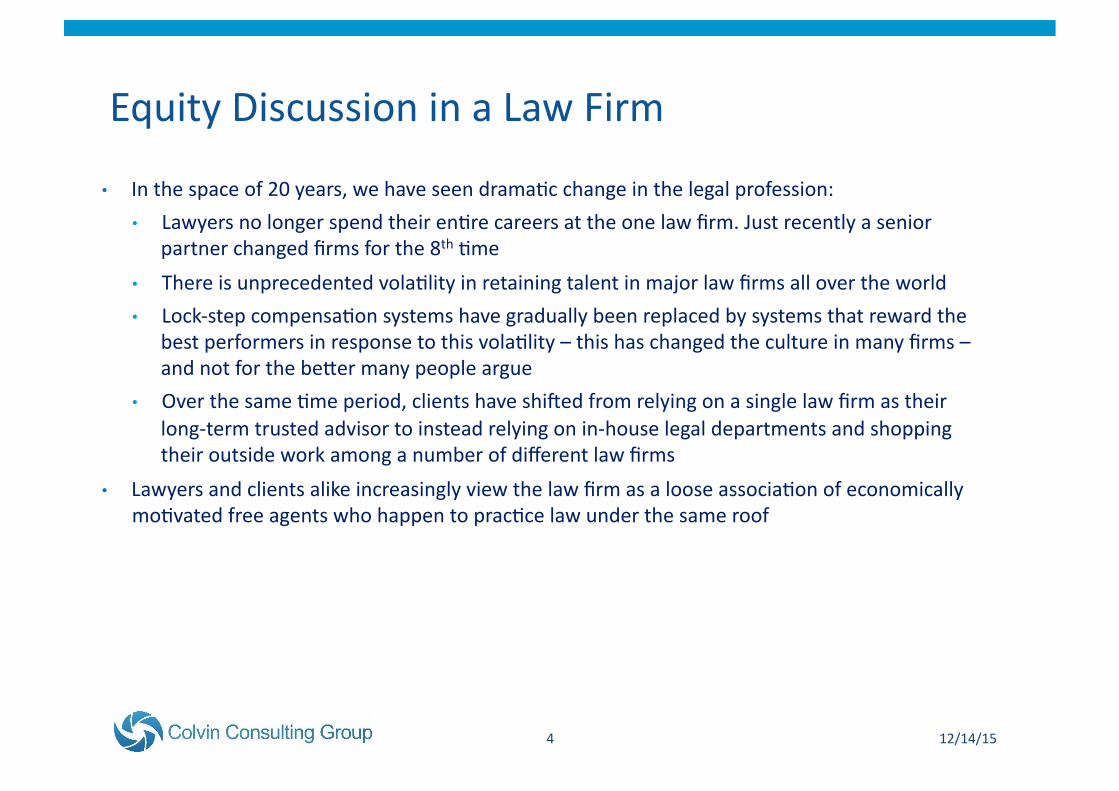
• In the space of 20 years, we have seen drama8c change in the legal profession:
• Lawyers no longer spend their en8re careers at the one law firm. Just recently a senior partner changed firms for the 8th 8me
• There is unprecedented vola8lity in retaining talent in major law firms all over the world
• Lock-‐step compensa8on systems have gradually been replaced by systems that reward the best performers in response to this vola8lity – this has changed the culture in many firms – and not for the beUer many people argue
• Over the same 8me period, clients have shi_ed from relying on a single law firm as their long-‐term trusted advisor to instead relying on in-‐house legal departments and shopping their outside work among a number of different law firms
• Lawyers and clients alike increasingly view the law firm as a loose associa8on of economically mo8vated free agents who happen to prac8ce law under the same roof
12/14/15 4
Equity Discussion in a Law Firm
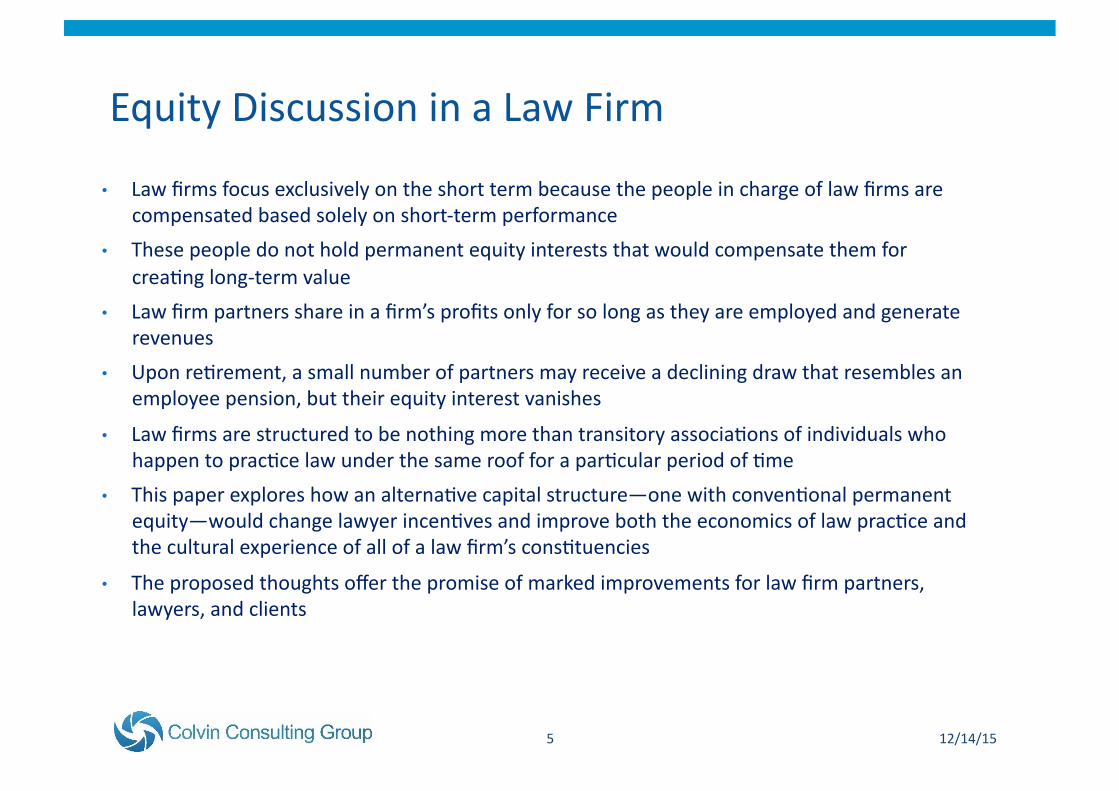
• Law firms focus exclusively on the short term because the people in charge of law firms are compensated based solely on short-‐term performance
• These people do not hold permanent equity interests that would compensate them for crea8ng long-‐term value
• Law firm partners share in a firm’s profits only for so long as they are employed and generate revenues
• Upon re8rement, a small number of partners may receive a declining draw that resembles an employee pension, but their equity interest vanishes
• Law firms are structured to be nothing more than transitory associa8ons of individuals who happen to prac8ce law under the same roof for a par8cular period of 8me
• This paper explores how an alterna8ve capital structure—one with conven8onal permanent equity—would change lawyer incen8ves and improve both the economics of law prac8ce and the cultural experience of all of a law firm’s cons8tuencies
• The proposed thoughts offer the promise of marked improvements for law firm partners, lawyers, and clients
12/14/15 5
Equity Discussion in a Law Firm
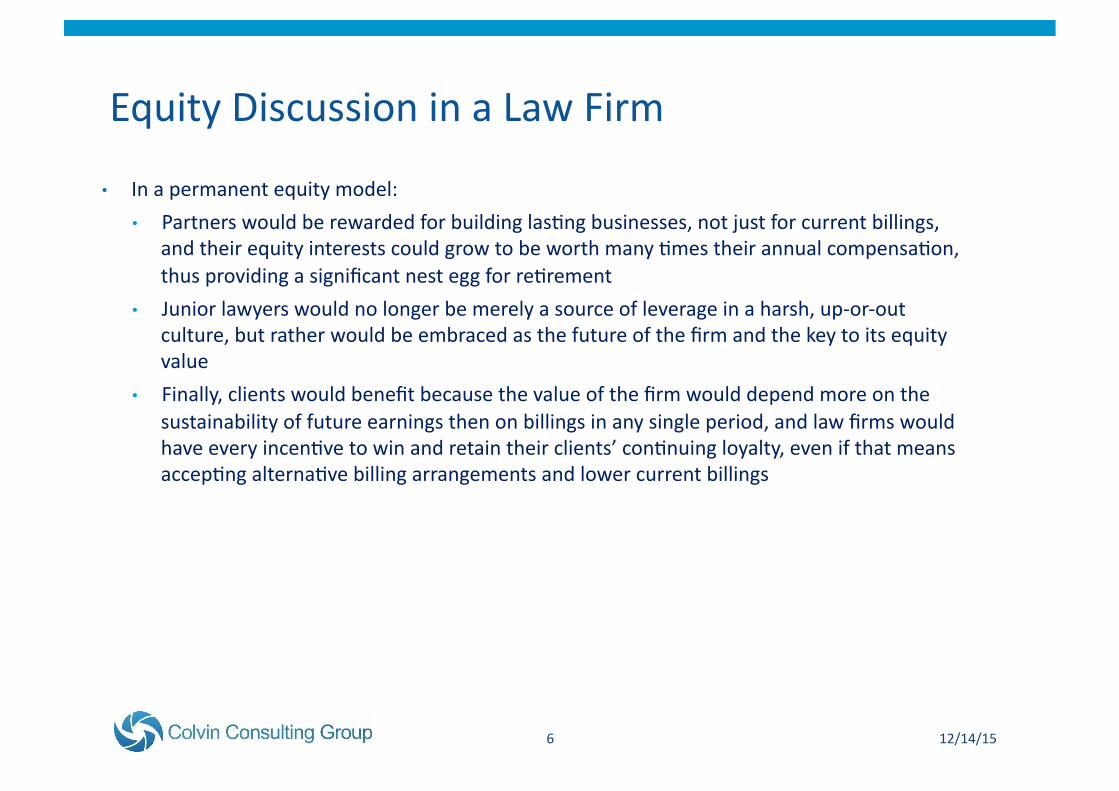
• In a permanent equity model:
• Partners would be rewarded for building las8ng businesses, not just for current billings, and their equity interests could grow to be worth many 8mes their annual compensa8on, thus providing a significant nest egg for re8rement
• Junior lawyers would no longer be merely a source of leverage in a harsh, up-‐or-‐out culture, but rather would be embraced as the future of the firm and the key to its equity value
• Finally, clients would benefit because the value of the firm would depend more on the sustainability of future earnings then on billings in any single period, and law firms would have every incen8ve to win and retain their clients’ con8nuing loyalty, even if that means accep8ng alterna8ve billing arrangements and lower current billings
12/14/15 6
Equity Discussion in a Law Firm
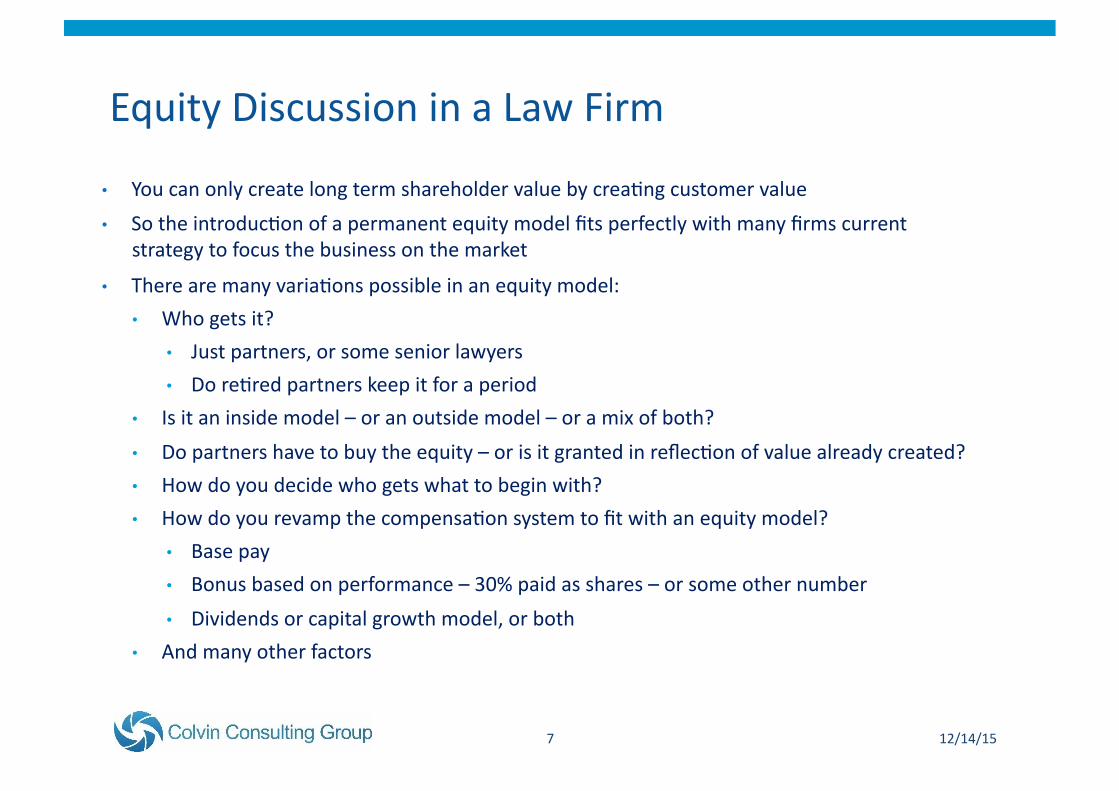
• You can only create long term shareholder value by crea8ng customer value
• So the introduc8on of a permanent equity model fits perfectly with many firms current strategy to focus the business on the market
• There are many varia8ons possible in an equity model:
• Who gets it?
• Just partners, or some senior lawyers
• Do re8red partners keep it for a period
• Is it an inside model – or an outside model – or a mix of both?
• Do partners have to buy the equity – or is it granted in reflec8on of value already created?
• How do you decide who gets what to begin with?
• How do you revamp the compensa8on system to fit with an equity model?
• Base pay
• Bonus based on performance – 30% paid as shares – or some other number
• Dividends or capital growth model, or both
• And many other factors
12/14/15 7
Equity Discussion in a Law Firm
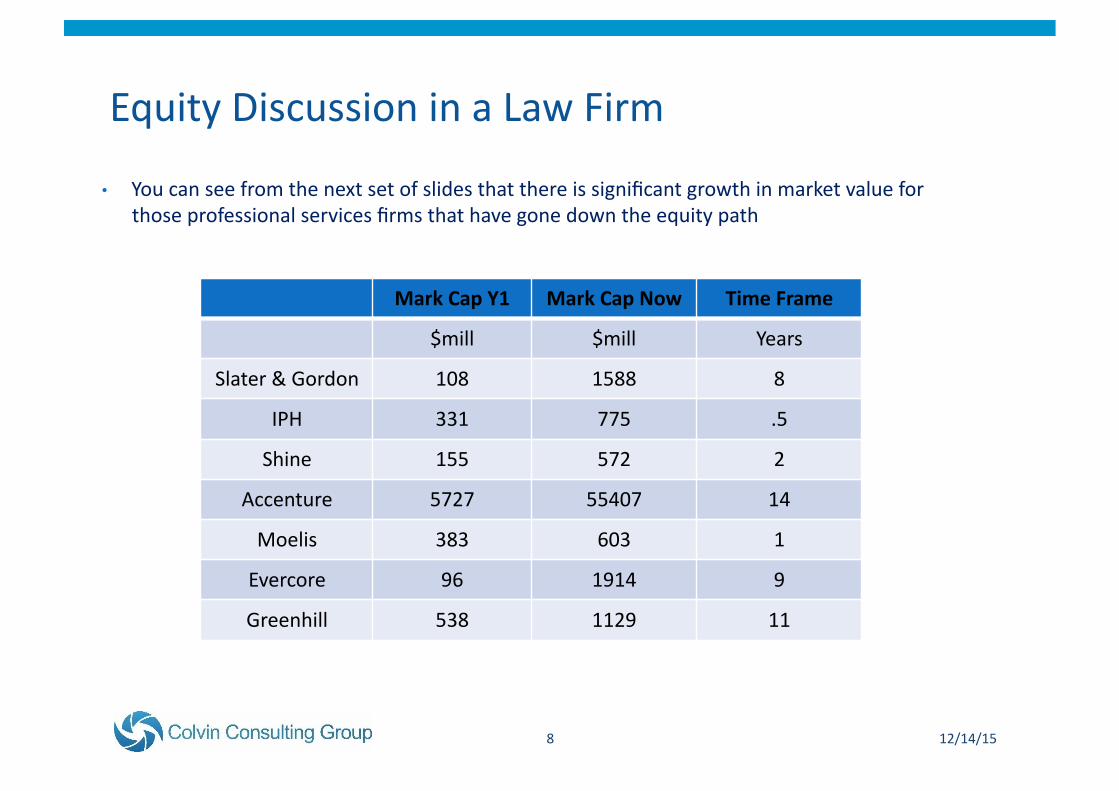
• You can see from the next set of slides that there is significant growth in market value for those professional services firms that have gone down the equity path
12/14/15 8
Mark Cap Y1 Mark Cap Now Time Frame
$mill $mill Years
Slater & Gordon 108 1588 8
IPH 331 775 .5
Shine 155 572 2
Accenture 5727 55407 14
Moelis 383 603 1
Evercore 96 1914 9
Greenhill 538 1129 11
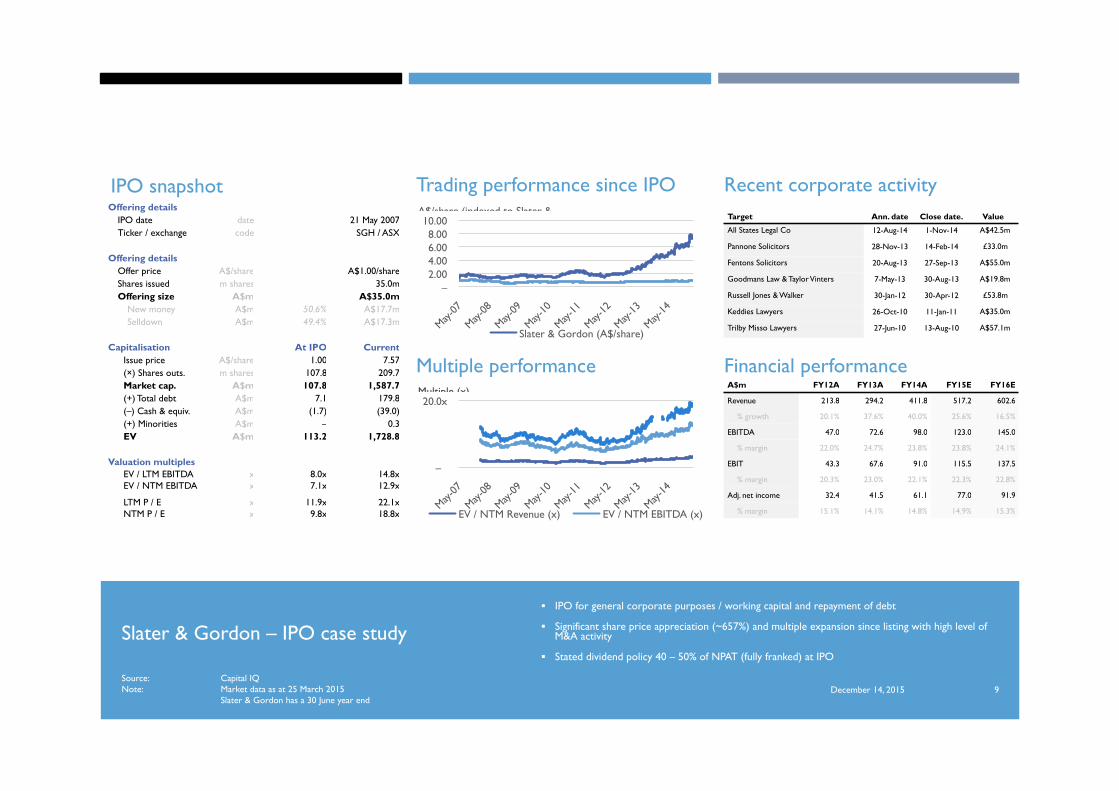
Slater & Gordon – IPO case study IPO for general corporate purposes / working capital and repayment of debt
Significant share price appreciation (~657%) and multiple expansion since listing with high level of M&A activity
Stated dividend policy 40 – 50% of NPAT (fully franked) at IPO
December 14, 2015 Source: Capital IQ Note: Market data as at 25 March 2015 Slater & Gordon has a 30 June year end
9
IPO snapshot Trading performance since IPO Recent corporate activity
Financial performance Multiple performance
– 2.00 4.00 6.00 8.00
10.00
Slater & Gordon (A$/share)
A$/share (indexed to Slater &
–
20.0x
EV / NTM Revenue (x) EV / NTM EBITDA (x)
Multiple (x)
Offering details IPO date date 21 May 2007 Ticker / exchange code SGH / ASX
Offering details Offer price A$/share A$1.00/share Shares issued m shares 35.0m Offering size A$m A$35.0m
New money A$m 50.6% A$17.7m Selldown A$m 49.4% A$17.3m
Capitalisation At IPO Current Issue price A$/share 1.00 7.57 (×) Shares outs. m shares 107.8 209.7 Market cap. A$m 107.8 1,587.7 (+) Total debt A$m 7.1 179.8 (–) Cash & equiv. A$m (1.7) (39.0) (+) Minorities A$m – 0.3 EV A$m 113.2 1,728.8
Valuation multiples EV / LTM EBITDA x 8.0x 14.8x EV / NTM EBITDA x 7.1x 12.9x
LTM P / E x 11.9x 22.1x NTM P / E x 9.8x 18.8x
A$m FY12A FY13A FY14A FY15E FY16E
Revenue 213.8 294.2 411.8 517.2 602.6
% growth 20.1% 37.6% 40.0% 25.6% 16.5%
EBITDA 47.0 72.6 98.0 123.0 145.0
% margin 22.0% 24.7% 23.8% 23.8% 24.1%
EBIT 43.3 67.6 91.0 115.5 137.5
% margin 20.3% 23.0% 22.1% 22.3% 22.8%
Adj. net income 32.4 41.5 61.1 77.0 91.9
% margin 15.1% 14.1% 14.8% 14.9% 15.3%
Target Ann. date Close date. Value
All States Legal Co 12-Aug-14 1-Nov-14 A$42.5m
Pannone Solicitors 28-Nov-13 14-Feb-14 £33.0m
Fentons Solicitors 20-Aug-13 27-Sep-13 A$55.0m
Goodmans Law & Taylor Vinters 7-May-13 30-Aug-13 A$19.8m
Russell Jones & Walker 30-Jan-12 30-Apr-12 £53.8m
Keddies Lawyers 26-Oct-10 11-Jan-11 A$35.0m
Trilby Misso Lawyers 27-Jun-10 13-Aug-10 A$57.1m
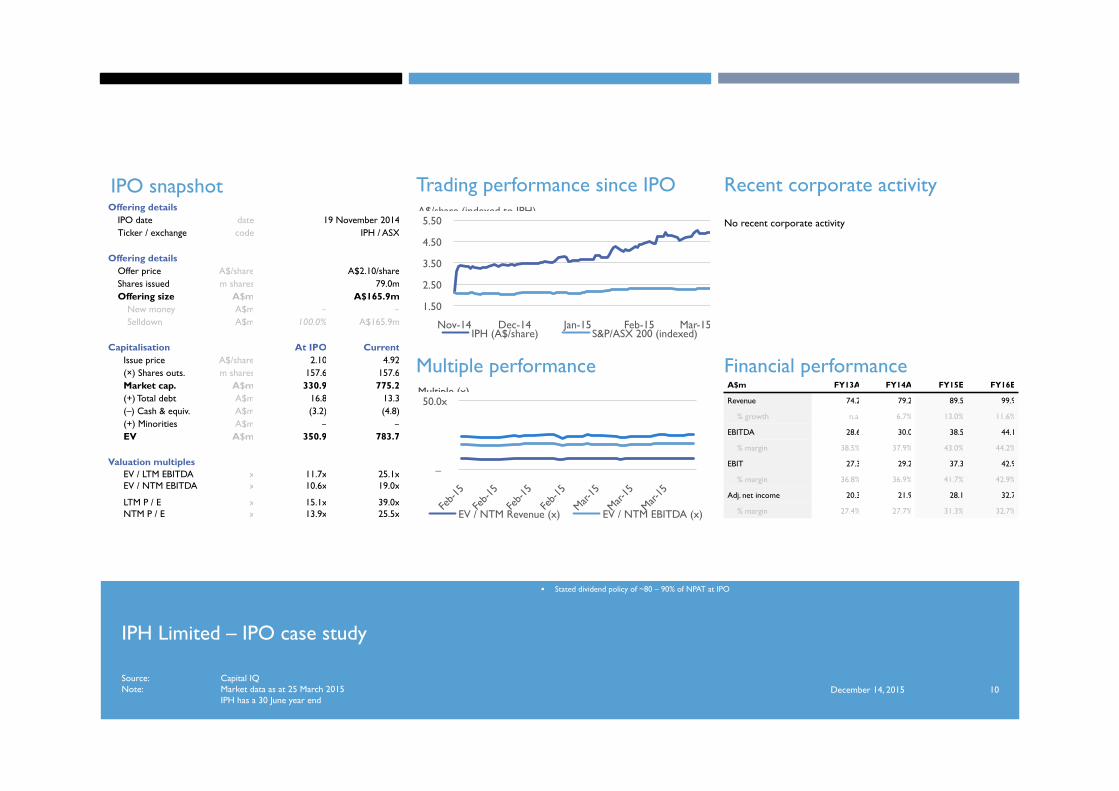
IPH Limited – IPO case study
IPO to provide existing owners with exit opportunity and repayment of debt facilities
Share price appreciation of ~134% since IPO in November 2014
Stated dividend policy of ~80 – 90% of NPAT at IPO
December 14, 2015 Source: Capital IQ Note: Market data as at 25 March 2015 IPH has a 30 June year end
10
IPO snapshot Trading performance since IPO Recent corporate activity
Financial performance Multiple performance
Offering details IPO date date 19 November 2014 Ticker / exchange code IPH / ASX
Offering details Offer price A$/share A$2.10/share Shares issued m shares 79.0m Offering size A$m A$165.9m
New money A$m – – Selldown A$m 100.0% A$165.9m
Capitalisation At IPO Current Issue price A$/share 2.10 4.92 (×) Shares outs. m shares 157.6 157.6 Market cap. A$m 330.9 775.2 (+) Total debt A$m 16.8 13.3 (–) Cash & equiv. A$m (3.2) (4.8) (+) Minorities A$m – – EV A$m 350.9 783.7
Valuation multiples EV / LTM EBITDA x 11.7x 25.1x EV / NTM EBITDA x 10.6x 19.0x
LTM P / E x 15.1x 39.0x NTM P / E x 13.9x 25.5x
A$m FY13A FY14A FY15E FY16E
Revenue 74.2 79.2 89.5 99.9
% growth n.a. 6.7% 13.0% 11.6%
EBITDA 28.6 30.0 38.5 44.1
% margin 38.5% 37.9% 43.0% 44.2%
EBIT 27.3 29.2 37.3 42.9
% margin 36.8% 36.9% 41.7% 42.9%
Adj. net income 20.3 21.9 28.1 32.7
% margin 27.4% 27.7% 31.3% 32.7%
–
50.0x
EV / NTM Revenue (x) EV / NTM EBITDA (x)
Multiple (x)
1.50
2.50
3.50
4.50
5.50
Nov-14 Dec-14 Jan-15 Feb-15 Mar-15 IPH (A$/share) S&P/ASX 200 (indexed)
A$/share (indexed to IPH) No recent corporate activity
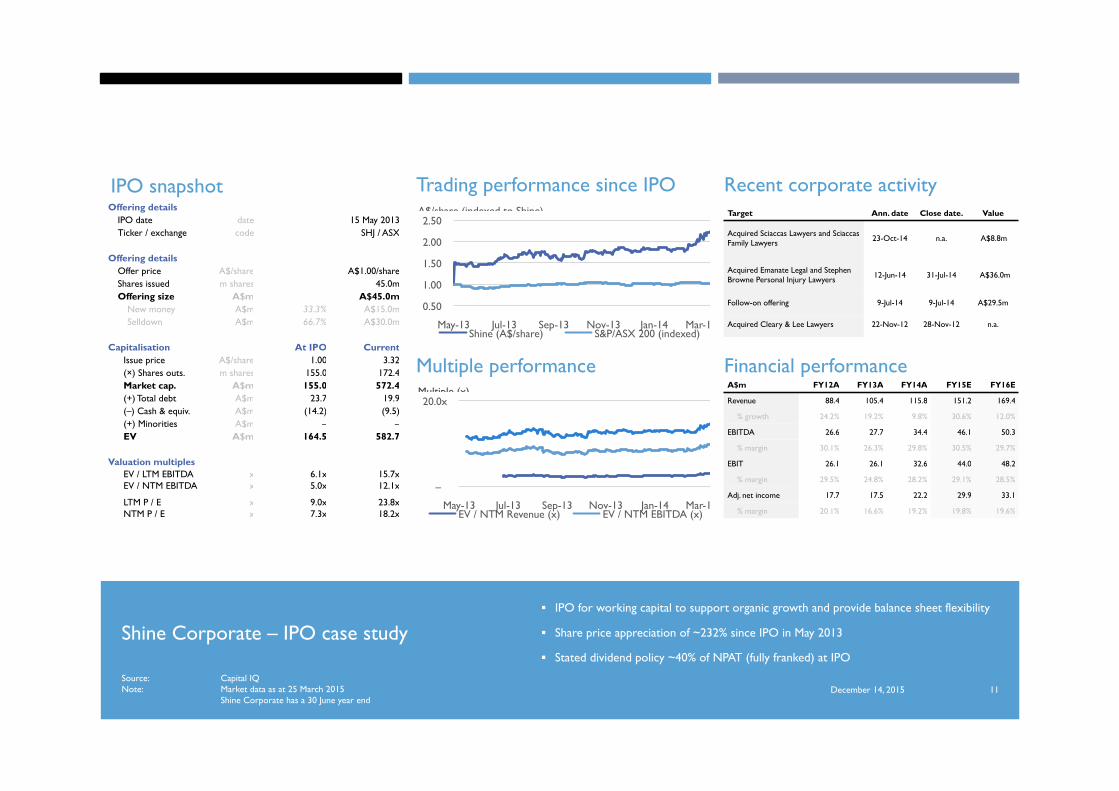
Shine Corporate – IPO case study IPO for working capital to support organic growth and provide balance sheet flexibility
Share price appreciation of ~232% since IPO in May 2013
Stated dividend policy ~40% of NPAT (fully franked) at IPO
December 14, 2015 Source: Capital IQ Note: Market data as at 25 March 2015 Shine Corporate has a 30 June year end
11
IPO snapshot Trading performance since IPO Recent corporate activity
Financial performance Multiple performance
Offering details IPO date date 15 May 2013 Ticker / exchange code SHJ / ASX
Offering details Offer price A$/share A$1.00/share Shares issued m shares 45.0m Offering size A$m A$45.0m
New money A$m 33.3% A$15.0m Selldown A$m 66.7% A$30.0m
Capitalisation At IPO Current Issue price A$/share 1.00 3.32 (×) Shares outs. m shares 155.0 172.4 Market cap. A$m 155.0 572.4 (+) Total debt A$m 23.7 19.9 (–) Cash & equiv. A$m (14.2) (9.5) (+) Minorities A$m – – EV A$m 164.5 582.7
Valuation multiples EV / LTM EBITDA x 6.1x 15.7x EV / NTM EBITDA x 5.0x 12.1x
LTM P / E x 9.0x 23.8x NTM P / E x 7.3x 18.2x
0.50
1.00
1.50
2.00
2.50
May-13 Jul-13 Sep-13 Nov-13 Jan-14 Mar-14 Shine (A$/share) S&P/ASX 200 (indexed)
A$/share (indexed to Shine)
–
20.0x
May-13 Jul-13 Sep-13 Nov-13 Jan-14 Mar-14 EV / NTM Revenue (x) EV / NTM EBITDA (x)
Multiple (x) A$m FY12A FY13A FY14A FY15E FY16E
Revenue 88.4 105.4 115.8 151.2 169.4
% growth 24.2% 19.2% 9.8% 30.6% 12.0%
EBITDA 26.6 27.7 34.4 46.1 50.3
% margin 30.1% 26.3% 29.8% 30.5% 29.7%
EBIT 26.1 26.1 32.6 44.0 48.2
% margin 29.5% 24.8% 28.2% 29.1% 28.5%
Adj. net income 17.7 17.5 22.2 29.9 33.1
% margin 20.1% 16.6% 19.2% 19.8% 19.6%
Target Ann. date Close date. Value
Acquired Sciaccas Lawyers and Sciaccas Family Lawyers 23-Oct-14 n.a. A$8.8m
Acquired Emanate Legal and Stephen Browne Personal Injury Lawyers 12-Jun-14 31-Jul-14 A$36.0m
Follow-on offering 9-Jul-14 9-Jul-14 A$29.5m
Acquired Cleary & Lee Lawyers 22-Nov-12 28-Nov-12 n.a.
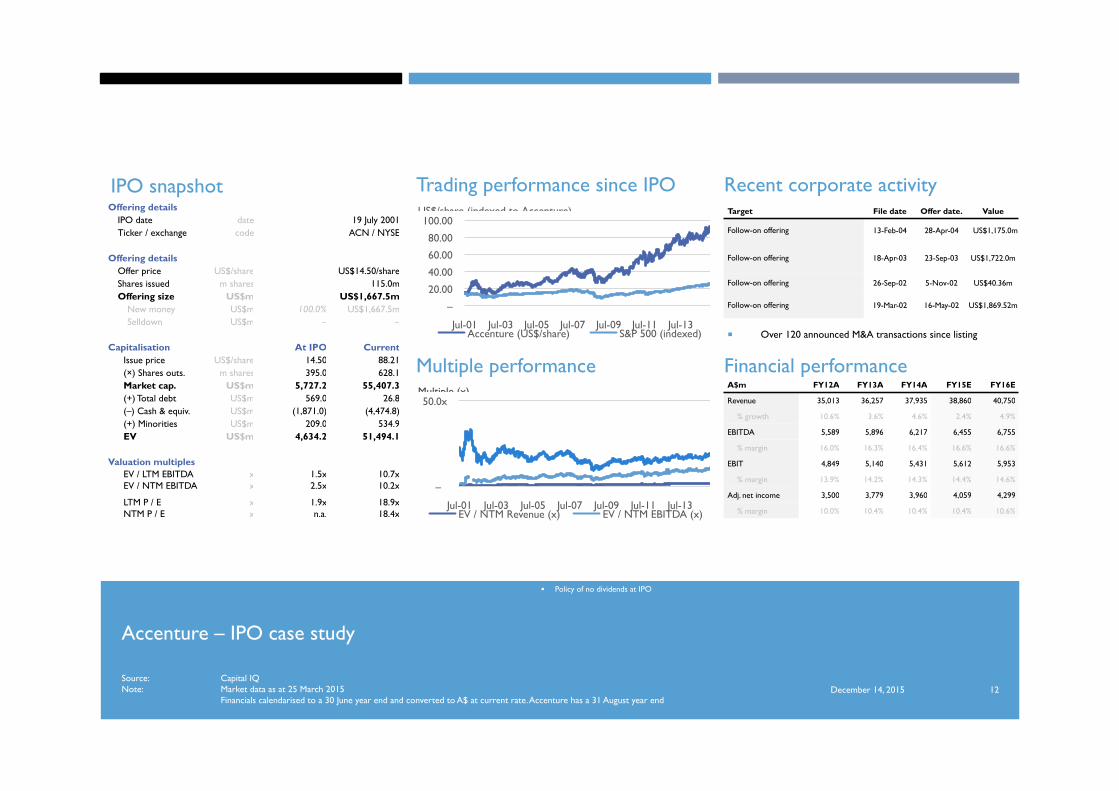
Accenture – IPO case study
IPO to cover expenses from corporate transition, debt repayment, general corporate and working capital
Share price appreciation of ~508% since IPO in July 2001
Policy of no dividends at IPO
December 14, 2015 Source: Capital IQ Note: Market data as at 25 March 2015 Financials calendarised to a 30 June year end and converted to A$ at current rate. Accenture has a 31 August year end
12
IPO snapshot Trading performance since IPO Recent corporate activity
Financial performance Multiple performance
Offering details IPO date date 19 July 2001 Ticker / exchange code ACN / NYSE
Offering details Offer price US$/share US$14.50/share Shares issued m shares 115.0m Offering size US$m US$1,667.5m
New money US$m 100.0% US$1,667.5m Selldown US$m – –
Capitalisation At IPO Current Issue price US$/share 14.50 88.21 (×) Shares outs. m shares 395.0 628.1 Market cap. US$m 5,727.2 55,407.3 (+) Total debt US$m 569.0 26.8 (–) Cash & equiv. US$m (1,871.0) (4,474.8) (+) Minorities US$m 209.0 534.9 EV US$m 4,634.2 51,494.1
Valuation multiples EV / LTM EBITDA x 1.5x 10.7x EV / NTM EBITDA x 2.5x 10.2x
LTM P / E x 1.9x 18.9x NTM P / E x n.a. 18.4x
A$m FY12A FY13A FY14A FY15E FY16E
Revenue 35,013 36,257 37,935 38,860 40,750
% growth 10.6% 3.6% 4.6% 2.4% 4.9%
EBITDA 5,589 5,896 6,217 6,455 6,755
% margin 16.0% 16.3% 16.4% 16.6% 16.6%
EBIT 4,849 5,140 5,431 5,612 5,953
% margin 13.9% 14.2% 14.3% 14.4% 14.6%
Adj. net income 3,500 3,779 3,960 4,059 4,299
% margin 10.0% 10.4% 10.4% 10.4% 10.6%
–
50.0x
Jul-01 Jul-03 Jul-05 Jul-07 Jul-09 Jul-11 Jul-13 EV / NTM Revenue (x) EV / NTM EBITDA (x)
Multiple (x)
–
20.00
40.00
60.00
80.00
100.00
Jul-01 Jul-03 Jul-05 Jul-07 Jul-09 Jul-11 Jul-13 Accenture (US$/share) S&P 500 (indexed)
US$/share (indexed to Accenture)
Over 120 announced M&A transactions since listing
Target File date Offer date. Value
Follow-on offering 13-Feb-04 28-Apr-04 US$1,175.0m
Follow-on offering 18-Apr-03 23-Sep-03 US$1,722.0m
Follow-on offering 26-Sep-02 5-Nov-02 US$40.36m
Follow-on offering 19-Mar-02 16-May-02 US$1,869.52m
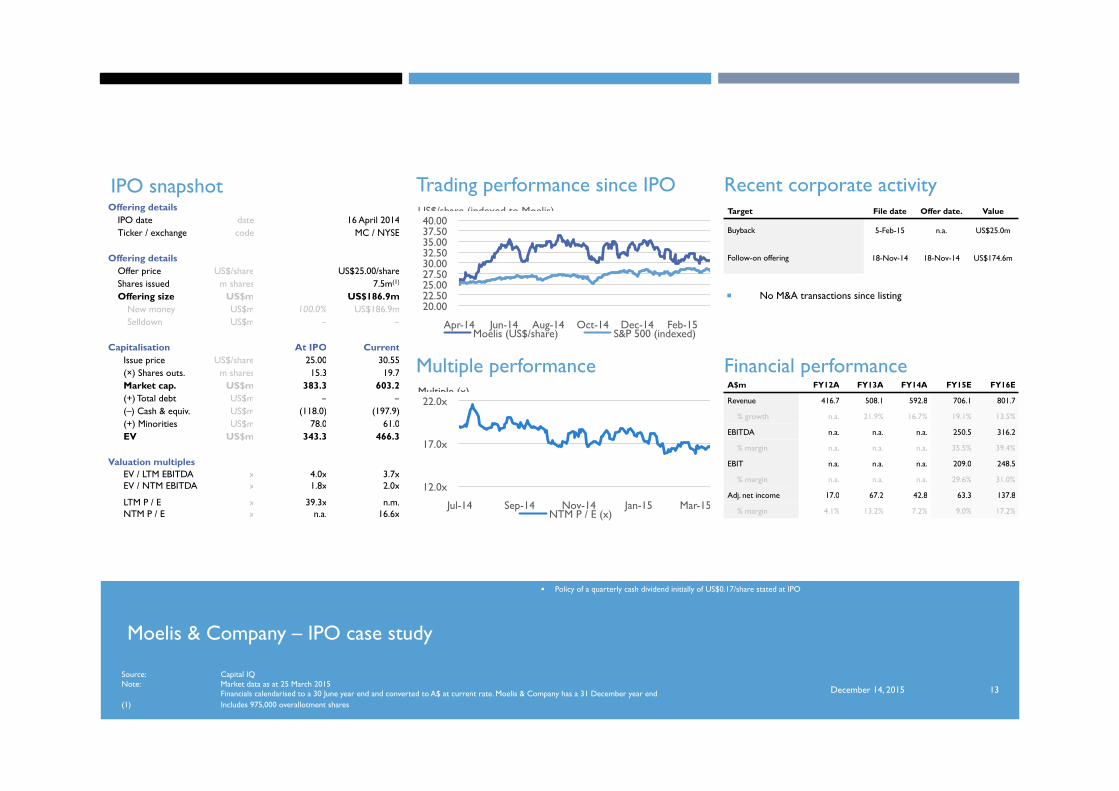
Moelis & Company – IPO case study
IPO to provide existing owners and partners with exit opportunity and strengthen branding
Share price appreciation of ~22% since IPO in April 2014
Policy of a quarterly cash dividend initially of US$0.17/share stated at IPO
December 14, 2015
Source: Capital IQ Note: Market data as at 25 March 2015 Financials calendarised to a 30 June year end and converted to A$ at current rate. Moelis & Company has a 31 December year end (1) Includes 975,000 overallotment shares
13
IPO snapshot Trading performance since IPO Recent corporate activity
Financial performance Multiple performance
Offering details IPO date date 16 April 2014 Ticker / exchange code MC / NYSE
Offering details Offer price US$/share US$25.00/share Shares issued m shares 7.5m(1)
Offering size US$m US$186.9m New money US$m 100.0% US$186.9m Selldown US$m – –
Capitalisation At IPO Current Issue price US$/share 25.00 30.55 (×) Shares outs. m shares 15.3 19.7 Market cap. US$m 383.3 603.2 (+) Total debt US$m – – (–) Cash & equiv. US$m (118.0) (197.9) (+) Minorities US$m 78.0 61.0 EV US$m 343.3 466.3
Valuation multiples EV / LTM EBITDA x 4.0x 3.7x EV / NTM EBITDA x 1.8x 2.0x
LTM P / E x 39.3x n.m. NTM P / E x n.a. 16.6x
A$m FY12A FY13A FY14A FY15E FY16E
Revenue 416.7 508.1 592.8 706.1 801.7
% growth n.a. 21.9% 16.7% 19.1% 13.5%
EBITDA n.a. n.a. n.a. 250.5 316.2
% margin n.a. n.a. n.a. 35.5% 39.4%
EBIT n.a. n.a. n.a. 209.0 248.5
% margin n.a. n.a. n.a. 29.6% 31.0%
Adj. net income 17.0 67.2 42.8 63.3 137.8
% margin 4.1% 13.2% 7.2% 9.0% 17.2%
No M&A transactions since listing
Target File date Offer date. Value
Buyback 5-Feb-15 n.a. US$25.0m
Follow-on offering 18-Nov-14 18-Nov-14 US$174.6m
20.00 22.50 25.00 27.50 30.00 32.50 35.00 37.50 40.00
Apr-14 Jun-14 Aug-14 Oct-14 Dec-14 Feb-15 Moelis (US$/share) S&P 500 (indexed)
US$/share (indexed to Moelis)
12.0x
17.0x
22.0x
Jul-14 Sep-14 Nov-14 Jan-15 Mar-15 NTM P / E (x)
Multiple (x)
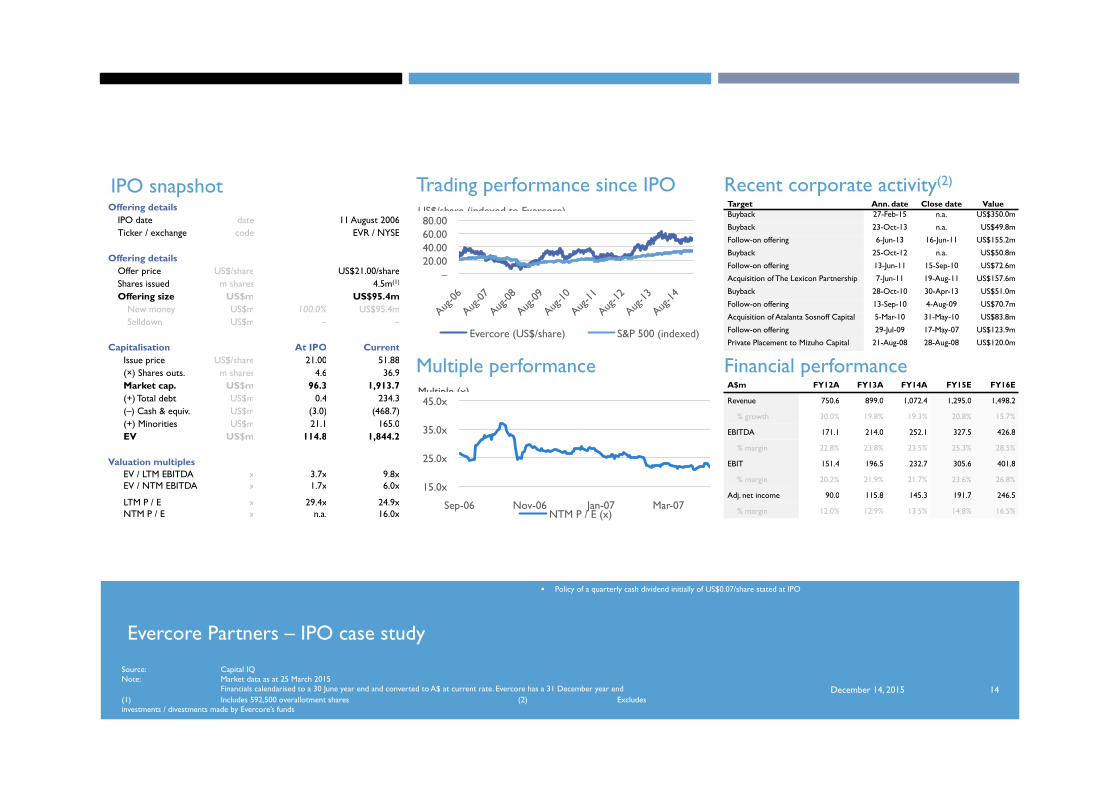
Evercore Partners – IPO case study
IPO to raise funds to repay outstanding debt
Share price appreciation of ~147% since IPO in August 2006
Policy of a quarterly cash dividend initially of US$0.07/share stated at IPO
December 14, 2015
Source: Capital IQ Note: Market data as at 25 March 2015 Financials calendarised to a 30 June year end and converted to A$ at current rate. Evercore has a 31 December year end (1) Includes 592,500 overallotment shares (2) Excludes investments / divestments made by Evercore’s funds
14
IPO snapshot Trading performance since IPO Recent corporate activity(2)
Financial performance Multiple performance
Offering details IPO date date 11 August 2006 Ticker / exchange code EVR / NYSE
Offering details Offer price US$/share US$21.00/share Shares issued m shares 4.5m(1)
Offering size US$m US$95.4m New money US$m 100.0% US$95.4m Selldown US$m – –
Capitalisation At IPO Current Issue price US$/share 21.00 51.88 (×) Shares outs. m shares 4.6 36.9 Market cap. US$m 96.3 1,913.7 (+) Total debt US$m 0.4 234.3 (–) Cash & equiv. US$m (3.0) (468.7) (+) Minorities US$m 21.1 165.0 EV US$m 114.8 1,844.2
Valuation multiples EV / LTM EBITDA x 3.7x 9.8x EV / NTM EBITDA x 1.7x 6.0x
LTM P / E x 29.4x 24.9x NTM P / E x n.a. 16.0x
A$m FY12A FY13A FY14A FY15E FY16E
Revenue 750.6 899.0 1,072.4 1,295.0 1,498.2
% growth 30.0% 19.8% 19.3% 20.8% 15.7%
EBITDA 171.1 214.0 252.1 327.5 426.8
% margin 22.8% 23.8% 23.5% 25.3% 28.5%
EBIT 151.4 196.5 232.7 305.6 401.8
% margin 20.2% 21.9% 21.7% 23.6% 26.8%
Adj. net income 90.0 115.8 145.3 191.7 246.5
% margin 12.0% 12.9% 13.5% 14.8% 16.5%
Target Ann. date Close date Value Buyback 27-Feb-15 n.a. US$350.0m
Buyback 23-Oct-13 n.a. US$49.8m
Follow-on offering 6-Jun-13 16-Jun-11 US$155.2m
Buyback 25-Oct-12 n.a. US$50.8m
Follow-on offering 13-Jun-11 15-Sep-10 US$72.6m
Acquisition of The Lexicon Partnership 7-Jun-11 19-Aug-11 US$157.6m
Buyback 28-Oct-10 30-Apr-13 US$51.0m
Follow-on offering 13-Sep-10 4-Aug-09 US$70.7m
Acquisition of Atalanta Sosnoff Capital 5-Mar-10 31-May-10 US$83.8m
Follow-on offering 29-Jul-09 17-May-07 US$123.9m
Private Placement to Mizuho Capital 21-Aug-08 28-Aug-08 US$120.0m
– 20.00 40.00 60.00 80.00
Evercore (US$/share) S&P 500 (indexed)
US$/share (indexed to Evercore)
15.0x
25.0x
35.0x
45.0x
Sep-06 Nov-06 Jan-07 Mar-07 NTM P / E (x)
Multiple (x)
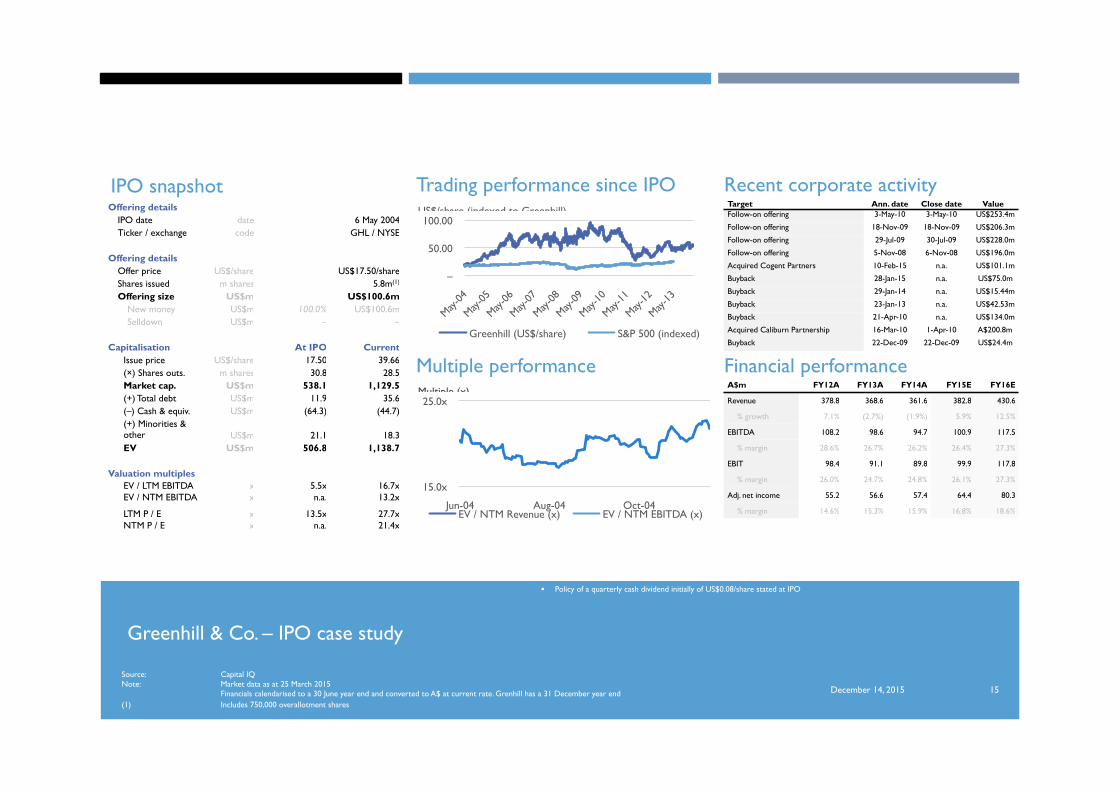
Greenhill & Co. – IPO case study
IPO for general corporate purposes including repayment of bank debt and setting up new merchant banking funds
Share price appreciation of ~127% since IPO in August 2006
Policy of a quarterly cash dividend initially of US$0.08/share stated at IPO
December 14, 2015
Source: Capital IQ Note: Market data as at 25 March 2015 Financials calendarised to a 30 June year end and converted to A$ at current rate. Grenhill has a 31 December year end (1) Includes 750,000 overallotment shares
15
IPO snapshot Trading performance since IPO Recent corporate activity
Financial performance Multiple performance
Offering details IPO date date 6 May 2004 Ticker / exchange code GHL / NYSE
Offering details Offer price US$/share US$17.50/share Shares issued m shares 5.8m(1)
Offering size US$m US$100.6m New money US$m 100.0% US$100.6m Selldown US$m – –
Capitalisation At IPO Current Issue price US$/share 17.50 39.66 (×) Shares outs. m shares 30.8 28.5 Market cap. US$m 538.1 1,129.5 (+) Total debt US$m 11.9 35.6 (–) Cash & equiv. US$m (64.3) (44.7) (+) Minorities & other US$m 21.1 18.3 EV US$m 506.8 1,138.7
Valuation multiples EV / LTM EBITDA x 5.5x 16.7x EV / NTM EBITDA x n.a. 13.2x
LTM P / E x 13.5x 27.7x NTM P / E x n.a. 21.4x
A$m FY12A FY13A FY14A FY15E FY16E
Revenue 378.8 368.6 361.6 382.8 430.6
% growth 7.1% (2.7%) (1.9%) 5.9% 12.5%
EBITDA 108.2 98.6 94.7 100.9 117.5
% margin 28.6% 26.7% 26.2% 26.4% 27.3%
EBIT 98.4 91.1 89.8 99.9 117.8
% margin 26.0% 24.7% 24.8% 26.1% 27.3%
Adj. net income 55.2 56.6 57.4 64.4 80.3
% margin 14.6% 15.3% 15.9% 16.8% 18.6%
Target Ann. date Close date Value Follow-on offering 3-May-10 3-May-10 US$253.4m
Follow-on offering 18-Nov-09 18-Nov-09 US$206.3m
Follow-on offering 29-Jul-09 30-Jul-09 US$228.0m
Follow-on offering 5-Nov-08 6-Nov-08 US$196.0m
Acquired Cogent Partners 10-Feb-15 n.a. US$101.1m
Buyback 28-Jan-15 n.a. US$75.0m
Buyback 29-Jan-14 n.a. US$15.44m
Buyback 23-Jan-13 n.a. US$42.53m
Buyback 21-Apr-10 n.a. US$134.0m
Acquired Caliburn Partnership 16-Mar-10 1-Apr-10 A$200.8m
Buyback 22-Dec-09 22-Dec-09 US$24.4m
–
50.00
100.00
Greenhill (US$/share) S&P 500 (indexed)
US$/share (indexed to Greenhill)
15.0x
25.0x
Jun-04 Aug-04 Oct-04 EV / NTM Revenue (x) EV / NTM EBITDA (x)
Multiple (x)