Embed Size (px)
Citation preview

June 2015
Energy A National Perspective

The early days…

3
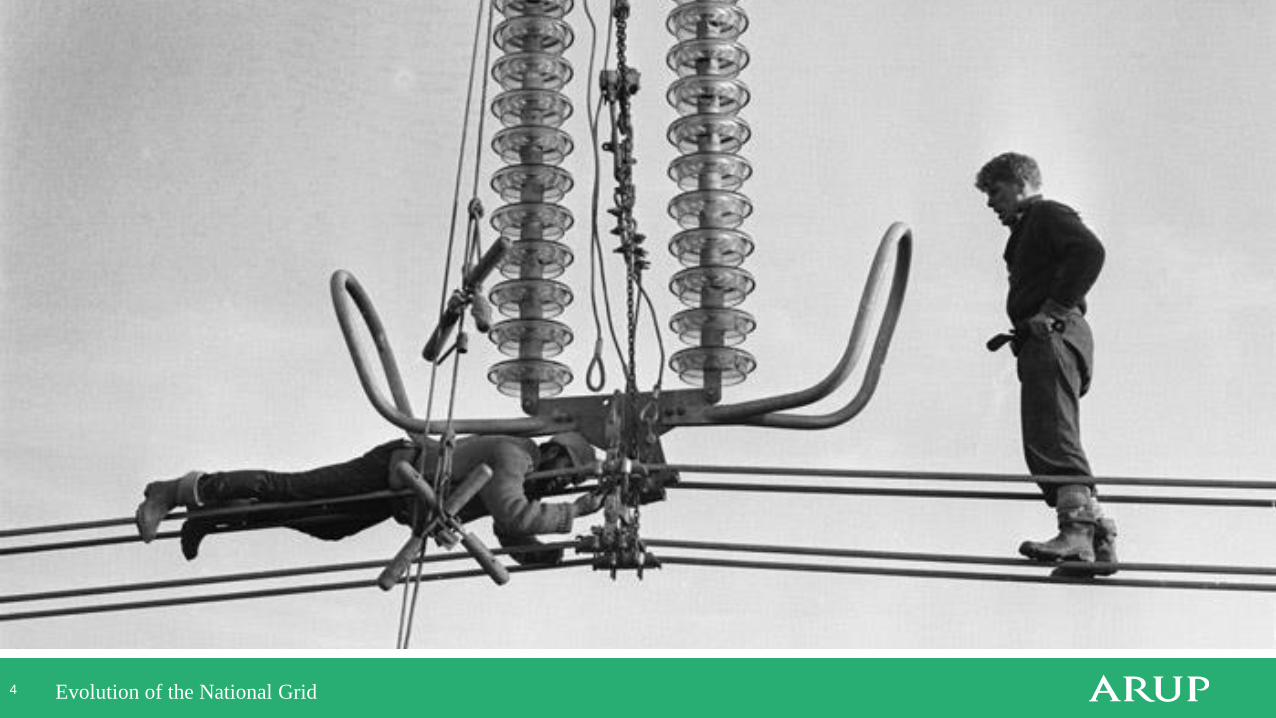
3 Evolution of the National Grid
1932-1937:
• Central Electricity Board (CEB) established to link power stations
with consumers via a 'national gridiron'
• 132kV network interconnected regional grids in the Central Scotland
and Mid-East England areas.
• Small and inefficient power stations are being closed down.
• Seven grid areas are created to cover the UK, with control rooms at
Newcastle, Leeds, Manchester, Birmingham, Bristol, London and
Glasgow.
• The Electricity Supply (Meters) Act 1936 makes provision for the
certifying and examination of electricity meters
• 1937: All areas of the Grid first coupled together as a single unit
4
4 Evolution of the National Grid

5
5 Evolution of the National Grid
• 1944: 2 out of 3 houses with electricity connections – the
doubling in 10 years
• 1949-1961: cross-Channel power link completed with
France, but the link was often damaged by ship's anchors.
• 1950: Beginning of 275kV supergrid development to meet
demand with 400kV future capacity.
• 1950: The first electric storage heaters became available.
• 1951: Experimental heat pump commissioned at the Royal
Festival Hall driven by two Rolls-Royce Merlin aircraft
engines and the River Thames as a heat source.

6
6 Evolution of the National Grid
• The system was operated via distributed control centres

7
7 Evolution of the National Grid
Early nimbyism…
• 1950s: British farmer Dudley Glanfield of Surrey
prevents the Electricity Board from putting giant
electrical pylons on his land by patrolling with a
shot gun.

8
8 Evolution of the National Grid
1975: For the first time, demand
reduces. 23 power stations closed.

9
9 Evolution of the National Grid
1982: The CEGB
installs the UK’s first
wind turbine plant at
Camarthen Bay in South
Wales

1
0
10 Evolution of the National Grid
1986: 2000MW interconnector
between France and England is
commissioned- the largest
submarine line in the world at
the time

1
1
11
1990: Electricity industry restructured and
then privatised.
1990: National Grid Company plc takes
ownership and control of the transmission
system and joint ownership of the
interconnectors with Scotland and France
1995: ‘dash for gas’ begins and the grid
has to accommodate the new technology
of combined cycle gas turbines.
1996: The Electricity National Control
Centre in Wokingham is now operating
the UK system, replacing the seven
regional control centres

Current challenges…

1
3
13 Current challenges… Balancing Supply & Demand
Source: DECC
1
4
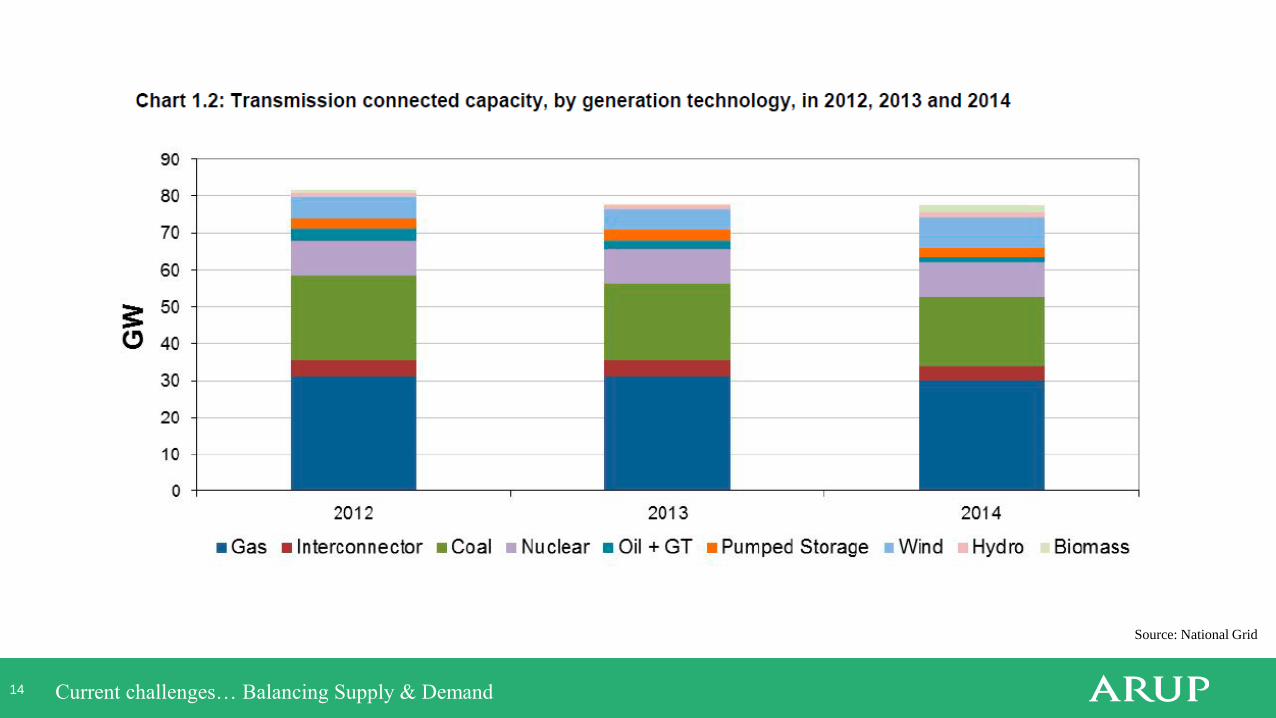
14 Current challenges… Balancing Supply & Demand
Source: National Grid
1
5
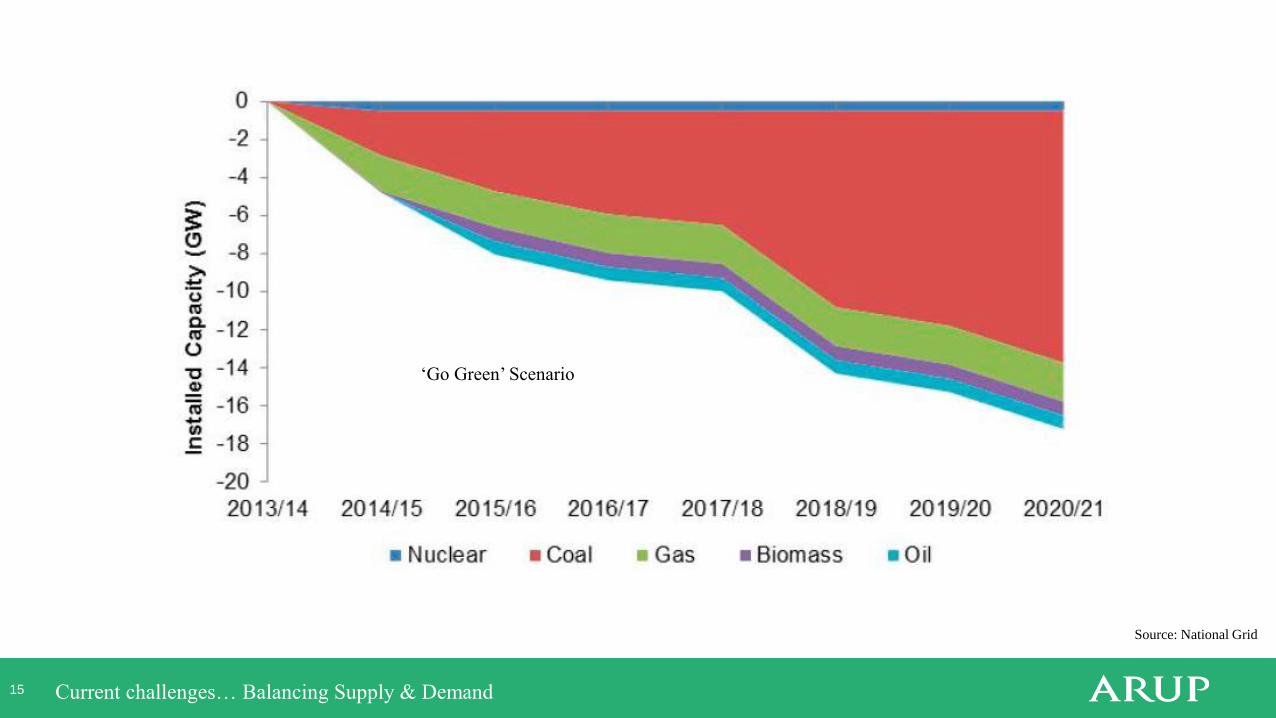
15 Current challenges… Balancing Supply & Demand
Source: National Grid
‘Go Green’ Scenario
1
6
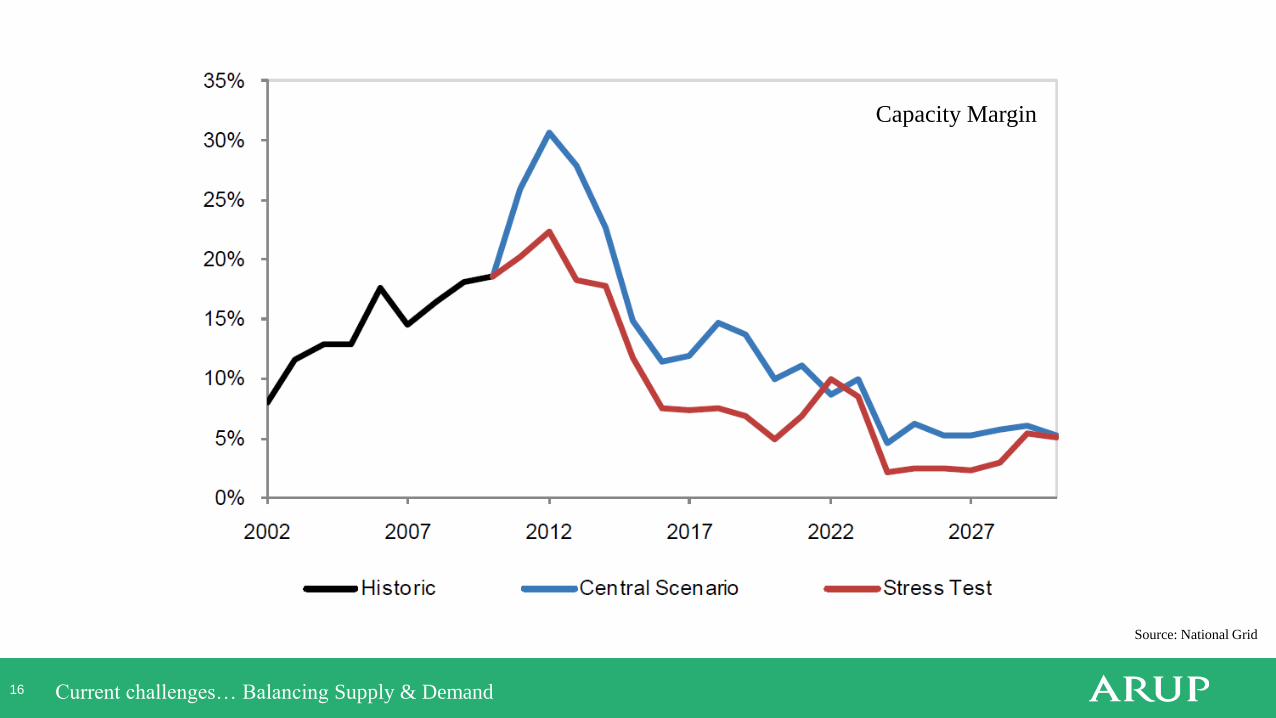
16 Current challenges… Balancing Supply & Demand
Source: National Grid
‘Go Green’ Scenario
Capacity Margin

1
7
17 Current challenges… + Carbon Reduction
Source:
Bristol CO2 Emissions =
5,814 tonnes/day
Enough to fill a sphere 181 metres in diameter

1
8
18 Current challenges… + Carbon Reduction
Achieving 80% CO2 Reduction by 2050UK Government target for the built environment vs 1990 baseline
Source: Arup | WRAP | Green
Construction Board
UK Built Environment Low Carbon Route Map

1
9
19 Current challenges… + Carbon Reduction & Security of supply
Source: DECC
2
0
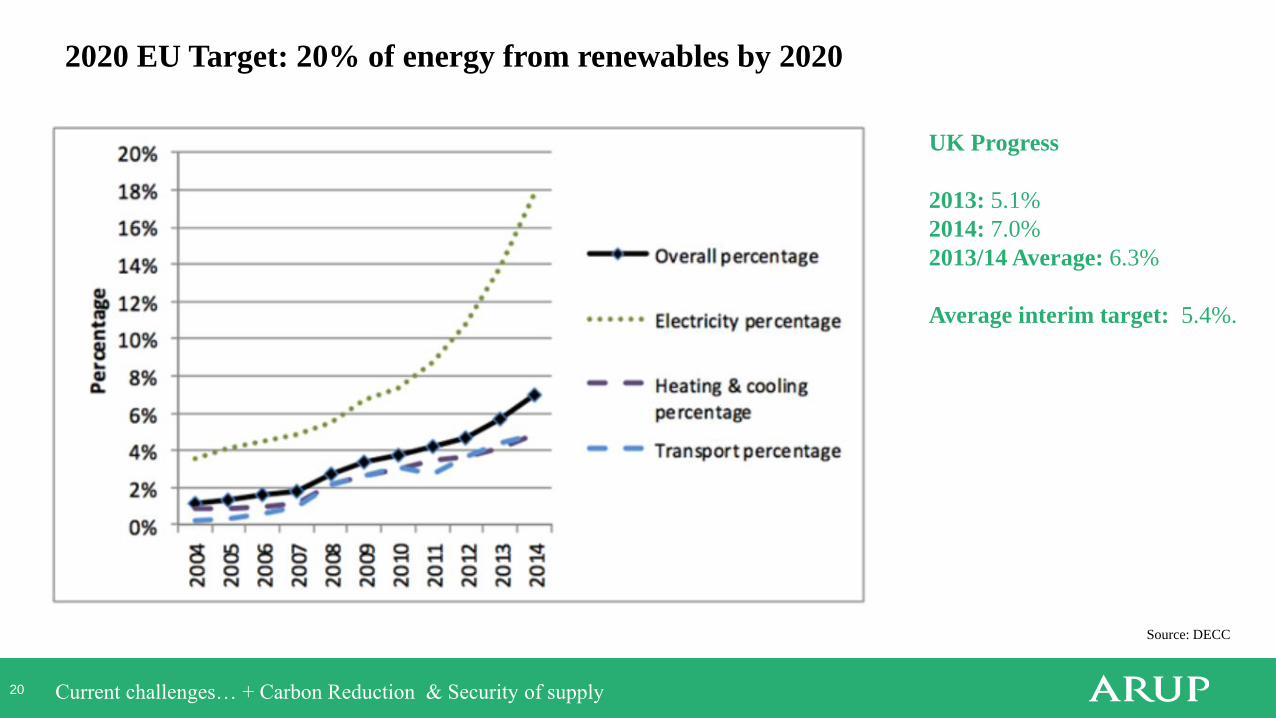
20 Current challenges… + Carbon Reduction & Security of supply
Source: DECC
UK Progress
2013: 5.1%
2014: 7.0%
2013/14 Average: 6.3%
Average interim target: 5.4%.
2020 EU Target: 20% of energy from renewables by 2020

2
1
21 Current challenges… + Carbon Reduction & Security of supply
Source: DECC
The UK has 5GW of solar PV capacity, with almost 99% of the
capacity
£11.4 billion investment in the Solar PV between 2010 and 2014.

2
2
22 Current challenges… + Carbon Reduction & Security of supply
Source: DECC
Around 5% of the UK’s electricity comes from onshore wind,
by 2020 this could double to about 10%
…except… UK Government have announced removal of
onshore wind from subsidy programmes

2
3
23 Current challenges… + Carbon Reduction + Security of supply
Source: DECC
The UK has more offshore wind than any other country.
It is estimated that the sector attracted £9.5 billion of investment
between 2010 and 2014.
2
4
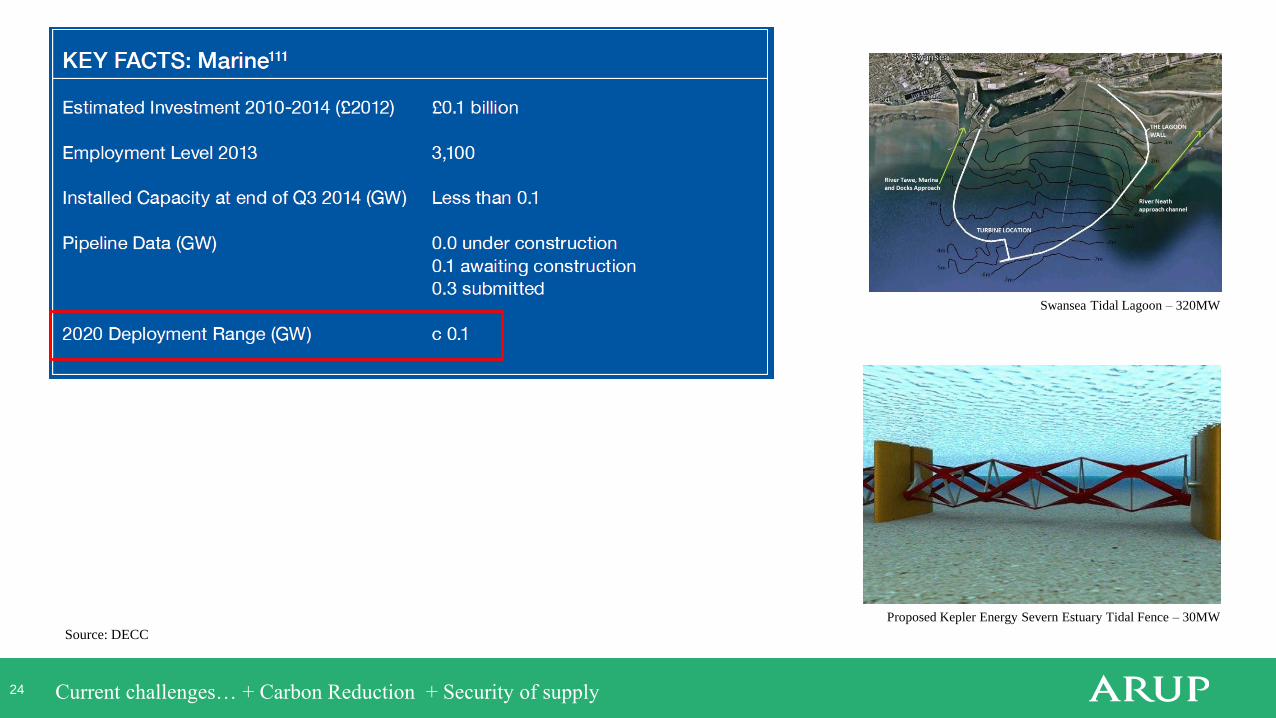
24 Current challenges… + Carbon Reduction + Security of supply
Proposed Kepler Energy Severn Estuary Tidal Fence – 30MW
Source: DECC
Swansea Tidal Lagoon – 320MW

2
5
25 Current challenges… + Carbon Reduction + Security of supply
2
6
26 Current challenges… + a Constrained Grid
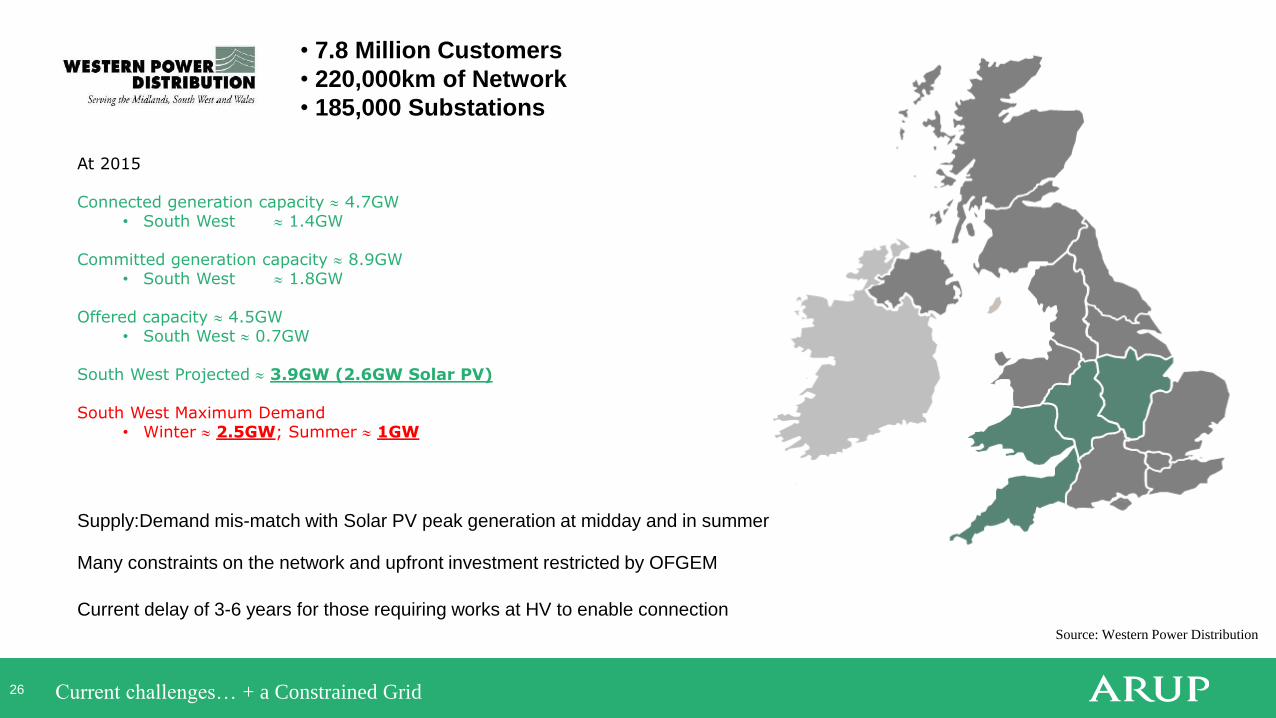
Source: Western Power Distribution
• 7.8 Million Customers
• 220,000km of Network
• 185,000 Substations
At 2015
Connected generation capacity 4.7GW• South West 1.4GW
Committed generation capacity 8.9GW• South West 1.8GW
Offered capacity 4.5GW• South West 0.7GW
South West Projected 3.9GW (2.6GW Solar PV)
South West Maximum Demand• Winter 2.5GW; Summer 1GW
Current delay of 3-6 years for those requiring works at HV to enable connection
Many constraints on the network and upfront investment restricted by OFGEM
Supply:Demand mis-match with Solar PV peak generation at midday and in summer

2
7
27 Current challenges… + a Constrained Grid
2
8
28 Current challenges… + Affordability
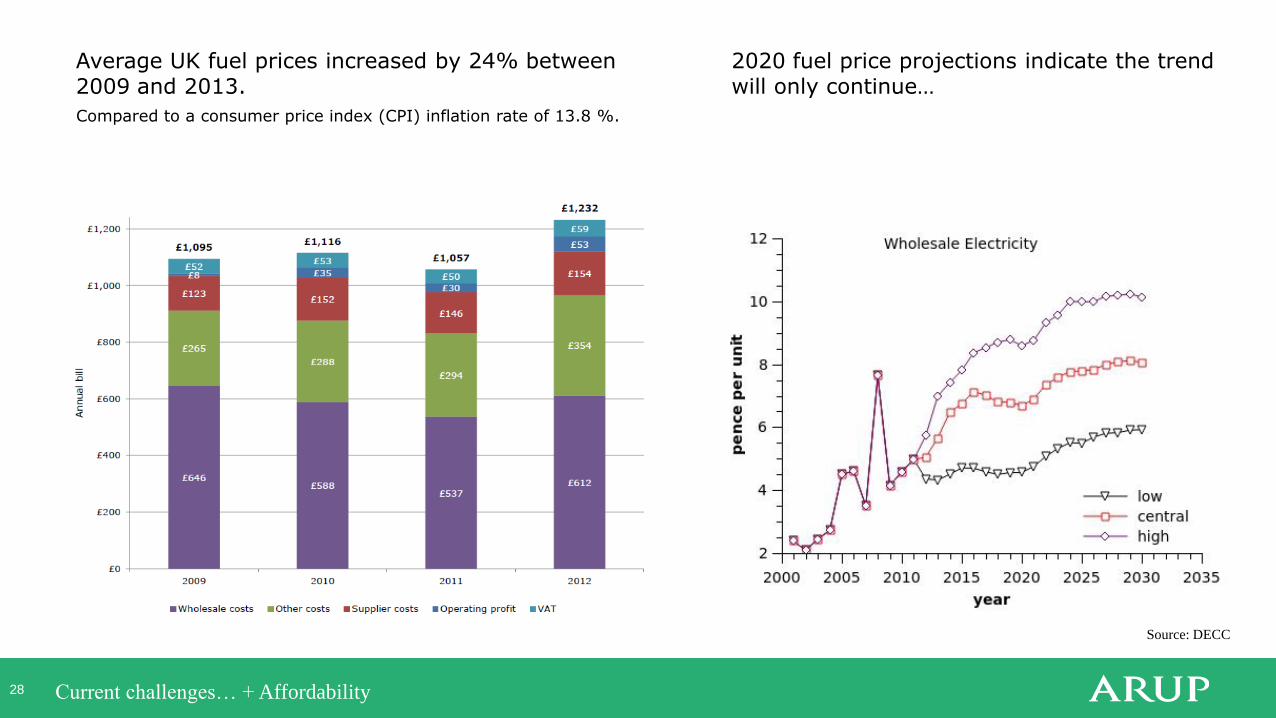
Source: DECC
Average UK fuel prices increased by 24% between 2009 and 2013.
Compared to a consumer price index (CPI) inflation rate of 13.8 %.
2020 fuel price projections indicate the trend will only continue…

2
9
29 Current challenges… + Affordability
• 90 % of households in the UK remain customers of the Nig 6 suppliers - British Gas, SSE, ScottishPower, E.On, EDF Energy and Npower.
15 years after the UK energy market was liberalised…
Market competitiveness has increased beyond the Big 6 suppliers, with reduced rates and cash incentives to switch.. but…
Consumer trust is a large factor

3
0
30 Current challenges… + Affordability
Source: Myutilitygenius

The future of our system…

3
2
32 The future… A Smarter Grid
The way we generate,
distribute and consume energy
is changing.

3
3
33 The future… A Smarter Grid
Centralised

3
4
34 The future… A Smarter Grid
Centralised + Decentralised | Distributed

3
5
35 The future… A Smarter Grid
Centralised + Decentralised | Distributed + Smart

3
6
36 The future… Smart Metering

3
7
37 The future… Energy storage

3
8
38 The future… Heat Network Growth

3
9
39 The future… Electricity to gas conversion
Integration of electricity and gas grids - Electricity to hydrogen conversion and use of the national gas grid to
transmit energy

4
0
40 The future… Biogas to grid
Bio-methane production from biogas and injection into the national gas grid

4
1
41 The future… Growing Interconnections

4
2
42 The future… Open-data
Source: Arup | WRAP | Green
Construction Board
Source:

4
3
43 The future… Open-data
From spring 2015 the centre of Bristol will be home to three new fast networks: in the ground;
bouncing from lamppost to lamppost and connecting wirelessly along the Brunel Mile.
http://www.bristolisopen.com/

4
4
44 The future… Open-data
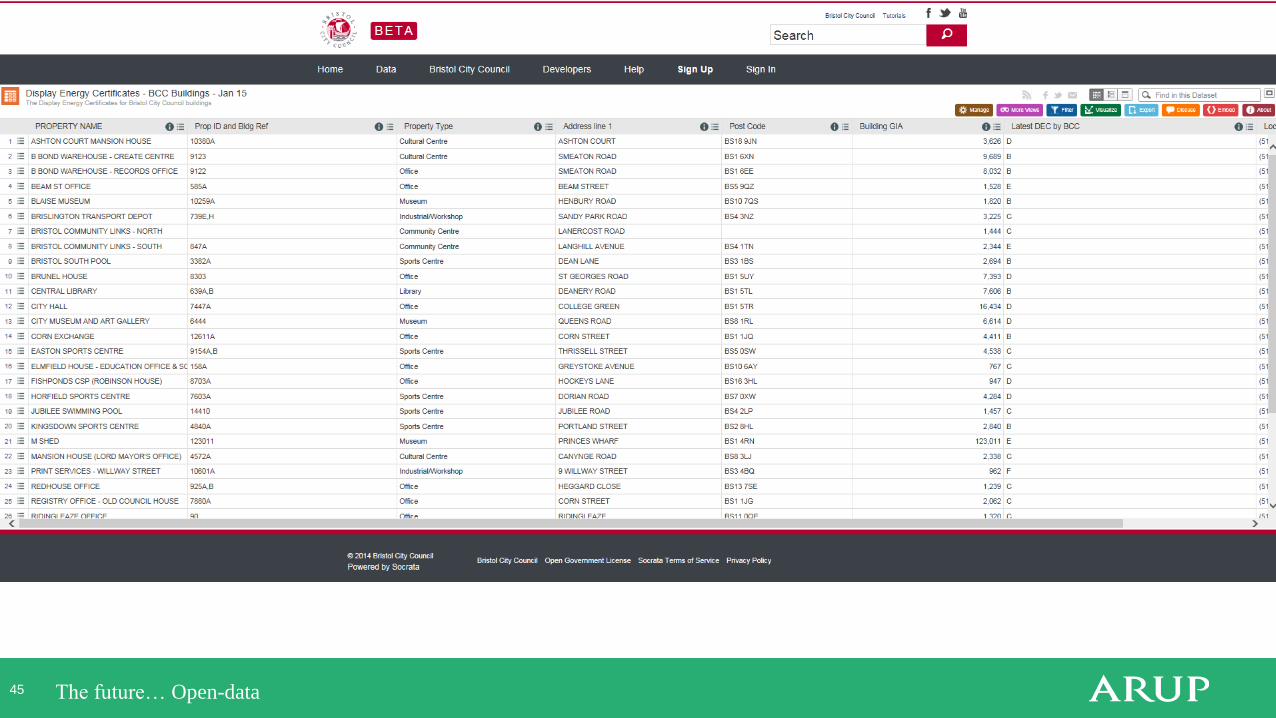
4
5
45 The future… Open-data
4
6
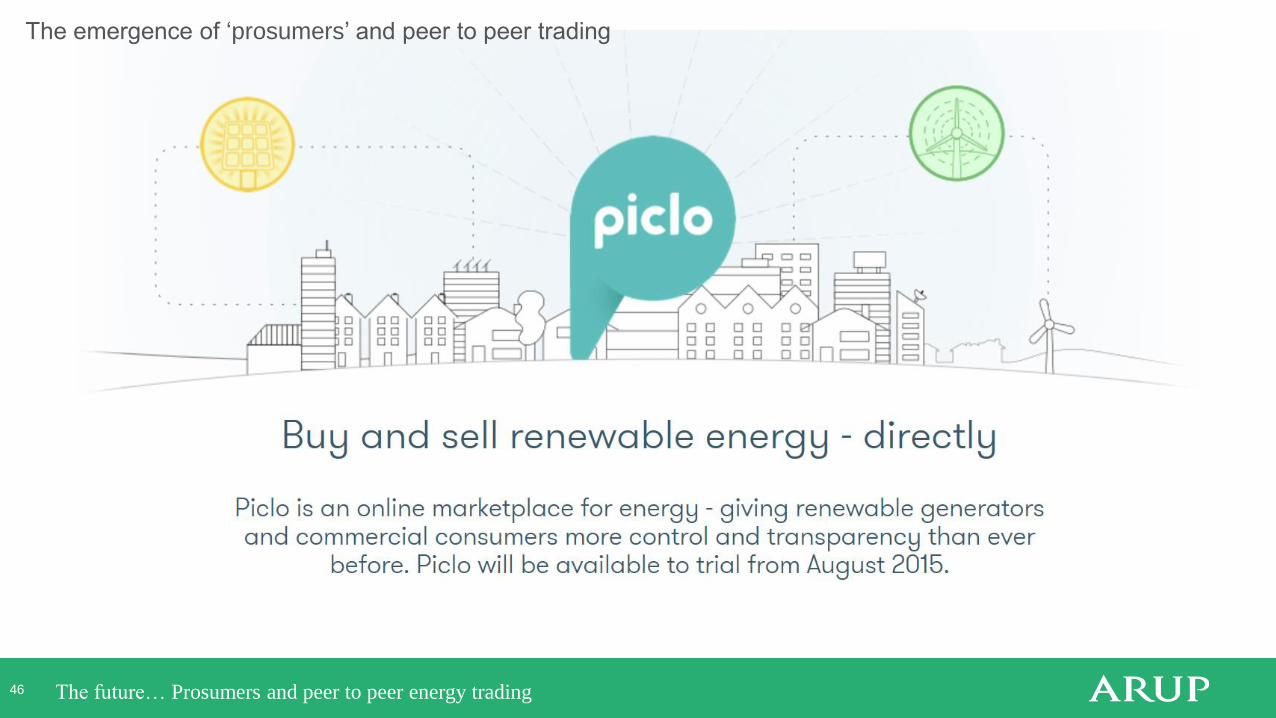
46 The future… Prosumers and peer to peer energy trading
The emergence of ‘prosumers’ and peer to peer trading

4
7
47 The future… Big data performance optimisation analytics
4
8
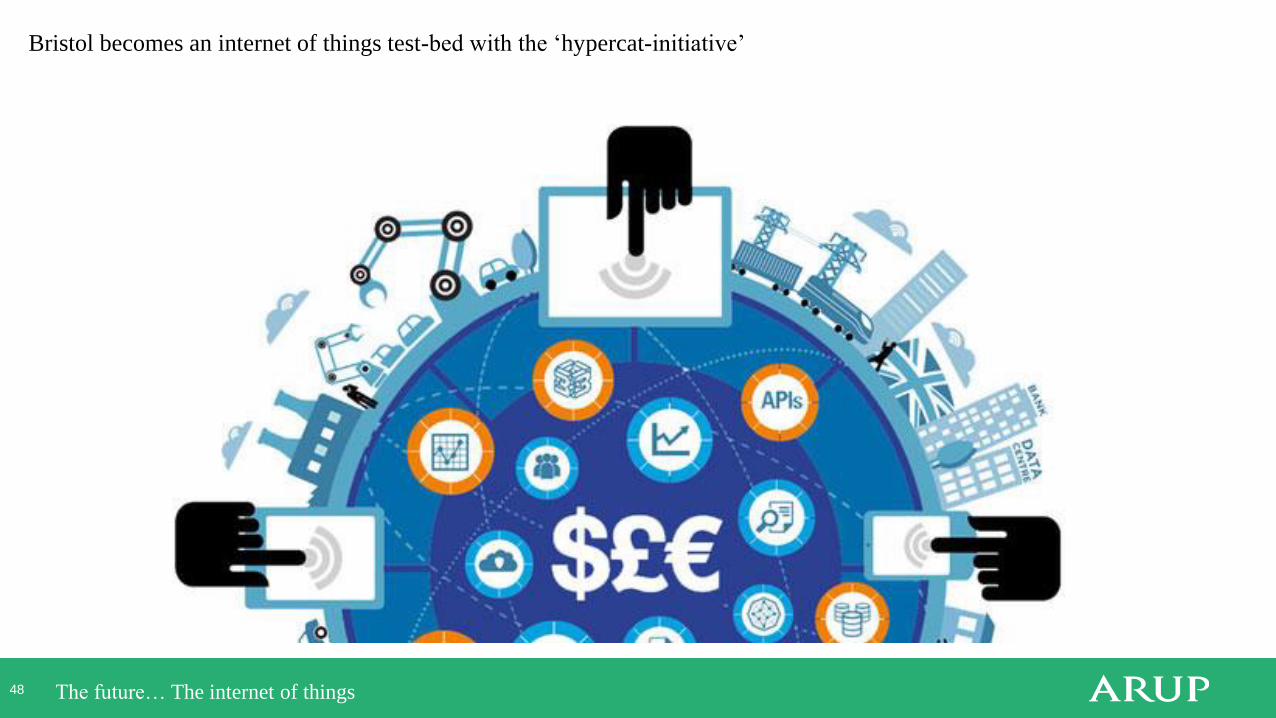
48 The future… The internet of things
Bristol becomes an internet of things test-bed with the ‘hypercat-initiative’

4
9
49 The future… Being bold to innovate
Being bold to innovate…
The World Wide Web Invented in 1989 by Sir Tim Berners (CERN) – a concept initially dubbed “Vague but exciting”