Embed Size (px)
Citation preview

From information, knowledge
Paragon Economics, Inc.
Steve R. Meyer, Ph.D.Paragon Economics, Inc.
IPPA Board of Directors – January 2015
Pork Industry Economic Outlook

From information, knowledge
Paragon Economics, Inc.
Key Issues Fundamental shift in grain/oilseed S & D World and domestic economic growth Big change in U.S. consumers Expansion everywhere
- Chicken: Belated but big- Hogs: Overcoming PEDv- Cattle: A Loooooong Time Coming
Risks are NUMEROUS
02/11/15 2

From information, knowledge
Paragon Economics, Inc.
The corn supply situation is vastly improved
Record high world output & consumption Projected Y/E stocks the highest in 15 yrs. MAJOR increase in non-U.S. production –
and especially in S. America02/11/15 3
From information, knowledge
Paragon Economics, Inc.
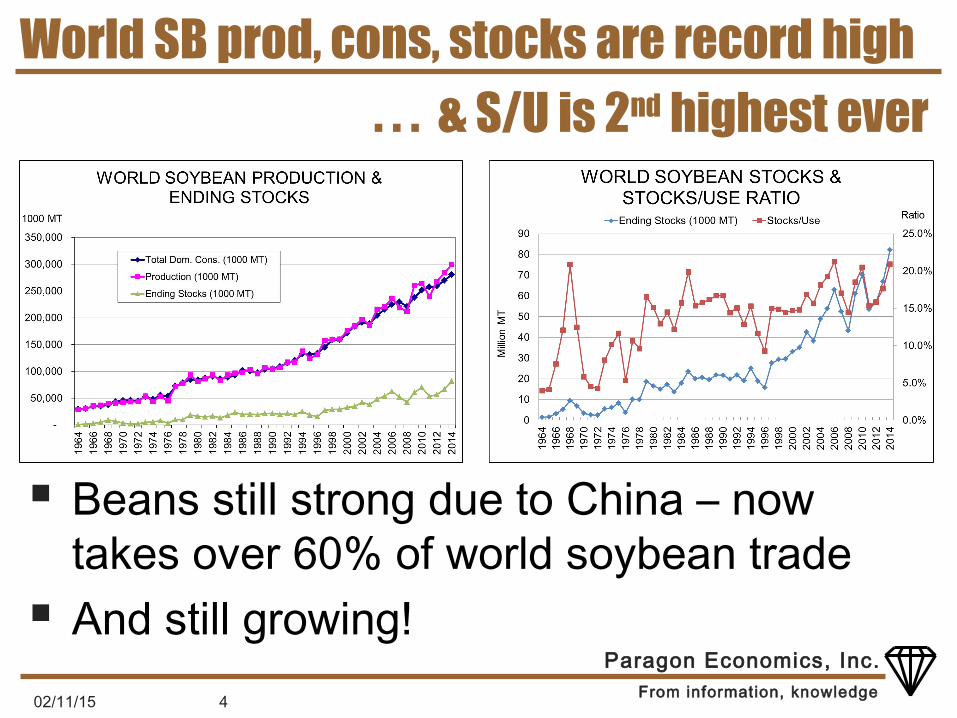
World SB prod, cons, stocks are record high
Beans still strong due to China – now takes over 60% of world soybean trade
And still growing!02/11/15 4
. . . & S/U is 2nd highest ever

From information, knowledge
Paragon Economics, Inc.
Wheat – same story on prod & cons but . . .
World S/U ratio remains below 30 – not a “flush” situation but good vs. ’00s
Ukraine situation creates risk – U.S. conditions look good
From information, knowledge
Paragon Economics, Inc.
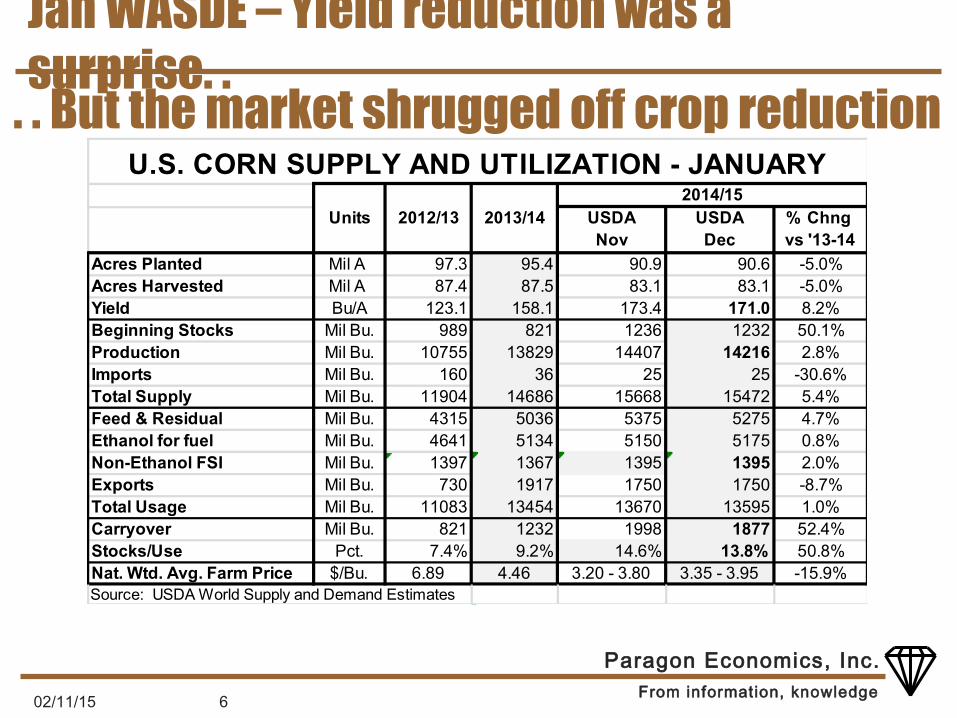
Jan WASDE – Yield reduction was a surprise. .
02/11/15 6
. . But the market shrugged off crop reduction
USDA Nov
USDA Dec
% Chng vs '13-14
Acres Planted Mil A 97.3 95.4 90.9 90.6 -5.0%Acres Harvested Mil A 87.4 87.5 83.1 83.1 -5.0%Yield Bu/A 123.1 158.1 173.4 171.0 8.2%Beginning Stocks Mil Bu. 989 821 1236 1232 50.1%Production Mil Bu. 10755 13829 14407 14216 2.8%Imports Mil Bu. 160 36 25 25 -30.6%Total Supply Mil Bu. 11904 14686 15668 15472 5.4%Feed & Residual Mil Bu. 4315 5036 5375 5275 4.7%Ethanol for fuel Mil Bu. 4641 5134 5150 5175 0.8%Non-Ethanol FSI Mil Bu. 1397 1367 1395 1395 2.0%Exports Mil Bu. 730 1917 1750 1750 -8.7%Total Usage Mil Bu. 11083 13454 13670 13595 1.0%Carryover Mil Bu. 821 1232 1998 1877 52.4%Stocks/Use Pct. 7.4% 9.2% 14.6% 13.8% 50.8%Nat. Wtd. Avg. Farm Price $/Bu. 6.89 4.46 3.20 - 3.80 3.35 - 3.95 -15.9%Source: USDA World Supply and Demand Estimates
U.S. CORN SUPPLY AND UTILIZATION - JANUARY
Units 2012/13 2013/142014/15

From information, knowledge
Paragon Economics, Inc.
USDA price: Consistent with recent demand. . . But will that demand hold with $50 oil?

From information, knowledge
Paragon Economics, Inc.
Larger crops, flat ethanol usage . . .. . . Feed/resid + DDGS back to ‘04-’06 levels

From information, knowledge
Paragon Economics, Inc.
HUGE ethanol profits in ‘13 and ‘14 . . . . . . But lower margins now – ethanol price

From information, knowledge
Paragon Economics, Inc.
Jan SBs: Lower prod and carryout expected. .
02/11/15 10
. . USDA left y/e stocks at 410 mil. – 4X as large
USDA December
USDA January
% Chng vs '13-14
Acres Planted Mil A 77.2 76.8 84.2 83.7 9.0%Acres Harvested Mil A 76.1 76.3 83.4 83.1 8.9%Yield Bu/A 40.0 44.0 47.5 47.8 8.6%Beginning Stocks Mil Bu. 169 141.0 92 92 -34.8%Production Mil Bu. 3042 3358.0 3958 3969 18.2%Imports Mil Bu. 41 72.0 15 15 -79.2%Total Supply Mil Bu. 3252 3570.0 4065 4076 14.2%Crushings Mil Bu. 1689 1734.0 1780 1780 2.7%Exports Mil Bu. 1317 1647.0 1760 1770 7.5%Seed Mil Bu. 89 97.0 92 92 -5.2%Residual Mil Bu. 16 0.0 23 24 N/ATotal Usage Mil Bu. 3111 3478.0 3655 3666 5.4%Carryover Mil Bu. 141 92.0 410 410 345.7%Stocks/Use Pct. 4.5% 2.6% 11.2% 11.2% 323%Nat. Wtd. Avg. Farm Price $/Bu. 14.40 13.00 9.00 - 11.00 9.45 - 10.95 -19.2%Soybean Oil Price Cents/lb. 47.13 38.23 32.00 - 36.00 31.00 - 35.00 -5.8%Soybean Meal Price $/ton 468.11 489.94 330-370 340-380 -28.6%Source: USDA World Supply and Demand Estimates
U.S. SOYBEAN SUPPLY & UTILIZATION - JANUARY
Units 2012/13 2013/142014/15

From information, knowledge
Paragon Economics, Inc.
Implications of current and future costs Lower feed ingredient costs will fuel
expansion – across the board – but timing will differ per species
FUNDAMENTAL and LONG-TERM change in grain prices- We have now caught up with ethanol usage- Growing oil/gas output will limit ethanol
future growth- Yields continue to grow – Only cost hikes will
come with drought
02/11/15 11
From information, knowledge
Paragon Economics, Inc.
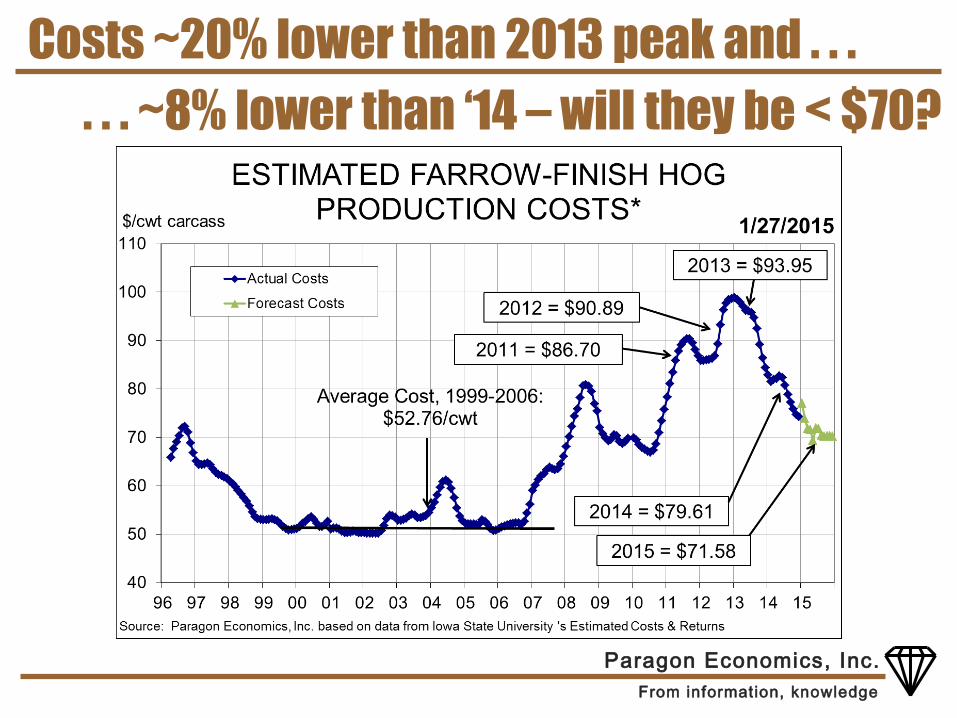
Costs ~20% lower than 2013 peak and . . . . . . ~8% lower than ‘14 – will they be < $70?

From information, knowledge
Paragon Economics, Inc.
Euro zone is still the drag on world economy
Source: Moody's Economy.com
. . . China may be slower but Asia is still good

From information, knowledge
Paragon Economics, Inc.
GDP is growing and the rate is improving . . .
02/11/15 14
. . .Q3 +5% qtr/qtr was best since ‘03!

From information, knowledge
Paragon Economics, Inc.
RPDI growth has been MUCH better in ‘14 . . . . . .November was +2.2%, average of 1.6% YTD
02/11/15 15

From information, knowledge
Paragon Economics, Inc.
Consumers’ outlooks are improving, too . . .
02/11/15 16
. . . both indexes highest since 2007

From information, knowledge
Paragon Economics, Inc.
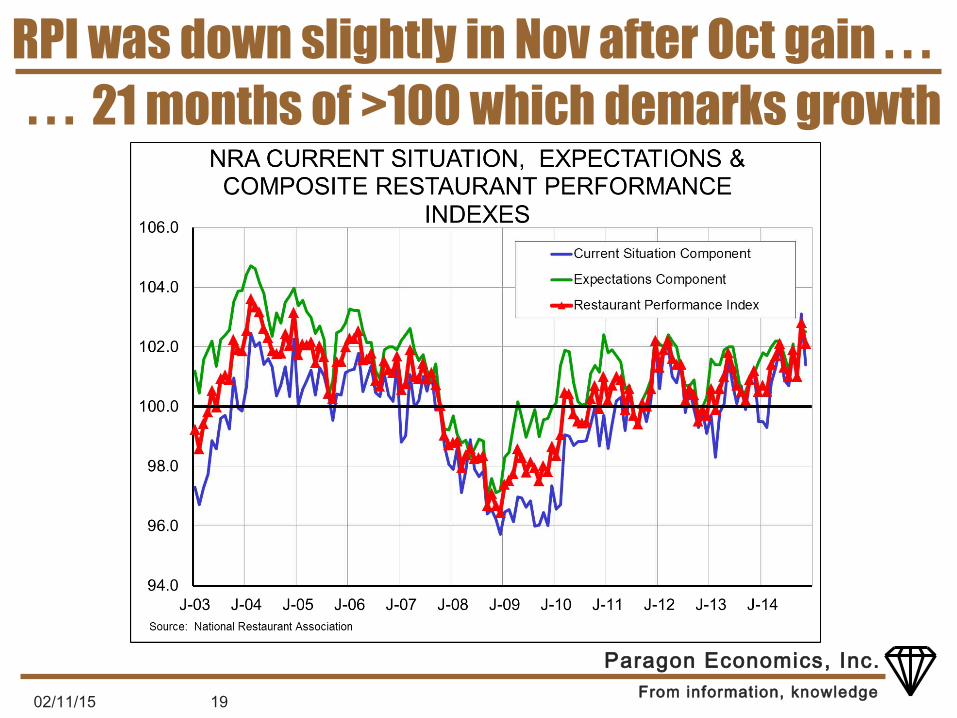
RPI was down slightly in Nov after Oct gain . . .
02/11/15 17
. . . 21 months of >100 which demarks growth

From information, knowledge
Paragon Economics, Inc.
Consumers’ outlooks are improving, too . . .
02/11/15 18
. . . both indexes highest since 2007
From information, knowledge
Paragon Economics, Inc.
RPI was down slightly in Nov after Oct gain . . .
02/11/15 19
. . . 21 months of >100 which demarks growth

From information, knowledge
Paragon Economics, Inc.
And now – “cheap” oil and sub-$2 gas???
Weekly Crude Oil Futures
Monthly RBOB GasolineFutures

From information, knowledge
Paragon Economics, Inc.
But the big factor is preferences. . .
Research: “Low-carb Diet Better Than Low-Fat Diet”
The Big Fat Surprise by Nina Teicholz
“Lost Weight on Bacon and Cream” – vox.com, Greg Feren-stein
02/11/15 21
. . . protein is in, carbs are out – BIG CHANGE!

From information, knowledge
Paragon Economics, Inc.
The evidence of strong demand is PRICES . . . . . New beef records in Nov, lower pork
02/11/15 22

From information, knowledge
Paragon Economics, Inc.
Meat/Poultry RPCE: Yr/yr higher since January
02/11/15 23
. . . And HUGE positive months in Aug - Nov

From information, knowledge
Paragon Economics, Inc.
The big demand strength is for “red meat” . . .
02/11/15 24

From information, knowledge
Paragon Economics, Inc.
Major trend changes for red meat RPCEs . . .
Pork RPCE is now ahead of 2004 levels driven by Atkins diet, beef is gaining
Can this be sustained?
. . . Pork’s $13.74 in Nov highest since Dec ‘90!

From information, knowledge
Paragon Economics, Inc.
Volume has been lower yr/yr since June . . . . . . But VALUE is still up 11%, VM value is up 15%
02/11/15 26

From information, knowledge
Paragon Economics, Inc.
Displaced EU pork is a big driver at present. . . ~40k MT of pork had to find a home!

From information, knowledge
Paragon Economics, Inc.
The U.S. dollar is becoming an issue . . .
02/11/15 28

From information, knowledge
Paragon Economics, Inc.
Broiler industry entered ‘14 with an old flock. . . But increased the flock by ~2% in 2nd half

From information, knowledge
Paragon Economics, Inc.
Broilers: BIG production challenges in ‘14

From information, knowledge
Paragon Economics, Inc.
Challenges limited growth – except for wts!

From information, knowledge
Paragon Economics, Inc.
Expectations for chicken . . . GROWTH!!!
- Companies are solving problems and have a HUGE incentive
- Reports of aggressive expansion – adding growout barns
The 3-4% growth I expected this year will come in 2015
Lower chicken prices will still be profitable Chicken will be very competitive at both
retail and foodservice02/11/15 32

From information, knowledge
Paragon Economics, Inc.
The key for beef growth is WEATHER!

From information, knowledge
Paragon Economics, Inc.
Beef: Unprecedented cow/calf profits!!!!
02/11/15 34
From information, knowledge
Paragon Economics, Inc.
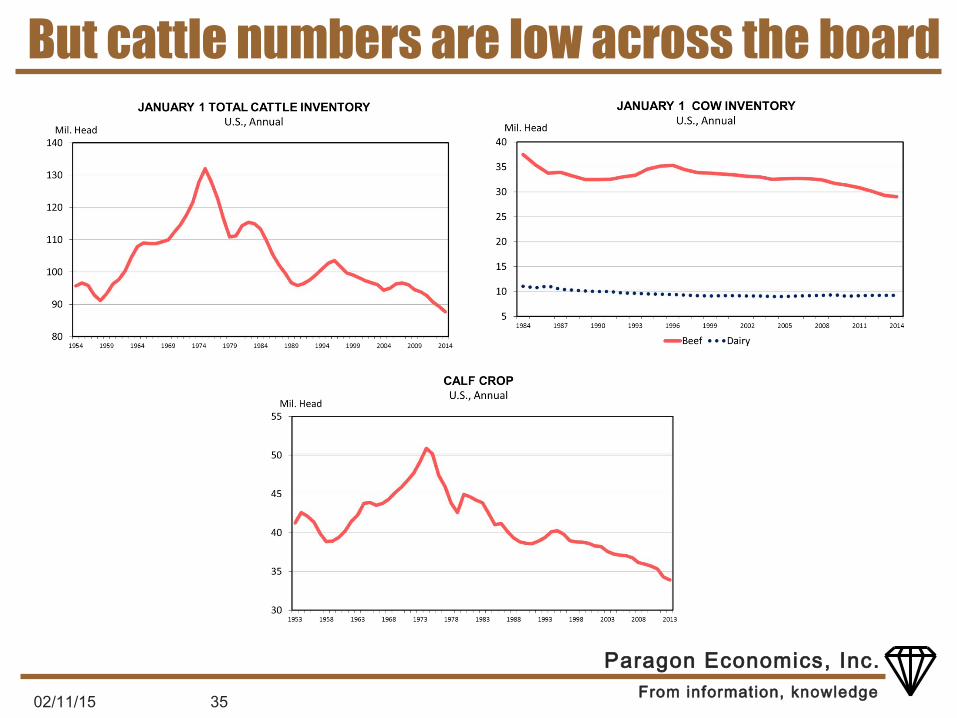
But cattle numbers are low across the board
02/11/15 35

From information, knowledge
Paragon Economics, Inc.
. . . Feeder supply is down 3% vs. ‘12– record low
02/11/15 36
Livestock Marketing Information Center
Data Source: USDA-NASS
Placements are coming from a TIGHT supply

From information, knowledge
Paragon Economics, Inc.
Beef consumption/supply will be -4.7% yr/yr . . .
02/11/15 37
. . . & down another 2% in 2015 and 1% in 2016!
Livestock Marketing Information Center
Data Source: USDA-NASS
From information, knowledge
Paragon Economics, Inc.
Cattle and beef summary . . . Growth – but characteristically slow
- Biology, producer age, capital cost- Growth means tighter near term
supply HIGH prices through 2015 and 2016 will
provide opportunities for competitors Recent selloff is a futures/technicals issue
– not supported by product or cattle! Long-term impacts of VERY HIGH prices
on beef consumers?02/11/15 38

From information, knowledge
Paragon Economics, Inc.
Pigs – all PEDv, all the time it seems . . .
New high wk. of 1/17 at 118 vs. 215 last year Many of these accessions are “monitoring”
02/11/15 39

From information, knowledge
Paragon Economics, Inc.
KEY DEVELOPMENT: Few sow herd breaks
Data from 753 sow farm, 16 of 19 large systems reporting, 2.1 million sows!
Nov-Dec: 12 breaks vs. ~85 in ‘13
02/11/15 40

From information, knowledge
Paragon Economics, Inc.
Paragon slaughter comps were close . . .
02/11/15 41
. . Thru August but yr/yr declines have fallen
MonthForecast
Yr/Yr Chnge
(000 Hd.) (Pct. Chnge.) (000 Hd.) (Pct. Chnge.)
Dec 1.45% 9730.1 -2.14% 9397 -2.01%Jan 1.30% 9791.2 -1.66% 9459 -1.39%Feb -0.78% 8668.2 0.90% 8366 1.10%Mar -0.26% 8674.6 -6.89% 8356 -6.92%Apr -2.17% 8855.0 -5.38% 8527 -5.32%May -2.89% 8619.7 -1.96% 8311 -1.72%Jun -4.94% 8099.5 -5.89% 7795 -5.85%Jul -7.46% 8456.7 -6.80% 8136 -6.81%
Aug -10.04% 8268.1 -9.35% 7952 -9.42%Sep -11.86% 8828.8 -6.82%* 8497 -6.89%*Oct -9.13% 9953.1 -4.48% 9588 -4.47%Nov -8.58% 8812.2 -3.8%** 8509 -3.9%**Dec -4.82% 9777.5 -3.4%*Jan -3.52%Feb -2.18%
*Adjusted for one more work day in Sept & Dec 2014**Adjustef for one less work day in November 2014
FI Hog Slaughter FI Barr/Gilt Slaughter
PREDICTED HOG SLAUGHTER CHANGE PER PEDv ACCESSIONS & ACTUAL HOG

From information, knowledge
Paragon Economics, Inc.
PRRS was MUCH quieter in ‘13-’14 – and now

From information, knowledge
Paragon Economics, Inc.
Dec Hogs & Pigs report: GROWTH is coming. . .
02/11/15 43
. . . Larger BH, intentions, pig crop
Inventories on Dec 1
All hogs and pigs 64775 66,050 102.0 101.5 0.5Kept for breeding 5757 5,969 103.7 103.0 0.7Kept for marketing 59018 60,082 101.8 101.3 0.5
Under 50 lbs. 18389 19,026 103.5 103.7 -0.250-119 lbs. 16080 16,630 103.4 102.7 0.7
120-179 lbs. 12576 12,635 100.5 99.4 1.1180 lbs. and over 11972 11,791 98.5 97.5 1.0
Farrowings Sep-Nov sows farrowed 2,780 2,871 103.3 103.8 -0.5
Dec-Feb Intentions 2,763 2,870 103.9 103.8 0.1 Mar-May Intentions 2,810 2,900 103.2 103.9 -0.7Sep-Nov Pig Crop 28,253 29,373 104.0 103.3 0.7Sep-Nov pigs saved per litter 10.16 10.23 100.7 99.9 0.8
*Thousand head ** Thousand Litters 1Source: Urner Barry
Category 2013 2014'14 as Pct of
'13
Pre-Report
Est's1
Actual minus Est.
USDA QUARTERLY HOGS & PIGS REPORTDecember 23, 2014

From information, knowledge
Paragon Economics, Inc.
Productivity measure are CRITICAL for ‘15!
Farrowing intentions are, if anything, low relative to Dec 1 breeding herd
Normal litter patterns would put Dec-Feb & Mar-May up 6.8% & 4.7% from ‘14

From information, knowledge
Paragon Economics, Inc.
Will these changes happen? Farrowings growth is VERY likely
- “Overstocking” with females to handle PEDv has left most units very full
- Question is breeding/farrowing efficiency following PEDv – some reports of problems
Litter growth of 6.8% and 4.7% is unlikely- There will still be some pre-weaning loss- Re-breaks are occurring – not as bad as in
‘13-’14 but still have losses- We are using 4.5% and 3.1% in our calcs.

From information, knowledge
Paragon Economics, Inc.
Large yr/yr increases in summer & fall . . . . . Capacity will be tight but not limiting in Q4

From information, knowledge
Paragon Economics, Inc.
Weights will be a critical issue in ‘15
Hardly any seasonal increase in Q4 Recent yr/yr change is small due to last yr! We expect weights to be flat (Up from ‘14)
thru April and then LOWER thru Sept – primarily due to fully stocked finishers
02/11/15 47
From information, knowledge
Paragon Economics, Inc.
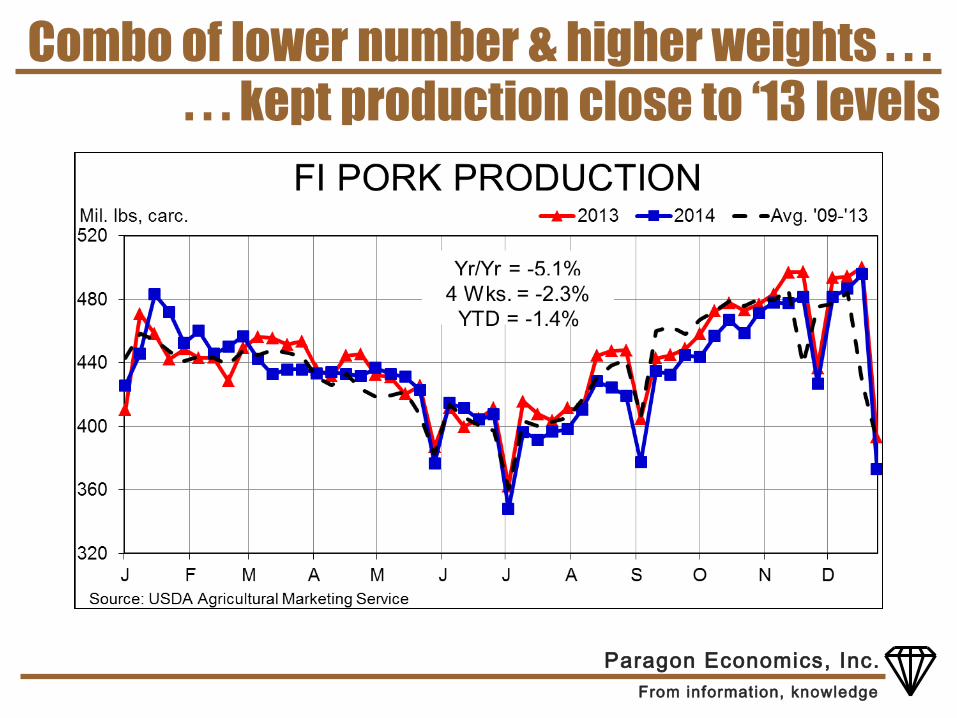
Combo of lower number & higher weights . . .. . . kept production close to ‘13 levels
From information, knowledge
Paragon Economics, Inc.
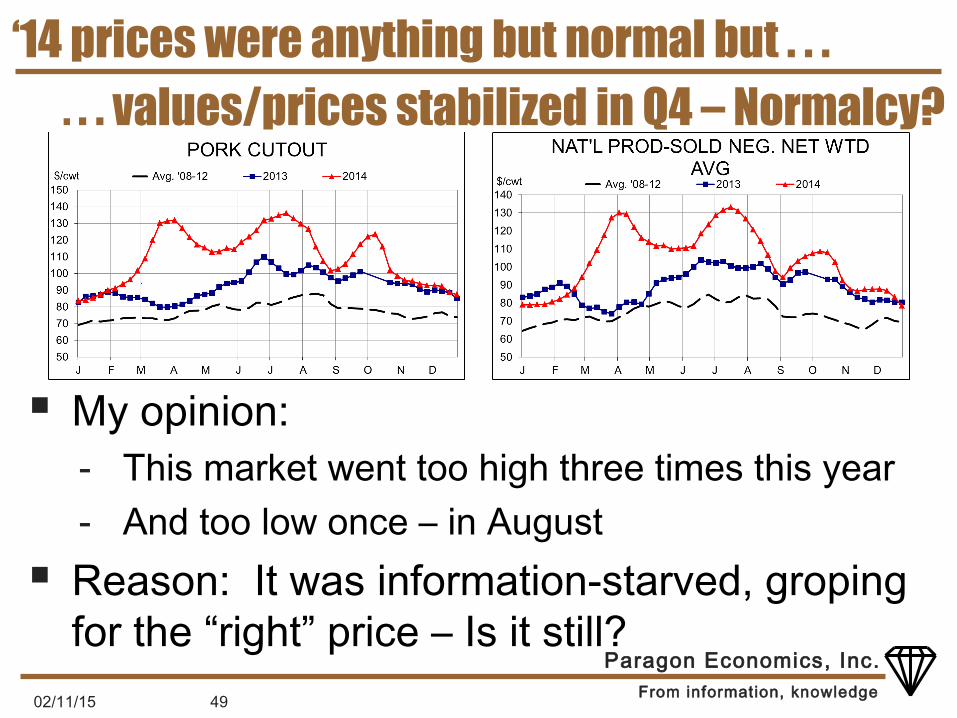
‘14 prices were anything but normal but . . .
My opinion: - This market went too high three times this year- And too low once – in August
Reason: It was information-starved, groping for the “right” price – Is it still?
02/11/15 49
. . . values/prices stabilized in Q4 – Normalcy?
From information, knowledge
Paragon Economics, Inc.
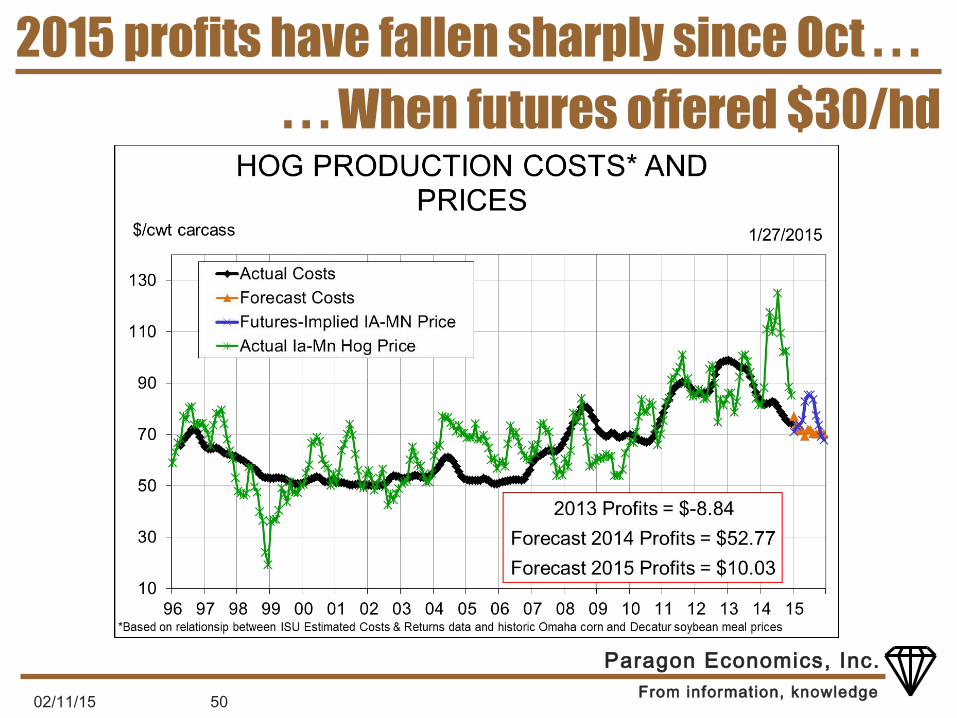
2015 profits have fallen sharply since Oct . . .
02/11/15 50
. . . When futures offered $30/hd

From information, knowledge
Paragon Economics, Inc.
U.S. sow slaughter in ‘14 was down 5.0% . . .
Now replacing aging sows? June & Sept BHs implied sharply higher
gilt retention but Q4 data belie that Anecdotal evidence: More expansion!
02/11/15 51
. . . Gilt share has risen recently – retention???

From information, knowledge
Paragon Economics, Inc.
Slaughter forecasts from Dec. H&P . . .
Mil. Hd % Chnge Mil. Hd % Chnge Mil. Hd % Chnge Mil. Hd % Chnge Mil. Hd % Chnge
2013 Q1 27.870 -0.8%
Q2 26.778 0.4%
Q3 27.668 -1.1%
Q4 29.808 0.8%
Year 112.124 -1.0%
2014 Q1 27.580 -1.0% 27.428 -1.6% 27.214 -2.4% 27.320 -2.0% 27.134 -2.6%
Q2 25.420 -5.1% 25.787 -3.7% 25.572 -4.5% 25.020 -6.6% 25.574 -4.5%
Q3 26.459 -4.4% 26.340 -4.8% 26.173 -5.4% 25.520 -7.8% 25.554 -7.6%
Q4 28.930 -2.9% 28.795 -3.4% 28.826 -3.3% 28.912 -3.0% 28.755 -3.5%
Year* 107.192 -4.4% 107.057 -4.5% 107.088 -4.5% 107.174 -4.4% 107.017 -4.6%
2015 Q1 27.571 1.6% 27.650 1.9% 27.398 1.0% 27.405 1.0%
Q2 26.660 4.2% 26.725 4.5% 26.425 3.3% 26.725 4.5%
Q3 27.305 6.9% 27.317 6.9% 26.813 4.9% 27.471 7.5%
Q4 30.294 5.4% 30.365 5.6% 30.063 4.3% 30.791 6.5%
Year 111.830 4.5% 112.057 4.7% 110.699 3.4% 112.392 5.0%Red figures are analysts' last FORECAST for the given quarter (Q1 done in Dec, Q2 done in Mar, etc.) 12/31/14
Blue figures are estimated using USDA data *Annual total uses actuals to-date plus forecasts for the rest of the year.
Mizzou ISU LMIC Paragon ACTUALDecember 2014 Hogs & Pigs -- Commercial Slaughter Forecasts

From information, knowledge
Paragon Economics, Inc.
Price forecasts, December H&P Report . . . . . . LH futures are FAR below forecasts
Mizzou ISU LMIC Paragon CME
Producer-Sold Net Price, All
Methods
Ia-Mn Producer-Sold
Neg'd Base
National Wtd Avg. Base Price
National Net Neg'd Price,
Wtd. Avg.
CME Lean Hog Futures
2013 Q1 83.53 80.63 81.08 82.73 83.34**Q2 91.80 89.30 89.32 90.83 90.66**Q3 97.90 95.58 95.25 98.00 98.98**Q4 84.99 81.28 82.98 85.26 83.93**Year 89.56 86.70 87.16 89.21 89.23**
2014 Q1 93.10 93.10 91.34 93.80 94.91**Q2 113.54 115.36 111.61 116.83 117.48**Q3 111.84 111.77 109.63 114.25 115.70**Q4 94 - 98 94 - 99 94 - 96 90 - 92 91.85**Year 105 - 107 104 - 105 102 - 103 103 - 105 104.99
2015 Q1 83 - 87 83 - 88 86 - 89 84 - 88 71.30Q2 88 - 92 85 - 90 89 - 93 92 - 96 79.02Q3 84 - 88 81 - 86 86 - 91 88 - 92 81.68Q4 77 - 81 78 - 83 77 - 83 76 - 80 70.71Year 84 - 88 82 - 87 85 - 89 85 - 89 75.68
Blue figures are estimated using USDA data **CME Lean Hog Index 1/27/15
December 2014 Hogs & Pigs -- Price Forecasts

From information, knowledge
Paragon Economics, Inc.
Risks Major export disruption – with a capital D! PEDv impact on pre-weaning mortality falls
to near zero – we have 1/3 as large as ‘14 Demand weakening
- Domestic: Newly positive prefs continue?- Exports: World economy
How much expansion in pigs and chicken? Hogs: Packing capacity – New plant in ‘17 Diet guidelines & processed meats???