Embed Size (px)
Citation preview
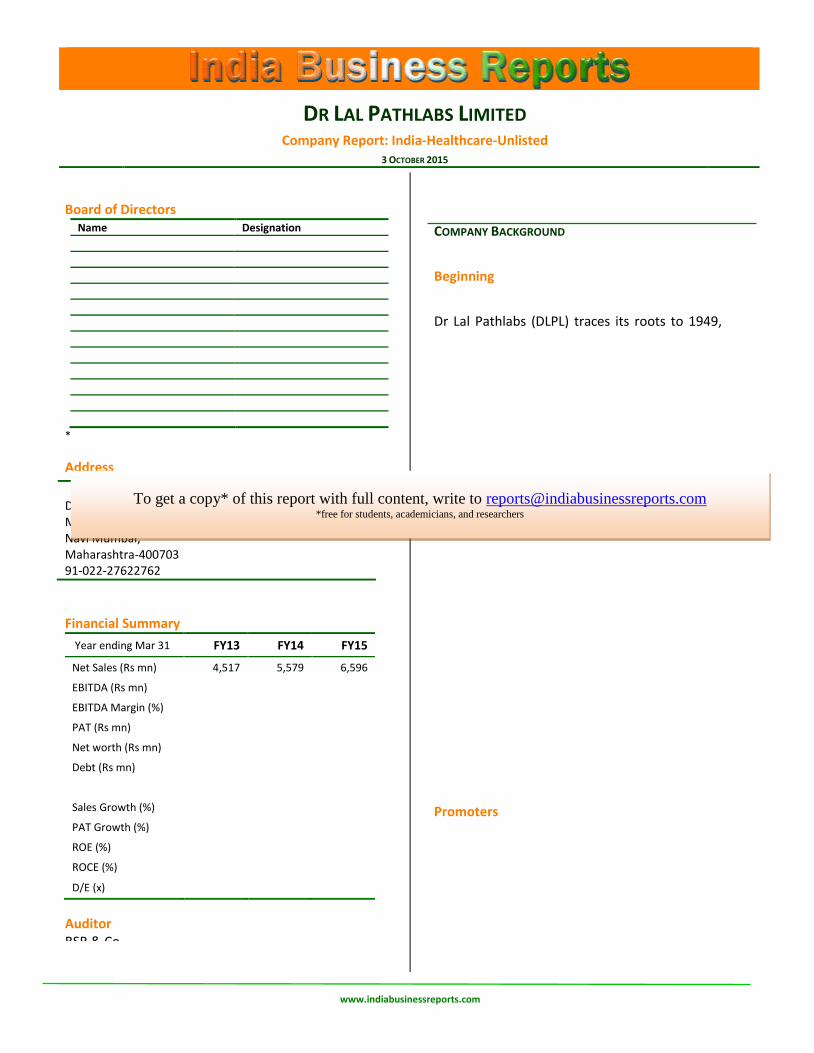
DR LAL PATHLABS LIMITED
Company Report: India-Healthcare-Unlisted 3 OCTOBER 2015
www.indiabusinessreports.com
COMPANY BACKGROUND
Beginning
Dr Lal Pathlabs (DLPL) traces its roots to 1949, when Late Dr. Major S.K. Lal, commenced the business of providing pathology services and maintaining a blood bank in the year 1949 through sole proprietorship M/s Central Clinical Laboratory and M/s Blood Bank Transfusion Centre. The business of diagnostic and related healthcare tests and services now continues to be provided by DLPL.
Now DLPL is India’s largest diagnostic lab business, both by absolute revenue and net profits. With over It offers 3,368 diagnostic and related healthcare tests and services, covering just about every possible testing requirement.
It has built a national network consisting of our National Reference Laboratory in New Delhi, 163 other clinical laboratories, 1,340 patient service centers and over 5,000 pickup points as of March 31, 2015.
The company lists several firsts to its credit.
DLPL employs more than 3,000 people and serves almost 12 million customers a year. This is around 32,000 customer per day.
The company is also present in 15 countries in South East Asia, Africa and Middle East.
Promoters
The company is now owned and run by the second generation Dr Arvind Lal. Dr. Arvind Lal is the Chairman and Managing Director of DLPL. Promoters currently hold 83.36% of equity. However, post a planned IPO (see details below), the promoters would end up with 58.97% stake.
Board of Directors Name Designation
Brig. Dr. Arvind Lal CMD
Dr. Vandana Lal Whole Time Director
Dr. Om Prakash Manchanda Whole Time Director & CEO
Rahul Sharma Independent Director
Naveen Wadhera Investor Director
Sandeep Singhal Investor Director
Arun Duggal Independent Director
Anoop Mahendra Singh Independent Director
Sunil Varma Independent Director
Harneet Singh Chandhoke Independent Director
Saurabh Srivastava Independent Director
Murugan Rajaram Pandian Independent Director
*
Address
D - 37/1, Ttc Industrial Area M I D C, Turbhe Navi Mumbai, Maharashtra-400703 91-022-27622762
Financial Summary
Year ending Mar 31 FY13 FY14 FY15
Net Sales (Rs mn) 4,517 5,579 6,596
EBITDA (Rs mn) 977 1,386 1,560
EBITDA Margin (%) 22% 25% 24%
PAT (Rs mn) 556 803 950
Net worth (Rs mn) 1,621 2,315 3,411
Debt (Rs mn) 161 208 202
Sales Growth (%) 32.0% 23.5% 18.2%
PAT Growth (%) 23.0% 44.4% 18.3%
ROE (%) 40.0% 40.8% 33.2%
ROCE (%) 52.8% 55.5% 45.7%
D/E (x) 0.10 0.09 0.06
Auditor BSR & Co
To get a copy* of this report with full content, write to [email protected] *free for students, academicians, and researchers
India-Healtcare-Unlisted Dr Lal Pathlabs 3 Oct’15
www.indiabusinessreports.com 2
Part of the stake is now held by external investors. In February 2013, Mint had reported that WestBridge Crossover Fund and TA Associates had jointly invested $44 million in the Gurgaon-headquartered firm for a significant minority stake. WestBridge’s contribution was $35 million.
The valuation for this transaction, done in Feb’13, was reportedly between INR1,500 crore and INR1,750 crore BUSINESS HIGHLIGHTS
Dr Lal’s is India’s largest laboratory, with a network of over 200 labs.
In Fiscal Year 2013, DLPL collected 16.0 million samples from 7.7 million patients, which increased to 19.0 million samples from 9.0 million patients in Fiscal Year 2014 and to 21.8 million samples from 9.9 million patients in Fiscal Year 2015.
During fiscal 2014, the company acquired Kolkata-based Medicave Medical Systems Pvt. Ltd and Ahmedabad-based APL Institute of Clinical Laboratory & Research Pvt. Ltd. DLPL also recently amalgamated five wholly owned subsidiaries that were primarily engaged in pathological and radiological investigations. The amalgamation was conducted with the aim of generating synergies and economies of scale and pooling resources to improve cash flow management and reduce overhead.
Dr. Om Manchanda is the Chief Executive Officer. He has a diverse experience of over 24 years across sales, marketing and general management functions in business sectors such as FMCG, agri-biotech products, consumer healthcare and medical diagnostics. He joined DLPL in 2005.
According to rating firm CRISIL, the Indian diagnostics industry currently stands Rs 37,700 crore. This implies DLPL has a ~2% share of the industry.
DLPL, despite being the industry leader, remains strongly regional in nature. Over 70% of its revenue comes from North India. Around 13% comes from East. West and South are less than 10% of revenue.
As of June 30, 2015, DLPL had 3,219 full-time employees and 84 full-time consultants, including pathologists, phlebotomists and radiologists, located in India.
INDUSTRY INFO
Major diagnostic healthcare service providers in India offer a wide range of healthcare tests and services. The industry can be classified into imaging diagnostics and pathology testing services. Pathology testing or in vitro diagnosis involves reporting diagnostic information on the basis of collected samples (in the form of blood, urine and stool, among others) and then analyzing the samples in a lab to arrive at useful clinical information. Imaging diagnostics, or radiology, involves procedures such as taking X-rays and ultrasounds, which help mark anatomical and physiological changes inside a patient’s body to help doctors diagnose the disease.
The industry can also be separated into urban and rural centers. Urban centers typically have modern facilities (at public and private hospitals, clinics, standalone centers and diagnostic chains) and higher prices for tests. Rural centers – largely primary health centers, government dispensaries and private dispensaries – generally have small-scale facilities and carry out basic tests where ticket sizes are usually lower than those charged in the urban centers.
CRISIL Research estimates the size of the diagnostics industry at around Rs 377 billion in 2014-2015. Overall market for wellness and preventive diagnostics, as per CRISIL Research‘s estimations, was 6-8% of the total diagnostic services market in 2014-2015. CRISIL Research expects that the diagnostics industry will continue to grow by a CAGR of 16%-17% over the next three years to over Rs 600 billion by 2017-2018. The market is highly fragmented. Diagnostic chains are believed to have around 15% market share. National chains have around 5-6%, rest is with regional chains. Standalone centres still have around 48% share, while labs within hospitals have 37% share.
(Source: DLPL DRHP)

India-Healtcare-Unlisted Dr Lal Pathlabs 3 Oct’15
www.indiabusinessreports.com 3
FACILITIES
DLPL has built a national, “hub and spoke” network that includes its National Reference Laboratory in New Delhi, 163 other clinical laboratories, 1,340 patient service centers and over 5,000 pickup points as of March 31, 2015.
In this “hub and spoke” model, specimens are collected across multiple locations within a region for delivery to a predesignated clinical laboratory for centralized diagnostic testing. This provides greater economies of scale and offers a scalable platform for the continued growth of business.
DLPL’s National Reference Laboratory first opened in July 2010 in New Delhi and is the main “hub” for the rest of its network in India. The laboratory facilities consist of a total area of 7,253 square meters. In the National Reference Laboratory, DLPL can conduct all of the routine and specialized tests which are offered within its network.
FINANCIAL PERFORMANCE
DLPL has the highest revenue and profits amongst diagnostic companies in India, and is therefore, a clear leader in this space.
It has also shown robust growth. Its growth rate is better than other players amongst top 4.
In terms of profitability, it trails Thyrocare, but has a robust EBITDA margin of around 25%. The company is debt free, and has net cash of ~Rs 150 crore on its books.
FUNDING AND FUTURE PLANS
The company is planning to go public, driven by a desire to give exit to PE investors. According to media reports, the company will be valued at nearly Rs.6,000 crore. That is quite a steep valuation, at 60x PE based on FY15 earnings.
When Westbridge and other funds acquired a stake in DLPL in Feb’13, the company was reportedly valued between INR1,500 crore and INR1,750 crore. That was a valuation of about 29x PE, and about 3.5x sales. If the ask this time is indeed Rs 60B, then the valuation becomes a ridiculous 63x trailing EPS and 9x trailing sales. Some other media reports suggest the valuation
could be around Rs 50B, which is in our opinion still excessive.
The ideal valuation in our opinion should not exceed Rs 40B, which is just over 40x FY15 eps, or say around 32x likely FY16 eps.
DLPL filed a DRHP with SEBI in Sep’15, wherein the promoters and other existing shareholders will collectively sell 1.16 crore shares of the company amounting to 14.1 per cent stake.
As per the DRHP filed with Sebi, the IPO would be made through an Offer for Sale (OFS) and the proceeds would be remitted to the respective promoters and other investors and therefore the company will not receive any proceeds from the offer.
The OFS will involve 11.6 million shares, or 14.1% of the company’s equity capital. This involves 1.26 million shares by Dr. Arvind Lal, 2.05 million shares by Dr. Vandana Lal, 238,226 shares by Eskay House (HUF), 550,386 shares by Anjaneya Lal, 5.86 million shares by Wagner Ltd, 1.47 million shares by WCF (Westbridge Crossover Fund), and 161,070 shares by SIH (Sanjeevini Investment Holdings). Among these, Dr. Arvind Lal, Dr. Vandana Lal, Eskay House (HUF), and Anjaneya Lal are among the promoters of the company.
Kotak Mahindra Capital and Citigroup Global Markets India are the book running lead managers for the IPO.
India-Healtcare-Unlisted Dr Lal Pathlabs 3 Oct’15
www.indiabusinessreports.com 4
FINANCIAL DETAILS
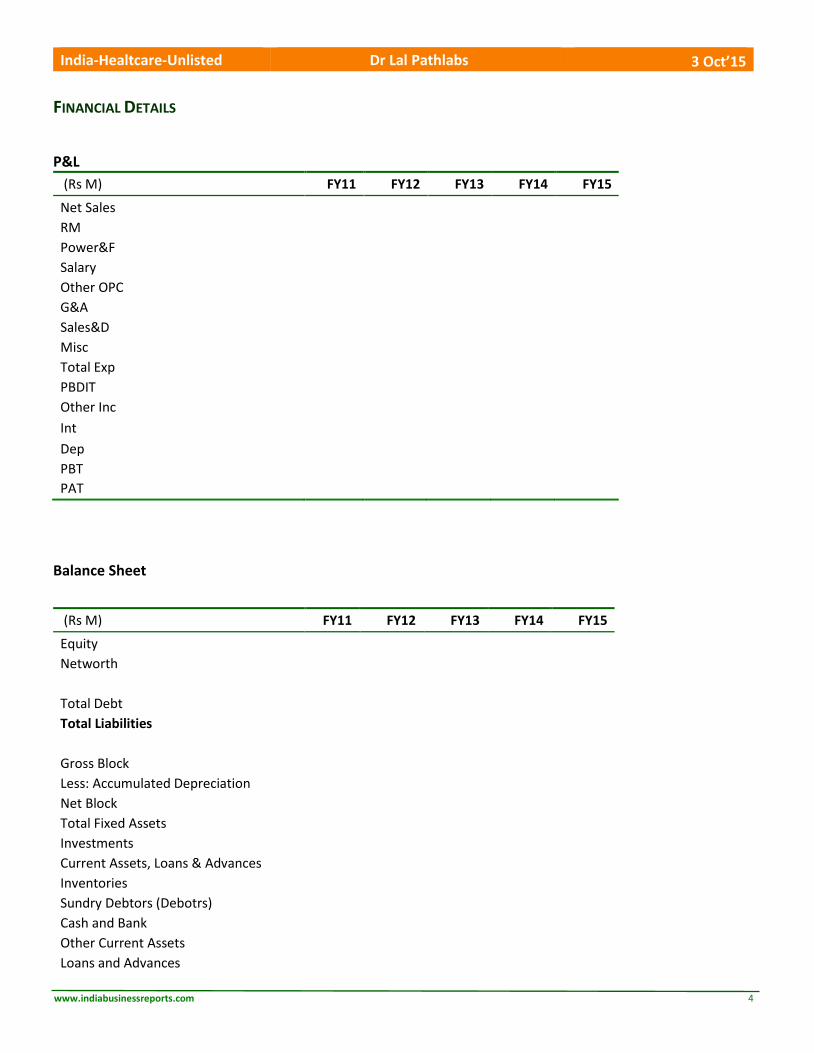
P&L
(Rs M) FY11 FY12 FY13 FY14 FY15
Net Sales 2,373.0 3,422.0 4,517.0 5,579.0 6,596.0
RM 609.0 762.0 973.0 1,177.0 1,392.0
Power&F 43.0 53.0 75.0 97.0 113.0
Salary 378.0 538.0 938.0 1,016.0 1,344.0
Other OPC 130.0 196.0 259.0 337.0 400.0
G&A - - - - -
Sales&D 593.0 926.0 1,183.0 1,419.0 1,619.0
Misc 54.0 82.0 111.0 149.0 169.0
Total Exp 1,806.0 2,557.0 3,540.0 4,194.0 5,036.0
PBDIT 566.0 865.0 977.0 1,386.0 1,560.0
Other Inc 25.0 23.0 34.0 81.0 123.0
Int 8.0 25.0 4.0 2.0 4.0
Dep 136.0 198.0 204.0 272.0 282.0
PBT 447.0 664.0 802.0 1,192.0 1,397.0
PAT 295.0 452.0 556.0 803.0 950.0
Balance Sheet
(Rs M) FY11 FY12 FY13 FY14 FY15
Equity 51 50 50 803 813
Networth 928 1,160 1,621 2,315 3,411
Total Debt 120 111 161 208 202
Total Liabilities 1,048 1,271 1,782 2,523 3,613
Gross Block 1,609 1,755 2,180 2,584 2,948
Less: Accumulated Depreciation 486 672 915 1,186 1,447
Net Block 1,123 1,083 1,265 1,398 1,501
Total Fixed Assets 1,123 1,083 1,265 1,398 1,501
Investments 121 225 671 302 552
Current Assets, Loans & Advances
Inventories 78 62 86 117 143
Sundry Debtors (Debotrs) 97 143 198 252 310
Cash and Bank 225 134 215 1,057 1,482
Other Current Assets 17 18 25 60 75
Loans and Advances 13 14 96 133 428
India-Healtcare-Unlisted Dr Lal Pathlabs 3 Oct’15
www.indiabusinessreports.com 5
Total Current Assets 430 371 620 1,619 2,438
Less : Current Liabilities and Provisions
Current Liabilities 523 298 742 841 927
Provisions 115 188 149 132 190
Total Current Liabilities 638 486 891 973 1,117
Net Current Assets -208 -115 -271 646 1,321
Miscellaneous 12 78 117 177 239
Total Assets 1,048 1,271 1,782 2,523 3,613
Ratios
FY11 FY12 FY13 FY14 FY15
Growth (%) Sales
44.2% 32.0% 23.5% 18.2%
PBDIT
52.8% 12.9% 41.9% 12.6%
PBT
48.5% 20.8% 48.6% 17.2%
PAT
53.2% 23.0% 44.4% 18.3%
Margins (%) PBDIT 23.9% 25.3% 21.6% 24.8% 23.7%
PAT 12.4% 13.2% 12.3% 14.4% 14.4%
Capital Efficiency (%) ROE
43.3% 40.0% 40.8% 33.2%
ROCE
59.4% 52.8% 55.5% 45.7%
Leverage D/E (x) 0.13 0.10 0.10 0.09 0.06
Debt/Ebitda 0.21 0.13 0.16 0.15 0.13
Working Capital (days) Inventory t/o 32.0 25.3 20.7 23.0 24.9
Debtors t/o 12.9 12.8 13.8 14.7 15.5
Payable t/o 229.8 196.6 195.1 245.5 231.8
WC Cycle -185.0 -158.6 -160.6 -207.7 -191.3

India-Healtcare-Unlisted Dr Lal Pathlabs 3 Oct’15
www.indiabusinessreports.com 6
About India Business Reports India Business Reports (IBR) is an initiative of experienced professionals with comprehensive experience across wide domains – Research, Investment Banking, Private Equity Funding, Consulting, Branding and Marketing. The single minded objective at IBR is to generate insightful reports based on hard facts. Our endeavour is to search for a Big Idea, among seemingly un-connected data points, which has significant strategic relevance. So be it India entry strategies, growth strategies, M&A opportunities or private equity investments, our reports can become a powerful tool in many ways. Our content and expertise is relevant not only for the financial fraternity, but also global MNCs looking to do business with India, and Indian companies looking to fine tune their growth strategies. Disclaimer This note is based on information obtained from public sources and sources believed to be reliable, but no independent verification has been made nor is its accuracy or completeness guaranteed. The content in this note is solely for informational purpose and is not a solicitation of offer to buy or sell or subscribe for securities or other financial instruments. Nothing in this note constitutes investment, legal, accounting and tax advice. India Business Reports or its owner-partners accept no liabilities for any loss or damage of any kind arising out of the use of this note. Contact [email protected]