Embed Size (px)
DESCRIPTION
Doing Business in Estonia
Citation preview
Economy
Economy Profile:
St. Estonia
2 Estonia Doing Business 2013
© 2013 The International Bank for Reconstruction and Development /
The World Bank
1818 H Street NW, Washington, DC 20433
Telephone: 202-473-1000; Internet: www.worldbank.org
All rights reserved.
1 2 3 4 15 14 13 12
A copublication of The World Bank and the International Finance Corporation.
This work is a product of the staff of The World Bank with external contributions.
Note that The World Bank does not necessarily own each component of the content
included in the work. The World Bank therefore does not warrant that the use of the
content contained in the work will not infringe on the rights of third parties. The risk
of claims resulting from such infringement rests solely with you.
The findings, interpretations, and conclusions expressed in this work do not
necessarily reflect the views of The World Bank, its Board of Executive Directors, or
the governments they represent. The World Bank does not guarantee the accuracy of
the data included in this work. The boundaries, colors, denominations, and other
information shown on any map in this work do not imply any judgment on the part of
The World Bank concerning the legal status of any territory or the endorsement or
acceptance of such boundaries.
Nothing herein shall constitute or be considered to be a limitation upon or waiver of
the privileges and immunities of The World Bank, all of which are specifically
reserved.
Rights and Permissions
This work is available under the Creative Commons Attribution 3.0 Unported license
(CC BY 3.0) http://creativecommons.org/licenses/by/3.0. Under the Creative
Commons Attribution license, you are free to copy, distribute, transmit, and adapt
this work, including for commercial purposes, under the following conditions:
Attribution—Please cite the work as follows: World Bank. 2013. Doing Business 2013:
Smarter Regulations for Small and Medium-Size Enterprises. Washington, DC: World
Bank Group. DOI: 10.1596/978-0-8213-9615-5. License: Creative Commons
Attribution CC BY 3.0
Translations—If you create a translation of this work, please add the following
disclaimer along with the attribution: This translation was not created by The World
Bank and should not be considered an official World Bank translation. The World Bank
shall not be liable for any content or error in this translation.
All queries on rights and licenses should be addressed to the Office of the Publisher,
The World Bank, 1818 H Street NW, Washington, DC 20433, USA; fax: 202-522-2625;
e-mail: [email protected].
Additional copies of all 10 editions of Doing Business may be purchased at
www.doingbusiness.org.
Cover design: Corporate Visions, Inc.
3 Estonia Doing Business 2013
CONTENTS
Introduction .................................................................................................................................. 4
The business environment .......................................................................................................... 5
Starting a business ..................................................................................................................... 14
Dealing with construction permits ........................................................................................... 23
Getting electricity ....................................................................................................................... 34
Registering property .................................................................................................................. 41
Getting credit .............................................................................................................................. 50
Protecting investors ................................................................................................................... 57
Paying taxes ................................................................................................................................ 66
Trading across borders .............................................................................................................. 74
Enforcing contracts .................................................................................................................... 83
Resolving insolvency .................................................................................................................. 93
Employing workers .................................................................................................................... 99
Data notes ................................................................................................................................. 106
Resources on the Doing Business website ............................................................................ 111
4 Estonia Doing Business 2013
INTRODUCTION
Doing Business sheds light on how easy or difficult it is
for a local entrepreneur to open and run a small to
medium-size business when complying with relevant
regulations. It measures and tracks changes in
regulations affecting 11 areas in the life cycle of a
business: starting a business, dealing with construction
permits, getting electricity, registering property,
getting credit, protecting investors, paying taxes,
trading across borders, enforcing contracts, resolving
insolvency and employing workers.
In a series of annual reports Doing Business presents
quantitative indicators on business regulations and the
protection of property rights that can be compared
across 185 economies, from Afghanistan to Zimbabwe,
over time. The data set covers 46 economies in Sub-
Saharan Africa, 33 in Latin America and the Caribbean,
24 in East Asia and the Pacific, 24 in Eastern Europe
and Central Asia, 19 in the Middle East and North
Africa and 8 in South Asia, as well as 31 OECD high-
income economies. The indicators are used to analyze
economic outcomes and identify what reforms have
worked, where and why.
This economy profile presents the Doing Business
indicators for Estonia. To allow useful comparison, it
also provides data for other selected economies
(comparator economies) for each indicator. The data in
this report are current as of June 1, 2012 (except for
the paying taxes indicators, which cover the period
January–December 2011).
The Doing Business methodology has limitations. Other
areas important to business—such as an economy‘s
proximity to large markets, the quality of its
infrastructure services (other than those related to
trading across borders and getting electricity), the
security of property from theft and looting, the
transparency of government procurement,
macroeconomic conditions or the underlying strength
of institutions—are not directly studied by Doing
Business. The indicators refer to a specific type of
business, generally a local limited liability company
operating in the largest business city. Because
standard assumptions are used in the data collection,
comparisons and benchmarks are valid across
economies. The data not only highlight the extent of
obstacles to doing business; they also help identify the
source of those obstacles, supporting policy makers in
designing regulatory reform.
More information is available in the full report. Doing
Business 2013 presents the indicators, analyzes their
relationship with economic outcomes and presents
business regulatory reforms. The data, along with
information on ordering Doing Business 2013, are
available on the Doing Business website at
http://www.doingbusiness.org.
5 Estonia Doing Business 2013
THE BUSINESS ENVIRONMENT
For policy makers trying to improve their economy‘s
regulatory environment for business, a good place to
start is to find out how it compares with the regulatory
environment in other economies. Doing Business
provides an aggregate ranking on the ease of doing
business based on indicator sets that measure and
benchmark regulations applying to domestic small to
medium-size businesses through their life cycle.
Economies are ranked from 1 to 185 by the ease of
doing business index. For each economy the index is
calculated as the ranking on the simple average of its
percentile rankings on each of the 10 topics included in
the index in Doing Business 2013: starting a business,
dealing with construction permits, getting electricity,
registering property, getting credit, protecting
investors, paying taxes, trading across borders,
enforcing contracts and resolving insolvency. The
ranking on each topic is the simple average of the
percentile rankings on its component indicators (see
the data notes for more details). The employing workers
indicators are not included in this year‘s aggregate ease
of doing business ranking, but the data are presented
in this year‘s economy profile.
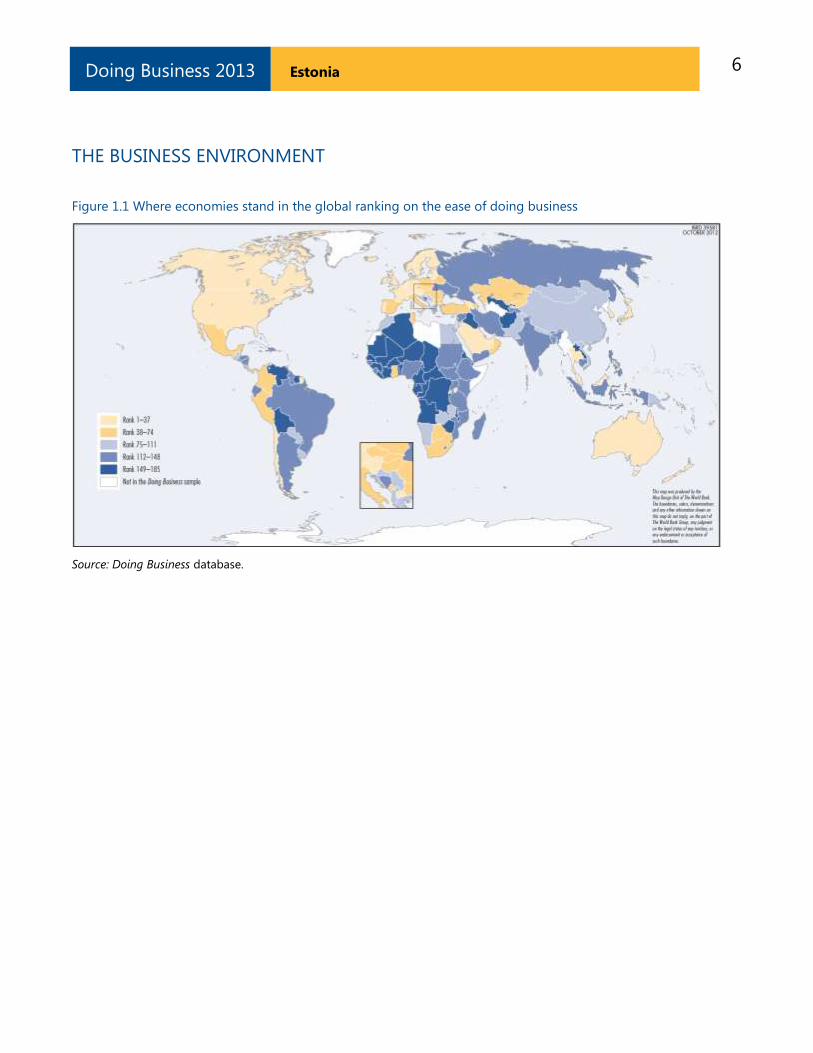
The aggregate ranking on the ease of doing business
benchmarks each economy‘s performance on the
indicators against that of all other economies in the
Doing Business sample (figure 1.1). While this ranking
tells much about the business environment in an
economy, it does not tell the whole story. The ranking on
the ease of doing business, and the underlying
indicators, do not measure all aspects of the business
environment that matter to firms and investors or that
affect the competitiveness of the economy. Still, a high
ranking does mean that the government has created a
regulatory environment conducive to operating a
business.
ECONOMY OVERVIEW
Region: OECD high income
Income category: High income
Population: 1,340,000
GNI per capita (US$): 15,200
DB2013 rank: 21
DB2012 rank: 19*
Change in rank: -2
* DB2012 ranking shown is not last year‘s published
ranking but a comparable ranking for DB2012 that
captures the effects of such factors as data
corrections and the addition of 2 economies
(Barbados and Malta) to the sample this year. See
the data notes for sources and definitions.
6 Estonia Doing Business 2013
THE BUSINESS ENVIRONMENT
Figure 1.1 Where economies stand in the global ranking on the ease of doing business
Source: Doing Business database.
7 Estonia Doing Business 2013
THE BUSINESS ENVIRONMENT
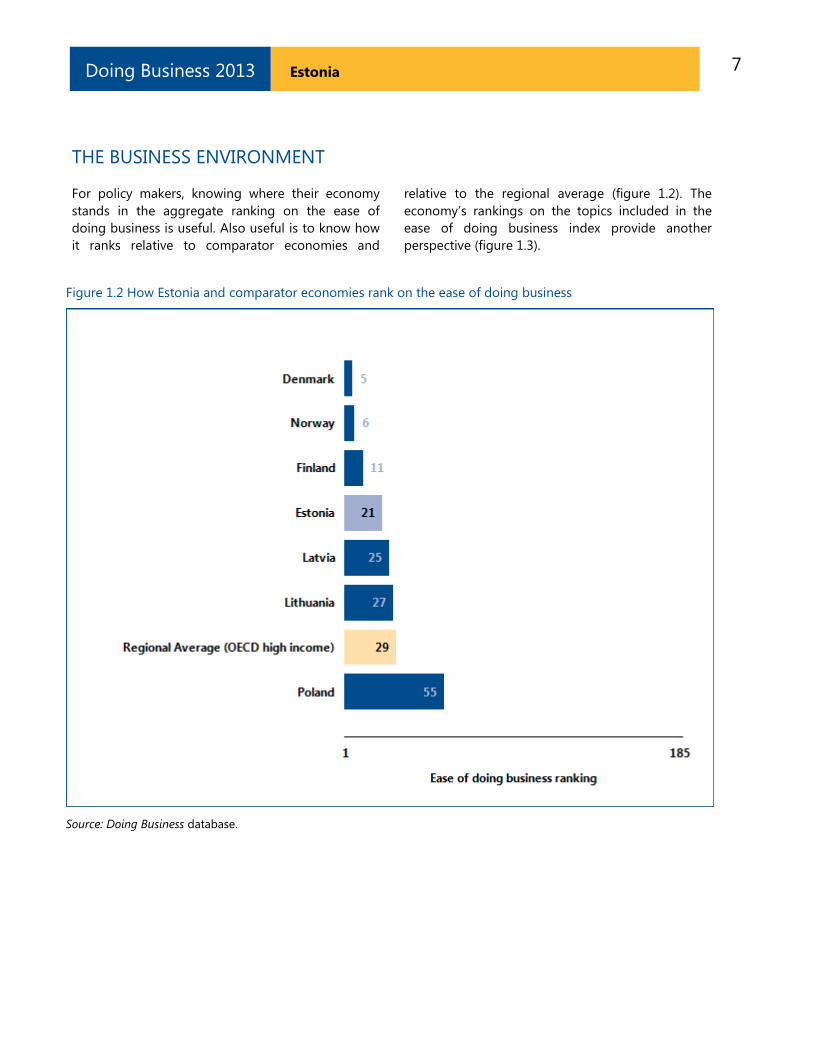
For policy makers, knowing where their economy
stands in the aggregate ranking on the ease of
doing business is useful. Also useful is to know how
it ranks relative to comparator economies and
relative to the regional average (figure 1.2). The
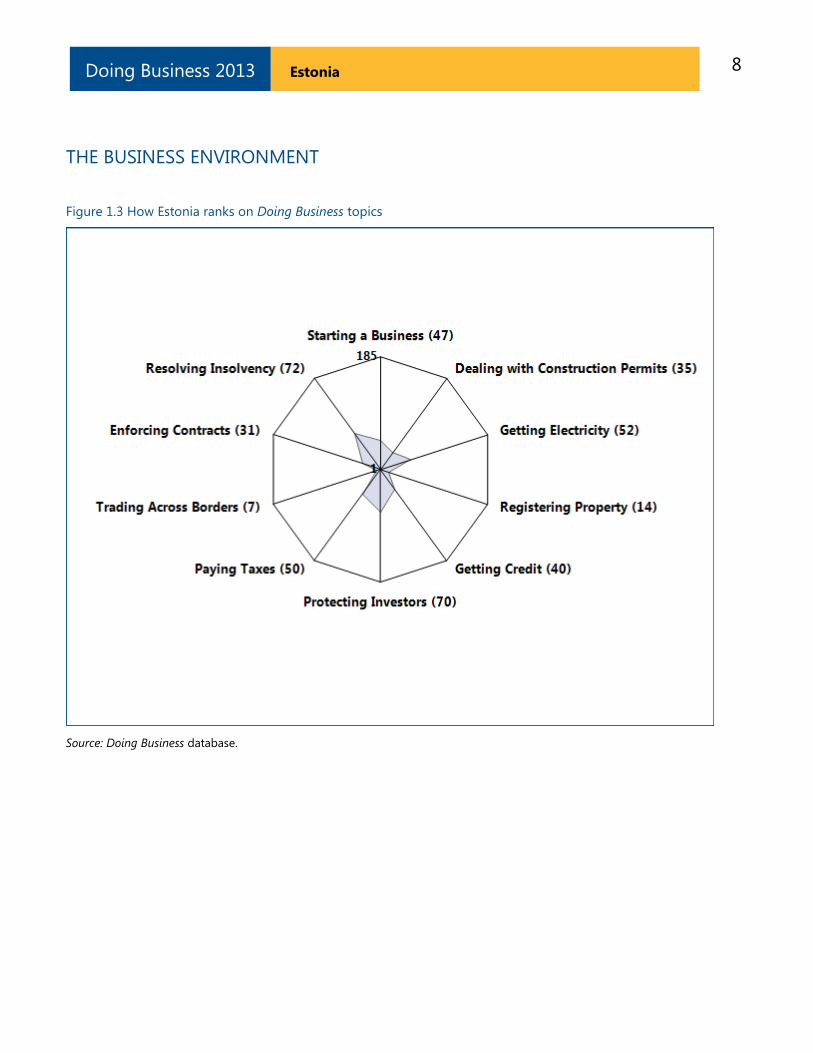
economy‘s rankings on the topics included in the
ease of doing business index provide another
perspective (figure 1.3).
Figure 1.2 How Estonia and comparator economies rank on the ease of doing business
Source: Doing Business database.
8 Estonia Doing Business 2013
THE BUSINESS ENVIRONMENT
Figure 1.3 How Estonia ranks on Doing Business topics
Source: Doing Business database.
9 Estonia Doing Business 2013
THE BUSINESS ENVIRONMENT
Just as the overall ranking on the ease of doing business
tells only part of the story, so do changes in that ranking.
Yearly movements in rankings can provide some indication
of changes in an economy‘s regulatory environment for
firms, but they are always relative. An economy‘s ranking
might change because of developments in other
economies. An economy that implemented business
regulation reforms may fail to rise in the rankings (or may
even drop) if it is passed by others whose business
regulation reforms had a more significant impact as
measured by Doing Business.
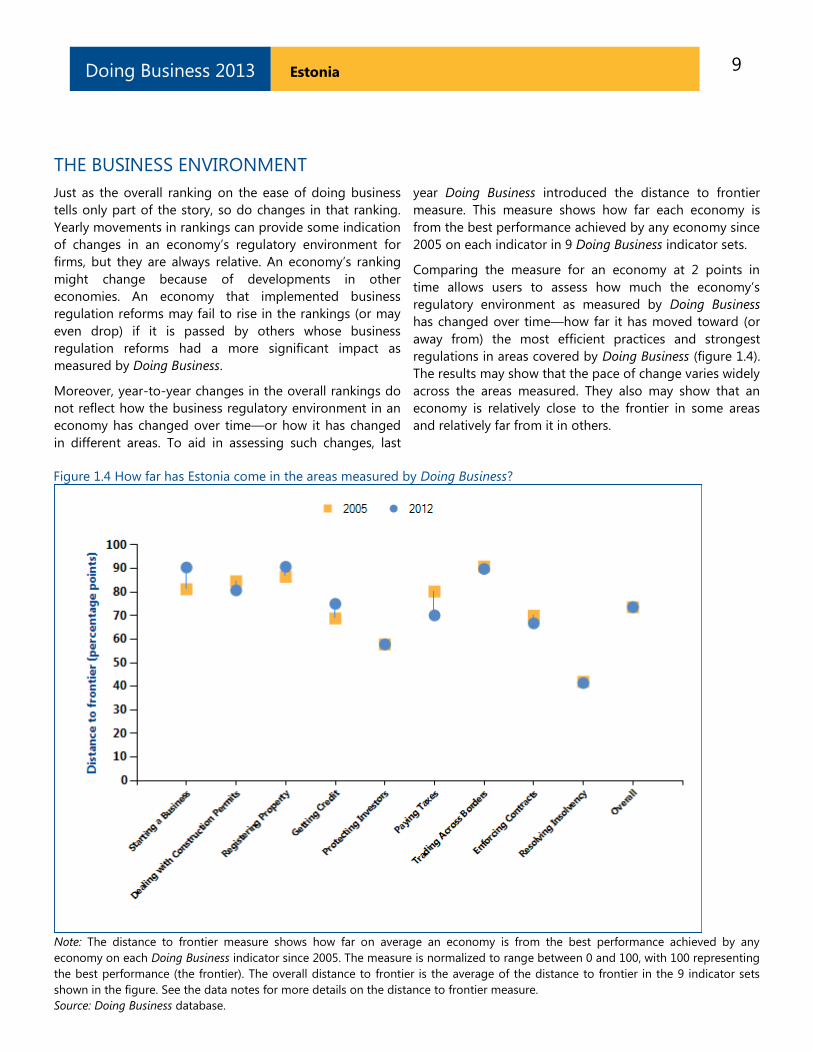
Moreover, year-to-year changes in the overall rankings do
not reflect how the business regulatory environment in an
economy has changed over time—or how it has changed
in different areas. To aid in assessing such changes, last
year Doing Business introduced the distance to frontier
measure. This measure shows how far each economy is
from the best performance achieved by any economy since
2005 on each indicator in 9 Doing Business indicator sets.
Comparing the measure for an economy at 2 points in
time allows users to assess how much the economy‘s
regulatory environment as measured by Doing Business
has changed over time—how far it has moved toward (or
away from) the most efficient practices and strongest
regulations in areas covered by Doing Business (figure 1.4).
The results may show that the pace of change varies widely
across the areas measured. They also may show that an
economy is relatively close to the frontier in some areas
and relatively far from it in others.
Figure 1.4 How far has Estonia come in the areas measured by Doing Business?
Note: The distance to frontier measure shows how far on average an economy is from the best performance achieved by any
economy on each Doing Business indicator since 2005. The measure is normalized to range between 0 and 100, with 100 representing
the best performance (the frontier). The overall distance to frontier is the average of the distance to frontier in the 9 indicator sets
shown in the figure. See the data notes for more details on the distance to frontier measure.
Source: Doing Business database.
10 Estonia Doing Business 2013
THE BUSINESS ENVIRONMENT
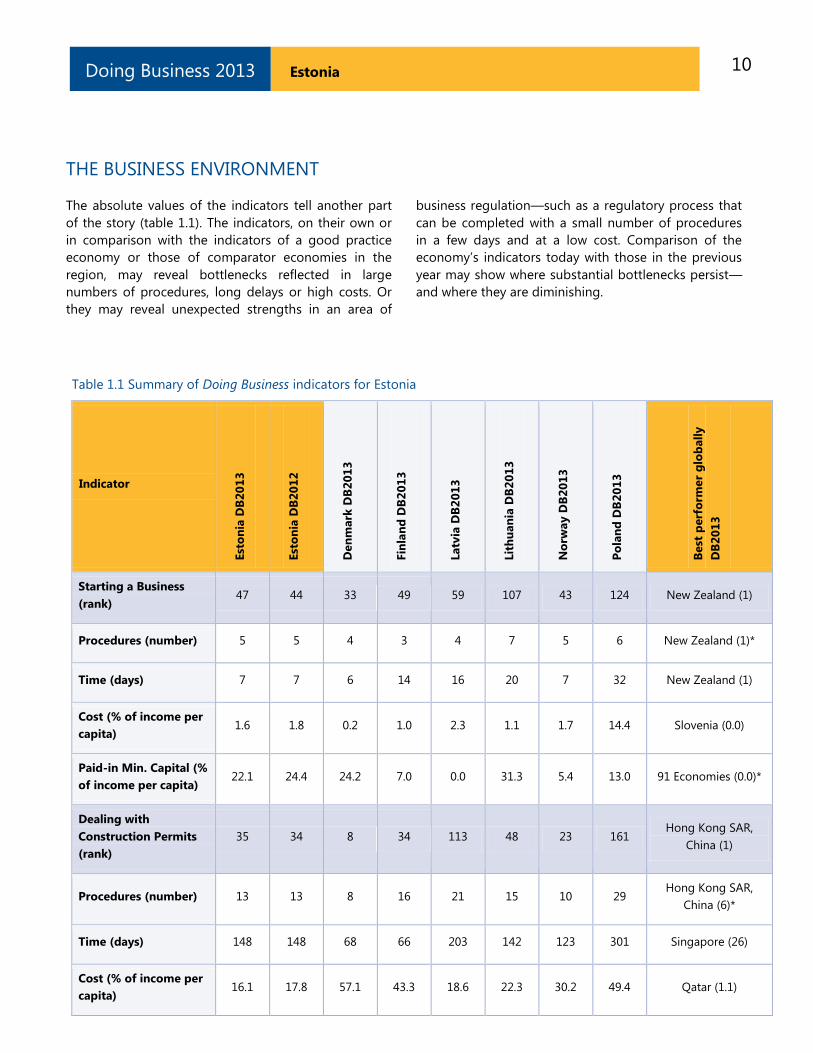
The absolute values of the indicators tell another part
of the story (table 1.1). The indicators, on their own or
in comparison with the indicators of a good practice
economy or those of comparator economies in the
region, may reveal bottlenecks reflected in large
numbers of procedures, long delays or high costs. Or
they may reveal unexpected strengths in an area of
business regulation—such as a regulatory process that
can be completed with a small number of procedures
in a few days and at a low cost. Comparison of the
economy‘s indicators today with those in the previous
year may show where substantial bottlenecks persist—
and where they are diminishing.
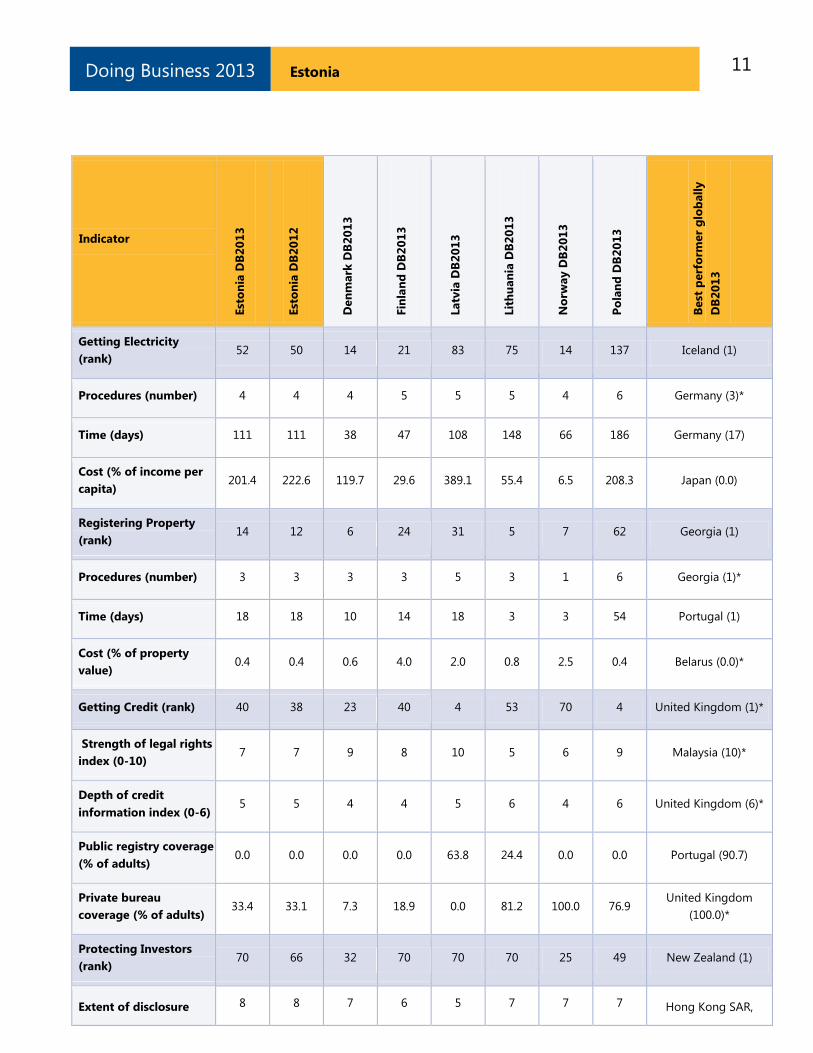
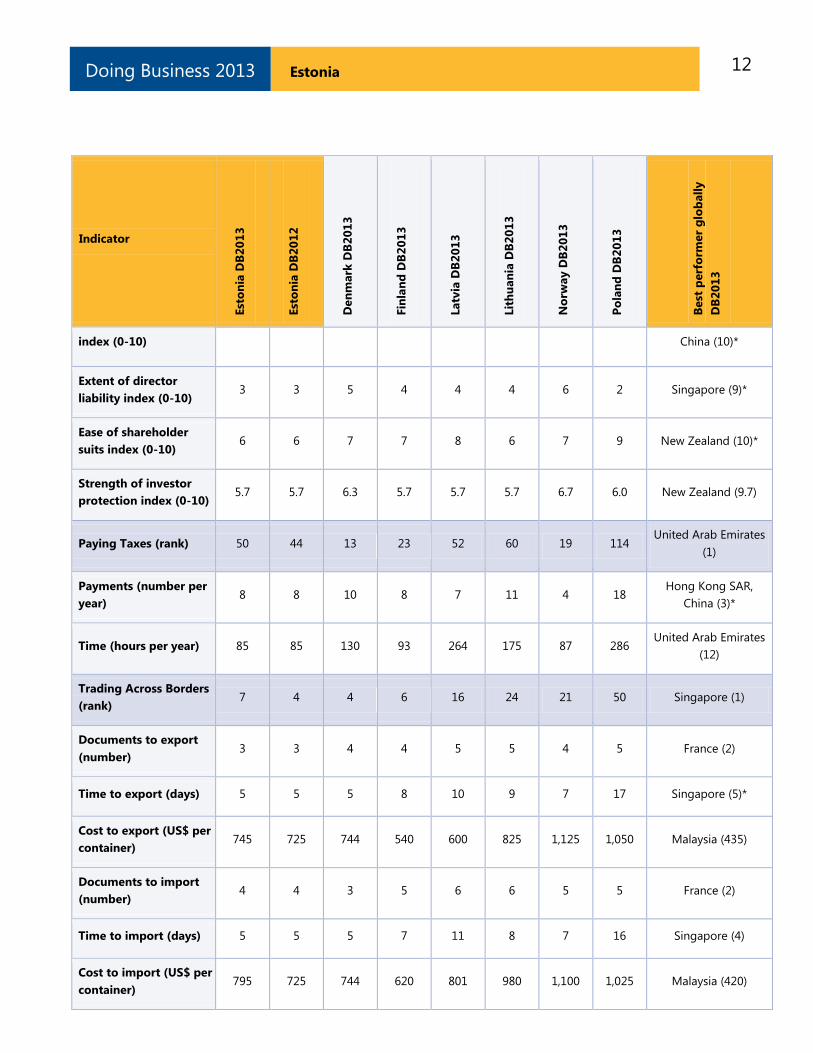
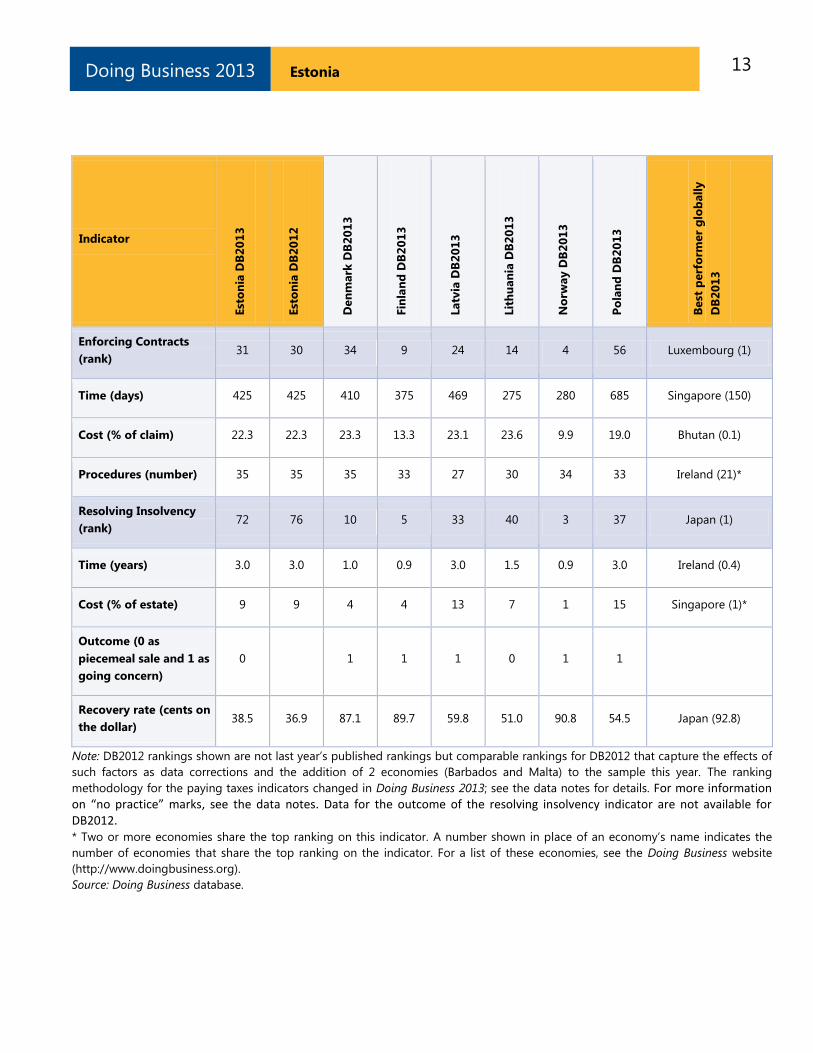
Table 1.1 Summary of Doing Business indicators for Estonia
Indicator
Est
on
ia D
B2
01
3
Est
on
ia D
B2
01
2
Den
mark
DB
20
13
Fin
lan
d D
B2
01
3
Latv
ia D
B2
01
3
Lit
hu
an
ia D
B2
01
3
No
rway D
B2
01
3
Po
lan
d D
B2
01
3
Best
perf
orm
er
glo
ball
y
DB
20
13
Starting a Business
(rank) 47 44 33 49 59 107 43 124 New Zealand (1)
Procedures (number) 5 5 4 3 4 7 5 6 New Zealand (1)*
Time (days) 7 7 6 14 16 20 7 32 New Zealand (1)
Cost (% of income per
capita) 1.6 1.8 0.2 1.0 2.3 1.1 1.7 14.4 Slovenia (0.0)
Paid-in Min. Capital (%
of income per capita) 22.1 24.4 24.2 7.0 0.0 31.3 5.4 13.0 91 Economies (0.0)*
Dealing with
Construction Permits
(rank)
35 34 8 34 113 48 23 161 Hong Kong SAR,
China (1)
Procedures (number) 13 13 8 16 21 15 10 29 Hong Kong SAR,
China (6)*
Time (days) 148 148 68 66 203 142 123 301 Singapore (26)
Cost (% of income per
capita) 16.1 17.8 57.1 43.3 18.6 22.3 30.2 49.4 Qatar (1.1)
11 Estonia Doing Business 2013
Indicator Est
on
ia D
B2
01
3
Est
on
ia D
B2
01
2
Den
mark
DB
20
13
Fin
lan
d D
B2
01
3
Latv
ia D
B2
01
3
Lit
hu
an
ia D
B2
01
3
No
rway D
B2
01
3
Po
lan
d D
B2
01
3
Best
perf
orm
er
glo
ball
y
DB
20
13
Getting Electricity
(rank) 52 50 14 21 83 75 14 137 Iceland (1)
Procedures (number) 4 4 4 5 5 5 4 6 Germany (3)*
Time (days) 111 111 38 47 108 148 66 186 Germany (17)
Cost (% of income per
capita) 201.4 222.6 119.7 29.6 389.1 55.4 6.5 208.3 Japan (0.0)
Registering Property
(rank) 14 12 6 24 31 5 7 62 Georgia (1)
Procedures (number) 3 3 3 3 5 3 1 6 Georgia (1)*
Time (days) 18 18 10 14 18 3 3 54 Portugal (1)
Cost (% of property
value) 0.4 0.4 0.6 4.0 2.0 0.8 2.5 0.4 Belarus (0.0)*
Getting Credit (rank) 40 38 23 40 4 53 70 4 United Kingdom (1)*
Strength of legal rights
index (0-10) 7 7 9 8 10 5 6 9 Malaysia (10)*
Depth of credit
information index (0-6) 5 5 4 4 5 6 4 6 United Kingdom (6)*
Public registry coverage
(% of adults) 0.0 0.0 0.0 0.0 63.8 24.4 0.0 0.0 Portugal (90.7)
Private bureau
coverage (% of adults) 33.4 33.1 7.3 18.9 0.0 81.2 100.0 76.9
United Kingdom
(100.0)*
Protecting Investors
(rank) 70 66 32 70 70 70 25 49 New Zealand (1)
Extent of disclosure 8 8 7 6 5 7 7 7 Hong Kong SAR,
12 Estonia Doing Business 2013
Indicator Est
on
ia D
B2
01
3
Est
on
ia D
B2
01
2
Den
mark
DB
20
13
Fin
lan
d D
B2
01
3
Latv
ia D
B2
01
3
Lit
hu
an
ia D
B2
01
3
No
rway D
B2
01
3
Po
lan
d D
B2
01
3
Best
perf
orm
er
glo
ball
y
DB
20
13
index (0-10) China (10)*
Extent of director
liability index (0-10) 3 3 5 4 4 4 6 2 Singapore (9)*
Ease of shareholder
suits index (0-10) 6 6 7 7 8 6 7 9 New Zealand (10)*
Strength of investor
protection index (0-10) 5.7 5.7 6.3 5.7 5.7 5.7 6.7 6.0 New Zealand (9.7)
Paying Taxes (rank) 50 44 13 23 52 60 19 114 United Arab Emirates
(1)
Payments (number per
year) 8 8 10 8 7 11 4 18
Hong Kong SAR,
China (3)*
Time (hours per year) 85 85 130 93 264 175 87 286 United Arab Emirates
(12)
Trading Across Borders
(rank) 7 4 4 6 16 24 21 50 Singapore (1)
Documents to export
(number) 3 3 4 4 5 5 4 5 France (2)
Time to export (days) 5 5 5 8 10 9 7 17 Singapore (5)*
Cost to export (US$ per
container) 745 725 744 540 600 825 1,125 1,050 Malaysia (435)
Documents to import
(number) 4 4 3 5 6 6 5 5 France (2)
Time to import (days) 5 5 5 7 11 8 7 16 Singapore (4)
Cost to import (US$ per
container) 795 725 744 620 801 980 1,100 1,025 Malaysia (420)
13 Estonia Doing Business 2013
Indicator Est
on
ia D
B2
01
3
Est
on
ia D
B2
01
2
Den
mark
DB
20
13
Fin
lan
d D
B2
01
3
Latv
ia D
B2
01
3
Lit
hu
an
ia D
B2
01
3
No
rway D
B2
01
3
Po
lan
d D
B2
01
3
Best
perf
orm
er
glo
ball
y
DB
20
13
Enforcing Contracts
(rank) 31 30 34 9 24 14 4 56 Luxembourg (1)
Time (days) 425 425 410 375 469 275 280 685 Singapore (150)
Cost (% of claim) 22.3 22.3 23.3 13.3 23.1 23.6 9.9 19.0 Bhutan (0.1)
Procedures (number) 35 35 35 33 27 30 34 33 Ireland (21)*
Resolving Insolvency
(rank) 72 76 10 5 33 40 3 37 Japan (1)
Time (years) 3.0 3.0 1.0 0.9 3.0 1.5 0.9 3.0 Ireland (0.4)
Cost (% of estate) 9 9 4 4 13 7 1 15 Singapore (1)*
Outcome (0 as
piecemeal sale and 1 as
going concern)
0 1 1 1 0 1 1
Recovery rate (cents on
the dollar) 38.5 36.9 87.1 89.7 59.8 51.0 90.8 54.5 Japan (92.8)
Note: DB2012 rankings shown are not last year‘s published rankings but comparable rankings for DB2012 that capture the effects of
such factors as data corrections and the addition of 2 economies (Barbados and Malta) to the sample this year. The ranking
methodology for the paying taxes indicators changed in Doing Business 2013; see the data notes for details. For more information on “no practice” marks, see the data notes. Data for the outcome of the resolving insolvency indicator are not available for DB2012. * Two or more economies share the top ranking on this indicator. A number shown in place of an economy‘s name indicates the
number of economies that share the top ranking on the indicator. For a list of these economies, see the Doing Business website
(http://www.doingbusiness.org).
Source: Doing Business database.
14 Estonia Doing Business 2013
STARTING A BUSINESS
Formal registration of companies has many
immediate benefits for the companies and for
business owners and employees. Legal entities can
outlive their founders. Resources are pooled as
several shareholders join forces to start a company.
Formally registered companies have access to
services and institutions from courts to banks as
well as to new markets. And their employees can
benefit from protections provided by the law. An
additional benefit comes with limited liability
companies. These limit the financial liability of
company owners to their investments, so personal
assets of the owners are not put at risk. Where
governments make registration easy, more
entrepreneurs start businesses in the formal sector,
creating more good jobs and generating more
revenue for the government.
What do the indicators cover?
Doing Business measures the ease of starting a
business in an economy by recording all
procedures officially required or commonly done in
practice by an entrepreneur to start up and
formally operate an industrial or commercial
business—as well as the time and cost required to
complete these procedures. It also records the
paid-in minimum capital that companies must
deposit before registration (or within 3 months).
The ranking on the ease of starting a business is
the simple average of the percentile rankings on
the 4 component indicators: procedures, time, cost
and paid-in minimum capital requirement.
To make the data comparable across economies,
Doing Business uses several assumptions about the
business and the procedures. It assumes that all
information is readily available to the entrepreneur
and that there has been no prior contact with
officials. It also assumes that the entrepreneur will
pay no bribes. And it assumes that the business:
Is a limited liability company, located in the
largest business city.
Has between 10 and 50 employees.
Conducts general commercial or industrial
activities.
WHAT THE STARTING A BUSINESS
INDICATORS MEASURE
Procedures to legally start and operate a
company (number)
Preregistration (for example, name
verification or reservation, notarization)
Registration in the economy‘s largest
business city
Postregistration (for example, social security
registration, company seal)
Time required to complete each procedure
(calendar days)
Does not include time spent gathering
information
Each procedure starts on a separate day
Procedure completed once final document is
received
No prior contact with officials
Cost required to complete each procedure
(% of income per capita)
Official costs only, no bribes
No professional fees unless services required
by law
Paid-in minimum capital (% of income
per capita)
Deposited in a bank or with a notary before
registration (or within 3 months)
Has a start-up capital of 10 times income per
capita.
Has a turnover of at least 100 times income per
capita.
Does not qualify for any special benefits.
Does not own real estate.
Is 100% domestically owned.
15 Estonia Doing Business 2013
STARTING A BUSINESS
Where does the economy stand today?
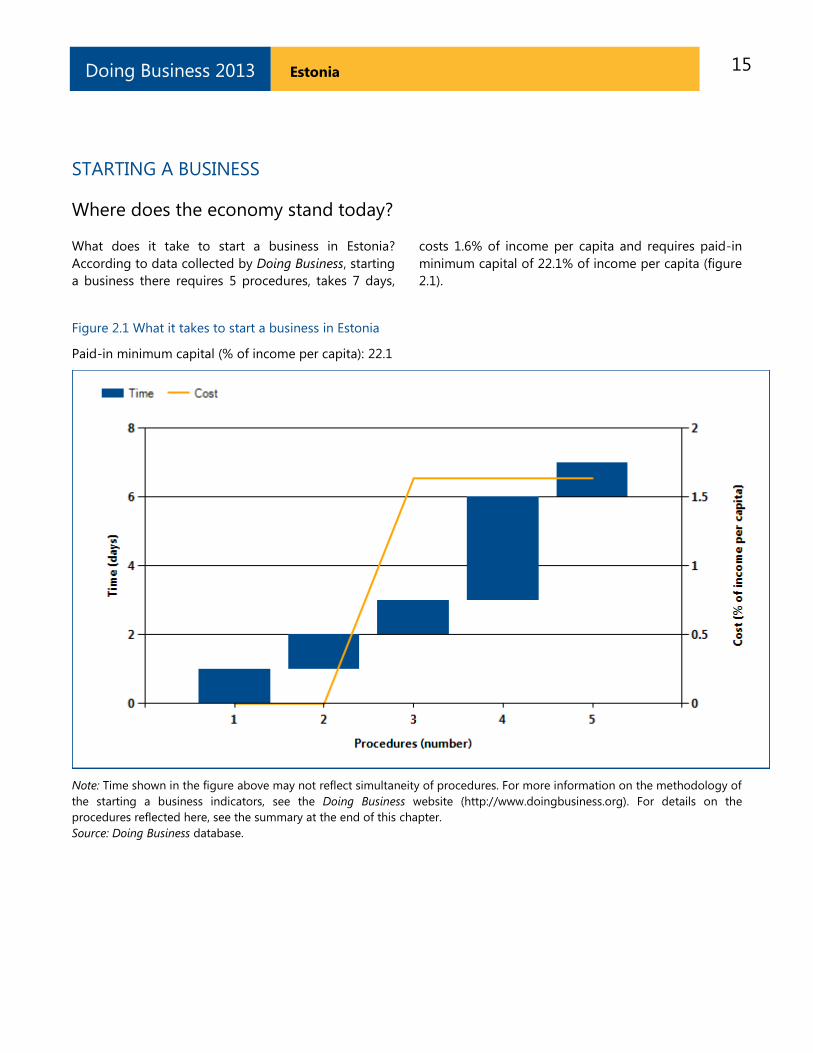
What does it take to start a business in Estonia?
According to data collected by Doing Business, starting
a business there requires 5 procedures, takes 7 days,
costs 1.6% of income per capita and requires paid-in
minimum capital of 22.1% of income per capita (figure
2.1).
Figure 2.1 What it takes to start a business in Estonia
Paid-in minimum capital (% of income per capita): 22.1
Note: Time shown in the figure above may not reflect simultaneity of procedures. For more information on the methodology of
the starting a business indicators, see the Doing Business website (http://www.doingbusiness.org). For details on the
procedures reflected here, see the summary at the end of this chapter.
Source: Doing Business database.
16 Estonia Doing Business 2013
STARTING A BUSINESS
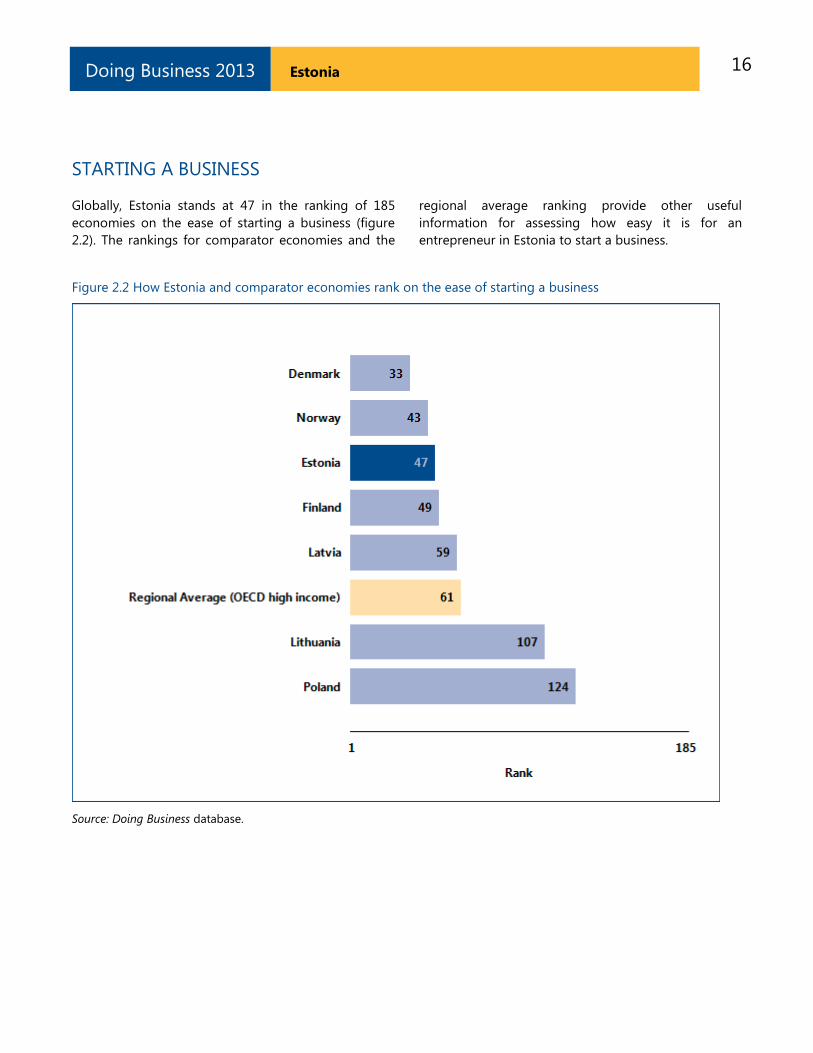
Globally, Estonia stands at 47 in the ranking of 185
economies on the ease of starting a business (figure
2.2). The rankings for comparator economies and the
regional average ranking provide other useful
information for assessing how easy it is for an
entrepreneur in Estonia to start a business.
Figure 2.2 How Estonia and comparator economies rank on the ease of starting a business
Source: Doing Business database.
17 Estonia Doing Business 2013
STARTING A BUSINESS
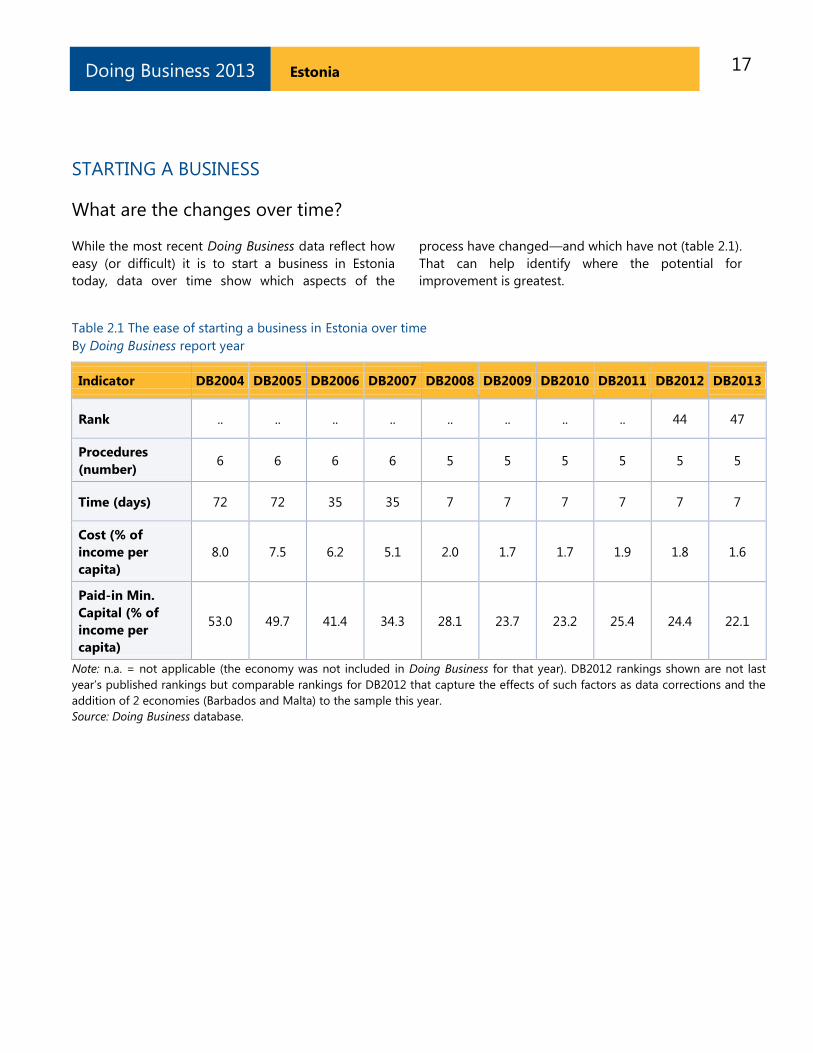
What are the changes over time?
While the most recent Doing Business data reflect how
easy (or difficult) it is to start a business in Estonia
today, data over time show which aspects of the
process have changed—and which have not (table 2.1).
That can help identify where the potential for
improvement is greatest.
Table 2.1 The ease of starting a business in Estonia over time
By Doing Business report year
Indicator DB2004 DB2005 DB2006 DB2007 DB2008 DB2009 DB2010 DB2011 DB2012 DB2013
Rank .. .. .. .. .. .. .. .. 44 47
Procedures
(number) 6 6 6 6 5 5 5 5 5 5
Time (days) 72 72 35 35 7 7 7 7 7 7
Cost (% of
income per
capita)
8.0 7.5 6.2 5.1 2.0 1.7 1.7 1.9 1.8 1.6
Paid-in Min.
Capital (% of
income per
capita)
53.0 49.7 41.4 34.3 28.1 23.7 23.2 25.4 24.4 22.1
Note: n.a. = not applicable (the economy was not included in Doing Business for that year). DB2012 rankings shown are not last
year‘s published rankings but comparable rankings for DB2012 that capture the effects of such factors as data corrections and the
addition of 2 economies (Barbados and Malta) to the sample this year.
Source: Doing Business database.
18 Estonia Doing Business 2013
STARTING A BUSINESS
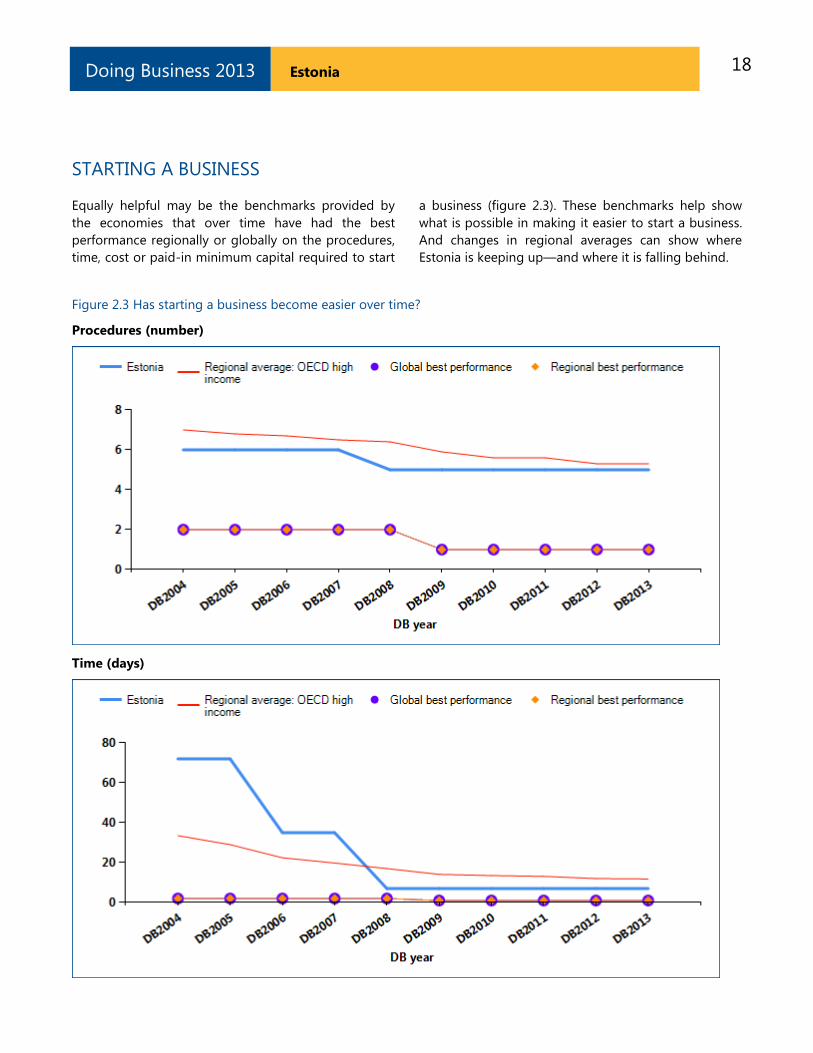
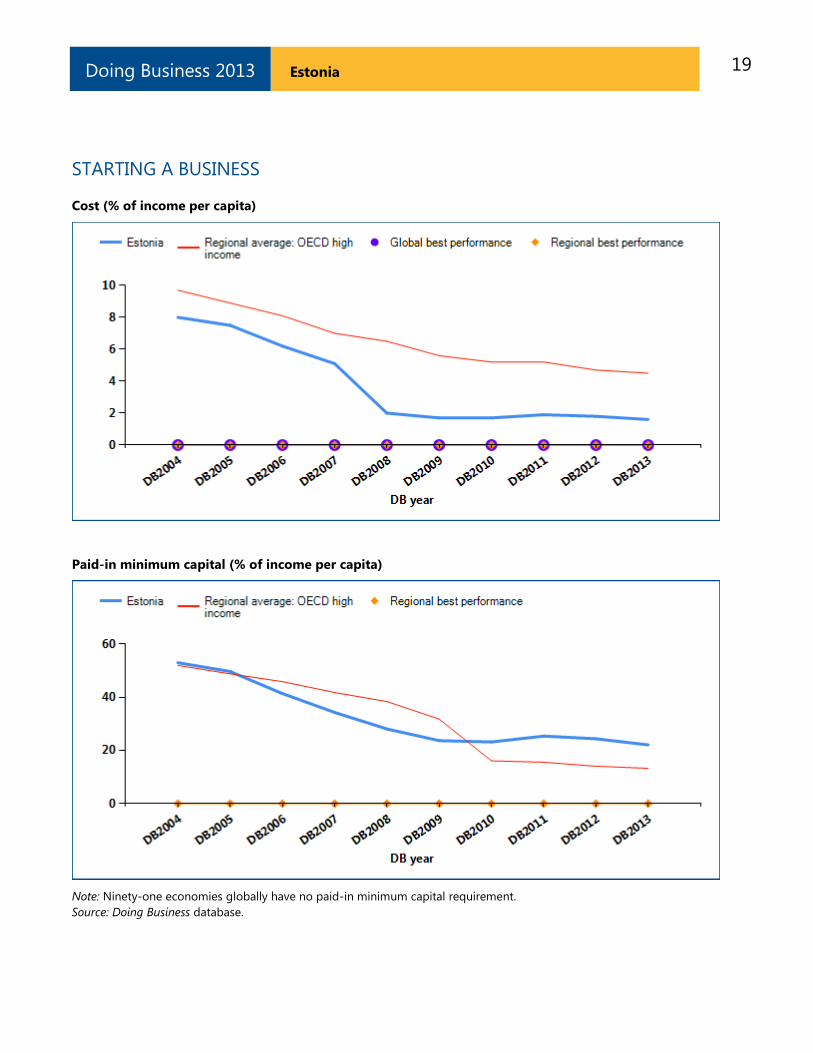
Equally helpful may be the benchmarks provided by
the economies that over time have had the best
performance regionally or globally on the procedures,
time, cost or paid-in minimum capital required to start
a business (figure 2.3). These benchmarks help show
what is possible in making it easier to start a business.
And changes in regional averages can show where
Estonia is keeping up—and where it is falling behind.
Figure 2.3 Has starting a business become easier over time?
Procedures (number)
Time (days)
19 Estonia Doing Business 2013
STARTING A BUSINESS
Cost (% of income per capita)
Paid-in minimum capital (% of income per capita)
Note: Ninety-one economies globally have no paid-in minimum capital requirement.
Source: Doing Business database.
20 Estonia Doing Business 2013
STARTING A BUSINESS
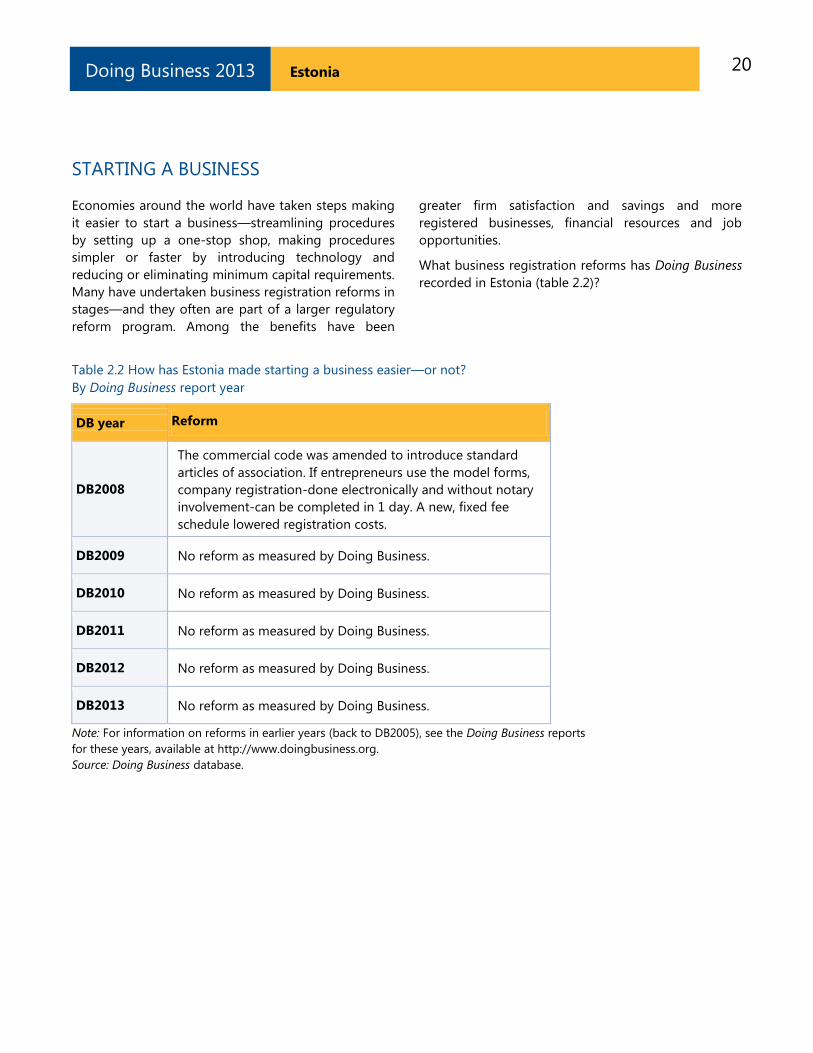
Economies around the world have taken steps making
it easier to start a business—streamlining procedures
by setting up a one-stop shop, making procedures
simpler or faster by introducing technology and
reducing or eliminating minimum capital requirements.
Many have undertaken business registration reforms in
stages—and they often are part of a larger regulatory
reform program. Among the benefits have been
greater firm satisfaction and savings and more
registered businesses, financial resources and job
opportunities.
What business registration reforms has Doing Business
recorded in Estonia (table 2.2)?
Table 2.2 How has Estonia made starting a business easier—or not?
By Doing Business report year
DB year Reform
DB2008
The commercial code was amended to introduce standard
articles of association. If entrepreneurs use the model forms,
company registration-done electronically and without notary
involvement-can be completed in 1 day. A new, fixed fee
schedule lowered registration costs.
DB2009 No reform as measured by Doing Business.
DB2010 No reform as measured by Doing Business.
DB2011 No reform as measured by Doing Business.
DB2012 No reform as measured by Doing Business.
DB2013 No reform as measured by Doing Business.
Note: For information on reforms in earlier years (back to DB2005), see the Doing Business reports
for these years, available at http://www.doingbusiness.org.
Source: Doing Business database.
21 Estonia Doing Business 2013
STARTING A BUSINESS
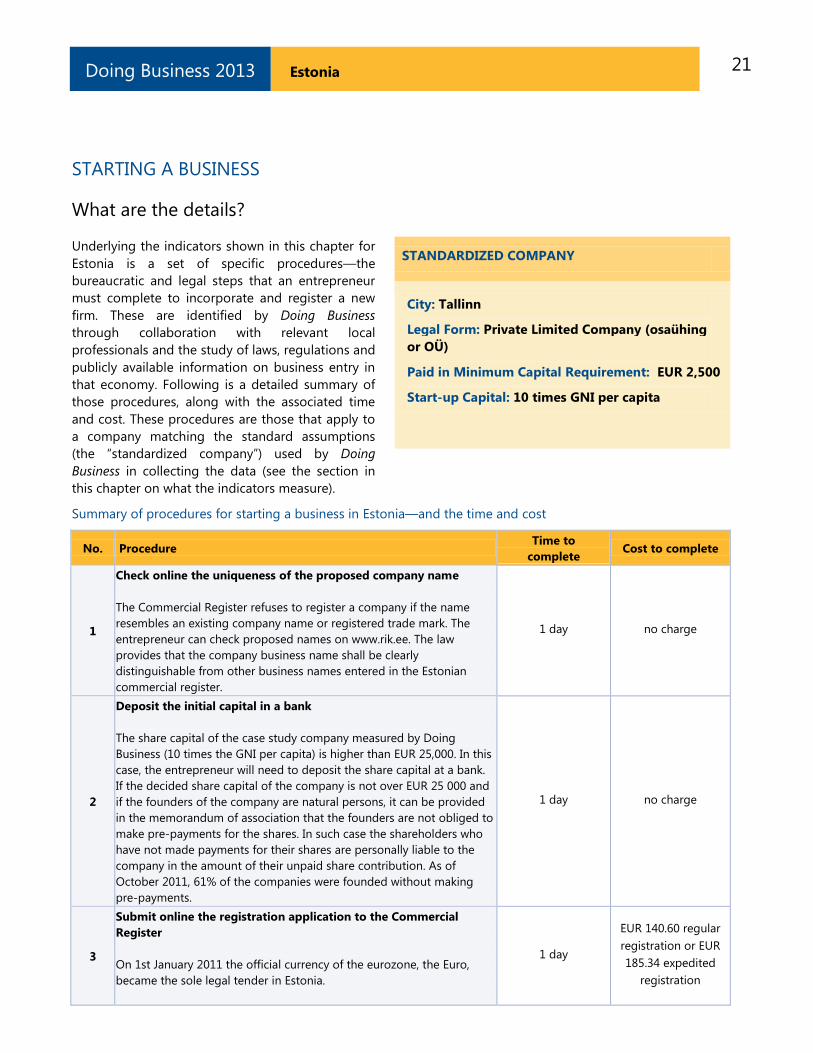
What are the details?
Underlying the indicators shown in this chapter for
Estonia is a set of specific procedures—the
bureaucratic and legal steps that an entrepreneur
must complete to incorporate and register a new
firm. These are identified by Doing Business
through collaboration with relevant local
professionals and the study of laws, regulations and
publicly available information on business entry in
that economy. Following is a detailed summary of
those procedures, along with the associated time
and cost. These procedures are those that apply to
a company matching the standard assumptions
(the ―standardized company‖) used by Doing
Business in collecting the data (see the section in
this chapter on what the indicators measure).
STANDARDIZED COMPANY
City: Tallinn
Legal Form: Private Limited Company (osaühing
or OÜ)
Paid in Minimum Capital Requirement: EUR 2,500
Start-up Capital: 10 times GNI per capita
Summary of procedures for starting a business in Estonia—and the time and cost
No. Procedure Time to
complete Cost to complete
1
Check online the uniqueness of the proposed company name
The Commercial Register refuses to register a company if the name
resembles an existing company name or registered trade mark. The
entrepreneur can check proposed names on www.rik.ee. The law
provides that the company business name shall be clearly
distinguishable from other business names entered in the Estonian
commercial register.
1 day no charge
2
Deposit the initial capital in a bank
The share capital of the case study company measured by Doing
Business (10 times the GNI per capita) is higher than EUR 25,000. In this
case, the entrepreneur will need to deposit the share capital at a bank.
If the decided share capital of the company is not over EUR 25 000 and
if the founders of the company are natural persons, it can be provided
in the memorandum of association that the founders are not obliged to
make pre-payments for the shares. In such case the shareholders who
have not made payments for their shares are personally liable to the
company in the amount of their unpaid share contribution. As of
October 2011, 61% of the companies were founded without making
pre-payments.
1 day no charge
3
Submit online the registration application to the Commercial
Register
On 1st January 2011 the official currency of the eurozone, the Euro,
became the sole legal tender in Estonia.
1 day
EUR 140.60 regular
registration or EUR
185.34 expedited
registration
22 Estonia Doing Business 2013
No. Procedure Time to
complete Cost to complete
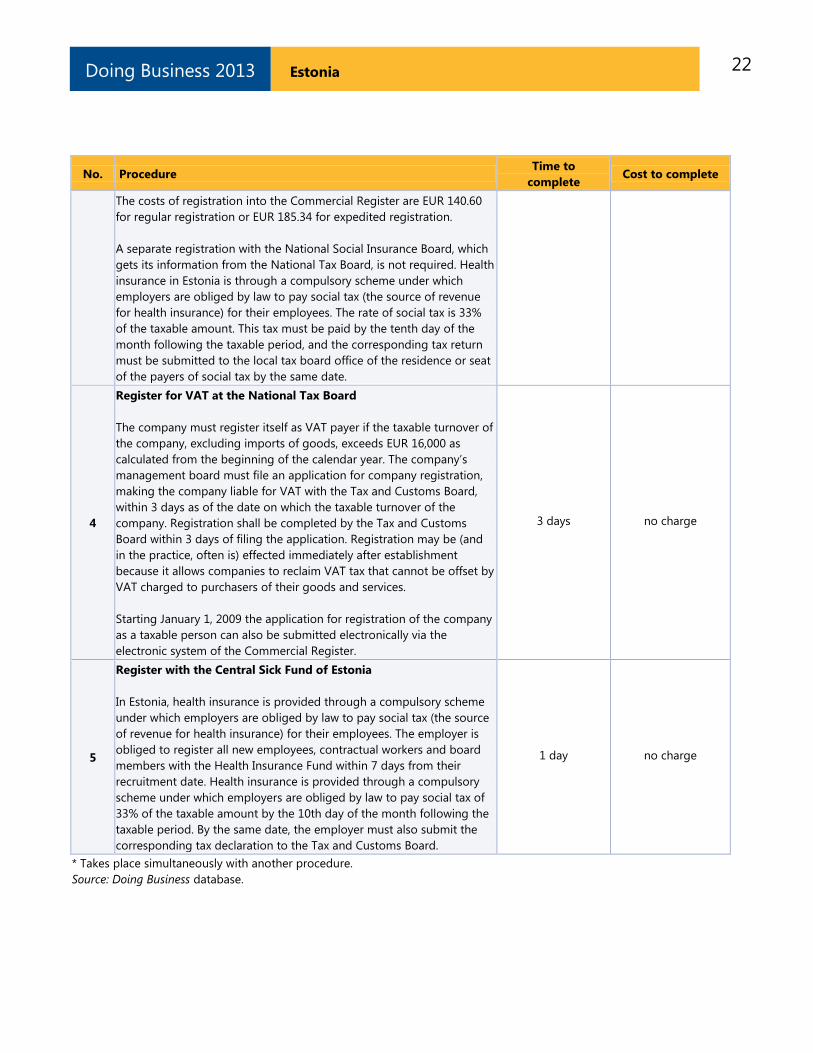
The costs of registration into the Commercial Register are EUR 140.60
for regular registration or EUR 185.34 for expedited registration.
A separate registration with the National Social Insurance Board, which
gets its information from the National Tax Board, is not required. Health
insurance in Estonia is through a compulsory scheme under which
employers are obliged by law to pay social tax (the source of revenue
for health insurance) for their employees. The rate of social tax is 33%
of the taxable amount. This tax must be paid by the tenth day of the
month following the taxable period, and the corresponding tax return
must be submitted to the local tax board office of the residence or seat
of the payers of social tax by the same date.
4
Register for VAT at the National Tax Board
The company must register itself as VAT payer if the taxable turnover of
the company, excluding imports of goods, exceeds EUR 16,000 as
calculated from the beginning of the calendar year. The company‘s
management board must file an application for company registration,
making the company liable for VAT with the Tax and Customs Board,
within 3 days as of the date on which the taxable turnover of the
company. Registration shall be completed by the Tax and Customs
Board within 3 days of filing the application. Registration may be (and
in the practice, often is) effected immediately after establishment
because it allows companies to reclaim VAT tax that cannot be offset by
VAT charged to purchasers of their goods and services.
Starting January 1, 2009 the application for registration of the company
as a taxable person can also be submitted electronically via the
electronic system of the Commercial Register.
3 days no charge
5
Register with the Central Sick Fund of Estonia
In Estonia, health insurance is provided through a compulsory scheme
under which employers are obliged by law to pay social tax (the source
of revenue for health insurance) for their employees. The employer is
obliged to register all new employees, contractual workers and board
members with the Health Insurance Fund within 7 days from their
recruitment date. Health insurance is provided through a compulsory
scheme under which employers are obliged by law to pay social tax of
33% of the taxable amount by the 10th day of the month following the
taxable period. By the same date, the employer must also submit the
corresponding tax declaration to the Tax and Customs Board.
1 day no charge
* Takes place simultaneously with another procedure.
Source: Doing Business database.
23 Estonia Doing Business 2013
DEALING WITH CONSTRUCTION PERMITS
Regulation of construction is critical to protect the
public. But it needs to be efficient, to avoid
excessive constraints on a sector that plays an
important part in every economy. Where complying
with building regulations is excessively costly in
time and money, many builders opt out. They may
pay bribes to pass inspections or simply build
illegally, leading to hazardous construction that
puts public safety at risk. Where compliance is
simple, straightforward and inexpensive, everyone
is better off.
What do the indicators cover?
Doing Business records the procedures, time and
cost for a business to obtain all the necessary
approvals to build a simple commercial warehouse
in the economy‘s largest business city, connect it to
basic utilities and register the property so that it
can be used as collateral or transferred to another
entity.
The ranking on the ease of dealing with
construction permits is the simple average of the
percentile rankings on its component indicators:
procedures, time and cost.
To make the data comparable across economies,
Doing Business uses several assumptions about the
business and the warehouse, including the utility
connections.
The business:
Is a limited liability company operating in
the construction business and located in
the largest business city.
Is domestically owned and operated.
Has 60 builders and other employees.
The warehouse:
Is a new construction (there was no
previous construction on the land).
Has complete architectural and technical
plans prepared by a licensed architect.
WHAT THE DEALING WITH CONSTRUCTION
PERMITS INDICATORS MEASURE
Procedures to legally build a warehouse
(number)
Submitting all relevant documents and
obtaining all necessary clearances, licenses,
permits and certificates
Completing all required notifications and
receiving all necessary inspections
Obtaining utility connections for water,
sewerage and a fixed telephone line
Registering the warehouse after its
completion (if required for use as collateral or
for transfer of the warehouse)
Time required to complete each procedure
(calendar days)
Does not include time spent gathering
information
Each procedure starts on a separate day
Procedure completed once final document is
received
No prior contact with officials
Cost required to complete each procedure (%
of income per capita)
Official costs only, no bribes
Will be connected to water, sewerage
(sewage system, septic tank or their
equivalent) and a fixed telephone line. The
connection to each utility network will be 10
meters (32 feet, 10 inches) long.
Will be used for general storage, such as of
books or stationery (not for goods requiring
special conditions).
Will take 30 weeks to construct (excluding all
delays due to administrative and regulatory
requirements).
24 Estonia Doing Business 2013
DEALING WITH CONSTRUCTION PERMITS
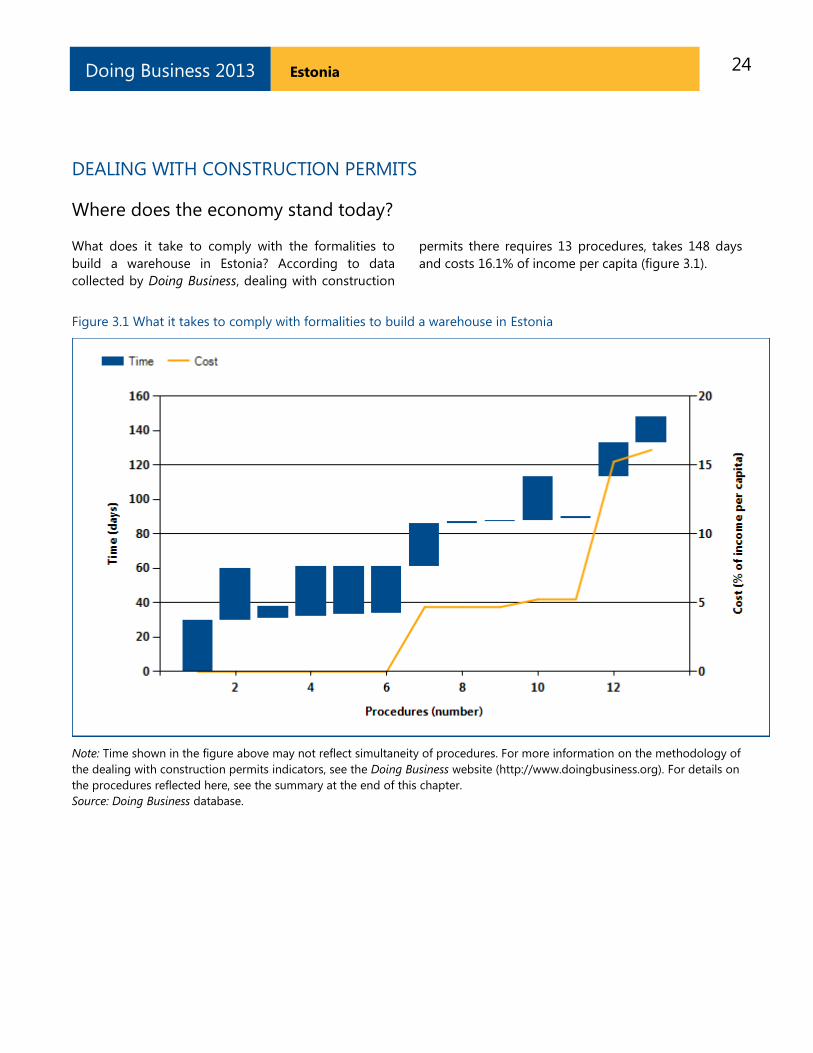
Where does the economy stand today?
What does it take to comply with the formalities to
build a warehouse in Estonia? According to data
collected by Doing Business, dealing with construction
permits there requires 13 procedures, takes 148 days
and costs 16.1% of income per capita (figure 3.1).
Figure 3.1 What it takes to comply with formalities to build a warehouse in Estonia
Note: Time shown in the figure above may not reflect simultaneity of procedures. For more information on the methodology of
the dealing with construction permits indicators, see the Doing Business website (http://www.doingbusiness.org). For details on
the procedures reflected here, see the summary at the end of this chapter.
Source: Doing Business database.
25 Estonia Doing Business 2013
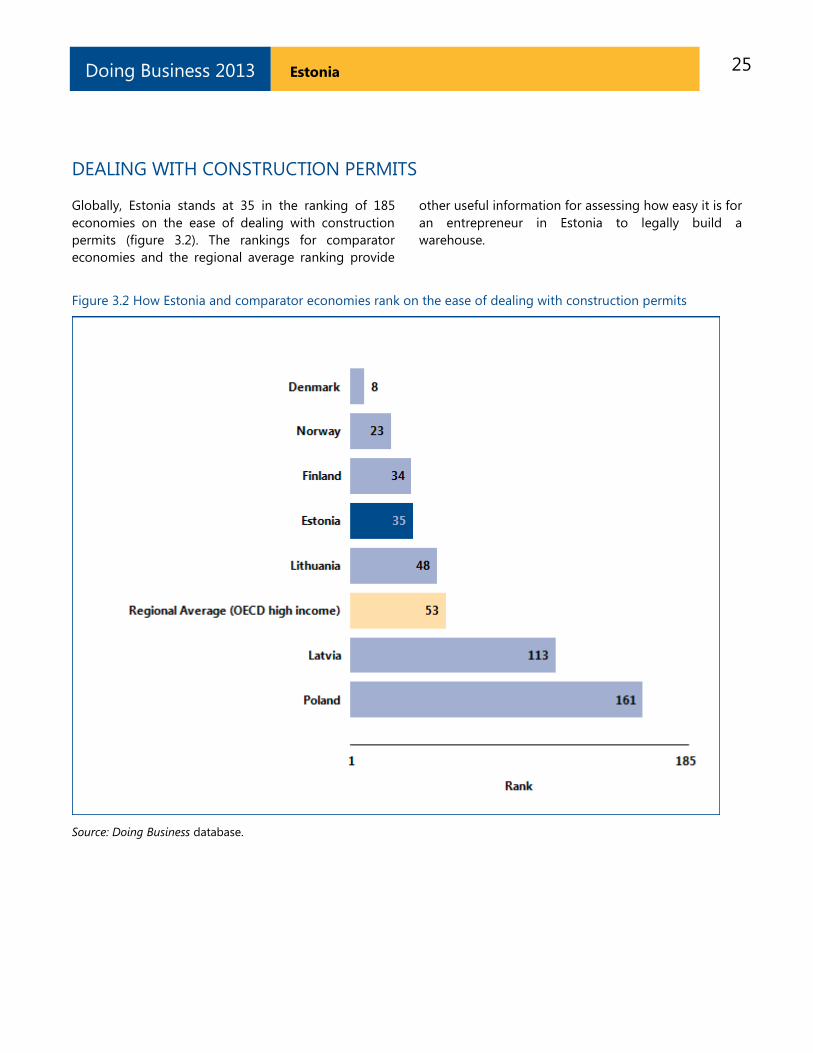
DEALING WITH CONSTRUCTION PERMITS
Globally, Estonia stands at 35 in the ranking of 185
economies on the ease of dealing with construction
permits (figure 3.2). The rankings for comparator
economies and the regional average ranking provide
other useful information for assessing how easy it is for
an entrepreneur in Estonia to legally build a
warehouse.
Figure 3.2 How Estonia and comparator economies rank on the ease of dealing with construction permits
Source: Doing Business database.
26 Estonia Doing Business 2013
DEALING WITH CONSTRUCTION PERMITS
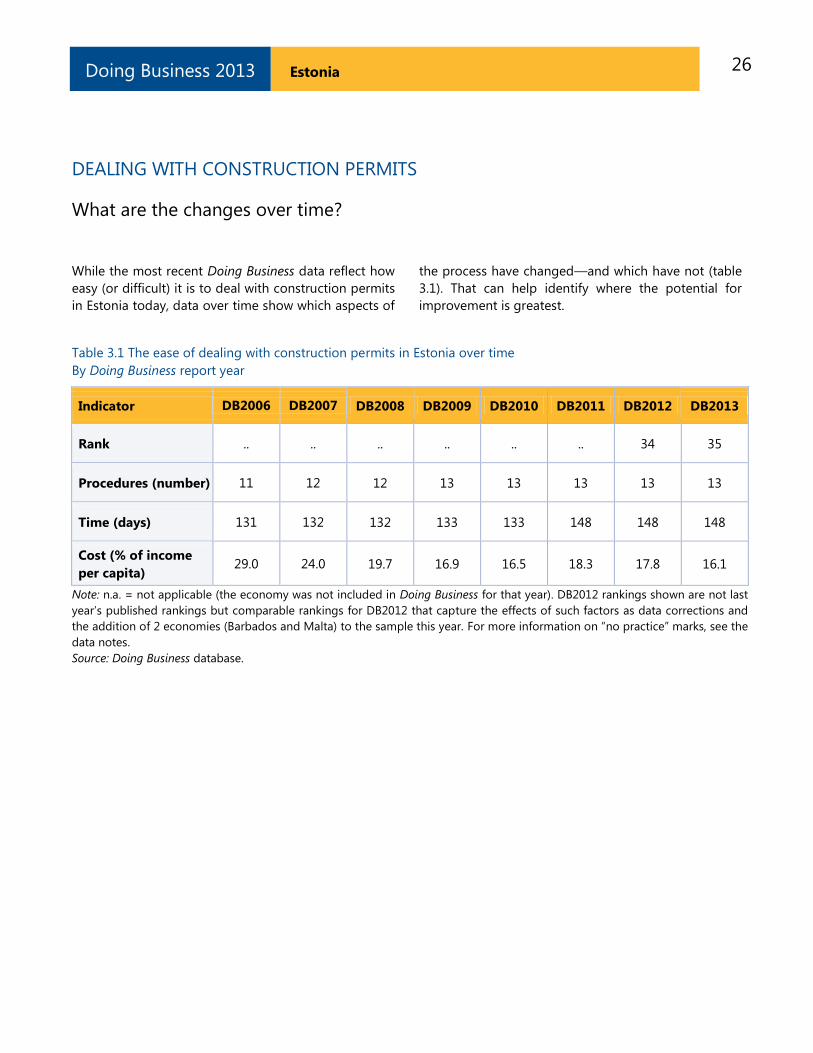
What are the changes over time?
While the most recent Doing Business data reflect how
easy (or difficult) it is to deal with construction permits
in Estonia today, data over time show which aspects of
the process have changed—and which have not (table
3.1). That can help identify where the potential for
improvement is greatest.
Table 3.1 The ease of dealing with construction permits in Estonia over time
By Doing Business report year
Indicator DB2006 DB2007 DB2008 DB2009 DB2010 DB2011 DB2012 DB2013
Rank .. .. .. .. .. .. 34 35
Procedures (number) 11 12 12 13 13 13 13 13
Time (days) 131 132 132 133 133 148 148 148
Cost (% of income
per capita) 29.0 24.0 19.7 16.9 16.5 18.3 17.8 16.1
Note: n.a. = not applicable (the economy was not included in Doing Business for that year). DB2012 rankings shown are not last
year‘s published rankings but comparable rankings for DB2012 that capture the effects of such factors as data corrections and
the addition of 2 economies (Barbados and Malta) to the sample this year. For more information on ―no practice‖ marks, see the
data notes.
Source: Doing Business database.
27 Estonia Doing Business 2013
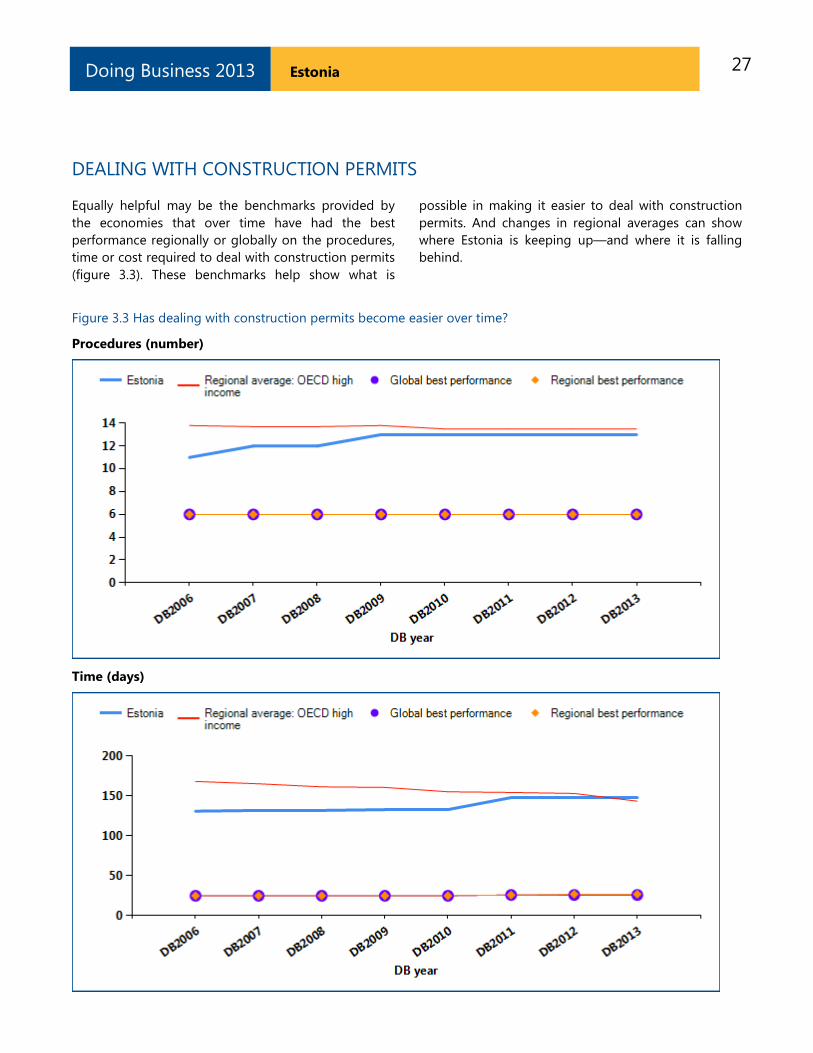
DEALING WITH CONSTRUCTION PERMITS
Equally helpful may be the benchmarks provided by
the economies that over time have had the best
performance regionally or globally on the procedures,
time or cost required to deal with construction permits
(figure 3.3). These benchmarks help show what is
possible in making it easier to deal with construction
permits. And changes in regional averages can show
where Estonia is keeping up—and where it is falling
behind.
Figure 3.3 Has dealing with construction permits become easier over time?
Procedures (number)
Time (days)
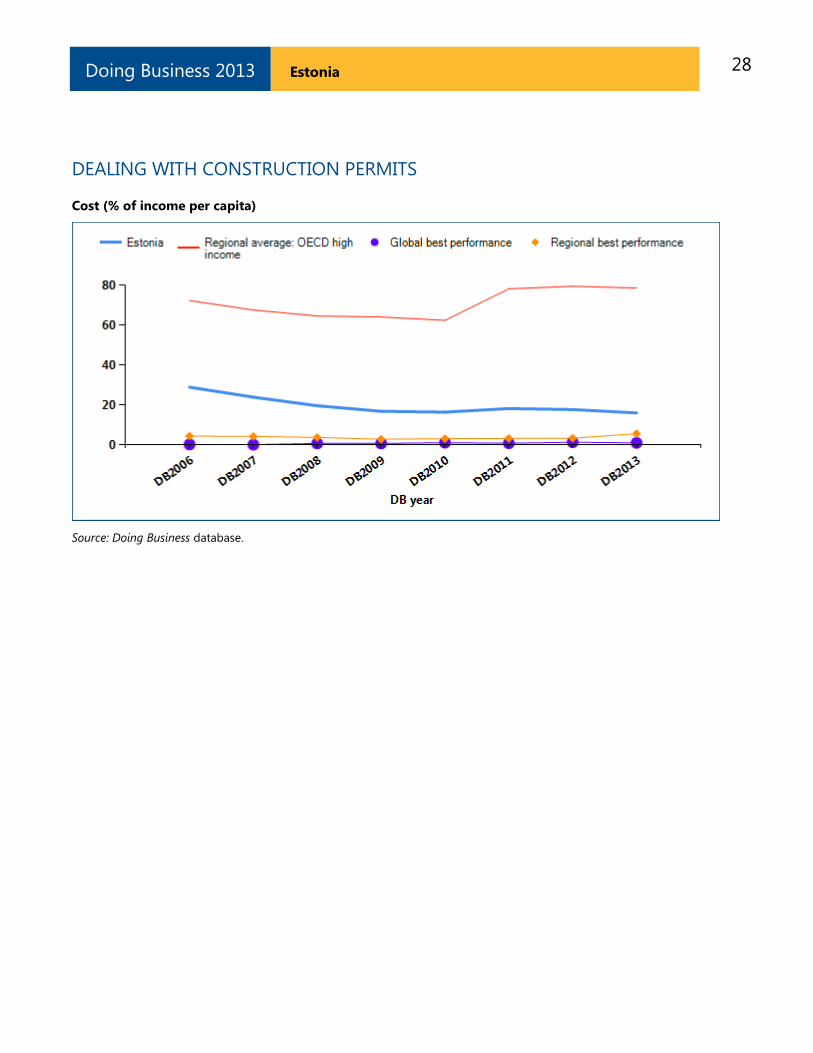
28 Estonia Doing Business 2013
DEALING WITH CONSTRUCTION PERMITS
Cost (% of income per capita)
Source: Doing Business database.
29 Estonia Doing Business 2013
DEALING WITH CONSTRUCTION PERMITS
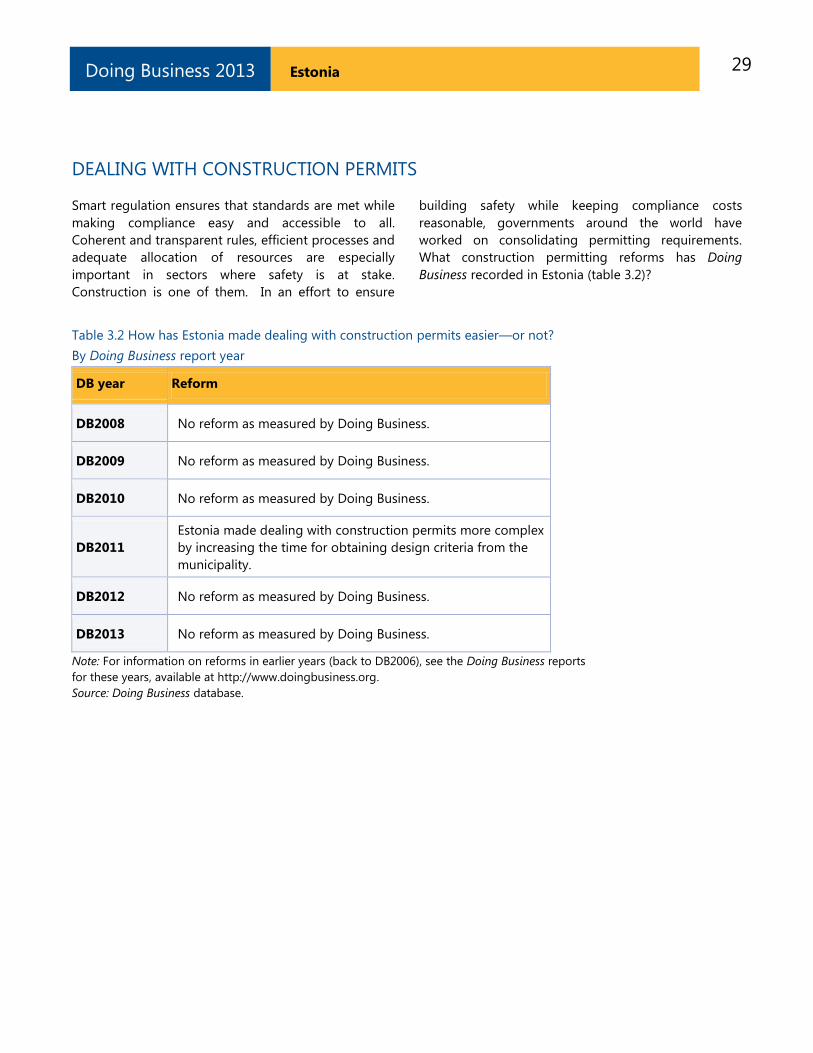
Smart regulation ensures that standards are met while
making compliance easy and accessible to all.
Coherent and transparent rules, efficient processes and
adequate allocation of resources are especially
important in sectors where safety is at stake.
Construction is one of them. In an effort to ensure
building safety while keeping compliance costs
reasonable, governments around the world have
worked on consolidating permitting requirements.
What construction permitting reforms has Doing
Business recorded in Estonia (table 3.2)?
Table 3.2 How has Estonia made dealing with construction permits easier—or not?
By Doing Business report year
DB year Reform
DB2008 No reform as measured by Doing Business.
DB2009 No reform as measured by Doing Business.
DB2010 No reform as measured by Doing Business.
DB2011
Estonia made dealing with construction permits more complex
by increasing the time for obtaining design criteria from the
municipality.
DB2012 No reform as measured by Doing Business.
DB2013 No reform as measured by Doing Business.
Note: For information on reforms in earlier years (back to DB2006), see the Doing Business reports
for these years, available at http://www.doingbusiness.org.
Source: Doing Business database.
30 Estonia Doing Business 2013
DEALING WITH CONSTRUCTION PERMITS
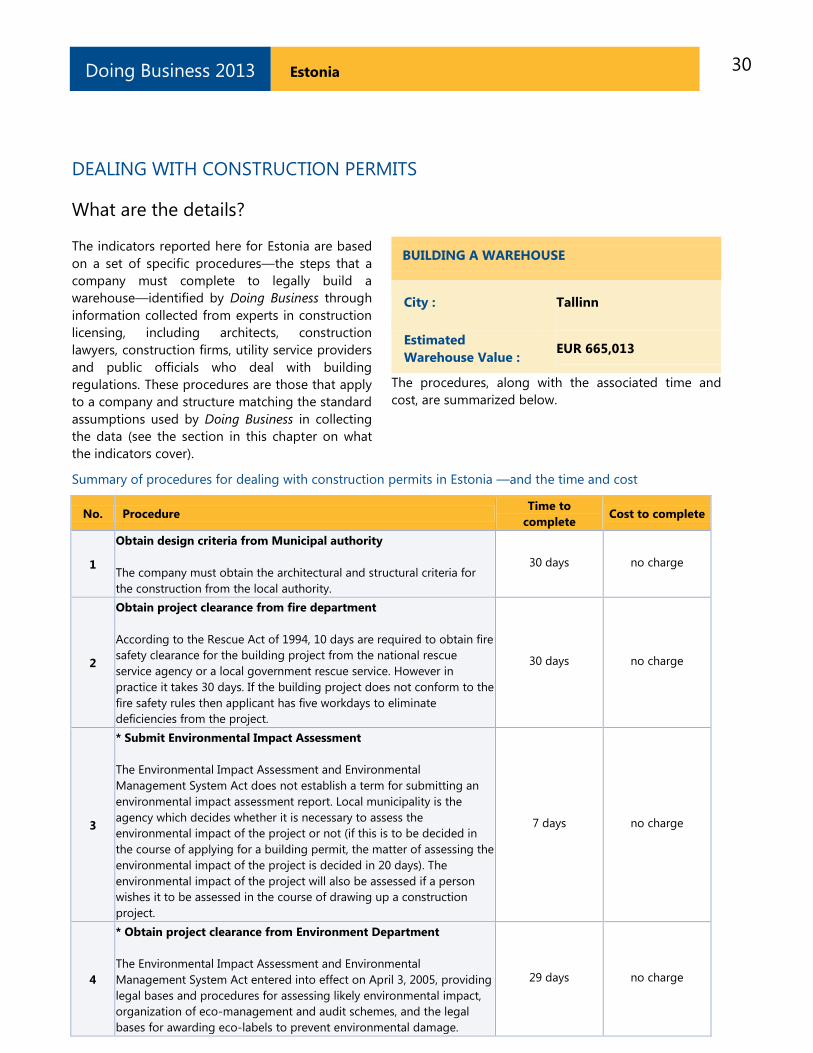
What are the details?
The indicators reported here for Estonia are based
on a set of specific procedures—the steps that a
company must complete to legally build a
warehouse—identified by Doing Business through
information collected from experts in construction
licensing, including architects, construction
lawyers, construction firms, utility service providers
and public officials who deal with building
regulations. These procedures are those that apply
to a company and structure matching the standard
assumptions used by Doing Business in collecting
the data (see the section in this chapter on what
the indicators cover).
BUILDING A WAREHOUSE
City : Tallinn
Estimated
Warehouse Value : EUR 665,013
The procedures, along with the associated time and
cost, are summarized below.
Summary of procedures for dealing with construction permits in Estonia —and the time and cost
No. Procedure Time to
complete Cost to complete
1
Obtain design criteria from Municipal authority
The company must obtain the architectural and structural criteria for
the construction from the local authority.
30 days no charge
2
Obtain project clearance from fire department
According to the Rescue Act of 1994, 10 days are required to obtain fire
safety clearance for the building project from the national rescue
service agency or a local government rescue service. However in
practice it takes 30 days. If the building project does not conform to the
fire safety rules then applicant has five workdays to eliminate
deficiencies from the project.
30 days no charge
3
* Submit Environmental Impact Assessment
The Environmental Impact Assessment and Environmental
Management System Act does not establish a term for submitting an
environmental impact assessment report. Local municipality is the
agency which decides whether it is necessary to assess the
environmental impact of the project or not (if this is to be decided in
the course of applying for a building permit, the matter of assessing the
environmental impact of the project is decided in 20 days). The
environmental impact of the project will also be assessed if a person
wishes it to be assessed in the course of drawing up a construction
project.
7 days no charge
4
* Obtain project clearance from Environment Department
The Environmental Impact Assessment and Environmental
Management System Act entered into effect on April 3, 2005, providing
legal bases and procedures for assessing likely environmental impact,
organization of eco-management and audit schemes, and the legal
bases for awarding eco-labels to prevent environmental damage.
29 days no charge
31 Estonia Doing Business 2013
No. Procedure Time to
complete Cost to complete
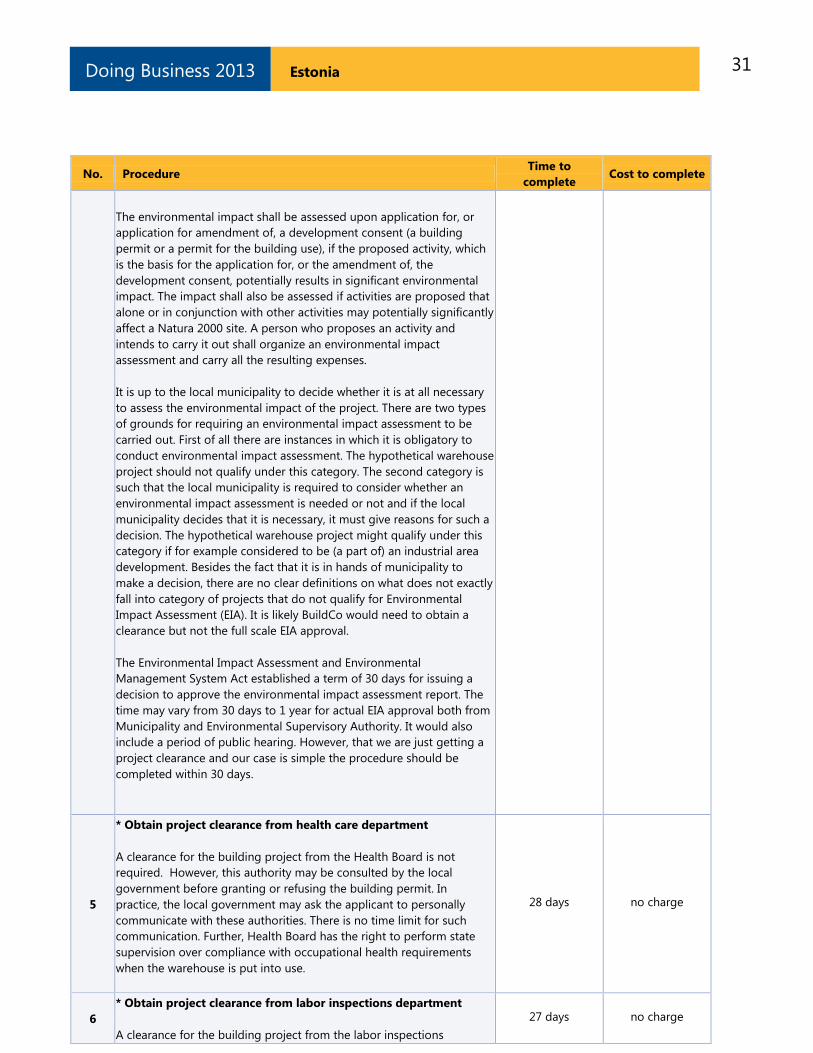
The environmental impact shall be assessed upon application for, or
application for amendment of, a development consent (a building
permit or a permit for the building use), if the proposed activity, which
is the basis for the application for, or the amendment of, the
development consent, potentially results in significant environmental
impact. The impact shall also be assessed if activities are proposed that
alone or in conjunction with other activities may potentially significantly
affect a Natura 2000 site. A person who proposes an activity and
intends to carry it out shall organize an environmental impact
assessment and carry all the resulting expenses.
It is up to the local municipality to decide whether it is at all necessary
to assess the environmental impact of the project. There are two types
of grounds for requiring an environmental impact assessment to be
carried out. First of all there are instances in which it is obligatory to
conduct environmental impact assessment. The hypothetical warehouse
project should not qualify under this category. The second category is
such that the local municipality is required to consider whether an
environmental impact assessment is needed or not and if the local
municipality decides that it is necessary, it must give reasons for such a
decision. The hypothetical warehouse project might qualify under this
category if for example considered to be (a part of) an industrial area
development. Besides the fact that it is in hands of municipality to
make a decision, there are no clear definitions on what does not exactly
fall into category of projects that do not qualify for Environmental
Impact Assessment (EIA). It is likely BuildCo would need to obtain a
clearance but not the full scale EIA approval.
The Environmental Impact Assessment and Environmental
Management System Act established a term of 30 days for issuing a
decision to approve the environmental impact assessment report. The
time may vary from 30 days to 1 year for actual EIA approval both from
Municipality and Environmental Supervisory Authority. It would also
include a period of public hearing. However, that we are just getting a
project clearance and our case is simple the procedure should be
completed within 30 days.
5
* Obtain project clearance from health care department
A clearance for the building project from the Health Board is not
required. However, this authority may be consulted by the local
government before granting or refusing the building permit. In
practice, the local government may ask the applicant to personally
communicate with these authorities. There is no time limit for such
communication. Further, Health Board has the right to perform state
supervision over compliance with occupational health requirements
when the warehouse is put into use.
28 days no charge
6
* Obtain project clearance from labor inspections department
A clearance for the building project from the labor inspections
27 days no charge
32 Estonia Doing Business 2013
No. Procedure Time to
complete Cost to complete
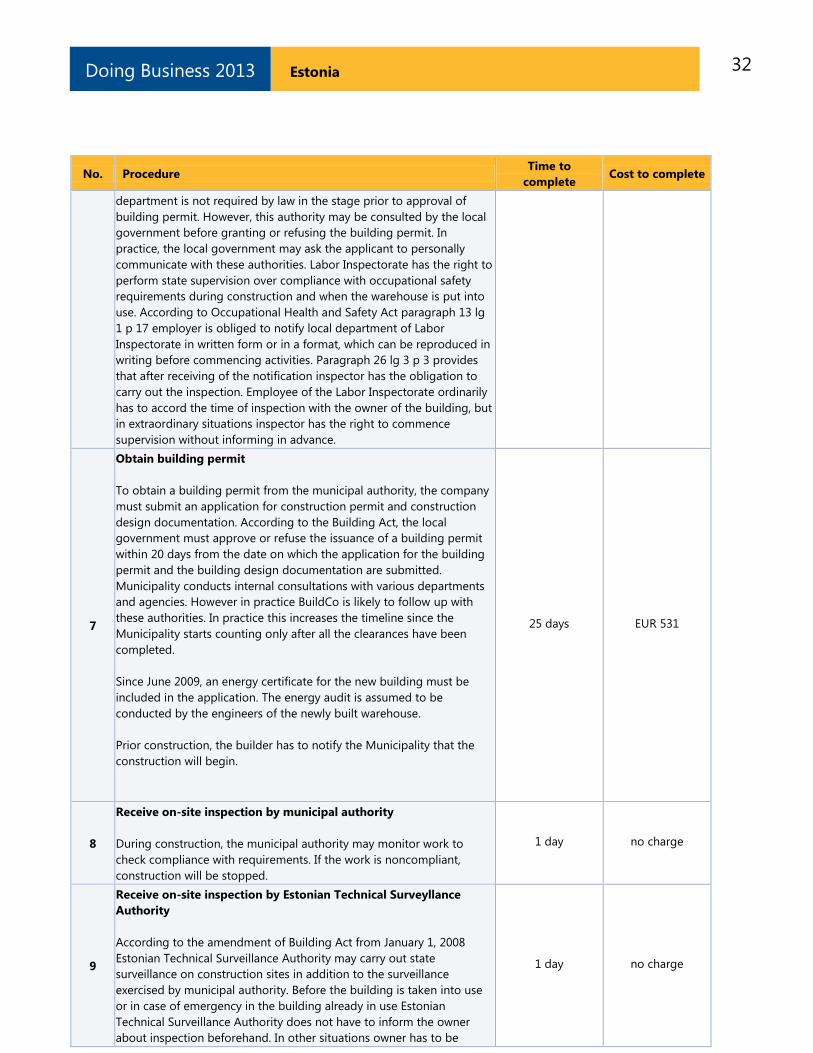
department is not required by law in the stage prior to approval of
building permit. However, this authority may be consulted by the local
government before granting or refusing the building permit. In
practice, the local government may ask the applicant to personally
communicate with these authorities. Labor Inspectorate has the right to
perform state supervision over compliance with occupational safety
requirements during construction and when the warehouse is put into
use. According to Occupational Health and Safety Act paragraph 13 lg
1 p 17 employer is obliged to notify local department of Labor
Inspectorate in written form or in a format, which can be reproduced in
writing before commencing activities. Paragraph 26 lg 3 p 3 provides
that after receiving of the notification inspector has the obligation to
carry out the inspection. Employee of the Labor Inspectorate ordinarily
has to accord the time of inspection with the owner of the building, but
in extraordinary situations inspector has the right to commence
supervision without informing in advance.
7
Obtain building permit
To obtain a building permit from the municipal authority, the company
must submit an application for construction permit and construction
design documentation. According to the Building Act, the local
government must approve or refuse the issuance of a building permit
within 20 days from the date on which the application for the building
permit and the building design documentation are submitted.
Municipality conducts internal consultations with various departments
and agencies. However in practice BuildCo is likely to follow up with
these authorities. In practice this increases the timeline since the
Municipality starts counting only after all the clearances have been
completed.
Since June 2009, an energy certificate for the new building must be
included in the application. The energy audit is assumed to be
conducted by the engineers of the newly built warehouse.
Prior construction, the builder has to notify the Municipality that the
construction will begin.
25 days EUR 531
8
Receive on-site inspection by municipal authority
During construction, the municipal authority may monitor work to
check compliance with requirements. If the work is noncompliant,
construction will be stopped.
1 day no charge
9
Receive on-site inspection by Estonian Technical Surveyllance
Authority
According to the amendment of Building Act from January 1, 2008
Estonian Technical Surveillance Authority may carry out state
surveillance on construction sites in addition to the surveillance
exercised by municipal authority. Before the building is taken into use
or in case of emergency in the building already in use Estonian
Technical Surveillance Authority does not have to inform the owner
about inspection beforehand. In other situations owner has to be
1 day no charge
33 Estonia Doing Business 2013
No. Procedure Time to
complete Cost to complete
notified at least 24 hours in advance.
The number of inspections is not limited by law -- it is in the discretion
of the Technical Surveillance Authority, however it should comply with
the principles of good administration practices. The costs of the
evaluation services, of the expert assessment of building design
documentation and of the evaluation of construction works ordered to
verify conformity to the requirements are borne by the Technical
Surveillance Authority. If it is established that the construction works or
building design documentation does not conform to the requirements
established thereof the owner of the construction works has
compensate the Technical Surveillance Authority for the costs of the
evaluation services ordered to verify conformity to the requirements,
including the costs of expert assessment or evaluation.
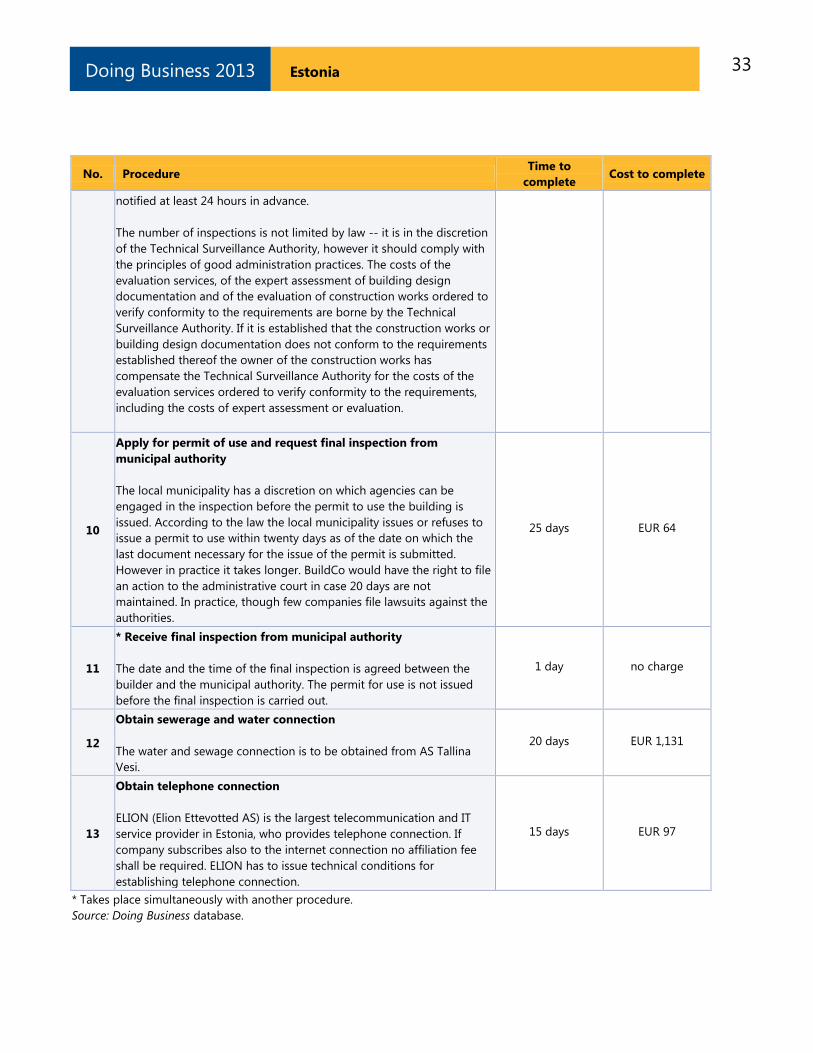
10
Apply for permit of use and request final inspection from
municipal authority
The local municipality has a discretion on which agencies can be
engaged in the inspection before the permit to use the building is
issued. According to the law the local municipality issues or refuses to
issue a permit to use within twenty days as of the date on which the
last document necessary for the issue of the permit is submitted.
However in practice it takes longer. BuildCo would have the right to file
an action to the administrative court in case 20 days are not
maintained. In practice, though few companies file lawsuits against the
authorities.
25 days EUR 64
11
* Receive final inspection from municipal authority
The date and the time of the final inspection is agreed between the
builder and the municipal authority. The permit for use is not issued
before the final inspection is carried out.
1 day no charge
12
Obtain sewerage and water connection
The water and sewage connection is to be obtained from AS Tallina
Vesi.
20 days EUR 1,131
13
Obtain telephone connection
ELION (Elion Ettevotted AS) is the largest telecommunication and IT
service provider in Estonia, who provides telephone connection. If
company subscribes also to the internet connection no affiliation fee
shall be required. ELION has to issue technical conditions for
establishing telephone connection.
15 days EUR 97
* Takes place simultaneously with another procedure.
Source: Doing Business database.
34 Estonia Doing Business 2013
GETTING ELECTRICITY
Access to reliable and affordable electricity is vital
for businesses. To counter weak electricity supply,
many firms in developing economies have to rely
on self-supply, often at a prohibitively high cost.
Whether electricity is reliably available or not, the
first step for a customer is always to gain access by
obtaining a connection.
What do the indicators cover?
Doing Business records all procedures required for
a local business to obtain a permanent electricity
connection and supply for a standardized
warehouse, as well as the time and cost to
complete them. These procedures include
applications and contracts with electricity utilities,
clearances from other agencies and the external
and final connection works. The ranking on the
ease of getting electricity is the simple average of
the percentile rankings on its component
indicators: procedures, time and cost. To make the
data comparable across economies, several
assumptions are used.
The warehouse:
Is located in the economy‘s largest
business city, in an area where other
warehouses are located.
Is not in a special economic zone where
the connection would be eligible for
subsidization or faster service.
Has road access. The connection works
involve the crossing of a road or roads but
are carried out on public land.
Is a new construction being connected to
electricity for the first time.
Has 2 stories, both above ground, with a
total surface of about 1,300.6 square
meters (14,000 square feet), and is built on
a plot of 929 square meters (10,000 square
feet).
The electricity connection:
Is a 3-phase, 4-wire Y, 140-kilovolt-ampere
(kVA) (subscribed capacity) connection.
WHAT THE GETTING ELECTRICITY
INDICATORS MEASURE
Procedures to obtain an electricity
connection (number)
Submitting all relevant documents and
obtaining all necessary clearances and permits
Completing all required notifications and
receiving all necessary inspections
Obtaining external installation works and
possibly purchasing material for these works
Concluding any necessary supply contract and
obtaining final supply
Time required to complete each procedure
(calendar days)
Is at least 1 calendar day
Each procedure starts on a separate day
Does not include time spent gathering
information
Reflects the time spent in practice, with little
follow-up and no prior contact with officials
Cost required to complete each procedure
(% of income per capita)
Official costs only, no bribes
Excludes value added tax
Is 150 meters long.
Is to either the low-voltage or the medium-
voltage distribution network and either overhead
or underground, whichever is more common in
the economy and in the area where the
warehouse is located. The length of any
connection in the customer‘s private domain is
negligible.
Involves installing one electricity meter. The
monthly electricity consumption will be 0.07
gigawatt-hour (GWh). The internal electrical
wiring has been completed.
35 Estonia Doing Business 2013
GETTING ELECTRICITY
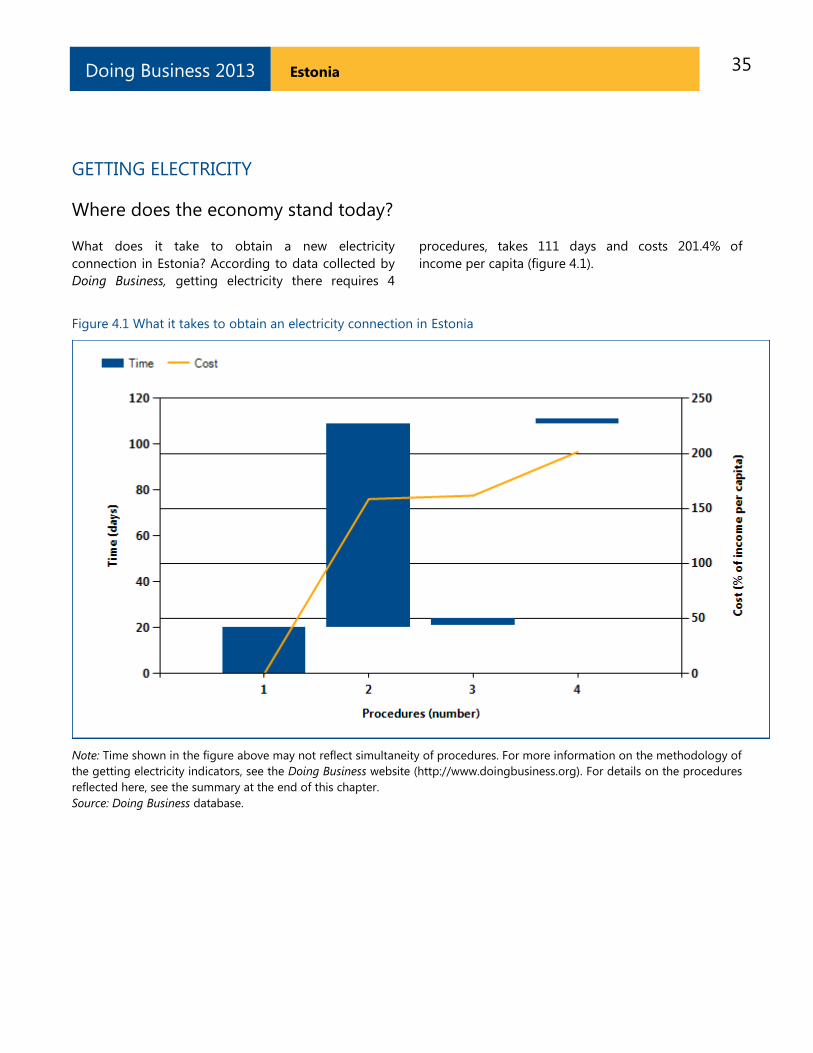
Where does the economy stand today?
What does it take to obtain a new electricity
connection in Estonia? According to data collected by
Doing Business, getting electricity there requires 4
procedures, takes 111 days and costs 201.4% of
income per capita (figure 4.1).
Figure 4.1 What it takes to obtain an electricity connection in Estonia
Note: Time shown in the figure above may not reflect simultaneity of procedures. For more information on the methodology of
the getting electricity indicators, see the Doing Business website (http://www.doingbusiness.org). For details on the procedures
reflected here, see the summary at the end of this chapter.
Source: Doing Business database.
36 Estonia Doing Business 2013
GETTING ELECTRICITY
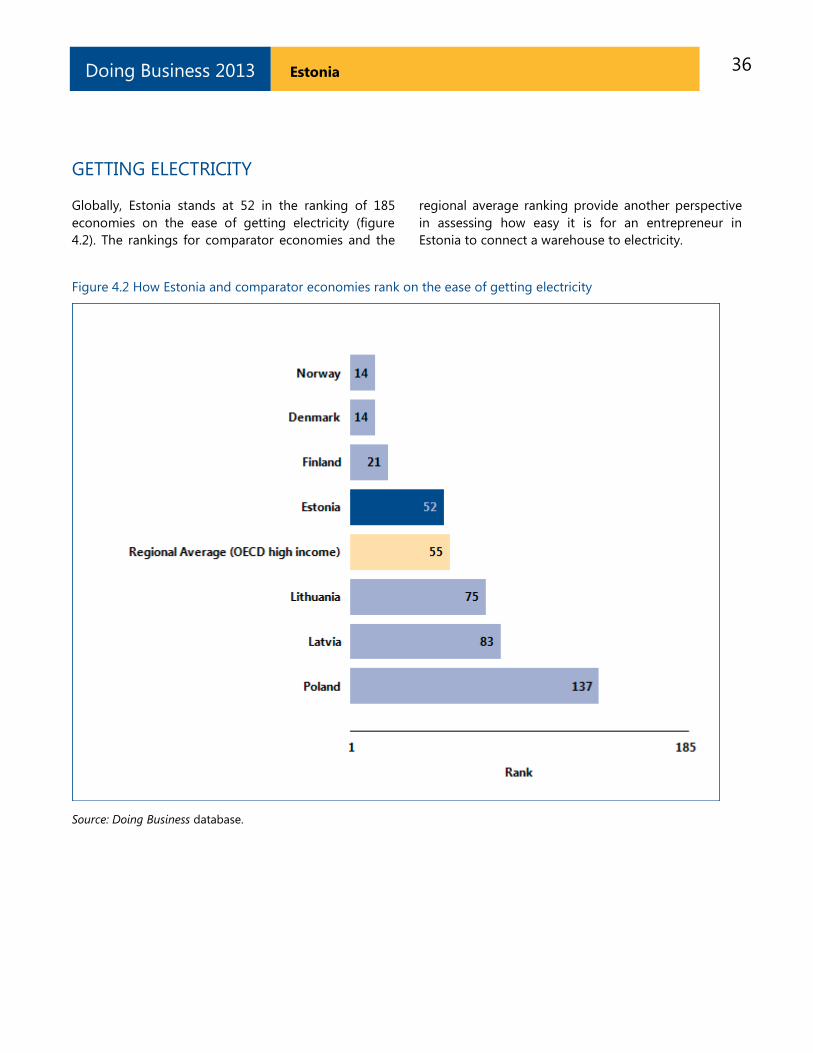
Globally, Estonia stands at 52 in the ranking of 185
economies on the ease of getting electricity (figure
4.2). The rankings for comparator economies and the
regional average ranking provide another perspective
in assessing how easy it is for an entrepreneur in
Estonia to connect a warehouse to electricity.
Figure 4.2 How Estonia and comparator economies rank on the ease of getting electricity
Source: Doing Business database.
37 Estonia Doing Business 2013
GETTING ELECTRICITY
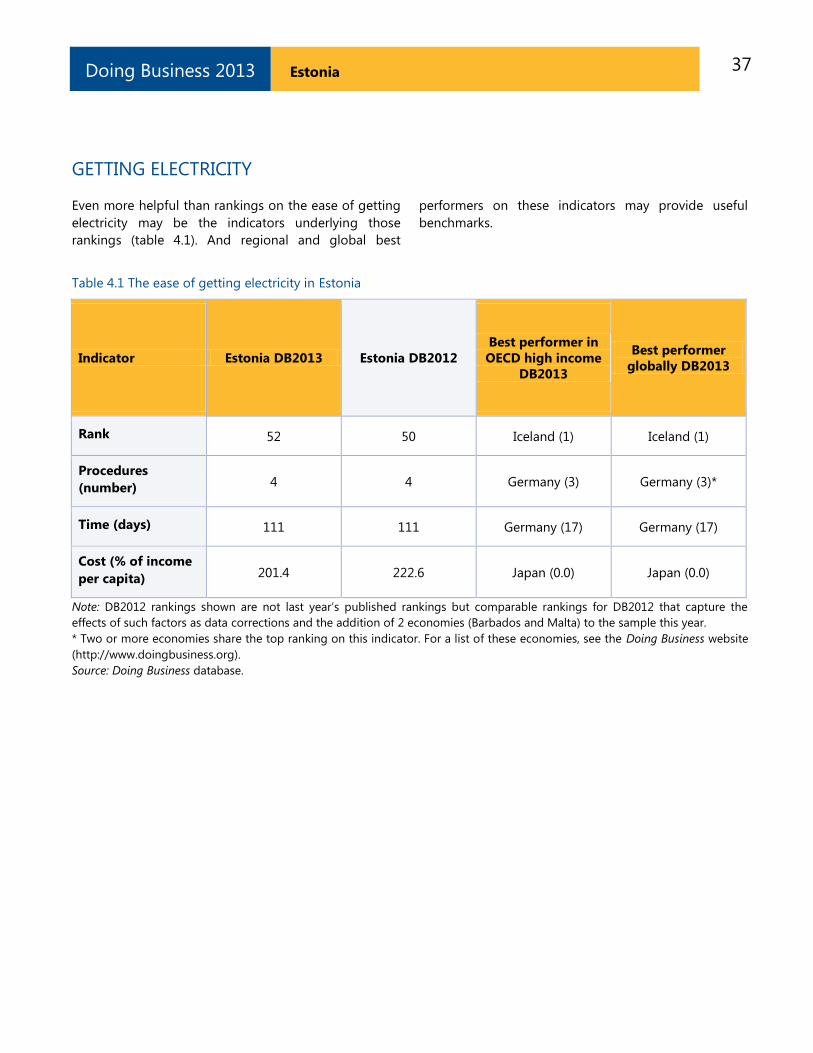
Even more helpful than rankings on the ease of getting
electricity may be the indicators underlying those
rankings (table 4.1). And regional and global best
performers on these indicators may provide useful
benchmarks.
Table 4.1 The ease of getting electricity in Estonia
Indicator Estonia DB2013 Estonia DB2012
Best performer in
OECD high income
DB2013
Best performer
globally DB2013
Rank 52 50 Iceland (1) Iceland (1)
Procedures
(number) 4 4 Germany (3) Germany (3)*
Time (days) 111 111 Germany (17) Germany (17)
Cost (% of income
per capita) 201.4 222.6 Japan (0.0) Japan (0.0)
Note: DB2012 rankings shown are not last year‘s published rankings but comparable rankings for DB2012 that capture the
effects of such factors as data corrections and the addition of 2 economies (Barbados and Malta) to the sample this year.
* Two or more economies share the top ranking on this indicator. For a list of these economies, see the Doing Business website
(http://www.doingbusiness.org).
Source: Doing Business database.
38 Estonia Doing Business 2013
GETTING ELECTRICITY
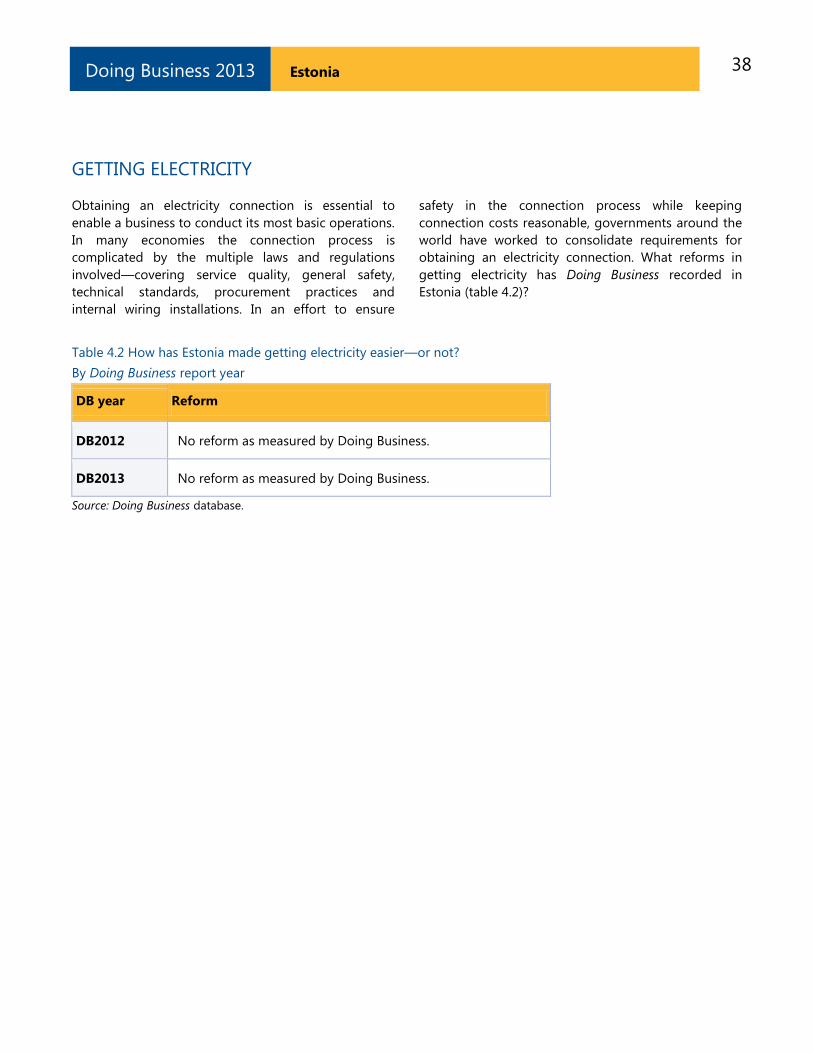
Obtaining an electricity connection is essential to
enable a business to conduct its most basic operations.
In many economies the connection process is
complicated by the multiple laws and regulations
involved—covering service quality, general safety,
technical standards, procurement practices and
internal wiring installations. In an effort to ensure
safety in the connection process while keeping
connection costs reasonable, governments around the
world have worked to consolidate requirements for
obtaining an electricity connection. What reforms in
getting electricity has Doing Business recorded in
Estonia (table 4.2)?
Table 4.2 How has Estonia made getting electricity easier—or not?
By Doing Business report year
DB year Reform
DB2012 No reform as measured by Doing Business.
DB2013 No reform as measured by Doing Business.
Source: Doing Business database.
39 Estonia Doing Business 2013
GETTING ELECTRICITY
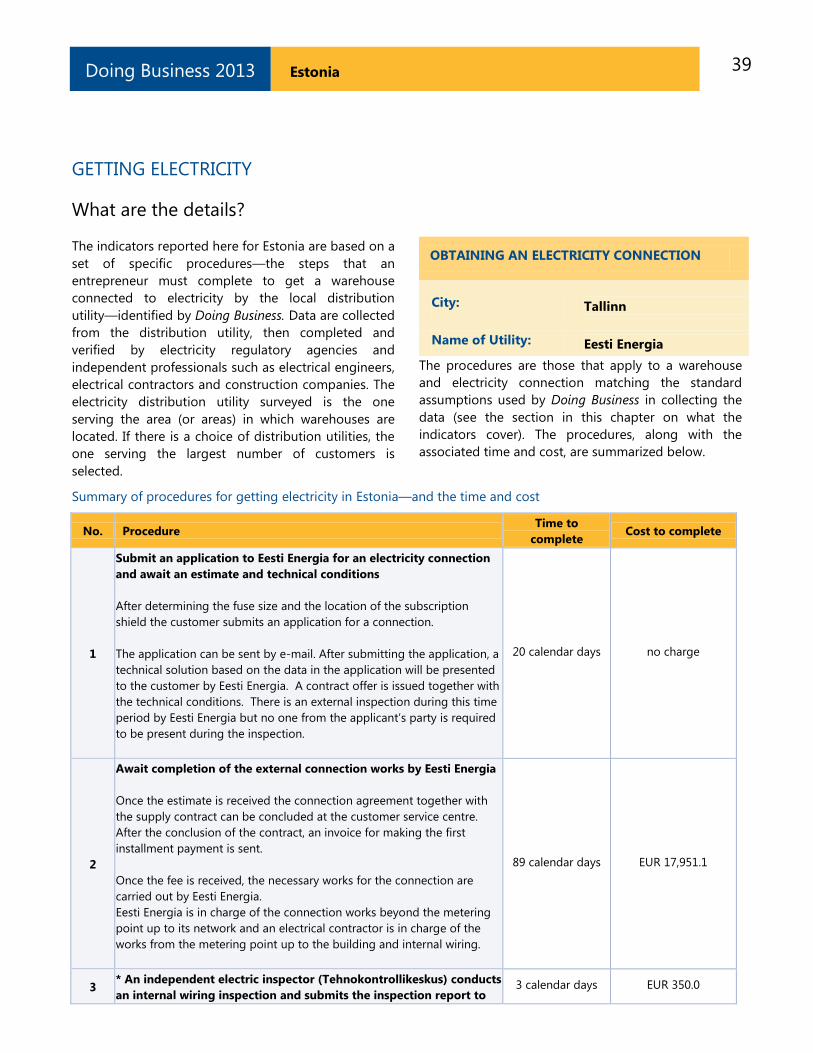
What are the details?
The indicators reported here for Estonia are based on a
set of specific procedures—the steps that an
entrepreneur must complete to get a warehouse
connected to electricity by the local distribution
utility—identified by Doing Business. Data are collected
from the distribution utility, then completed and
verified by electricity regulatory agencies and
independent professionals such as electrical engineers,
electrical contractors and construction companies. The
electricity distribution utility surveyed is the one
serving the area (or areas) in which warehouses are
located. If there is a choice of distribution utilities, the
one serving the largest number of customers is
selected.
OBTAINING AN ELECTRICITY CONNECTION
City: Tallinn
Name of Utility: Eesti Energia
The procedures are those that apply to a warehouse
and electricity connection matching the standard
assumptions used by Doing Business in collecting the
data (see the section in this chapter on what the
indicators cover). The procedures, along with the
associated time and cost, are summarized below.
Summary of procedures for getting electricity in Estonia—and the time and cost
No. Procedure Time to
complete Cost to complete
1
Submit an application to Eesti Energia for an electricity connection
and await an estimate and technical conditions
After determining the fuse size and the location of the subscription
shield the customer submits an application for a connection.
The application can be sent by e-mail. After submitting the application, a
technical solution based on the data in the application will be presented
to the customer by Eesti Energia. A contract offer is issued together with
the technical conditions. There is an external inspection during this time
period by Eesti Energia but no one from the applicant‘s party is required
to be present during the inspection.
20 calendar days no charge
2
Await completion of the external connection works by Eesti Energia
Once the estimate is received the connection agreement together with
the supply contract can be concluded at the customer service centre.
After the conclusion of the contract, an invoice for making the first
installment payment is sent.
Once the fee is received, the necessary works for the connection are
carried out by Eesti Energia.
Eesti Energia is in charge of the connection works beyond the metering
point up to its network and an electrical contractor is in charge of the
works from the metering point up to the building and internal wiring.
89 calendar days EUR 17,951.1
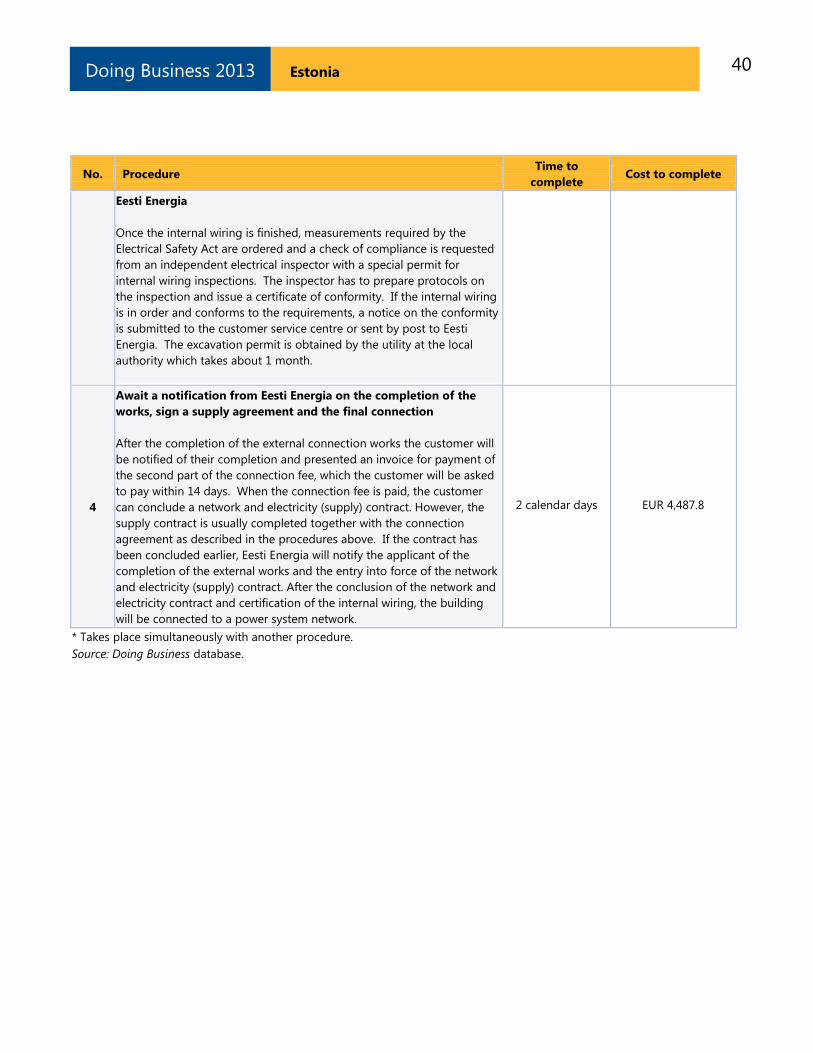
3 * An independent electric inspector (Tehnokontrollikeskus) conducts
an internal wiring inspection and submits the inspection report to 3 calendar days EUR 350.0
40 Estonia Doing Business 2013
No. Procedure Time to
complete Cost to complete
Eesti Energia
Once the internal wiring is finished, measurements required by the
Electrical Safety Act are ordered and a check of compliance is requested
from an independent electrical inspector with a special permit for
internal wiring inspections. The inspector has to prepare protocols on
the inspection and issue a certificate of conformity. If the internal wiring
is in order and conforms to the requirements, a notice on the conformity
is submitted to the customer service centre or sent by post to Eesti
Energia. The excavation permit is obtained by the utility at the local
authority which takes about 1 month.
4
Await a notification from Eesti Energia on the completion of the
works, sign a supply agreement and the final connection
After the completion of the external connection works the customer will
be notified of their completion and presented an invoice for payment of
the second part of the connection fee, which the customer will be asked
to pay within 14 days. When the connection fee is paid, the customer
can conclude a network and electricity (supply) contract. However, the
supply contract is usually completed together with the connection
agreement as described in the procedures above. If the contract has
been concluded earlier, Eesti Energia will notify the applicant of the
completion of the external works and the entry into force of the network
and electricity (supply) contract. After the conclusion of the network and
electricity contract and certification of the internal wiring, the building
will be connected to a power system network.
2 calendar days EUR 4,487.8
* Takes place simultaneously with another procedure.
Source: Doing Business database.
41 Estonia Doing Business 2013
REGISTERING PROPERTY Ensuring formal property rights is fundamental.
Effective administration of land is part of that. If
formal property transfer is too costly or
complicated, formal titles might go informal
again. And where property is informal or poorly
administered, it has little chance of being
accepted as collateral for loans—limiting access to
finance.
What do the indicators cover?
Doing Business records the full sequence of
procedures necessary for a business to purchase
property from another business and transfer the
property title to the buyer‘s name. The transaction
is considered complete when it is opposable to
third parties and when the buyer can use the
property, use it as collateral for a bank loan or
resell it. The ranking on the ease of registering
property is the simple average of the percentile
rankings on its component indicators: procedures,
time and cost.
To make the data comparable across economies,
several assumptions about the parties to the
transaction, the property and the procedures are
used.
The parties (buyer and seller):
Are limited liability companies, 100%
domestically and privately owned.
Are located in the periurban area of the
economy‘s largest business city.
Have 50 employees each, all of whom are
nationals.
Perform general commercial activities.
The property (fully owned by the seller):
Has a value of 50 times income per capita.
The sale price equals the value.
Is registered in the land registry or
cadastre, or both, and is free of title
disputes.
Is located in a periurban commercial zone,
and no rezoning is required.
WHAT THE REGISTERING PROPERTY
INDICATORS MEASURE
Procedures to legally transfer title on
immovable property (number)
Preregistration (for example, checking for liens,
notarizing sales agreement, paying property
transfer taxes)
Registration in the economy‘s largest business
city
Postregistration (for example, filing title with
the municipality)
Time required to complete each procedure
(calendar days)
Does not include time spent gathering
information
Each procedure starts on a separate day
Procedure completed once final document is
received
No prior contact with officials
Cost required to complete each procedure
(% of property value)
Official costs only, no bribes
No value added or capital gains taxes included
Has no mortgages attached and has been
under the same ownership for the past 10
years.
Consists of 557.4 square meters (6,000 square
feet) of land and a 10-year-old, 2-story
warehouse of 929 square meters (10,000
square feet). The warehouse is in good
condition and complies with all safety
standards, building codes and legal
requirements. The property will be transferred
in its entirety.
42 Estonia Doing Business 2013
REGISTERING PROPERTY
Where does the economy stand today?
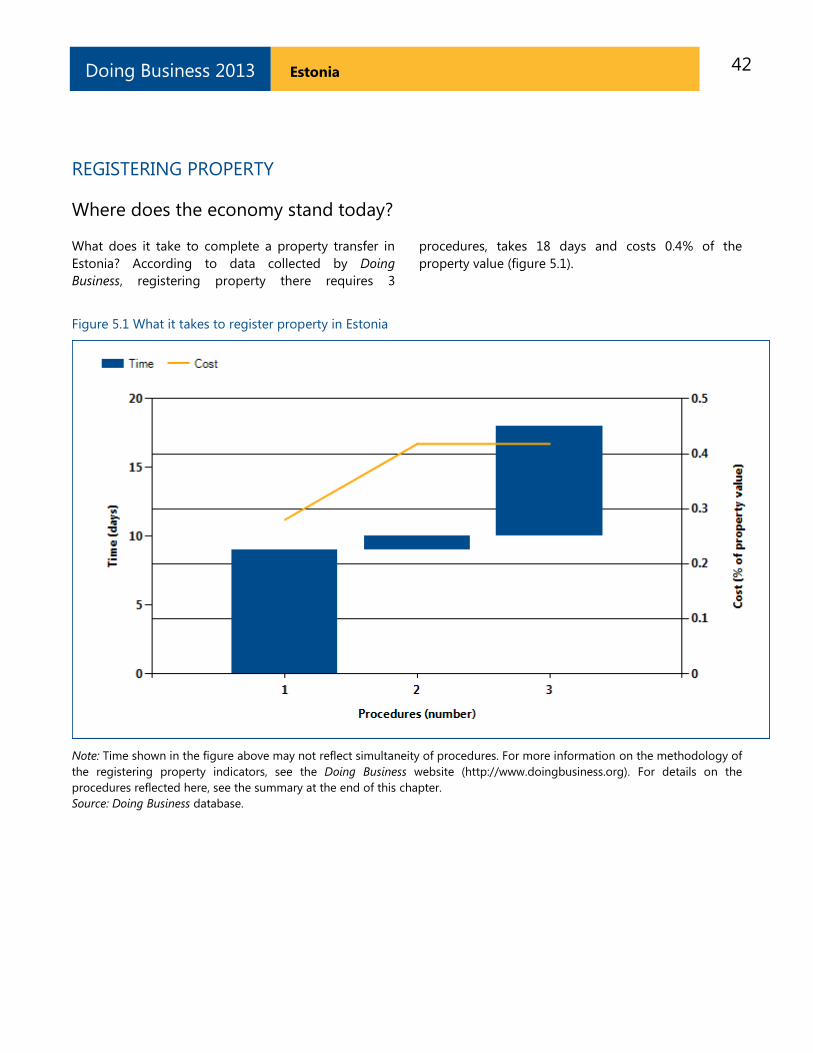
What does it take to complete a property transfer in
Estonia? According to data collected by Doing
Business, registering property there requires 3
procedures, takes 18 days and costs 0.4% of the
property value (figure 5.1).
Figure 5.1 What it takes to register property in Estonia
Note: Time shown in the figure above may not reflect simultaneity of procedures. For more information on the methodology of
the registering property indicators, see the Doing Business website (http://www.doingbusiness.org). For details on the
procedures reflected here, see the summary at the end of this chapter.
Source: Doing Business database.
43 Estonia Doing Business 2013
REGISTERING PROPERTY
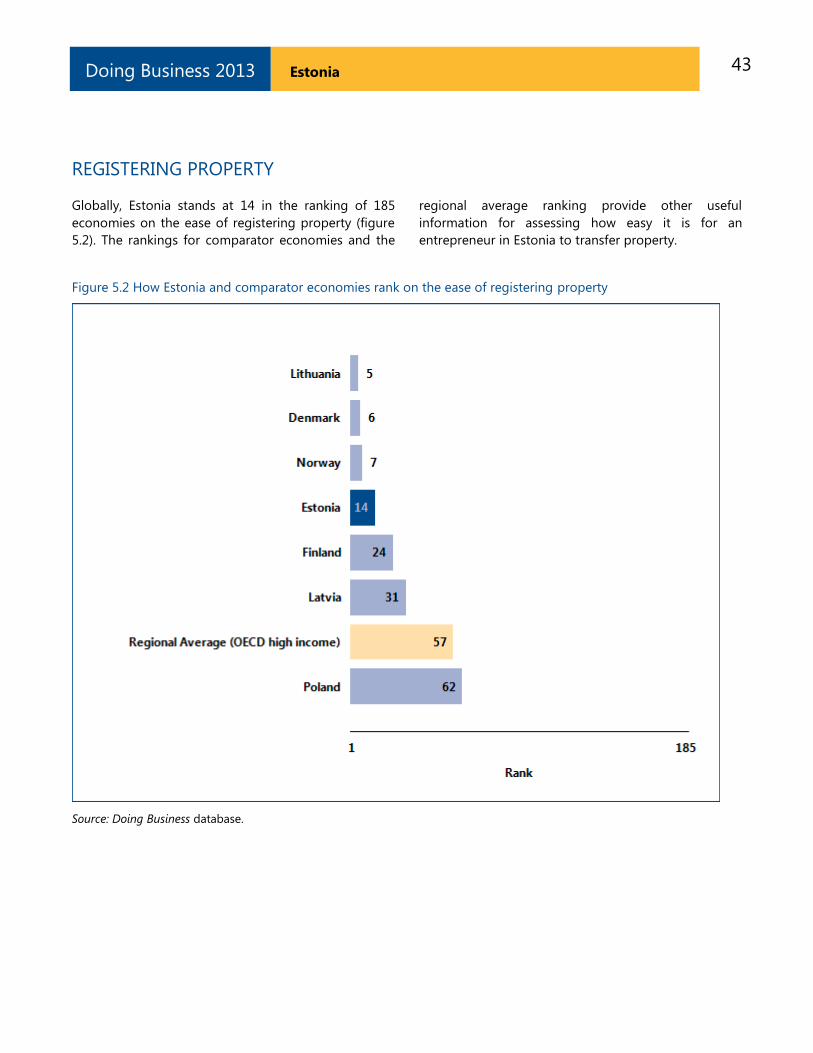
Globally, Estonia stands at 14 in the ranking of 185
economies on the ease of registering property (figure
5.2). The rankings for comparator economies and the
regional average ranking provide other useful
information for assessing how easy it is for an
entrepreneur in Estonia to transfer property.
Figure 5.2 How Estonia and comparator economies rank on the ease of registering property
Source: Doing Business database.
44 Estonia Doing Business 2013
REGISTERING PROPERTY
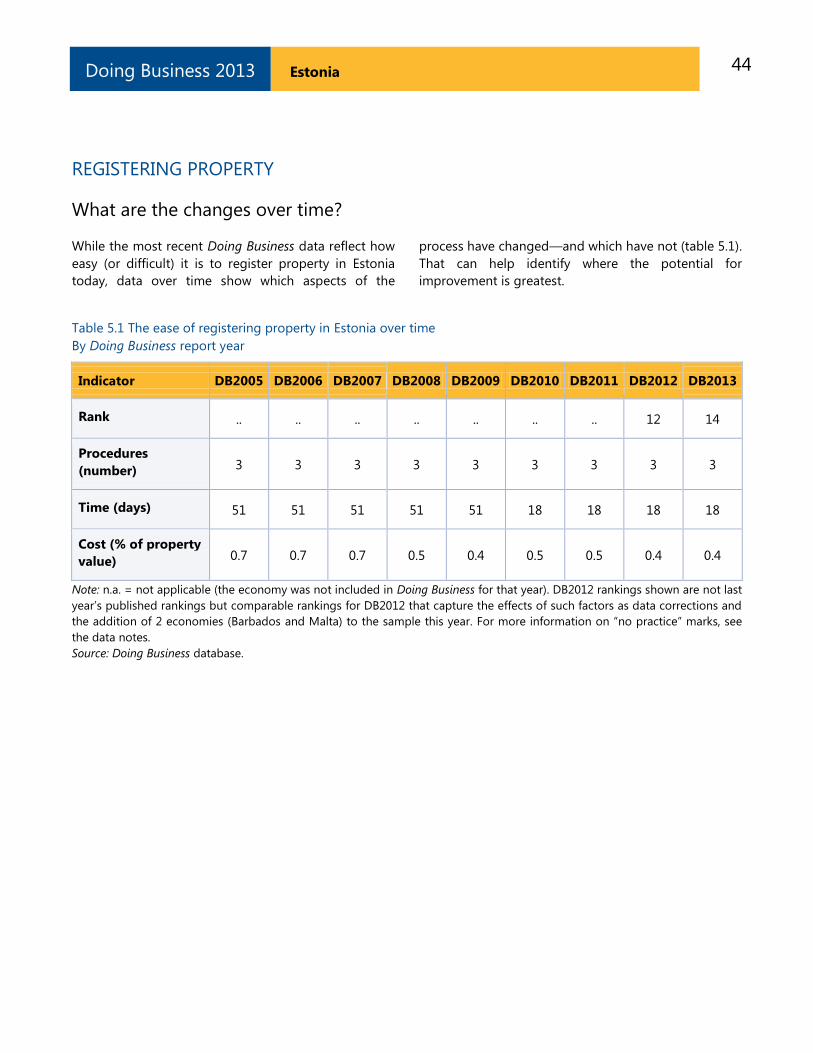
What are the changes over time?
While the most recent Doing Business data reflect how
easy (or difficult) it is to register property in Estonia
today, data over time show which aspects of the
process have changed—and which have not (table 5.1).
That can help identify where the potential for
improvement is greatest.
Table 5.1 The ease of registering property in Estonia over time
By Doing Business report year
Indicator DB2005 DB2006 DB2007 DB2008 DB2009 DB2010 DB2011 DB2012 DB2013
Rank .. .. .. .. .. .. .. 12 14
Procedures
(number) 3 3 3 3 3 3 3 3 3
Time (days) 51 51 51 51 51 18 18 18 18
Cost (% of property
value) 0.7 0.7 0.7 0.5 0.4 0.5 0.5 0.4 0.4
Note: n.a. = not applicable (the economy was not included in Doing Business for that year). DB2012 rankings shown are not last
year‘s published rankings but comparable rankings for DB2012 that capture the effects of such factors as data corrections and
the addition of 2 economies (Barbados and Malta) to the sample this year. For more information on ―no practice‖ marks, see
the data notes.
Source: Doing Business database.
45 Estonia Doing Business 2013
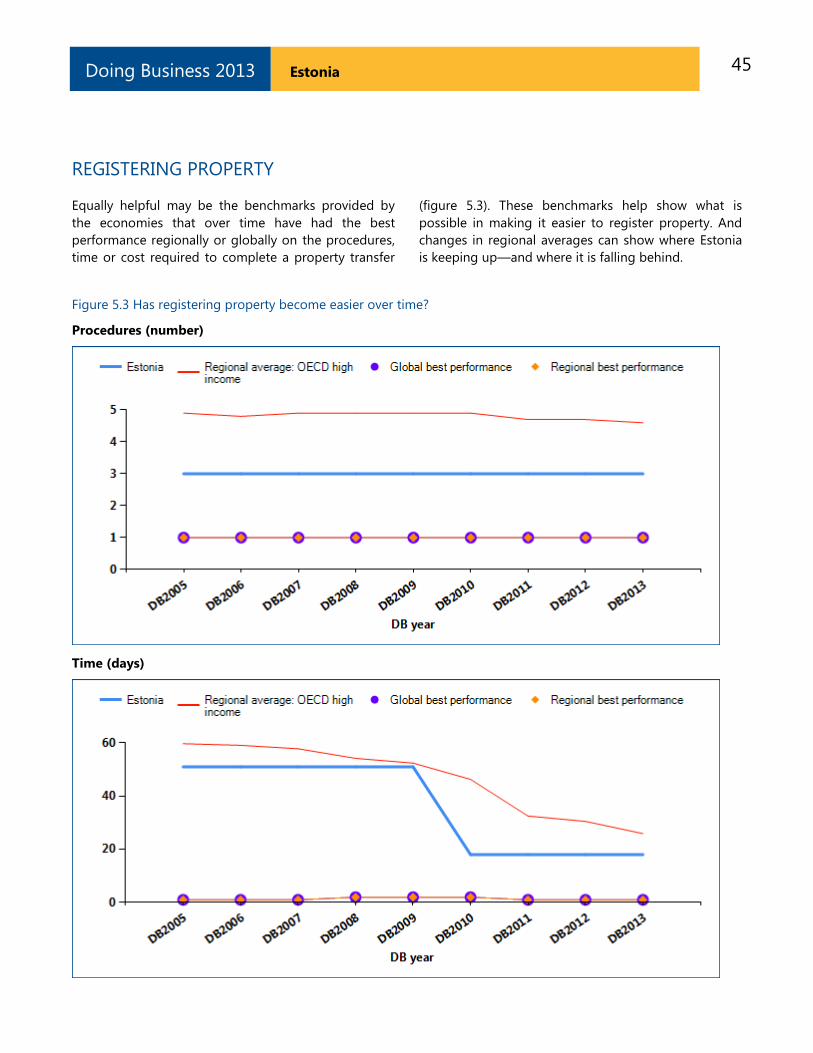
REGISTERING PROPERTY
Equally helpful may be the benchmarks provided by
the economies that over time have had the best
performance regionally or globally on the procedures,
time or cost required to complete a property transfer
(figure 5.3). These benchmarks help show what is
possible in making it easier to register property. And
changes in regional averages can show where Estonia
is keeping up—and where it is falling behind.
Figure 5.3 Has registering property become easier over time?
Procedures (number)
Time (days)
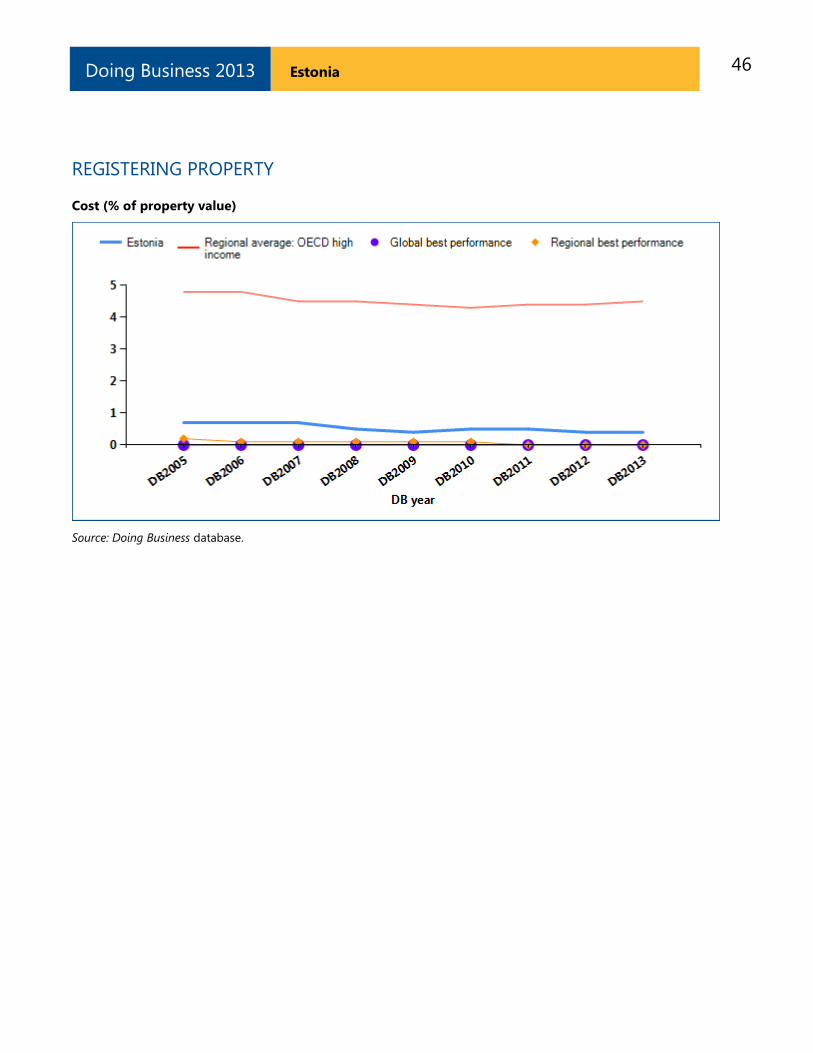
46 Estonia Doing Business 2013
REGISTERING PROPERTY
Cost (% of property value)
Source: Doing Business database.
47 Estonia Doing Business 2013
REGISTERING PROPERTY
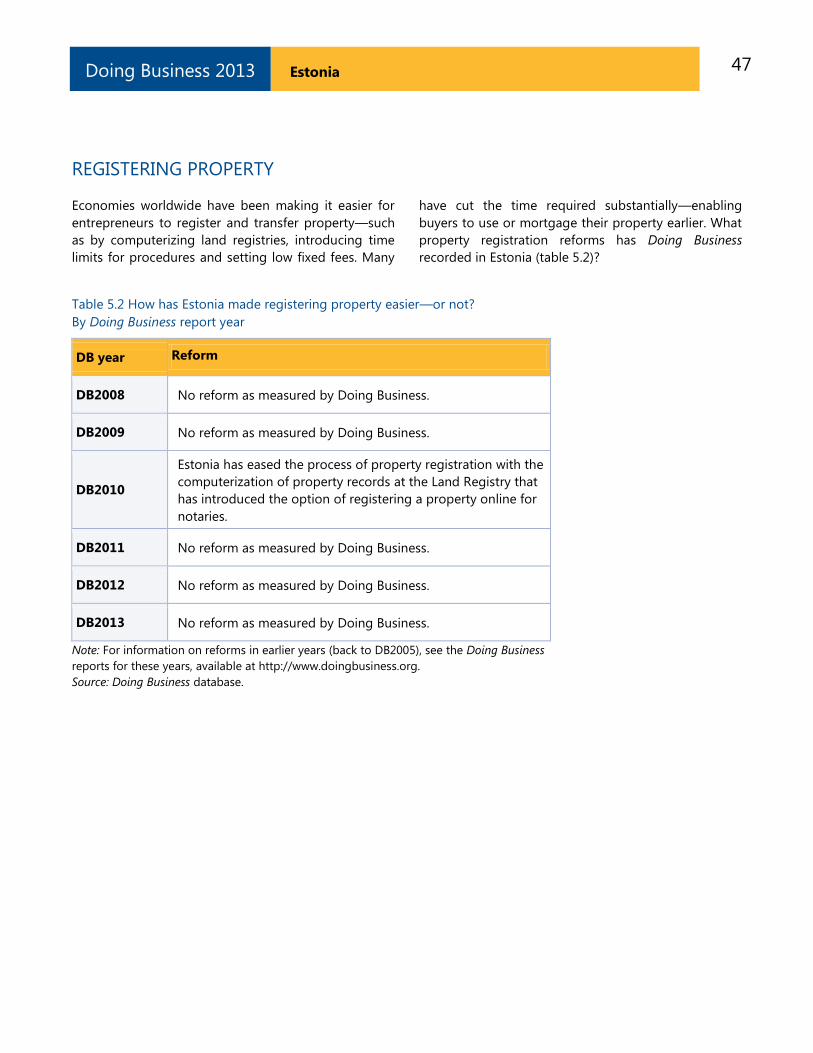
Economies worldwide have been making it easier for
entrepreneurs to register and transfer property—such
as by computerizing land registries, introducing time
limits for procedures and setting low fixed fees. Many
have cut the time required substantially—enabling
buyers to use or mortgage their property earlier. What
property registration reforms has Doing Business
recorded in Estonia (table 5.2)?
Table 5.2 How has Estonia made registering property easier—or not?
By Doing Business report year
DB year Reform
DB2008 No reform as measured by Doing Business.
DB2009 No reform as measured by Doing Business.
DB2010
Estonia has eased the process of property registration with the
computerization of property records at the Land Registry that
has introduced the option of registering a property online for
notaries.
DB2011 No reform as measured by Doing Business.
DB2012 No reform as measured by Doing Business.
DB2013 No reform as measured by Doing Business.
Note: For information on reforms in earlier years (back to DB2005), see the Doing Business
reports for these years, available at http://www.doingbusiness.org.
Source: Doing Business database.
48 Estonia Doing Business 2013
REGISTERING PROPERTY
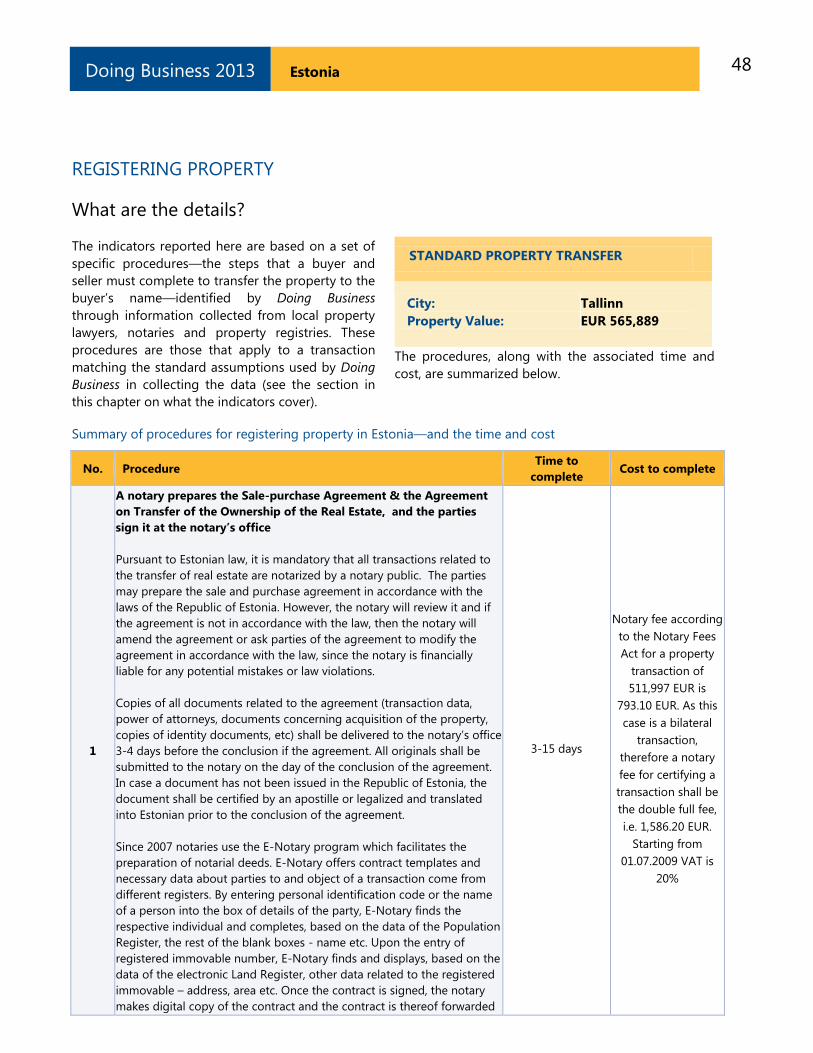
What are the details?
The indicators reported here are based on a set of
specific procedures—the steps that a buyer and
seller must complete to transfer the property to the
buyer‘s name—identified by Doing Business
through information collected from local property
lawyers, notaries and property registries. These
procedures are those that apply to a transaction
matching the standard assumptions used by Doing
Business in collecting the data (see the section in
this chapter on what the indicators cover).
STANDARD PROPERTY TRANSFER
City: Tallinn
Property Value: EUR 565,889
The procedures, along with the associated time and
cost, are summarized below.
Summary of procedures for registering property in Estonia—and the time and cost
No. Procedure Time to
complete Cost to complete
1
A notary prepares the Sale-purchase Agreement & the Agreement
on Transfer of the Ownership of the Real Estate, and the parties
sign it at the notary’s office
Pursuant to Estonian law, it is mandatory that all transactions related to
the transfer of real estate are notarized by a notary public. The parties
may prepare the sale and purchase agreement in accordance with the
laws of the Republic of Estonia. However, the notary will review it and if
the agreement is not in accordance with the law, then the notary will
amend the agreement or ask parties of the agreement to modify the
agreement in accordance with the law, since the notary is financially
liable for any potential mistakes or law violations.
Copies of all documents related to the agreement (transaction data,
power of attorneys, documents concerning acquisition of the property,
copies of identity documents, etc) shall be delivered to the notary‘s office
3-4 days before the conclusion if the agreement. All originals shall be
submitted to the notary on the day of the conclusion of the agreement.
In case a document has not been issued in the Republic of Estonia, the
document shall be certified by an apostille or legalized and translated
into Estonian prior to the conclusion of the agreement.
Since 2007 notaries use the E-Notary program which facilitates the
preparation of notarial deeds. E-Notary offers contract templates and
necessary data about parties to and object of a transaction come from
different registers. By entering personal identification code or the name
of a person into the box of details of the party, E-Notary finds the
respective individual and completes, based on the data of the Population
Register, the rest of the blank boxes - name etc. Upon the entry of
registered immovable number, E-Notary finds and displays, based on the
data of the electronic Land Register, other data related to the registered
immovable – address, area etc. Once the contract is signed, the notary
makes digital copy of the contract and the contract is thereof forwarded
3-15 days
Notary fee according
to the Notary Fees
Act for a property
transaction of
511,997 EUR is
793.10 EUR. As this
case is a bilateral
transaction,
therefore a notary
fee for certifying a
transaction shall be
the double full fee,
i.e. 1,586.20 EUR.
Starting from
01.07.2009 VAT is
20%
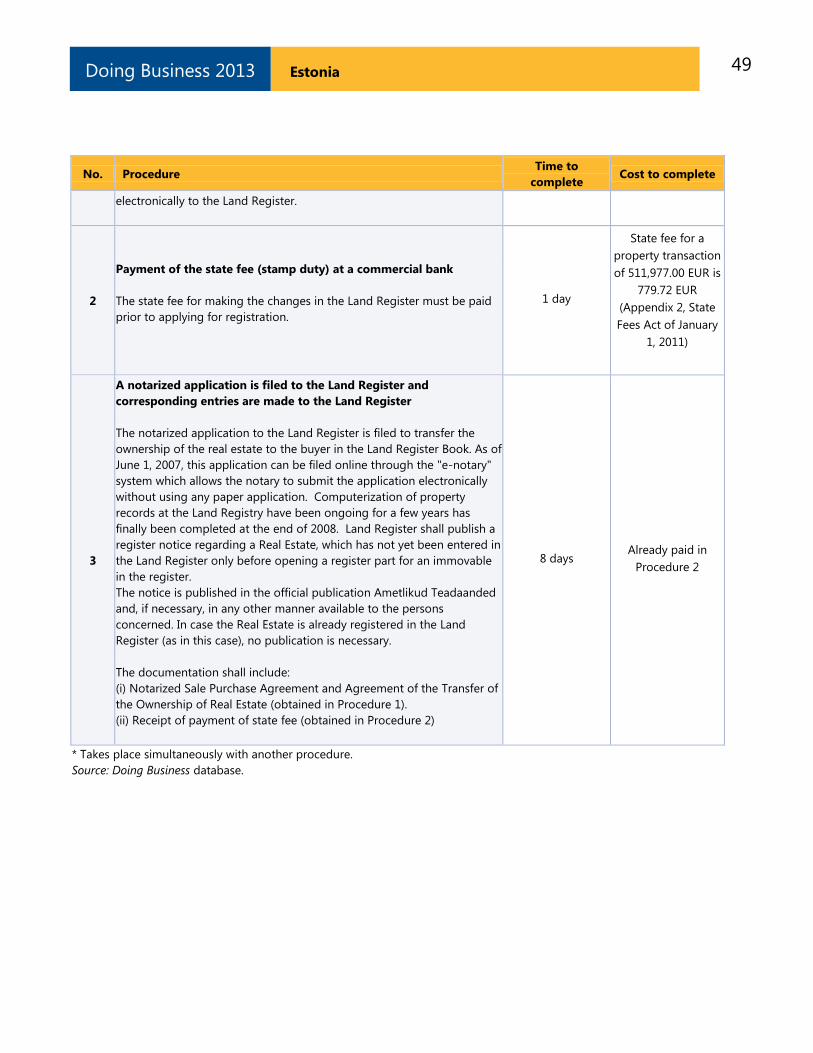
49 Estonia Doing Business 2013
No. Procedure Time to
complete Cost to complete
electronically to the Land Register.
2
Payment of the state fee (stamp duty) at a commercial bank
The state fee for making the changes in the Land Register must be paid
prior to applying for registration.
1 day
State fee for a
property transaction
of 511,977.00 EUR is
779.72 EUR
(Appendix 2, State
Fees Act of January
1, 2011)
3
A notarized application is filed to the Land Register and
corresponding entries are made to the Land Register
The notarized application to the Land Register is filed to transfer the
ownership of the real estate to the buyer in the Land Register Book. As of
June 1, 2007, this application can be filed online through the "e-notary"
system which allows the notary to submit the application electronically
without using any paper application. Computerization of property
records at the Land Registry have been ongoing for a few years has
finally been completed at the end of 2008. Land Register shall publish a
register notice regarding a Real Estate, which has not yet been entered in
the Land Register only before opening a register part for an immovable
in the register.
The notice is published in the official publication Ametlikud Teadaanded
and, if necessary, in any other manner available to the persons
concerned. In case the Real Estate is already registered in the Land
Register (as in this case), no publication is necessary.
The documentation shall include:
(i) Notarized Sale Purchase Agreement and Agreement of the Transfer of
the Ownership of Real Estate (obtained in Procedure 1).
(ii) Receipt of payment of state fee (obtained in Procedure 2)
8 days Already paid in
Procedure 2
* Takes place simultaneously with another procedure.
Source: Doing Business database.
50 Estonia Doing Business 2013
GETTING CREDIT
Two types of frameworks can facilitate access to
credit and improve its allocation: credit information
systems and the legal rights of borrowers and
lenders in collateral and bankruptcy laws. Credit
information systems enable lenders to view a
potential borrower‘s financial history (positive or
negative)—valuable information to consider when
assessing risk. And they permit borrowers to
establish a good credit history that will allow easier
access to credit. Sound collateral laws enable
businesses to use their assets, especially movable
property, as security to generate capital—while
strong creditors‘ rights have been associated with
higher ratios of private sector credit to GDP.
What do the indicators cover?
Doing Business assesses the sharing of credit
information and the legal rights of borrowers and
lenders with respect to secured transactions
through 2 sets of indicators. The depth of credit
information index measures rules and practices
affecting the coverage, scope and accessibility of
credit information available through a public credit
registry or a private credit bureau. The strength of
legal rights index measures whether certain features
that facilitate lending exist within the applicable
collateral and bankruptcy laws. Doing Business uses
case scenarios to determine the scope of the
secured transactions system, involving a secured
borrower and a secured lender and examining legal
restrictions on the use of movable collateral. These
scenarios assume that the borrower:
Is a private, limited liability company.
Has its headquarters and only base of
operations in the largest business city.
WHAT THE GETTING CREDIT INDICATORS
MEASURE
Strength of legal rights index (0–10)
Protection of rights of borrowers and lenders
through collateral laws
Protection of secured creditors‘ rights through
bankruptcy laws
Depth of credit information index (0–6)
Scope and accessibility of credit information
distributed by public credit registries and
private credit bureaus
Public credit registry coverage (% of adults)
Number of individuals and firms listed in
public credit registry as percentage of adult
population
Private credit bureau coverage (% of adults)
Number of individuals and firms listed in
largest private credit bureau as percentage of
adult population
Has 100 employees.
Is 100% domestically owned, as is the lender.
The ranking on the ease of getting credit is based on
the percentile rankings on the sum of its component
indicators: the depth of credit information index and
the strength of legal rights index.
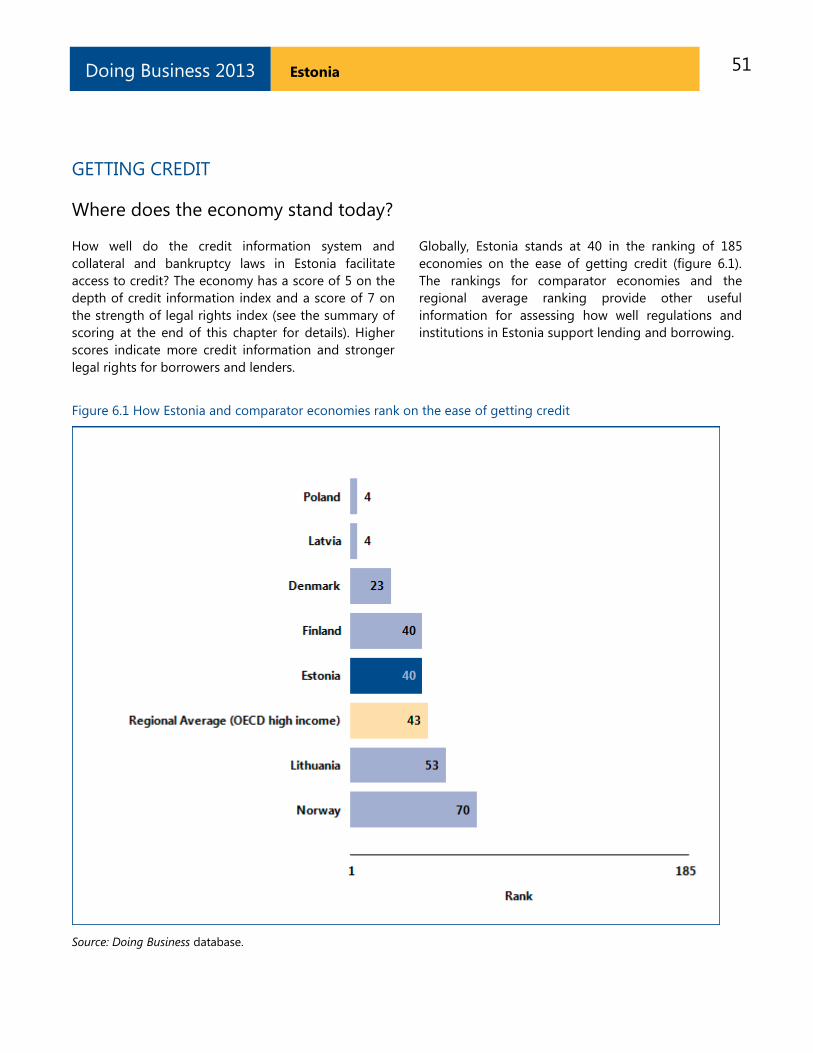
51 Estonia Doing Business 2013
GETTING CREDIT
Where does the economy stand today?
How well do the credit information system and
collateral and bankruptcy laws in Estonia facilitate
access to credit? The economy has a score of 5 on the
depth of credit information index and a score of 7 on
the strength of legal rights index (see the summary of
scoring at the end of this chapter for details). Higher
scores indicate more credit information and stronger
legal rights for borrowers and lenders.
Globally, Estonia stands at 40 in the ranking of 185
economies on the ease of getting credit (figure 6.1).
The rankings for comparator economies and the
regional average ranking provide other useful
information for assessing how well regulations and
institutions in Estonia support lending and borrowing.
Figure 6.1 How Estonia and comparator economies rank on the ease of getting credit
Source: Doing Business database.
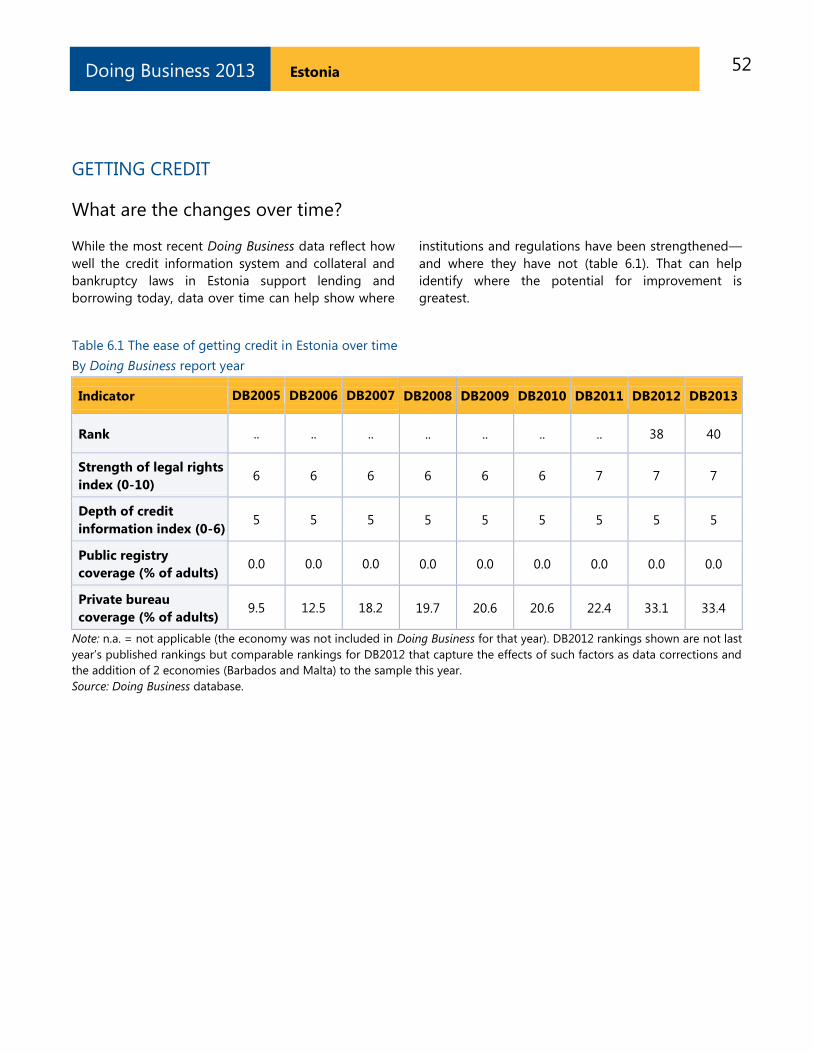
52 Estonia Doing Business 2013
GETTING CREDIT
What are the changes over time?
While the most recent Doing Business data reflect how
well the credit information system and collateral and
bankruptcy laws in Estonia support lending and
borrowing today, data over time can help show where
institutions and regulations have been strengthened—
and where they have not (table 6.1). That can help
identify where the potential for improvement is
greatest.
Table 6.1 The ease of getting credit in Estonia over time
By Doing Business report year
Indicator DB2005 DB2006 DB2007 DB2008 DB2009 DB2010 DB2011 DB2012 DB2013
Rank .. .. .. .. .. .. .. 38 40
Strength of legal rights
index (0-10) 6 6 6 6 6 6 7 7 7
Depth of credit
information index (0-6) 5 5 5 5 5 5 5 5 5
Public registry
coverage (% of adults) 0.0 0.0 0.0 0.0 0.0 0.0 0.0 0.0 0.0
Private bureau
coverage (% of adults) 9.5 12.5 18.2 19.7 20.6 20.6 22.4 33.1 33.4
Note: n.a. = not applicable (the economy was not included in Doing Business for that year). DB2012 rankings shown are not last
year‘s published rankings but comparable rankings for DB2012 that capture the effects of such factors as data corrections and
the addition of 2 economies (Barbados and Malta) to the sample this year.
Source: Doing Business database.
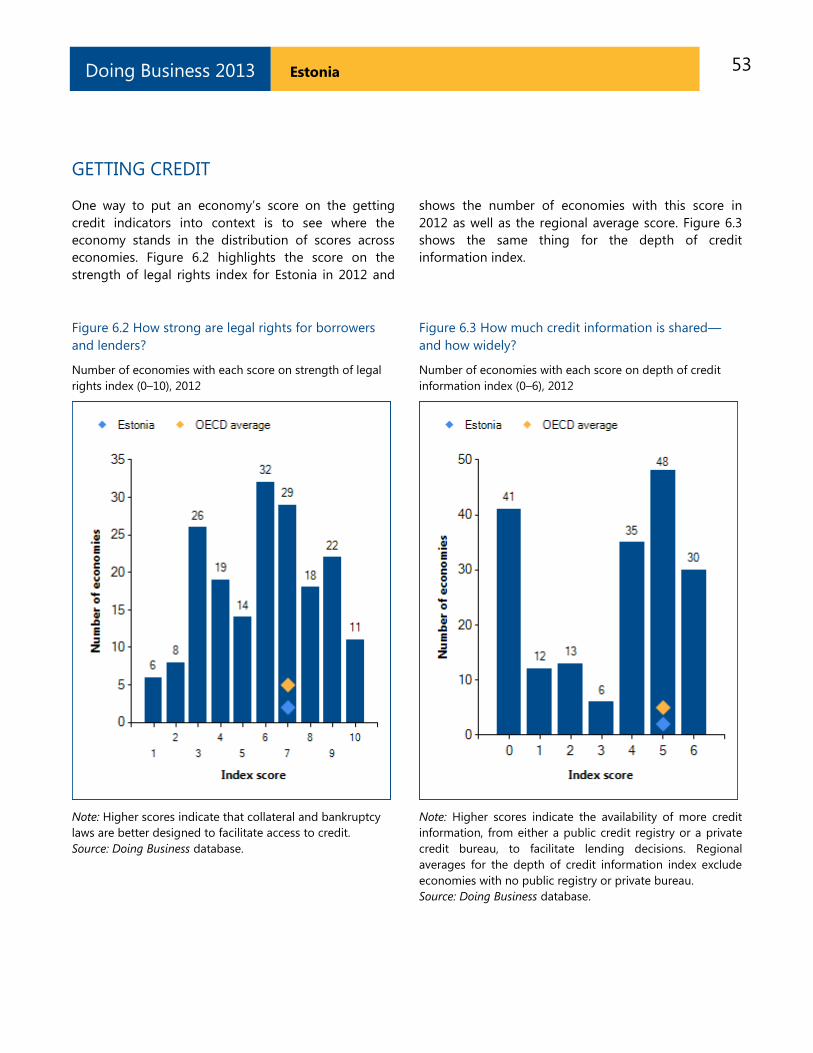
53 Estonia Doing Business 2013
GETTING CREDIT
One way to put an economy‘s score on the getting
credit indicators into context is to see where the
economy stands in the distribution of scores across
economies. Figure 6.2 highlights the score on the
strength of legal rights index for Estonia in 2012 and
shows the number of economies with this score in
2012 as well as the regional average score. Figure 6.3
shows the same thing for the depth of credit
information index.
Figure 6.2 How strong are legal rights for borrowers
and lenders?
Figure 6.3 How much credit information is shared—
and how widely?
Number of economies with each score on strength of legal
rights index (0–10), 2012
Note: Higher scores indicate that collateral and bankruptcy
laws are better designed to facilitate access to credit.
Source: Doing Business database.
Number of economies with each score on depth of credit
information index (0–6), 2012
Note: Higher scores indicate the availability of more credit
information, from either a public credit registry or a private
credit bureau, to facilitate lending decisions. Regional
averages for the depth of credit information index exclude
economies with no public registry or private bureau.
Source: Doing Business database.
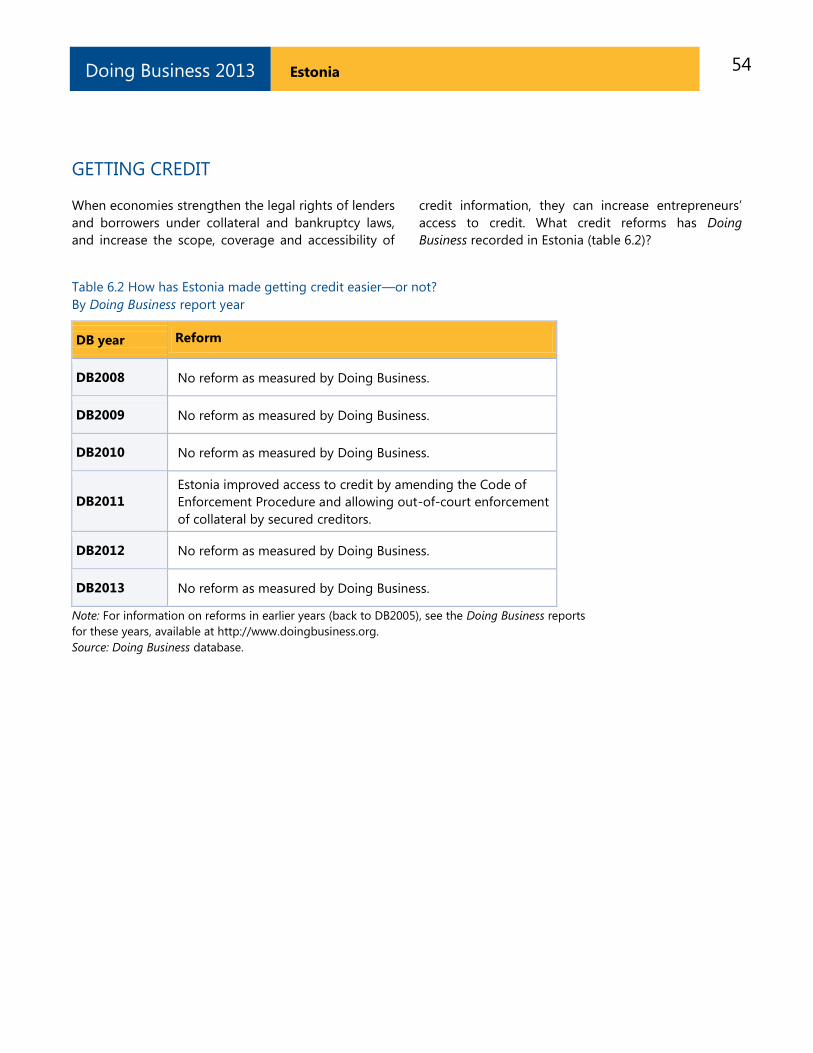
54 Estonia Doing Business 2013
GETTING CREDIT
When economies strengthen the legal rights of lenders
and borrowers under collateral and bankruptcy laws,
and increase the scope, coverage and accessibility of
credit information, they can increase entrepreneurs‘
access to credit. What credit reforms has Doing
Business recorded in Estonia (table 6.2)?
Table 6.2 How has Estonia made getting credit easier—or not?
By Doing Business report year
DB year Reform
DB2008 No reform as measured by Doing Business.
DB2009 No reform as measured by Doing Business.
DB2010 No reform as measured by Doing Business.
DB2011
Estonia improved access to credit by amending the Code of
Enforcement Procedure and allowing out-of-court enforcement
of collateral by secured creditors.
DB2012 No reform as measured by Doing Business.
DB2013 No reform as measured by Doing Business.
Note: For information on reforms in earlier years (back to DB2005), see the Doing Business reports
for these years, available at http://www.doingbusiness.org.
Source: Doing Business database.
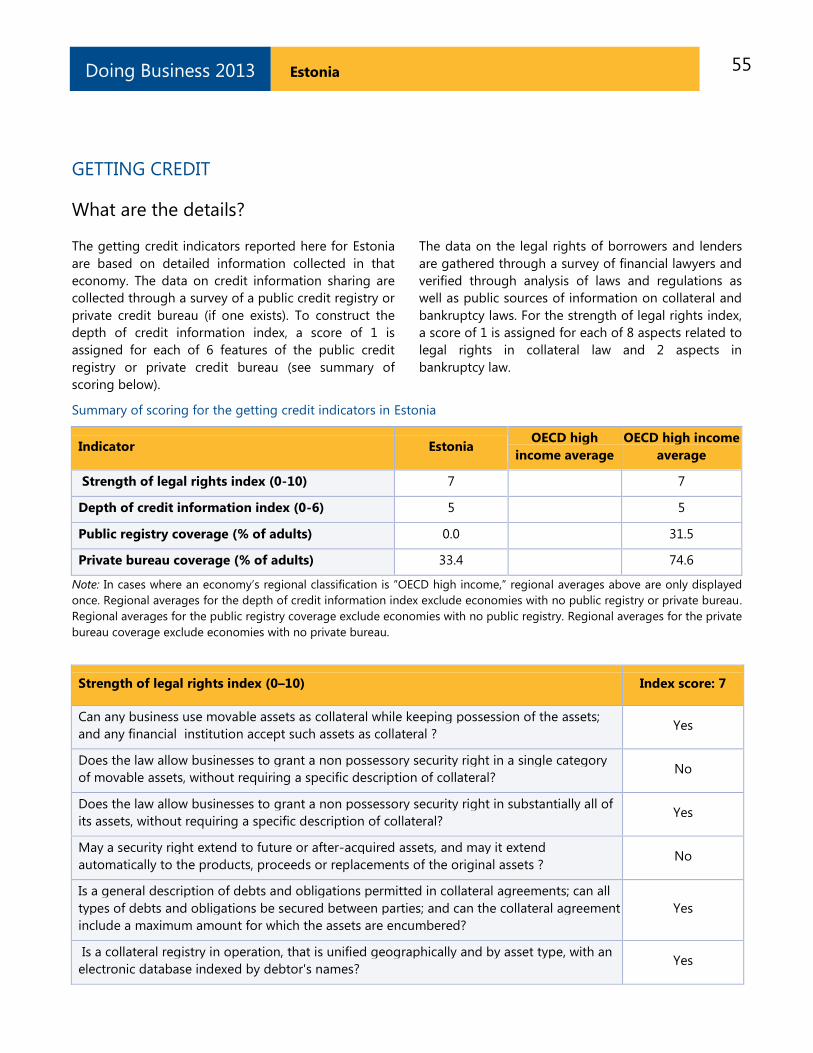
55 Estonia Doing Business 2013
GETTING CREDIT
What are the details?
The getting credit indicators reported here for Estonia
are based on detailed information collected in that
economy. The data on credit information sharing are
collected through a survey of a public credit registry or
private credit bureau (if one exists). To construct the
depth of credit information index, a score of 1 is
assigned for each of 6 features of the public credit
registry or private credit bureau (see summary of
scoring below).
The data on the legal rights of borrowers and lenders
are gathered through a survey of financial lawyers and
verified through analysis of laws and regulations as
well as public sources of information on collateral and
bankruptcy laws. For the strength of legal rights index,
a score of 1 is assigned for each of 8 aspects related to
legal rights in collateral law and 2 aspects in
bankruptcy law.
Summary of scoring for the getting credit indicators in Estonia
Indicator Estonia OECD high
income average
OECD high income
average
Strength of legal rights index (0-10) 7 7
Depth of credit information index (0-6) 5 5
Public registry coverage (% of adults) 0.0 31.5
Private bureau coverage (% of adults) 33.4 74.6
Note: In cases where an economy‘s regional classification is ―OECD high income,‖ regional averages above are only displayed
once. Regional averages for the depth of credit information index exclude economies with no public registry or private bureau.
Regional averages for the public registry coverage exclude economies with no public registry. Regional averages for the private
bureau coverage exclude economies with no private bureau.
Strength of legal rights index (0–10) Index score: 7
Can any business use movable assets as collateral while keeping possession of the assets;
and any financial institution accept such assets as collateral ? Yes
Does the law allow businesses to grant a non possessory security right in a single category
of movable assets, without requiring a specific description of collateral? No
Does the law allow businesses to grant a non possessory security right in substantially all of
its assets, without requiring a specific description of collateral? Yes
May a security right extend to future or after-acquired assets, and may it extend
automatically to the products, proceeds or replacements of the original assets ? No
Is a general description of debts and obligations permitted in collateral agreements; can all
types of debts and obligations be secured between parties; and can the collateral agreement
include a maximum amount for which the assets are encumbered?
Yes
Is a collateral registry in operation, that is unified geographically and by asset type, with an
electronic database indexed by debtor's names? Yes
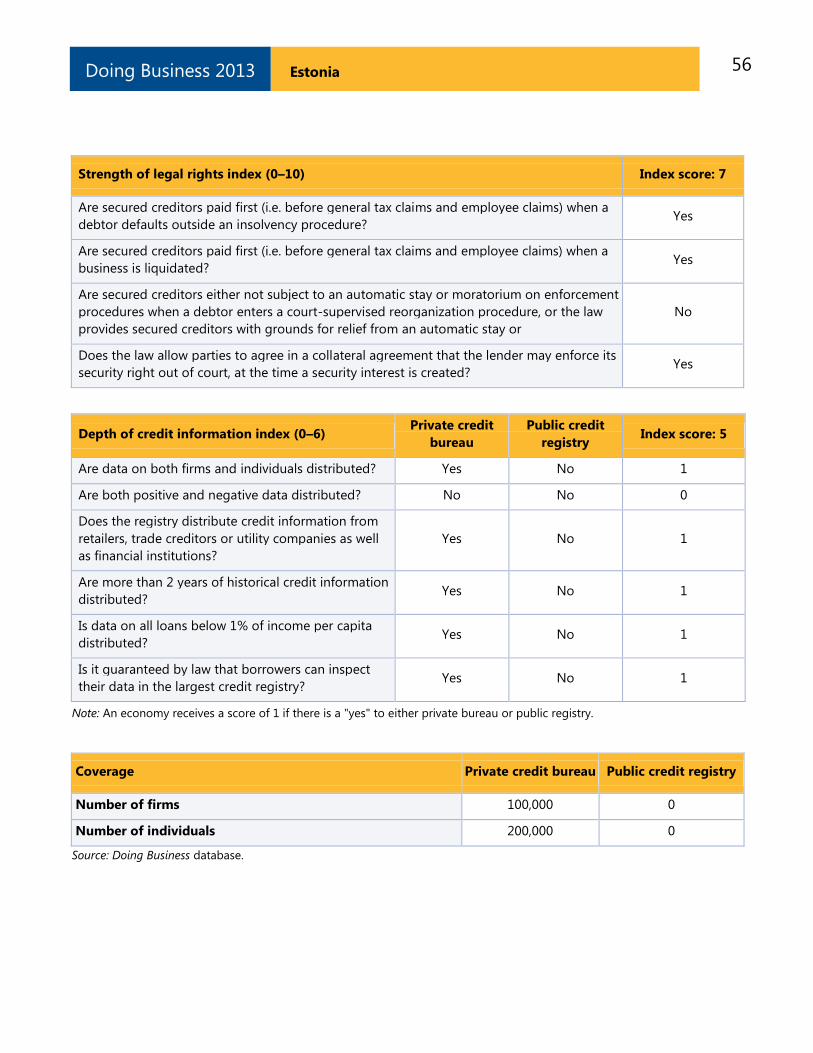
56 Estonia Doing Business 2013
Strength of legal rights index (0–10) Index score: 7
Are secured creditors paid first (i.e. before general tax claims and employee claims) when a
debtor defaults outside an insolvency procedure? Yes
Are secured creditors paid first (i.e. before general tax claims and employee claims) when a
business is liquidated? Yes
Are secured creditors either not subject to an automatic stay or moratorium on enforcement
procedures when a debtor enters a court-supervised reorganization procedure, or the law
provides secured creditors with grounds for relief from an automatic stay or
No
Does the law allow parties to agree in a collateral agreement that the lender may enforce its
security right out of court, at the time a security interest is created? Yes
Depth of credit information index (0–6) Private credit
bureau
Public credit
registry Index score: 5
Are data on both firms and individuals distributed? Yes No 1
Are both positive and negative data distributed? No No 0
Does the registry distribute credit information from
retailers, trade creditors or utility companies as well
as financial institutions?
Yes No 1
Are more than 2 years of historical credit information
distributed? Yes No 1
Is data on all loans below 1% of income per capita
distributed? Yes No 1
Is it guaranteed by law that borrowers can inspect
their data in the largest credit registry? Yes No 1
Note: An economy receives a score of 1 if there is a "yes" to either private bureau or public registry.
Coverage Private credit bureau Public credit registry
Number of firms 100,000 0
Number of individuals 200,000 0
Source: Doing Business database.
57 Estonia Doing Business 2013
PROTECTING INVESTORS
Investor protections matter for the ability of
companies to raise the capital they need to grow,
innovate, diversify and compete. If the laws do not
provide such protections, investors may be reluctant
to invest unless they become the controlling
shareholders. Strong regulations clearly define
related-party transactions, promote clear and efficient
disclosure requirements, require shareholder
participation in major decisions of the company and
set clear standards of accountability for company
insiders.
What do the indicators cover?
Doing Business measures the strength of minority
shareholder protections against directors‘ use of
corporate assets for personal gain—or self-dealing.
The indicators distinguish 3 dimensions of investor
protections: transparency of related-party
transactions (extent of disclosure index), liability for
self-dealing (extent of director liability index) and
shareholders‘ ability to sue officers and directors for
misconduct (ease of shareholder suits index). The
ranking on the strength of investor protection index is
the simple average of the percentile rankings on
these 3 indices. To make the data comparable across
economies, a case study uses several assumptions
about the business and the transaction.
The business (Buyer):
Is a publicly traded corporation listed on the
economy‘s most important stock exchange (or
at least a large private company with multiple
shareholders).
Has a board of directors and a chief executive
officer (CEO) who may legally act on behalf of
Buyer where permitted, even if this is not
specifically required by law.
The transaction involves the following details:
Mr. James, a director and the majority
shareholder of the company, proposes that
WHAT THE PROTECTING INVESTORS
INDICATORS MEASURE
Extent of disclosure index (0–10)
Who can approve related-party transactions
Disclosure requirements in case of related-
party transactions
Extent of director liability index (0–10)
Ability of shareholders to hold interested
parties and members of the approving body
liable in case of related-party transactions
Available legal remedies (damages, repayment
of profits, fines, imprisonment and rescission
of the transaction)
Ability of shareholders to sue directly or
derivatively
Ease of shareholder suits index (0–10)
Access to internal corporate documents
(directly or through a government inspector)
Documents and information available during
trial
Strength of investor protection index (0–10)
Simple average of the extent of disclosure,
extent of director liability and ease of
shareholder suits indices
the company purchase used trucks from another
company he owns.
The price is higher than the going price for used
trucks, but the transaction goes forward.
All required approvals are obtained, and all
required disclosures made, though the transaction
is prejudicial to Buyer.
Shareholders sue the interested parties and the
members of the board of directors.
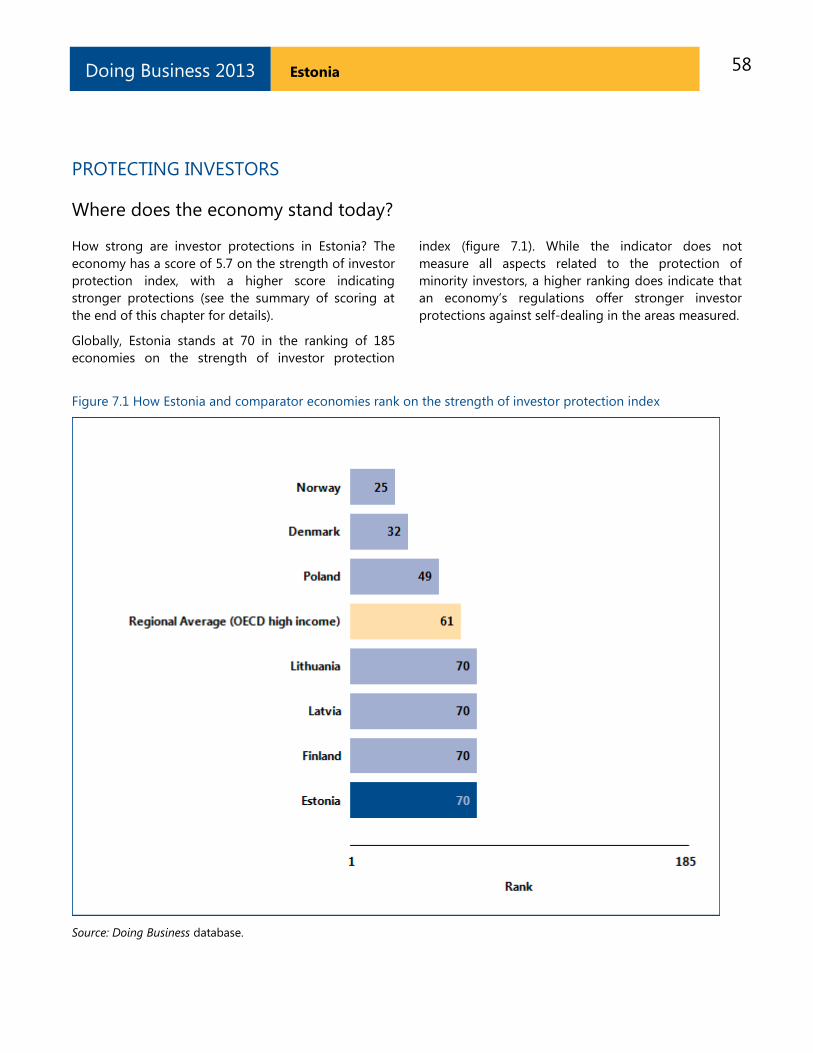
58 Estonia Doing Business 2013
PROTECTING INVESTORS
Where does the economy stand today?
How strong are investor protections in Estonia? The
economy has a score of 5.7 on the strength of investor
protection index, with a higher score indicating
stronger protections (see the summary of scoring at
the end of this chapter for details).
Globally, Estonia stands at 70 in the ranking of 185
economies on the strength of investor protection
index (figure 7.1). While the indicator does not
measure all aspects related to the protection of
minority investors, a higher ranking does indicate that
an economy‘s regulations offer stronger investor
protections against self-dealing in the areas measured.
Figure 7.1 How Estonia and comparator economies rank on the strength of investor protection index
Source: Doing Business database.
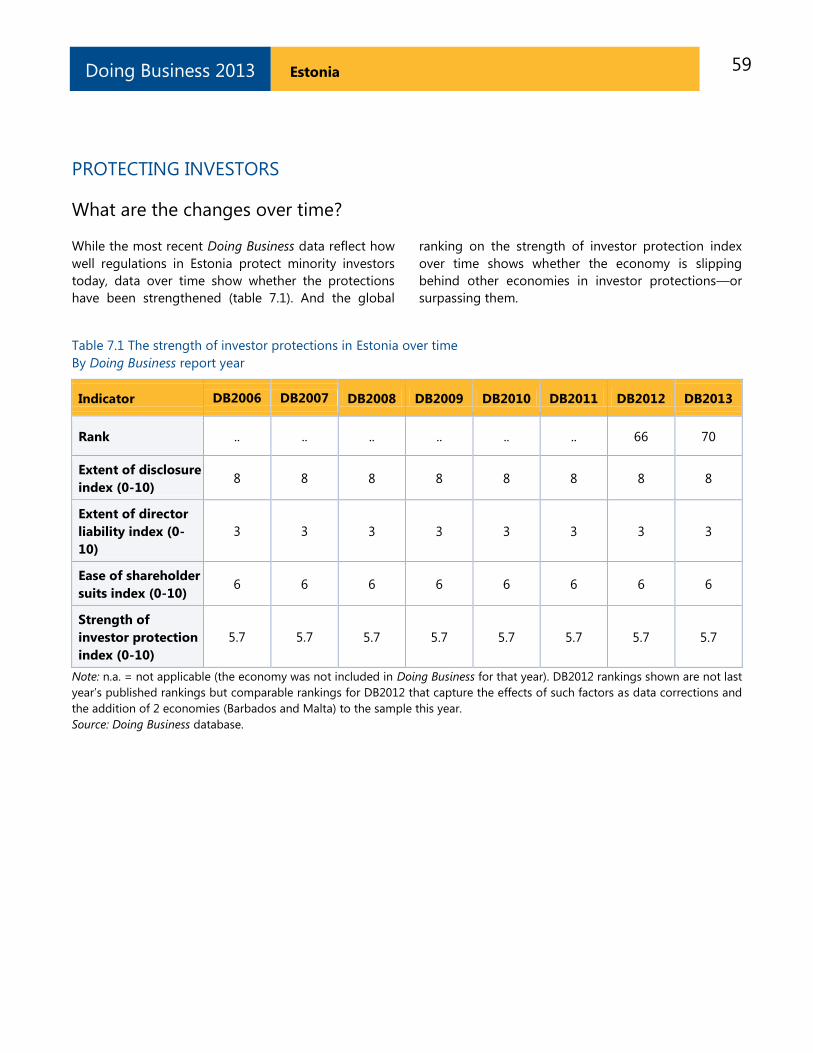
59 Estonia Doing Business 2013
PROTECTING INVESTORS
What are the changes over time?
While the most recent Doing Business data reflect how
well regulations in Estonia protect minority investors
today, data over time show whether the protections
have been strengthened (table 7.1). And the global
ranking on the strength of investor protection index
over time shows whether the economy is slipping
behind other economies in investor protections—or
surpassing them.
Table 7.1 The strength of investor protections in Estonia over time
By Doing Business report year
Indicator DB2006 DB2007 DB2008 DB2009 DB2010 DB2011 DB2012 DB2013
Rank .. .. .. .. .. .. 66 70
Extent of disclosure
index (0-10) 8 8 8 8 8 8 8 8
Extent of director
liability index (0-
10)
3 3 3 3 3 3 3 3
Ease of shareholder
suits index (0-10) 6 6 6 6 6 6 6 6
Strength of
investor protection
index (0-10)
5.7 5.7 5.7 5.7 5.7 5.7 5.7 5.7
Note: n.a. = not applicable (the economy was not included in Doing Business for that year). DB2012 rankings shown are not last
year‘s published rankings but comparable rankings for DB2012 that capture the effects of such factors as data corrections and
the addition of 2 economies (Barbados and Malta) to the sample this year.
Source: Doing Business database.
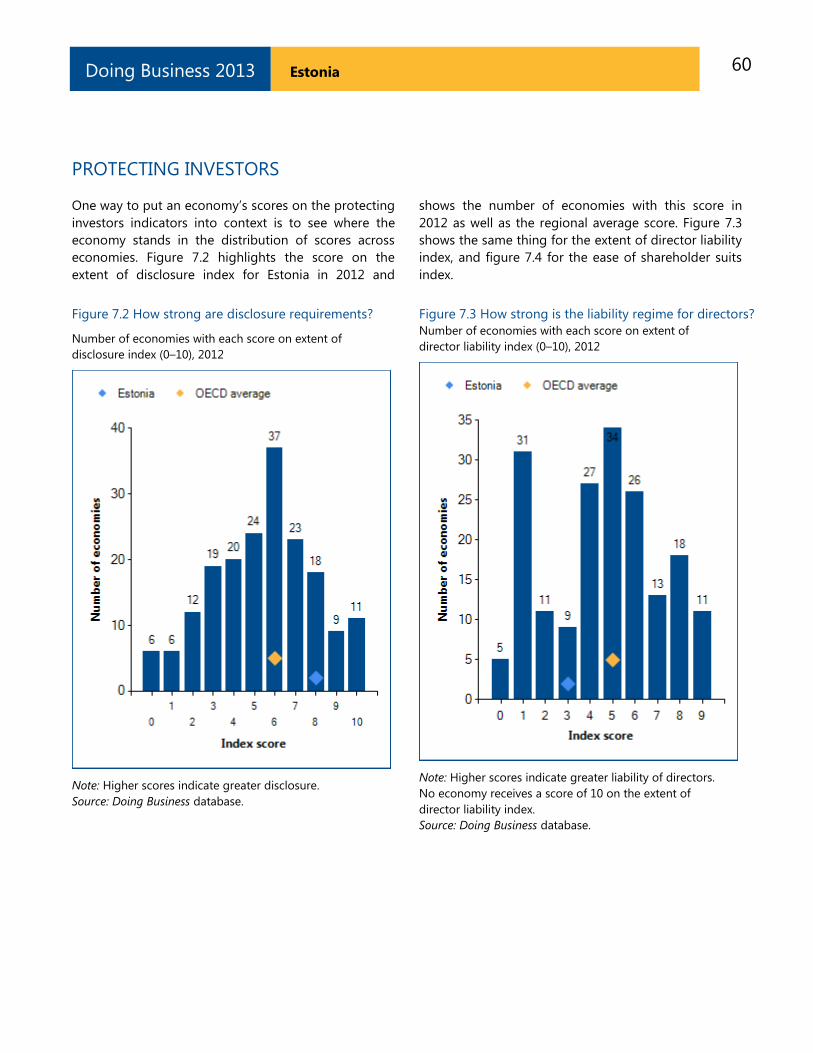
60 Estonia Doing Business 2013
PROTECTING INVESTORS
One way to put an economy‘s scores on the protecting
investors indicators into context is to see where the
economy stands in the distribution of scores across
economies. Figure 7.2 highlights the score on the
extent of disclosure index for Estonia in 2012 and
shows the number of economies with this score in
2012 as well as the regional average score. Figure 7.3
shows the same thing for the extent of director liability
index, and figure 7.4 for the ease of shareholder suits
index.
Figure 7.2 How strong are disclosure requirements?
Number of economies with each score on extent of
disclosure index (0–10), 2012
Note: Higher scores indicate greater disclosure.
Source: Doing Business database.
Figure 7.3 How strong is the liability regime for directors?
Number of economies with each score on extent of
director liability index (0–10), 2012
Note: Higher scores indicate greater liability of directors.
No economy receives a score of 10 on the extent of
director liability index.
Source: Doing Business database.
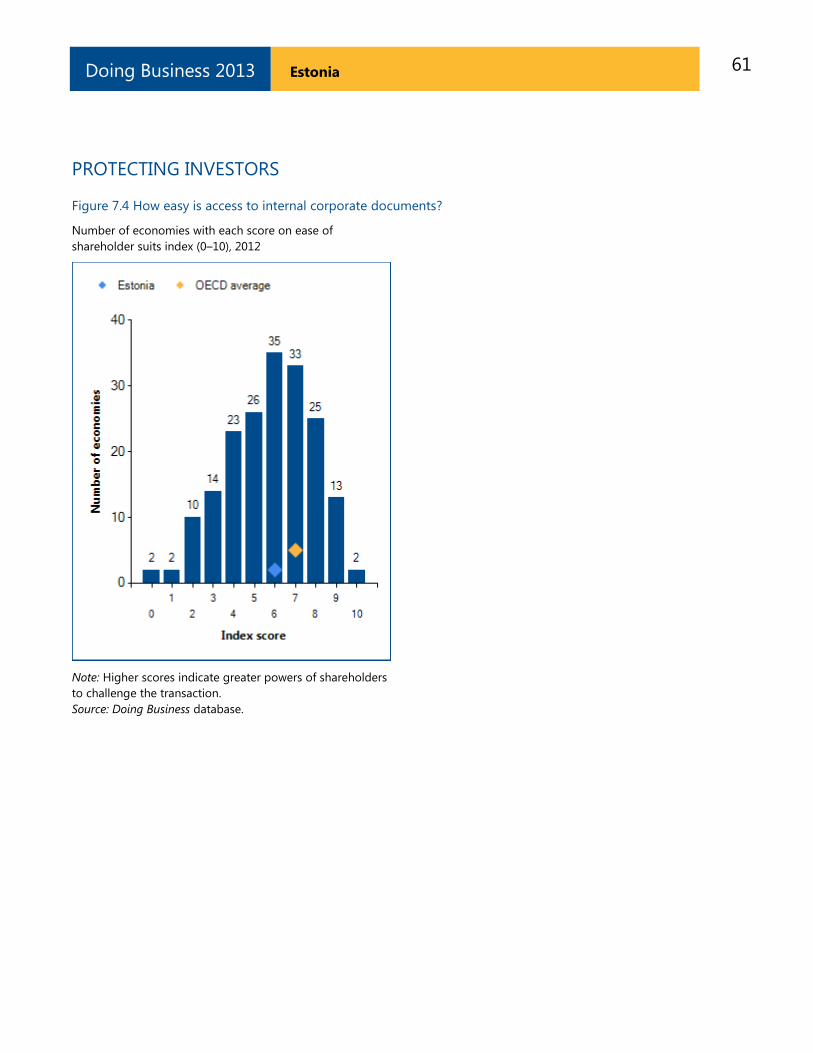
61 Estonia Doing Business 2013
PROTECTING INVESTORS
Figure 7.4 How easy is access to internal corporate documents?
Number of economies with each score on ease of
shareholder suits index (0–10), 2012
Note: Higher scores indicate greater powers of shareholders
to challenge the transaction.
Source: Doing Business database.
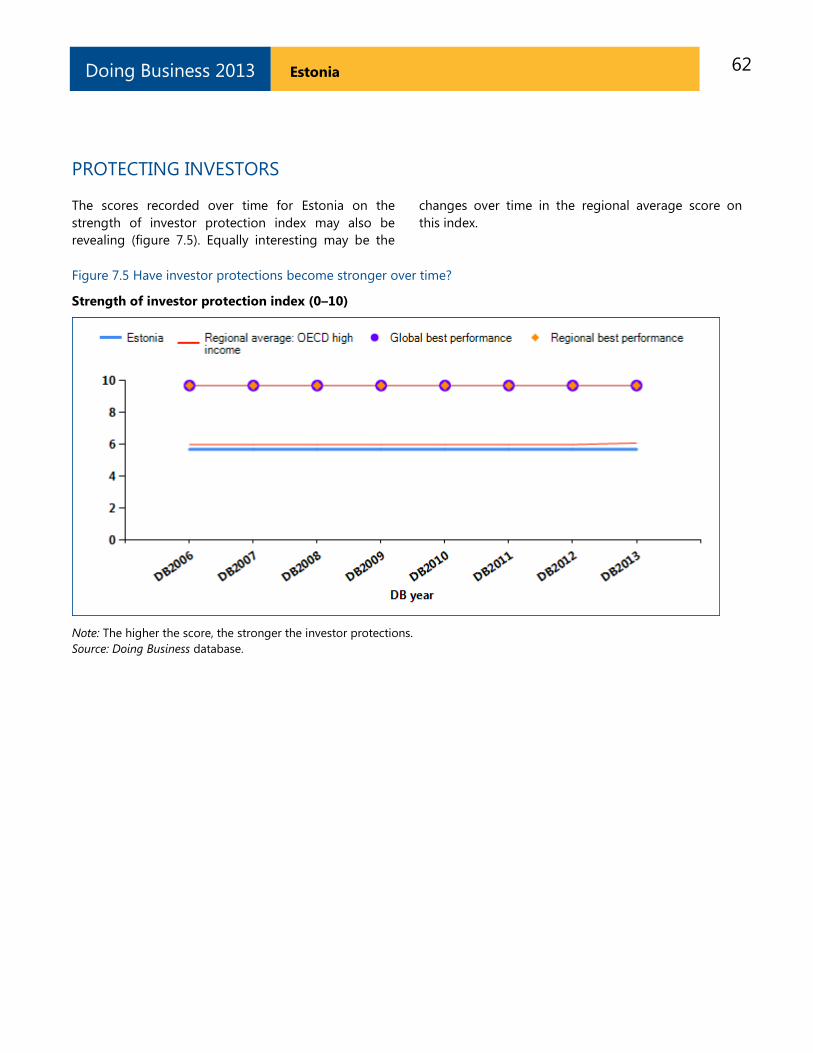
62 Estonia Doing Business 2013
PROTECTING INVESTORS
The scores recorded over time for Estonia on the
strength of investor protection index may also be
revealing (figure 7.5). Equally interesting may be the
changes over time in the regional average score on
this index.
Figure 7.5 Have investor protections become stronger over time?
Strength of investor protection index (0–10)
Note: The higher the score, the stronger the investor protections.
Source: Doing Business database.
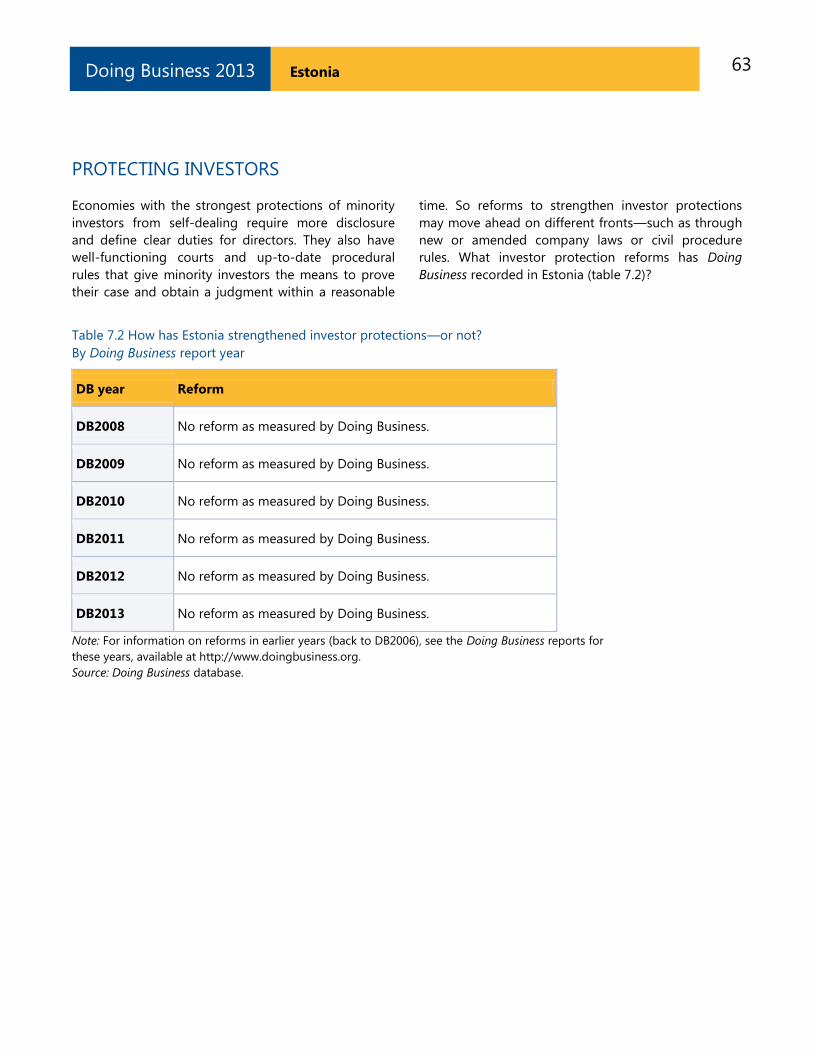
63 Estonia Doing Business 2013
PROTECTING INVESTORS
Economies with the strongest protections of minority
investors from self-dealing require more disclosure
and define clear duties for directors. They also have
well-functioning courts and up-to-date procedural
rules that give minority investors the means to prove
their case and obtain a judgment within a reasonable
time. So reforms to strengthen investor protections
may move ahead on different fronts—such as through
new or amended company laws or civil procedure
rules. What investor protection reforms has Doing
Business recorded in Estonia (table 7.2)?
Table 7.2 How has Estonia strengthened investor protections—or not?
By Doing Business report year
DB year Reform
DB2008 No reform as measured by Doing Business.
DB2009 No reform as measured by Doing Business.
DB2010 No reform as measured by Doing Business.
DB2011 No reform as measured by Doing Business.
DB2012 No reform as measured by Doing Business.
DB2013 No reform as measured by Doing Business.
Note: For information on reforms in earlier years (back to DB2006), see the Doing Business reports for
these years, available at http://www.doingbusiness.org.
Source: Doing Business database.
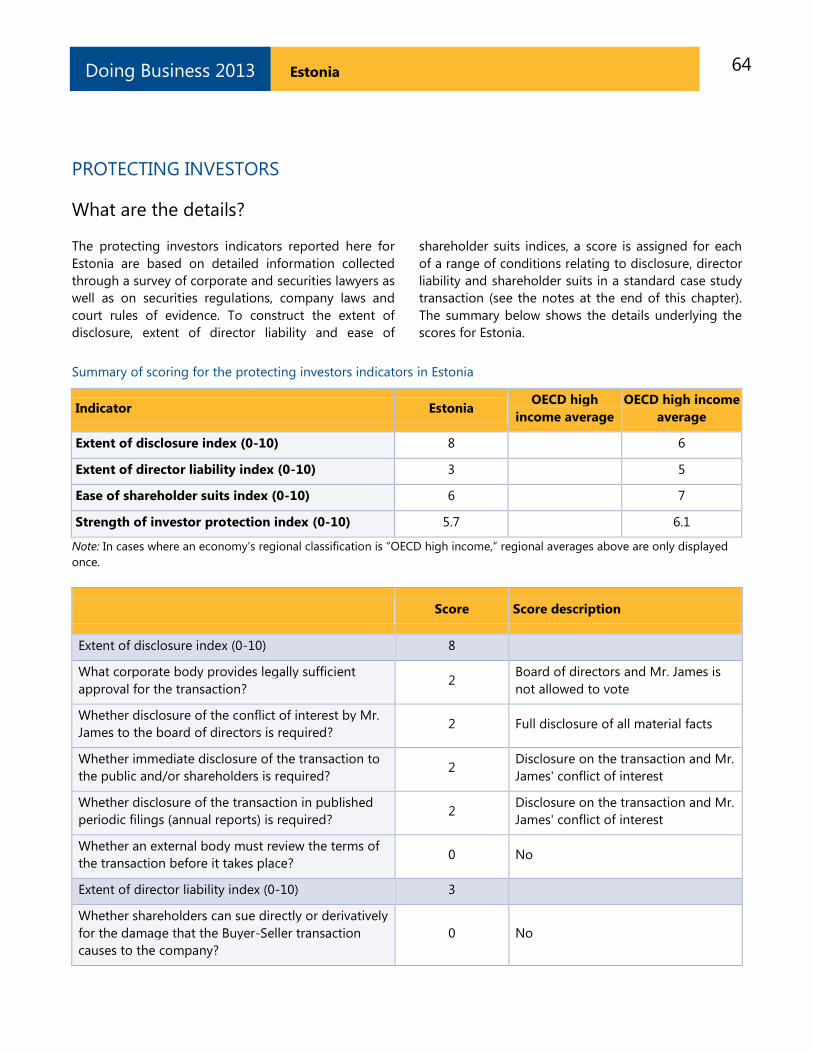
64 Estonia Doing Business 2013
PROTECTING INVESTORS
What are the details?
The protecting investors indicators reported here for
Estonia are based on detailed information collected
through a survey of corporate and securities lawyers as
well as on securities regulations, company laws and
court rules of evidence. To construct the extent of
disclosure, extent of director liability and ease of
shareholder suits indices, a score is assigned for each
of a range of conditions relating to disclosure, director
liability and shareholder suits in a standard case study
transaction (see the notes at the end of this chapter).
The summary below shows the details underlying the
scores for Estonia.
Summary of scoring for the protecting investors indicators in Estonia
Indicator Estonia OECD high
income average
OECD high income
average
Extent of disclosure index (0-10) 8 6
Extent of director liability index (0-10) 3 5
Ease of shareholder suits index (0-10) 6 7
Strength of investor protection index (0-10) 5.7 6.1
Note: In cases where an economy‘s regional classification is ―OECD high income,‖ regional averages above are only displayed
once.
Score Score description
Extent of disclosure index (0-10) 8
What corporate body provides legally sufficient
approval for the transaction? 2
Board of directors and Mr. James is
not allowed to vote
Whether disclosure of the conflict of interest by Mr.
James to the board of directors is required? 2 Full disclosure of all material facts
Whether immediate disclosure of the transaction to
the public and/or shareholders is required? 2
Disclosure on the transaction and Mr.
James' conflict of interest
Whether disclosure of the transaction in published
periodic filings (annual reports) is required? 2
Disclosure on the transaction and Mr.
James' conflict of interest
Whether an external body must review the terms of
the transaction before it takes place? 0 No
Extent of director liability index (0-10) 3
Whether shareholders can sue directly or derivatively
for the damage that the Buyer-Seller transaction
causes to the company?
0 No
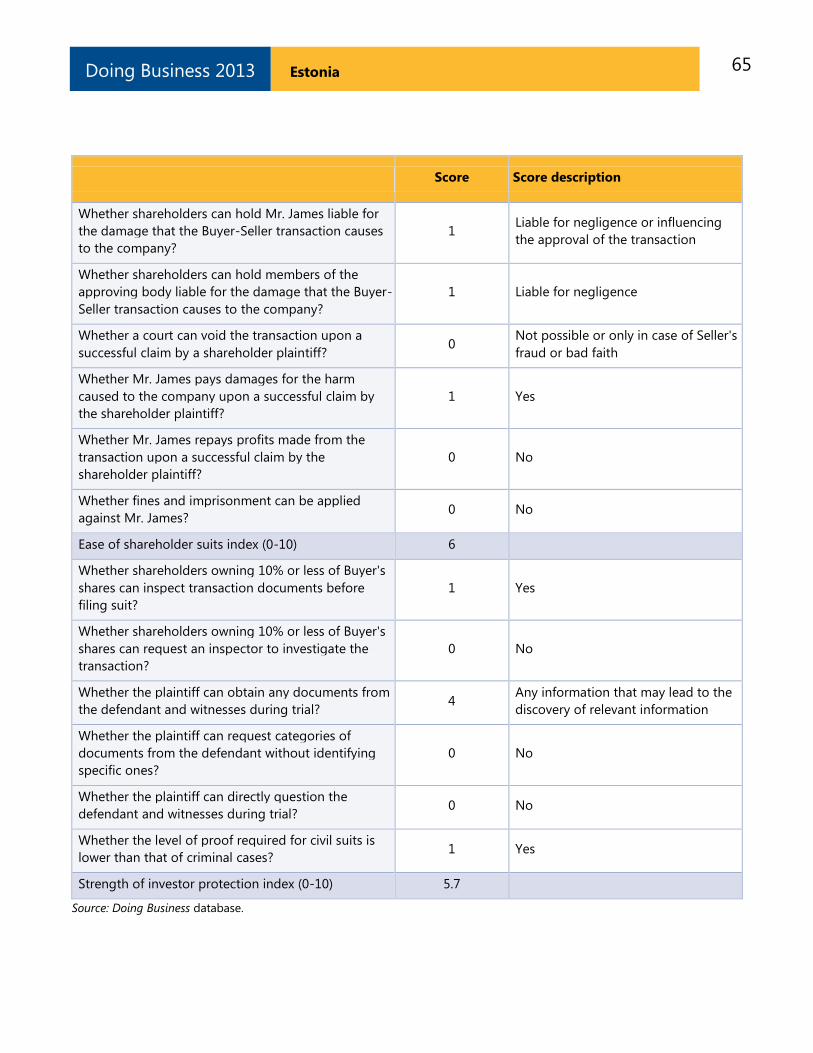
65 Estonia Doing Business 2013
Score Score description
Whether shareholders can hold Mr. James liable for
the damage that the Buyer-Seller transaction causes
to the company?
1 Liable for negligence or influencing
the approval of the transaction
Whether shareholders can hold members of the
approving body liable for the damage that the Buyer-
Seller transaction causes to the company?
1 Liable for negligence
Whether a court can void the transaction upon a
successful claim by a shareholder plaintiff? 0
Not possible or only in case of Seller's
fraud or bad faith
Whether Mr. James pays damages for the harm
caused to the company upon a successful claim by
the shareholder plaintiff?
1 Yes
Whether Mr. James repays profits made from the
transaction upon a successful claim by the
shareholder plaintiff?
0 No
Whether fines and imprisonment can be applied
against Mr. James? 0 No
Ease of shareholder suits index (0-10) 6
Whether shareholders owning 10% or less of Buyer's
shares can inspect transaction documents before
filing suit?
1 Yes
Whether shareholders owning 10% or less of Buyer's
shares can request an inspector to investigate the
transaction?
0 No
Whether the plaintiff can obtain any documents from
the defendant and witnesses during trial? 4
Any information that may lead to the
discovery of relevant information
Whether the plaintiff can request categories of
documents from the defendant without identifying
specific ones?
0 No
Whether the plaintiff can directly question the
defendant and witnesses during trial? 0 No
Whether the level of proof required for civil suits is
lower than that of criminal cases? 1 Yes
Strength of investor protection index (0-10) 5.7
Source: Doing Business database.
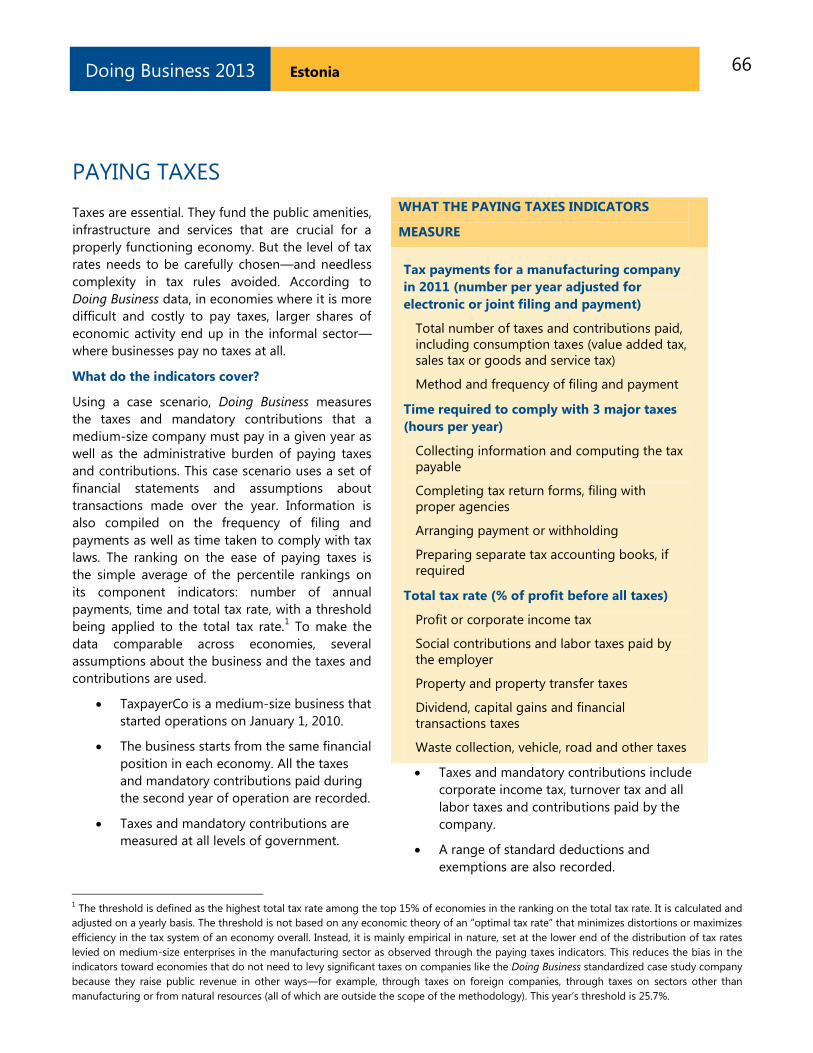
66 Estonia Doing Business 2013
PAYING TAXES
Taxes are essential. They fund the public amenities,
infrastructure and services that are crucial for a
properly functioning economy. But the level of tax
rates needs to be carefully chosen—and needless
complexity in tax rules avoided. According to
Doing Business data, in economies where it is more
difficult and costly to pay taxes, larger shares of
economic activity end up in the informal sector—
where businesses pay no taxes at all.
What do the indicators cover?
Using a case scenario, Doing Business measures
the taxes and mandatory contributions that a
medium-size company must pay in a given year as
well as the administrative burden of paying taxes
and contributions. This case scenario uses a set of
financial statements and assumptions about
transactions made over the year. Information is
also compiled on the frequency of filing and
payments as well as time taken to comply with tax
laws. The ranking on the ease of paying taxes is
the simple average of the percentile rankings on
its component indicators: number of annual
payments, time and total tax rate, with a threshold
being applied to the total tax rate.1 To make the
data comparable across economies, several
assumptions about the business and the taxes and
contributions are used.
TaxpayerCo is a medium-size business that
started operations on January 1, 2010.
The business starts from the same financial
position in each economy. All the taxes
and mandatory contributions paid during
the second year of operation are recorded.
Taxes and mandatory contributions are
measured at all levels of government.
Taxes and mandatory contributions include
corporate income tax, turnover tax and all
labor taxes and contributions paid by the
company.
A range of standard deductions and
exemptions are also recorded.
WHAT THE PAYING TAXES INDICATORS
MEASURE
Tax payments for a manufacturing company
in 2011 (number per year adjusted for
electronic or joint filing and payment)
Total number of taxes and contributions paid,
including consumption taxes (value added tax,
sales tax or goods and service tax)
Method and frequency of filing and payment
Time required to comply with 3 major taxes
(hours per year)
Collecting information and computing the tax
payable
Completing tax return forms, filing with
proper agencies
Arranging payment or withholding
Preparing separate tax accounting books, if
required
Total tax rate (% of profit before all taxes)
Profit or corporate income tax
Social contributions and labor taxes paid by
the employer
Property and property transfer taxes
Dividend, capital gains and financial
transactions taxes
Waste collection, vehicle, road and other taxes
1 The threshold is defined as the highest total tax rate among the top 15% of economies in the ranking on the total tax rate. It is calculated and
adjusted on a yearly basis. The threshold is not based on any economic theory of an ―optimal tax rate‖ that minimizes distortions or maximizes
efficiency in the tax system of an economy overall. Instead, it is mainly empirical in nature, set at the lower end of the distribution of tax rates
levied on medium-size enterprises in the manufacturing sector as observed through the paying taxes indicators. This reduces the bias in the
indicators toward economies that do not need to levy significant taxes on companies like the Doing Business standardized case study company
because they raise public revenue in other ways—for example, through taxes on foreign companies, through taxes on sectors other than
manufacturing or from natural resources (all of which are outside the scope of the methodology). This year‘s threshold is 25.7%.
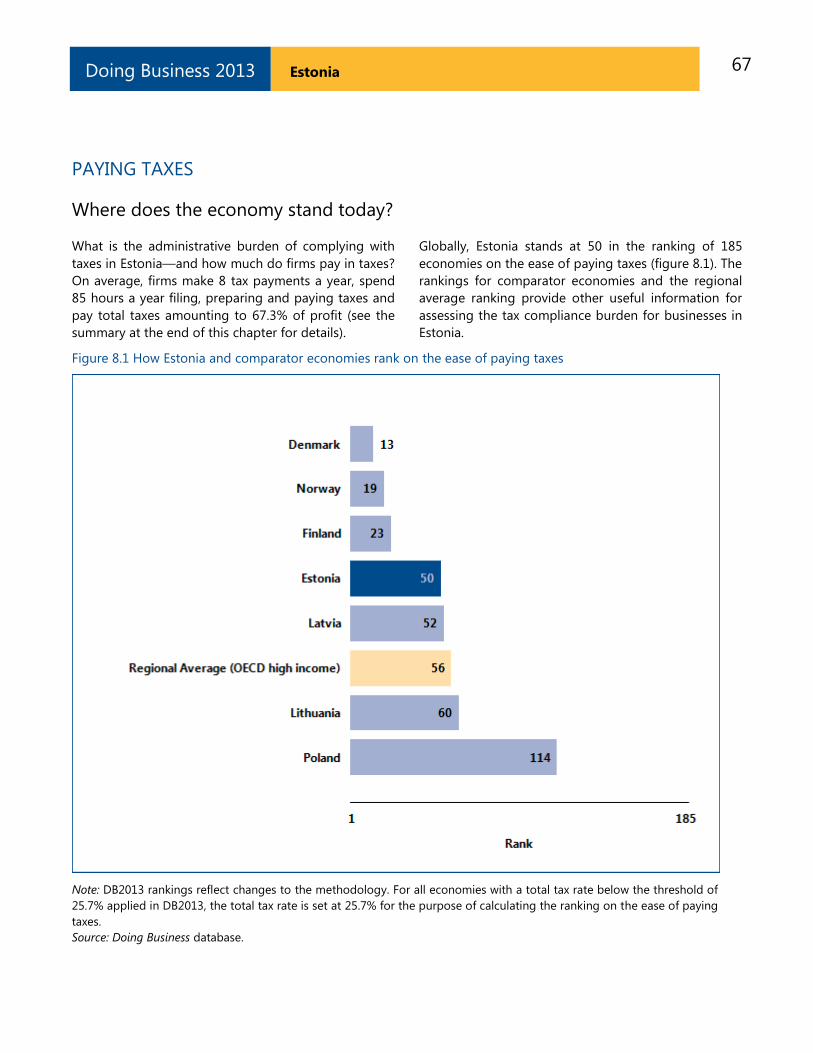
67 Estonia Doing Business 2013
PAYING TAXES
Where does the economy stand today?
What is the administrative burden of complying with
taxes in Estonia—and how much do firms pay in taxes?
On average, firms make 8 tax payments a year, spend
85 hours a year filing, preparing and paying taxes and
pay total taxes amounting to 67.3% of profit (see the
summary at the end of this chapter for details).
Globally, Estonia stands at 50 in the ranking of 185
economies on the ease of paying taxes (figure 8.1). The
rankings for comparator economies and the regional
average ranking provide other useful information for
assessing the tax compliance burden for businesses in
Estonia.
Figure 8.1 How Estonia and comparator economies rank on the ease of paying taxes
Note: DB2013 rankings reflect changes to the methodology. For all economies with a total tax rate below the threshold of
25.7% applied in DB2013, the total tax rate is set at 25.7% for the purpose of calculating the ranking on the ease of paying
taxes.
Source: Doing Business database.
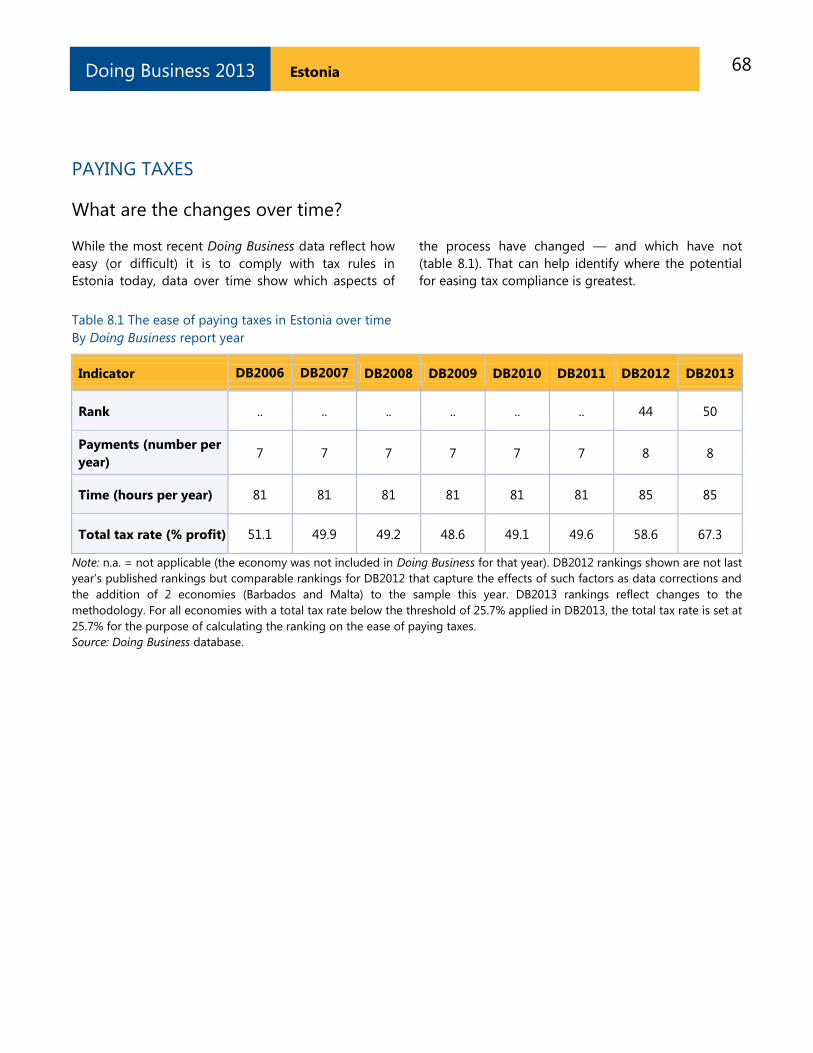
68 Estonia Doing Business 2013
PAYING TAXES
What are the changes over time?
While the most recent Doing Business data reflect how
easy (or difficult) it is to comply with tax rules in
Estonia today, data over time show which aspects of
the process have changed — and which have not
(table 8.1). That can help identify where the potential
for easing tax compliance is greatest.
Table 8.1 The ease of paying taxes in Estonia over time
By Doing Business report year
Indicator DB2006 DB2007 DB2008 DB2009 DB2010 DB2011 DB2012 DB2013
Rank .. .. .. .. .. .. 44 50
Payments (number per
year) 7 7 7 7 7 7 8 8
Time (hours per year) 81 81 81 81 81 81 85 85
Total tax rate (% profit) 51.1 49.9 49.2 48.6 49.1 49.6 58.6 67.3
Note: n.a. = not applicable (the economy was not included in Doing Business for that year). DB2012 rankings shown are not last
year‘s published rankings but comparable rankings for DB2012 that capture the effects of such factors as data corrections and
the addition of 2 economies (Barbados and Malta) to the sample this year. DB2013 rankings reflect changes to the
methodology. For all economies with a total tax rate below the threshold of 25.7% applied in DB2013, the total tax rate is set at
25.7% for the purpose of calculating the ranking on the ease of paying taxes.
Source: Doing Business database.
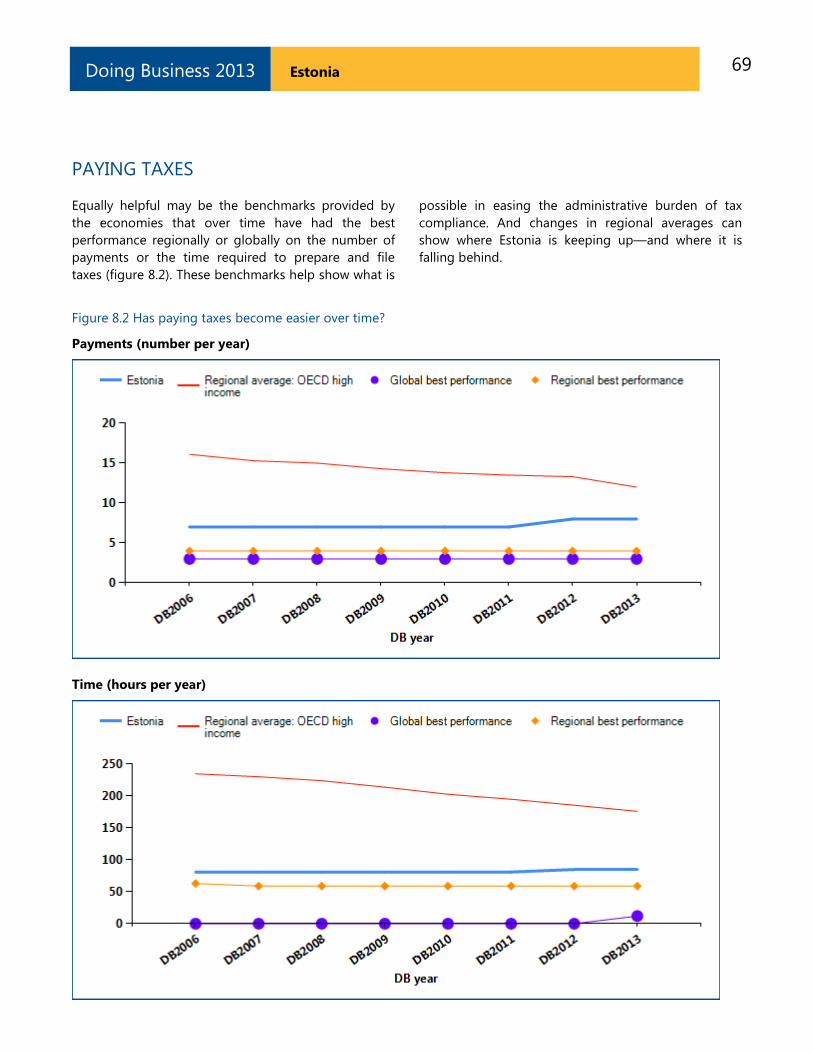
69 Estonia Doing Business 2013
PAYING TAXES
Equally helpful may be the benchmarks provided by
the economies that over time have had the best
performance regionally or globally on the number of
payments or the time required to prepare and file
taxes (figure 8.2). These benchmarks help show what is
possible in easing the administrative burden of tax
compliance. And changes in regional averages can
show where Estonia is keeping up—and where it is
falling behind.
Figure 8.2 Has paying taxes become easier over time?
Payments (number per year)
Time (hours per year)
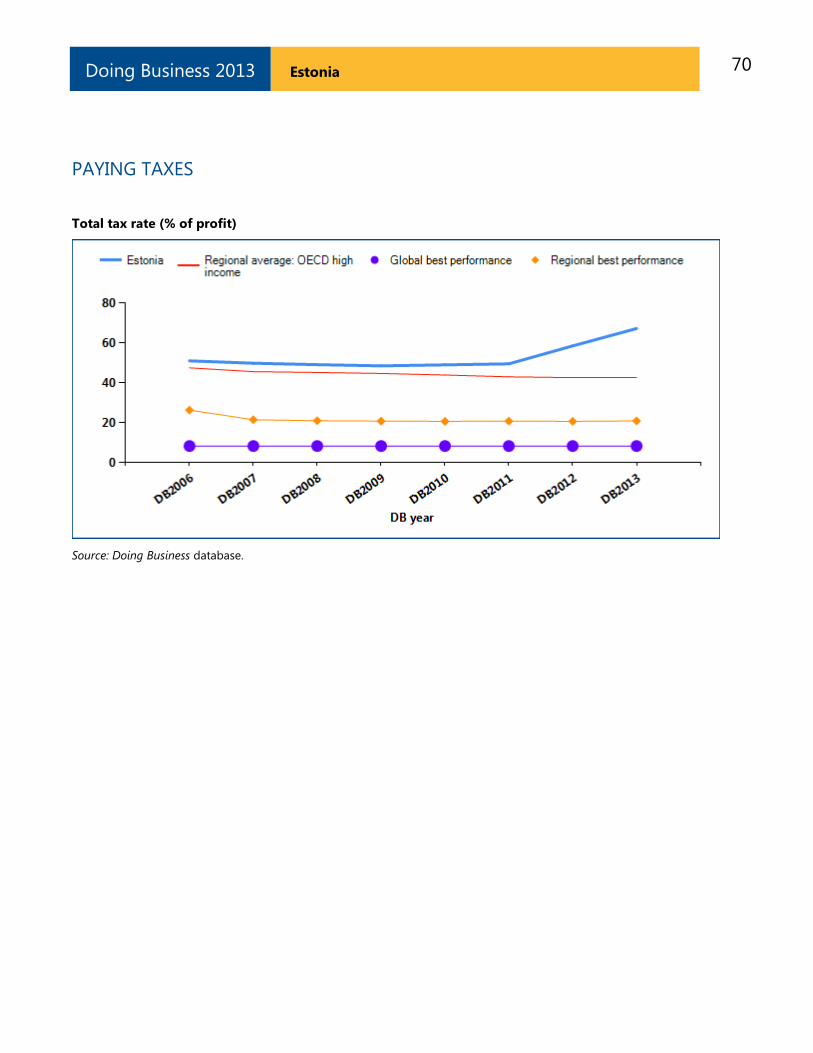
70 Estonia Doing Business 2013
PAYING TAXES
Total tax rate (% of profit)
Source: Doing Business database.
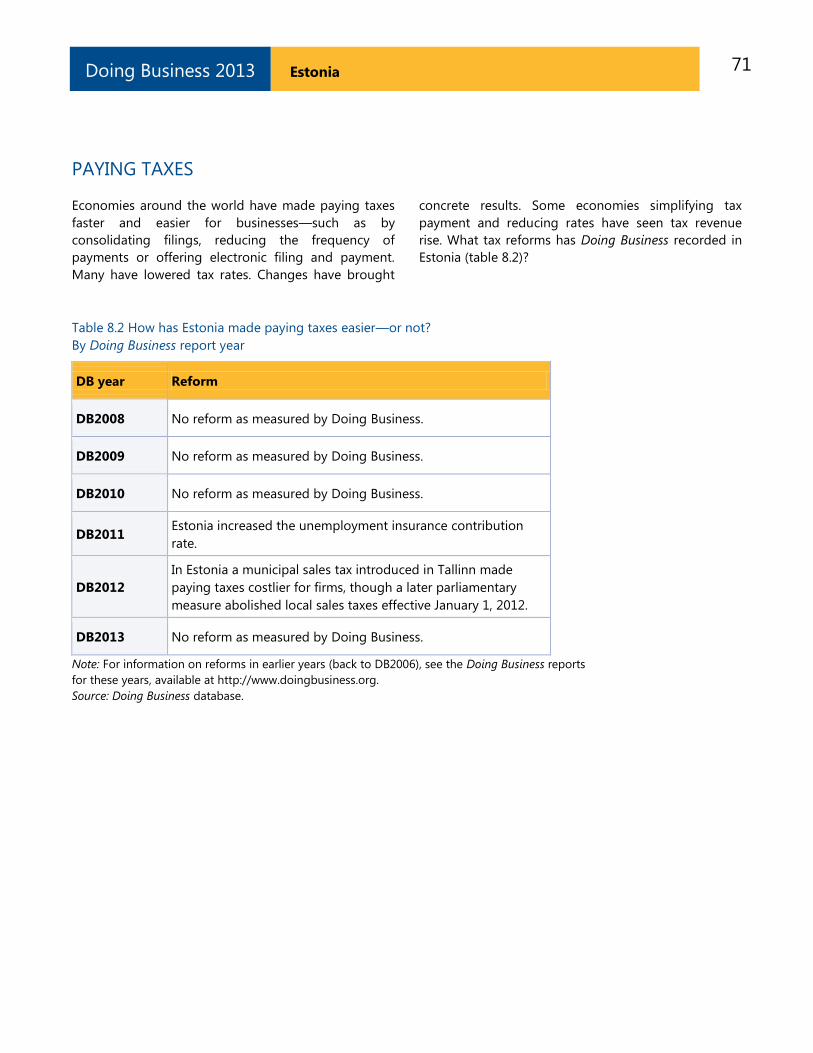
71 Estonia Doing Business 2013
PAYING TAXES
Economies around the world have made paying taxes
faster and easier for businesses—such as by
consolidating filings, reducing the frequency of
payments or offering electronic filing and payment.
Many have lowered tax rates. Changes have brought
concrete results. Some economies simplifying tax
payment and reducing rates have seen tax revenue
rise. What tax reforms has Doing Business recorded in
Estonia (table 8.2)?
Table 8.2 How has Estonia made paying taxes easier—or not?
By Doing Business report year
DB year Reform
DB2008 No reform as measured by Doing Business.
DB2009 No reform as measured by Doing Business.
DB2010 No reform as measured by Doing Business.
DB2011 Estonia increased the unemployment insurance contribution
rate.
DB2012
In Estonia a municipal sales tax introduced in Tallinn made
paying taxes costlier for firms, though a later parliamentary
measure abolished local sales taxes effective January 1, 2012.
DB2013 No reform as measured by Doing Business.
Note: For information on reforms in earlier years (back to DB2006), see the Doing Business reports
for these years, available at http://www.doingbusiness.org.
Source: Doing Business database.
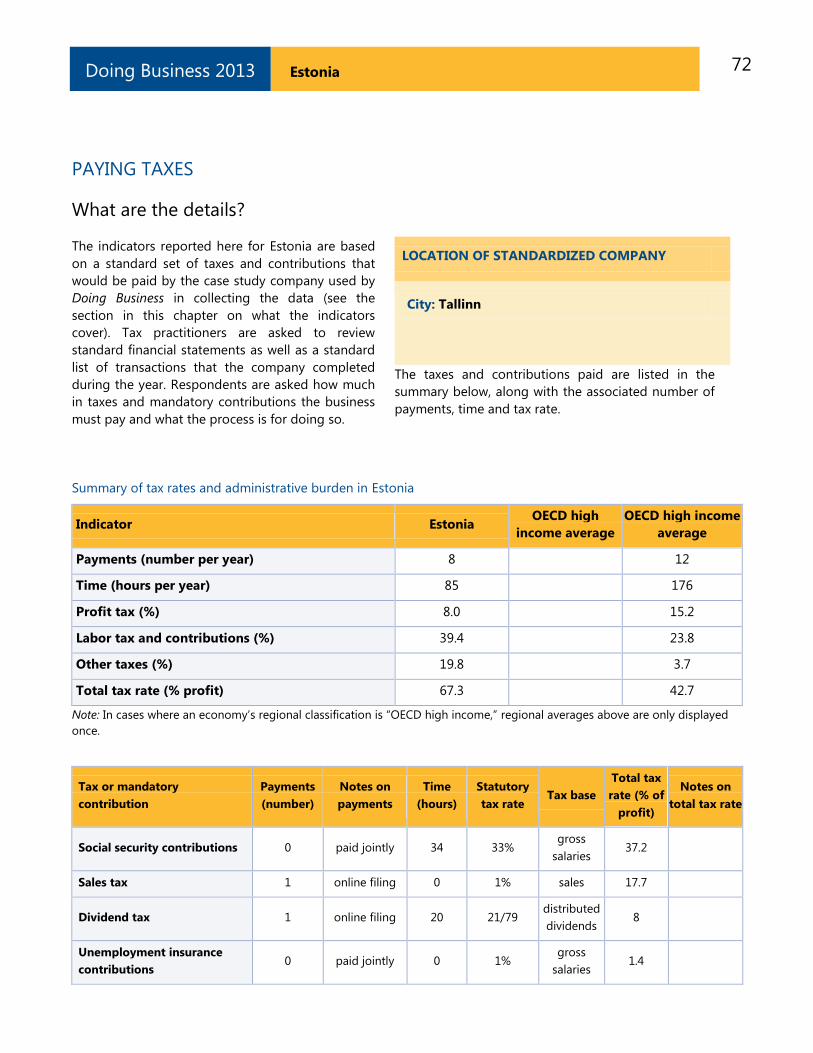
72 Estonia Doing Business 2013
PAYING TAXES
What are the details?
The indicators reported here for Estonia are based
on a standard set of taxes and contributions that
would be paid by the case study company used by
Doing Business in collecting the data (see the
section in this chapter on what the indicators
cover). Tax practitioners are asked to review
standard financial statements as well as a standard
list of transactions that the company completed
during the year. Respondents are asked how much
in taxes and mandatory contributions the business
must pay and what the process is for doing so.
LOCATION OF STANDARDIZED COMPANY
City: Tallinn
The taxes and contributions paid are listed in the
summary below, along with the associated number of
payments, time and tax rate.
Summary of tax rates and administrative burden in Estonia
Indicator Estonia OECD high
income average
OECD high income
average
Payments (number per year) 8 12
Time (hours per year) 85 176
Profit tax (%) 8.0 15.2
Labor tax and contributions (%) 39.4 23.8
Other taxes (%) 19.8 3.7
Total tax rate (% profit) 67.3 42.7
Note: In cases where an economy‘s regional classification is ―OECD high income,‖ regional averages above are only displayed
once.
Tax or mandatory
contribution
Payments
(number)
Notes on
payments
Time
(hours)
Statutory
tax rate Tax base
Total tax
rate (% of
profit)
Notes on
total tax rate
Social security contributions 0 paid jointly 34 33% gross
salaries 37.2
Sales tax 1 online filing 0 1% sales 17.7
Dividend tax 1 online filing 20 21/79 distributed
dividends 8
Unemployment insurance
contributions 0 paid jointly 0 1%
gross
salaries 1.4
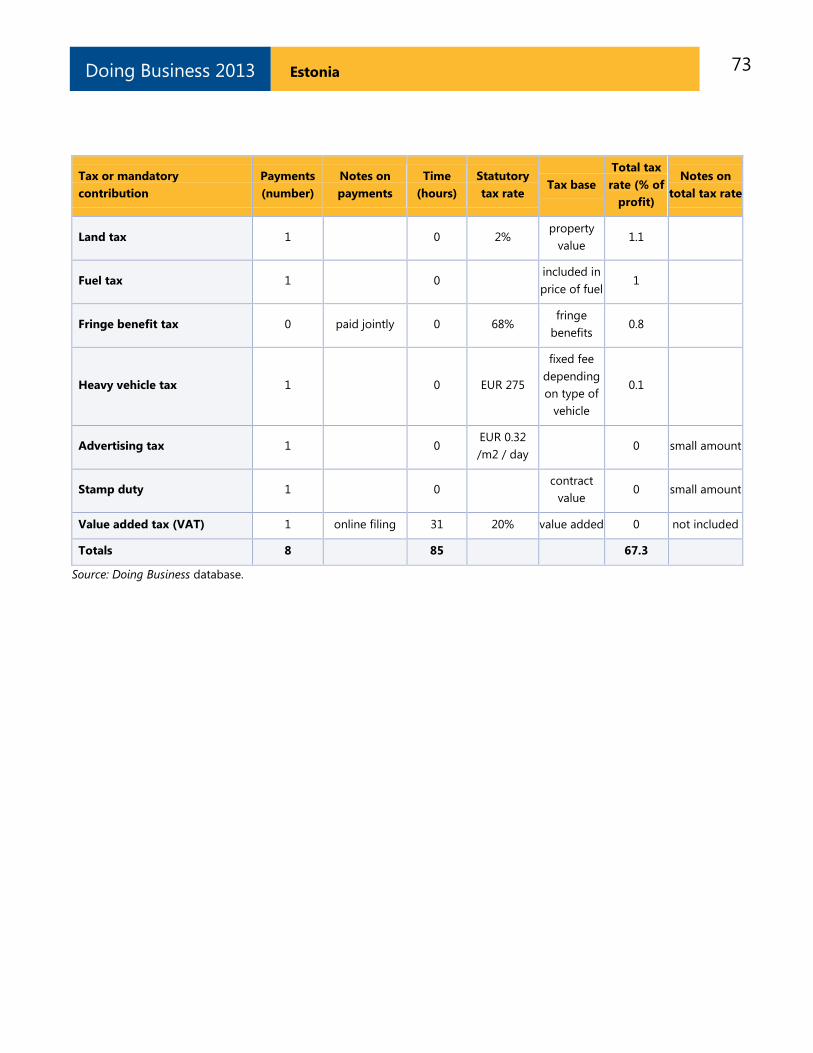
73 Estonia Doing Business 2013
Tax or mandatory
contribution
Payments
(number)
Notes on
payments
Time
(hours)
Statutory
tax rate Tax base
Total tax
rate (% of
profit)
Notes on
total tax rate
Land tax 1 0 2% property
value 1.1
Fuel tax 1 0 included in
price of fuel 1
Fringe benefit tax 0 paid jointly 0 68% fringe
benefits 0.8
Heavy vehicle tax 1 0 EUR 275
fixed fee
depending
on type of
vehicle
0.1
Advertising tax 1 0 EUR 0.32
/m2 / day 0 small amount
Stamp duty 1 0 contract
value 0 small amount
Value added tax (VAT) 1 online filing 31 20% value added 0 not included
Totals 8 85 67.3
Source: Doing Business database.
74 Estonia Doing Business 2013
TRADING ACROSS BORDERS
In today‘s globalized world, making trade between
economies easier is increasingly important for
business. Excessive document requirements,
burdensome customs procedures, inefficient port
operations and inadequate infrastructure all lead to
extra costs and delays for exporters and importers,
stifling trade potential. Research shows that
exporters in developing countries gain more from
a 10% drop in their trading costs than from a
similar reduction in the tariffs applied to their
products in global markets.
What do the indicators cover?
Doing Business measures the time and cost
(excluding tariffs and the time and cost for sea
transport) associated with exporting and importing
a standard shipment of goods by sea transport,
and the number of documents necessary to
complete the transaction. The indicators cover
procedural requirements such as documentation
requirements and procedures at customs and other
regulatory agencies as well as at the port. They also
cover trade logistics, including the time and cost of
inland transport to the largest business city. The
ranking on the ease of trading across borders is
the simple average of the percentile rankings on its
component indicators: documents, time and cost
to export and import.
To make the data comparable across economies,
Doing Business uses several assumptions about the
business and the traded goods.
The business:
Is of medium size and employs 60 people.
Is located in the periurban area of the
economy‘s largest business city.
Is a private, limited liability company,
domestically owned, formally registered
and operating under commercial laws and
regulations of the economy.
The traded goods:
Are not hazardous nor do they include
military items.
WHAT THE TRADING ACROSS BORDERS
INDICATORS MEASURE
Documents required to export and import
(number)
Bank documents
Customs clearance documents
Port and terminal handling documents
Transport documents
Time required to export and import (days)
Obtaining, filling out and submitting all the
documents
Inland transport and handling
Customs clearance and inspections
Port and terminal handling
Does not include sea transport time
Cost required to export and import (US$ per
container)
All documentation
Inland transport and handling
Customs clearance and inspections
Port and terminal handling
Official costs only, no bribes
Do not require refrigeration or any other
special environment.
Do not require any special phytosanitary or
environmental safety standards other than
accepted international standards.
Are one of the economy‘s leading export or
import products.
Are transported in a dry-cargo, 20-foot full
container load.
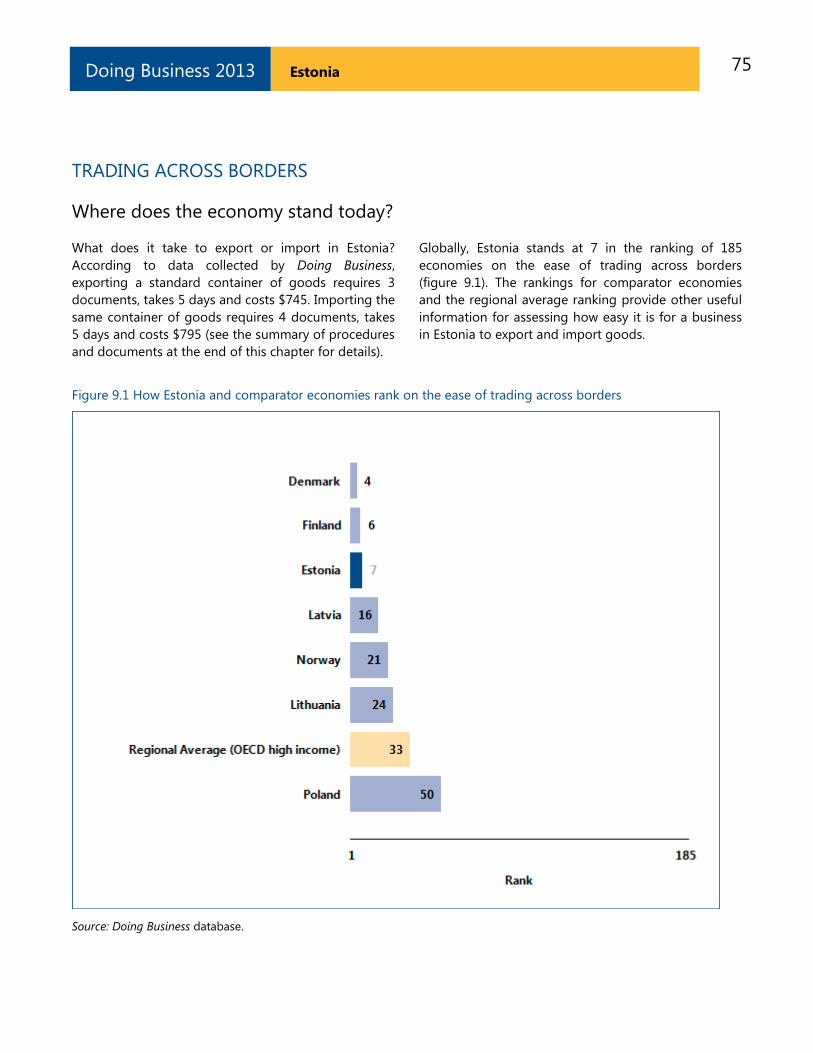
75 Estonia Doing Business 2013
TRADING ACROSS BORDERS
Where does the economy stand today?
What does it take to export or import in Estonia?
According to data collected by Doing Business,
exporting a standard container of goods requires 3
documents, takes 5 days and costs $745. Importing the
same container of goods requires 4 documents, takes
5 days and costs $795 (see the summary of procedures
and documents at the end of this chapter for details).
Globally, Estonia stands at 7 in the ranking of 185
economies on the ease of trading across borders
(figure 9.1). The rankings for comparator economies
and the regional average ranking provide other useful
information for assessing how easy it is for a business
in Estonia to export and import goods.
Figure 9.1 How Estonia and comparator economies rank on the ease of trading across borders
Source: Doing Business database.
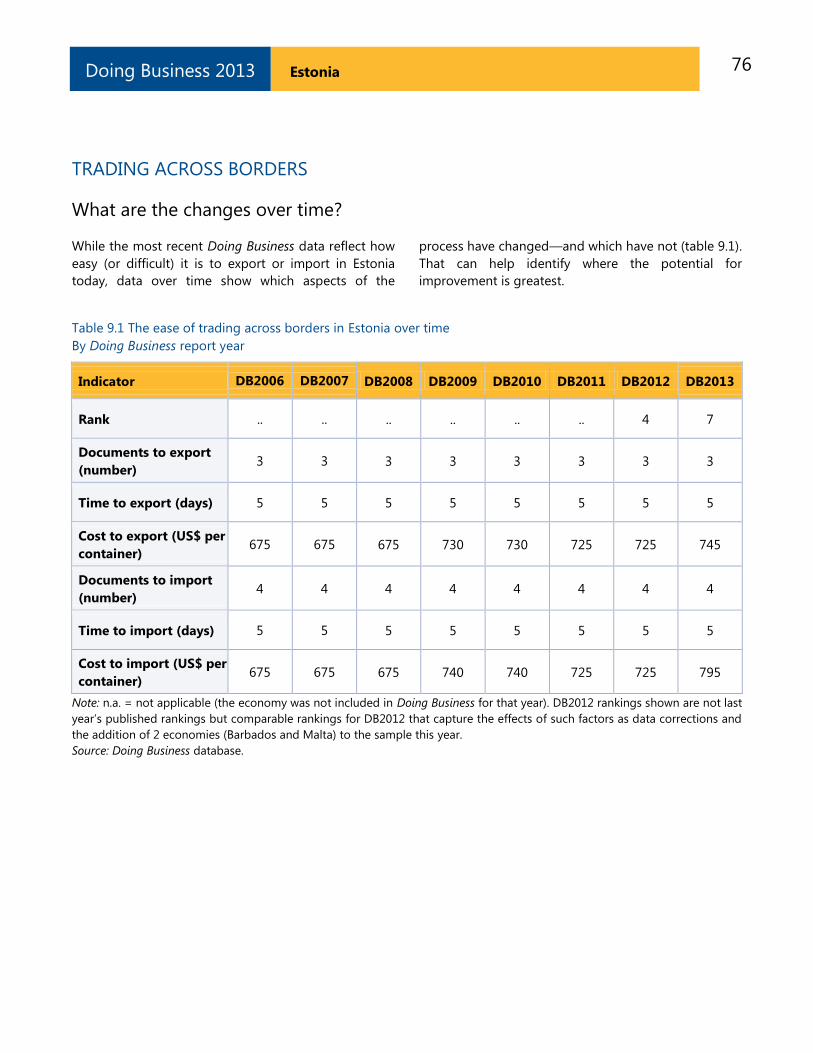
76 Estonia Doing Business 2013
TRADING ACROSS BORDERS
What are the changes over time?
While the most recent Doing Business data reflect how
easy (or difficult) it is to export or import in Estonia
today, data over time show which aspects of the
process have changed—and which have not (table 9.1).
That can help identify where the potential for
improvement is greatest.
Table 9.1 The ease of trading across borders in Estonia over time
By Doing Business report year
Indicator DB2006 DB2007 DB2008 DB2009 DB2010 DB2011 DB2012 DB2013
Rank .. .. .. .. .. .. 4 7
Documents to export
(number) 3 3 3 3 3 3 3 3
Time to export (days) 5 5 5 5 5 5 5 5
Cost to export (US$ per
container) 675 675 675 730 730 725 725 745
Documents to import
(number) 4 4 4 4 4 4 4 4
Time to import (days) 5 5 5 5 5 5 5 5
Cost to import (US$ per
container) 675 675 675 740 740 725 725 795
Note: n.a. = not applicable (the economy was not included in Doing Business for that year). DB2012 rankings shown are not last
year‘s published rankings but comparable rankings for DB2012 that capture the effects of such factors as data corrections and
the addition of 2 economies (Barbados and Malta) to the sample this year.
Source: Doing Business database.
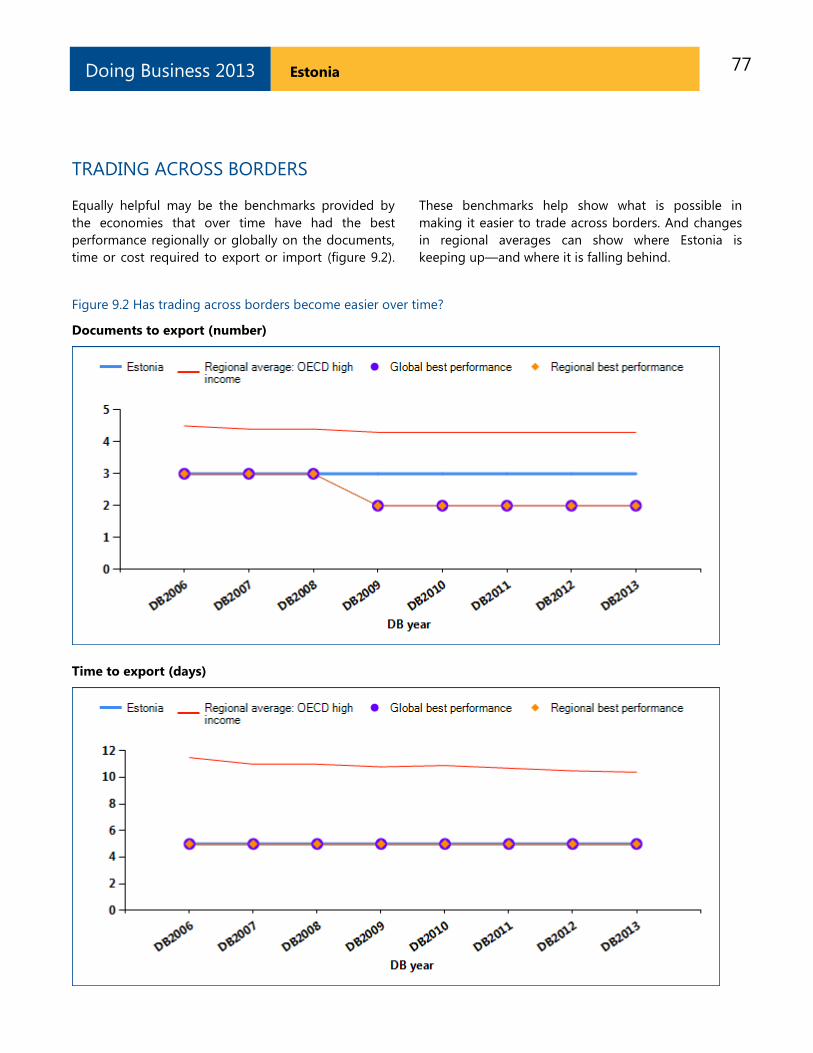
77 Estonia Doing Business 2013
TRADING ACROSS BORDERS
Equally helpful may be the benchmarks provided by
the economies that over time have had the best
performance regionally or globally on the documents,
time or cost required to export or import (figure 9.2).
These benchmarks help show what is possible in
making it easier to trade across borders. And changes
in regional averages can show where Estonia is
keeping up—and where it is falling behind.
Figure 9.2 Has trading across borders become easier over time?
Documents to export (number)
Time to export (days)
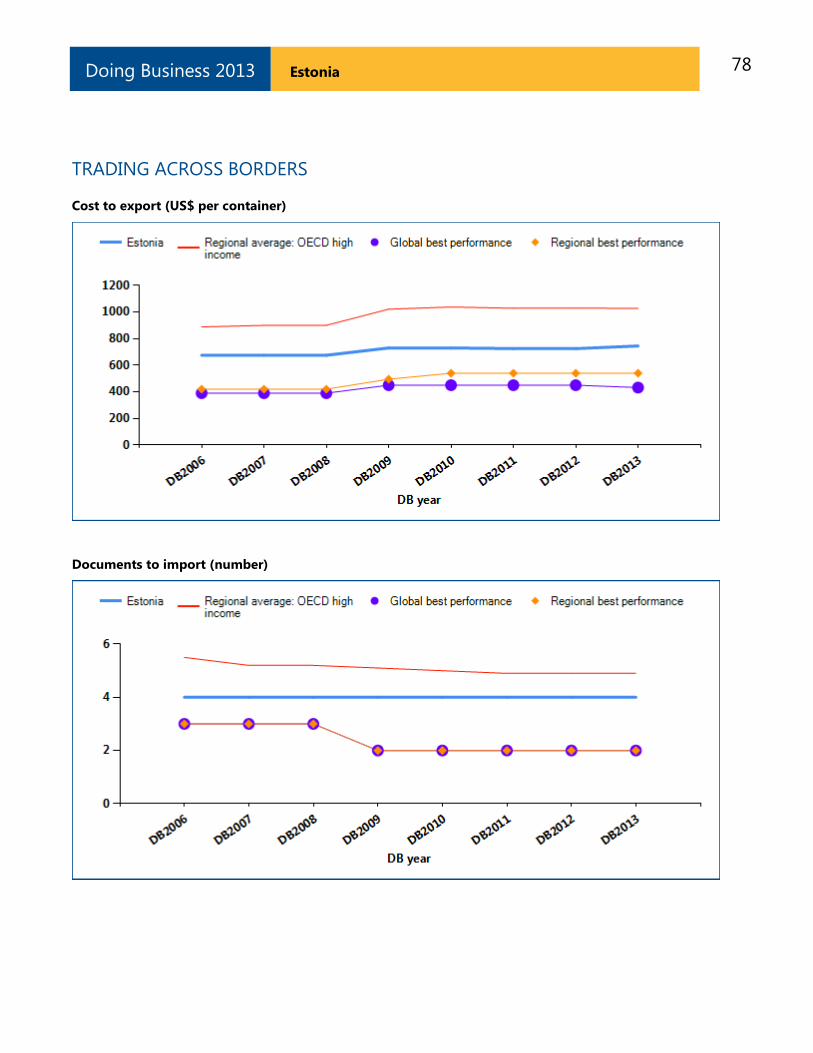
78 Estonia Doing Business 2013
TRADING ACROSS BORDERS
Cost to export (US$ per container)
Documents to import (number)
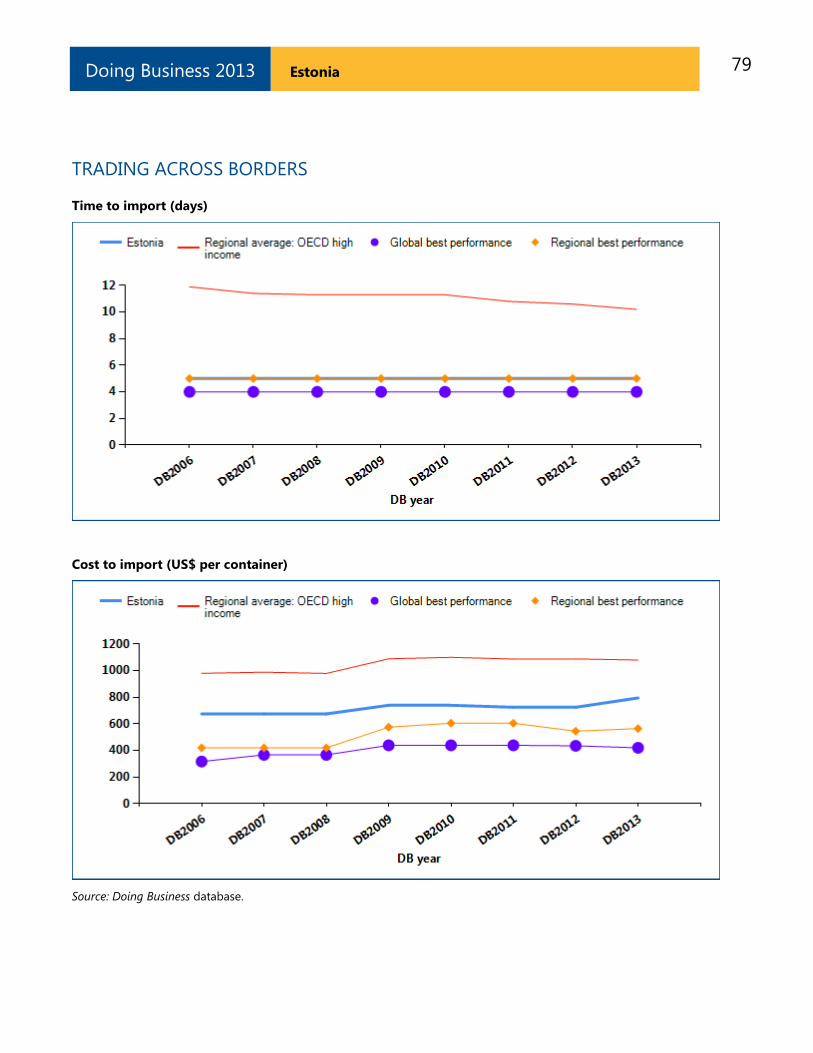
79 Estonia Doing Business 2013
TRADING ACROSS BORDERS
Time to import (days)
Cost to import (US$ per container)
Source: Doing Business database.
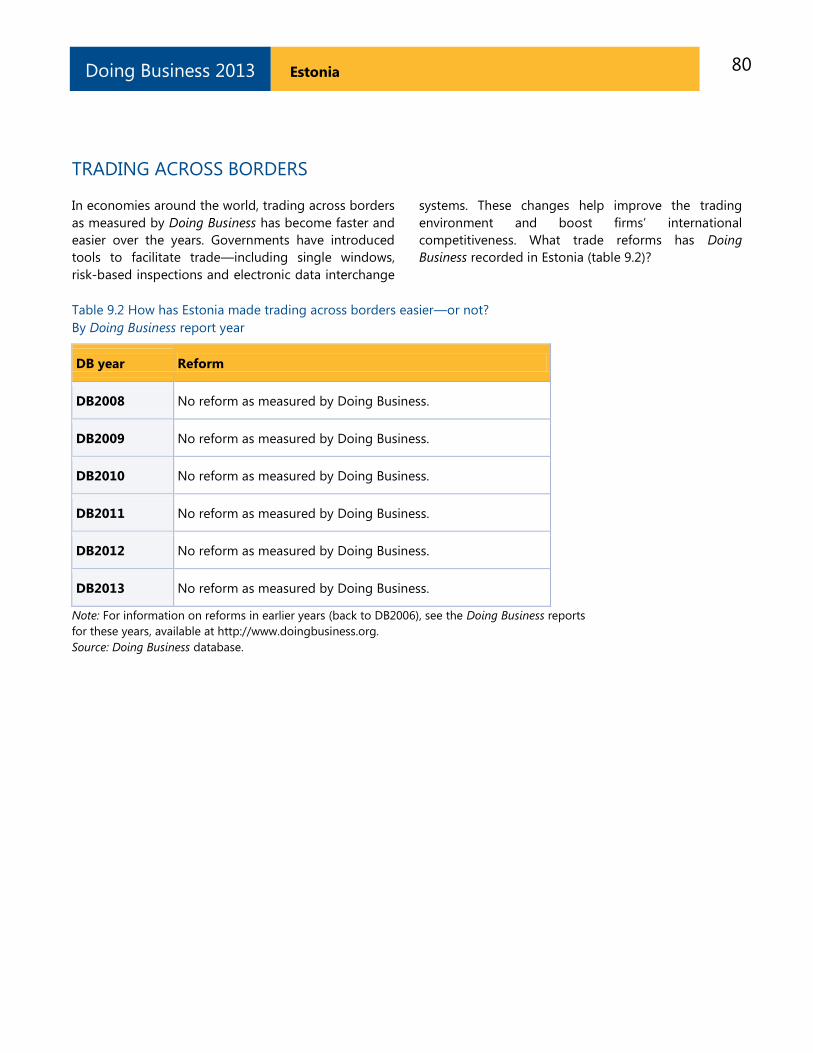
80 Estonia Doing Business 2013
TRADING ACROSS BORDERS
In economies around the world, trading across borders
as measured by Doing Business has become faster and
easier over the years. Governments have introduced
tools to facilitate trade—including single windows,
risk-based inspections and electronic data interchange
systems. These changes help improve the trading
environment and boost firms‘ international
competitiveness. What trade reforms has Doing
Business recorded in Estonia (table 9.2)?
Table 9.2 How has Estonia made trading across borders easier—or not?
By Doing Business report year
DB year Reform
DB2008 No reform as measured by Doing Business.
DB2009 No reform as measured by Doing Business.
DB2010 No reform as measured by Doing Business.
DB2011 No reform as measured by Doing Business.
DB2012 No reform as measured by Doing Business.
DB2013 No reform as measured by Doing Business.
Note: For information on reforms in earlier years (back to DB2006), see the Doing Business reports
for these years, available at http://www.doingbusiness.org.
Source: Doing Business database.
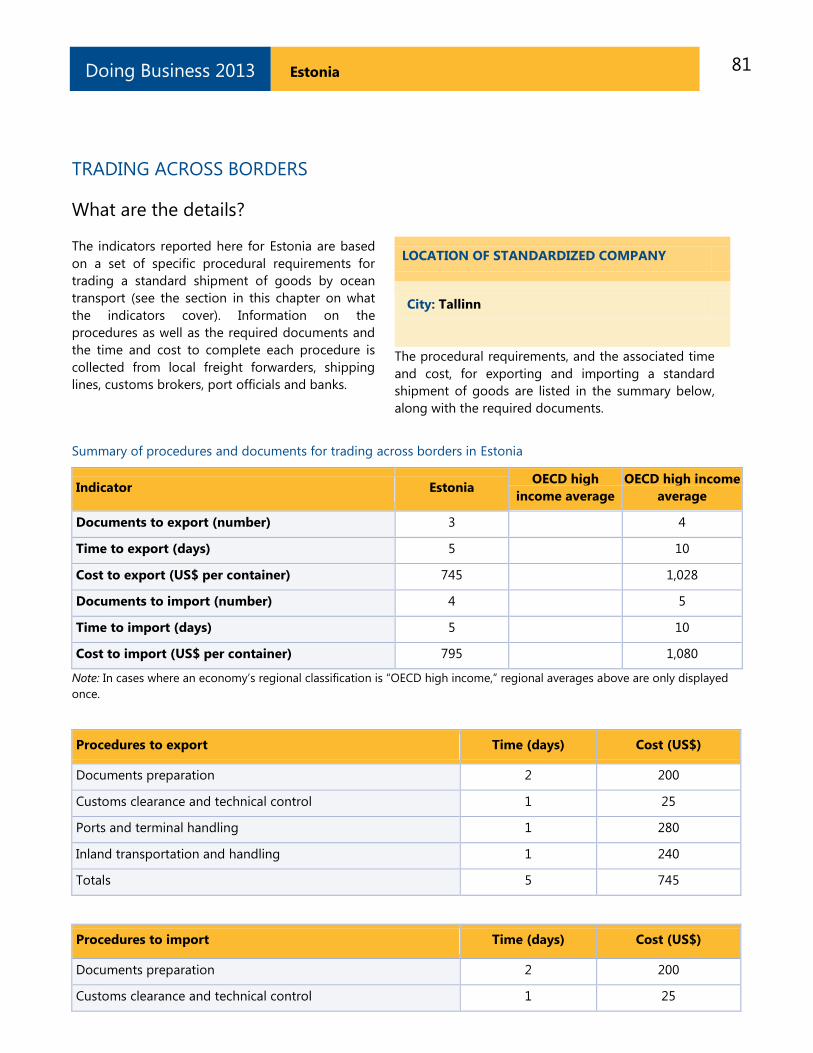
81 Estonia Doing Business 2013
TRADING ACROSS BORDERS
What are the details?
The indicators reported here for Estonia are based
on a set of specific procedural requirements for
trading a standard shipment of goods by ocean
transport (see the section in this chapter on what
the indicators cover). Information on the
procedures as well as the required documents and
the time and cost to complete each procedure is
collected from local freight forwarders, shipping
lines, customs brokers, port officials and banks.
LOCATION OF STANDARDIZED COMPANY
City: Tallinn
The procedural requirements, and the associated time
and cost, for exporting and importing a standard
shipment of goods are listed in the summary below,
along with the required documents.
Summary of procedures and documents for trading across borders in Estonia
Indicator Estonia OECD high
income average
OECD high income
average
Documents to export (number) 3 4
Time to export (days) 5 10
Cost to export (US$ per container) 745 1,028
Documents to import (number) 4 5
Time to import (days) 5 10
Cost to import (US$ per container) 795 1,080
Note: In cases where an economy‘s regional classification is ―OECD high income,‖ regional averages above are only displayed
once.
Procedures to export Time (days) Cost (US$)
Documents preparation 2 200
Customs clearance and technical control 1 25
Ports and terminal handling 1 280
Inland transportation and handling 1 240
Totals 5 745
Procedures to import Time (days) Cost (US$)
Documents preparation 2 200
Customs clearance and technical control 1 25
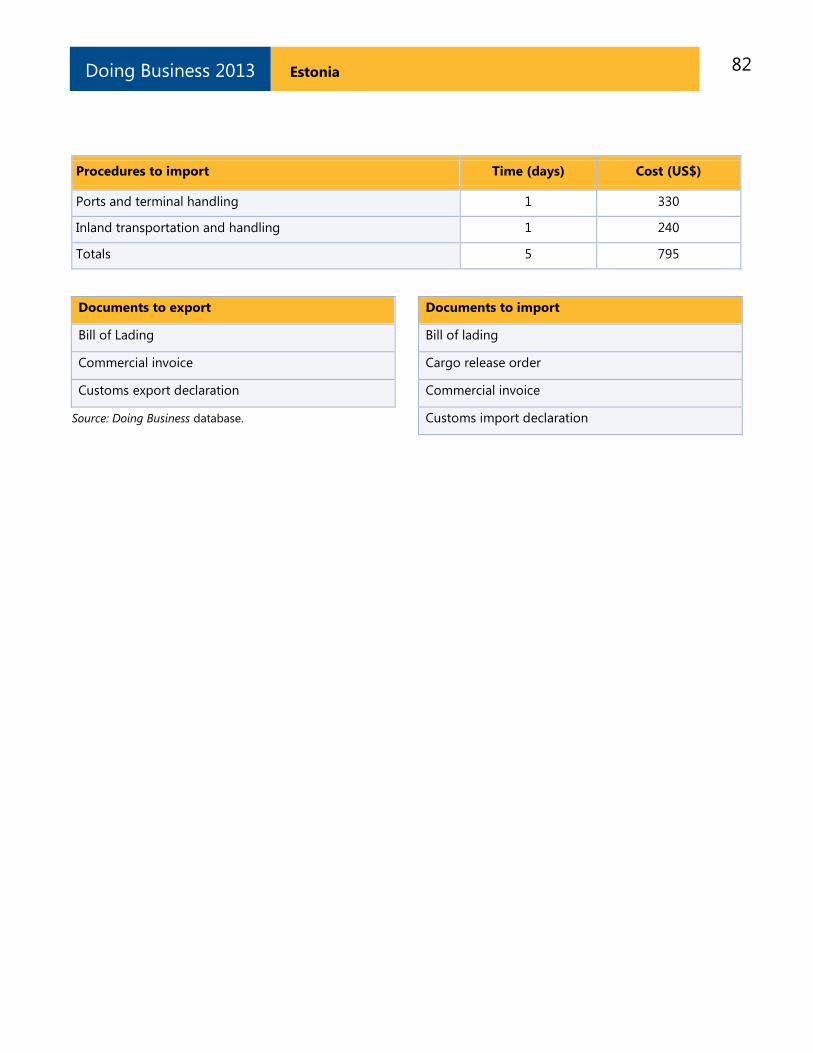
82 Estonia Doing Business 2013
Procedures to import Time (days) Cost (US$)
Ports and terminal handling 1 330
Inland transportation and handling 1 240
Totals 5 795
Documents to export
Bill of Lading
Commercial invoice
Customs export declaration
Source: Doing Business database.
Documents to import
Bill of lading Cargo release order Commercial invoice Customs import declaration
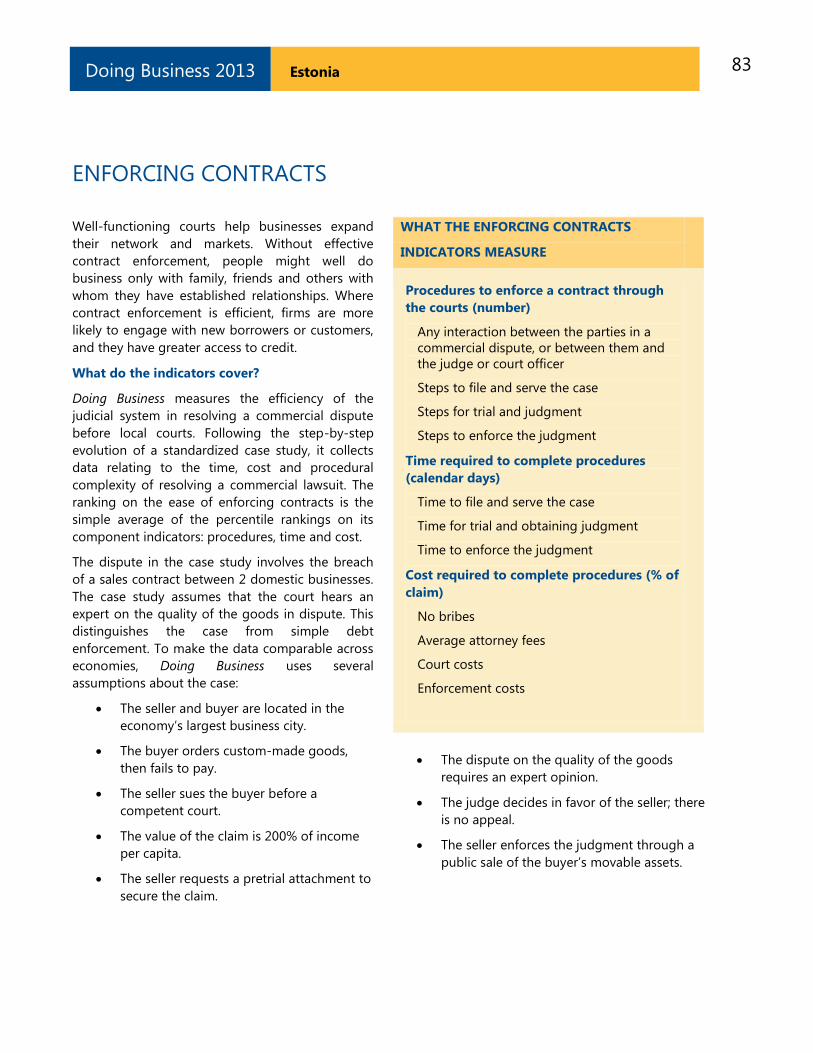
83 Estonia Doing Business 2013
ENFORCING CONTRACTS
Well-functioning courts help businesses expand
their network and markets. Without effective
contract enforcement, people might well do
business only with family, friends and others with
whom they have established relationships. Where
contract enforcement is efficient, firms are more
likely to engage with new borrowers or customers,
and they have greater access to credit.
What do the indicators cover?
Doing Business measures the efficiency of the
judicial system in resolving a commercial dispute
before local courts. Following the step-by-step
evolution of a standardized case study, it collects
data relating to the time, cost and procedural
complexity of resolving a commercial lawsuit. The
ranking on the ease of enforcing contracts is the
simple average of the percentile rankings on its
component indicators: procedures, time and cost.
The dispute in the case study involves the breach
of a sales contract between 2 domestic businesses.
The case study assumes that the court hears an
expert on the quality of the goods in dispute. This
distinguishes the case from simple debt
enforcement. To make the data comparable across
economies, Doing Business uses several
assumptions about the case:
The seller and buyer are located in the
economy‘s largest business city.
The buyer orders custom-made goods,
then fails to pay.
The seller sues the buyer before a
competent court.
The value of the claim is 200% of income
per capita.
The seller requests a pretrial attachment to
secure the claim.
WHAT THE ENFORCING CONTRACTS
INDICATORS MEASURE
Procedures to enforce a contract through
the courts (number)
Any interaction between the parties in a
commercial dispute, or between them and
the judge or court officer
Steps to file and serve the case
Steps for trial and judgment
Steps to enforce the judgment
Time required to complete procedures
(calendar days)
Time to file and serve the case
Time for trial and obtaining judgment
Time to enforce the judgment
Cost required to complete procedures (% of
claim)
No bribes
Average attorney fees
Court costs
Enforcement costs
The dispute on the quality of the goods
requires an expert opinion.
The judge decides in favor of the seller; there
is no appeal.
The seller enforces the judgment through a
public sale of the buyer‘s movable assets.
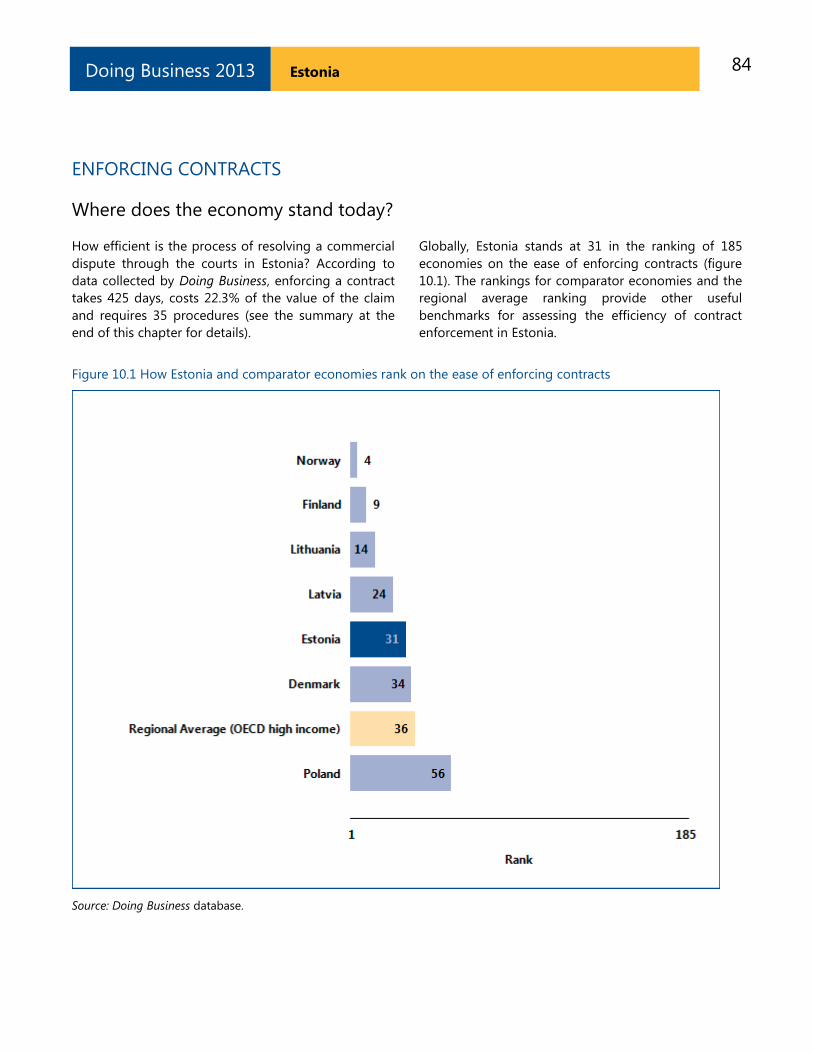
84 Estonia Doing Business 2013
ENFORCING CONTRACTS
Where does the economy stand today?
How efficient is the process of resolving a commercial
dispute through the courts in Estonia? According to
data collected by Doing Business, enforcing a contract
takes 425 days, costs 22.3% of the value of the claim
and requires 35 procedures (see the summary at the
end of this chapter for details).
Globally, Estonia stands at 31 in the ranking of 185
economies on the ease of enforcing contracts (figure
10.1). The rankings for comparator economies and the
regional average ranking provide other useful
benchmarks for assessing the efficiency of contract
enforcement in Estonia.
Figure 10.1 How Estonia and comparator economies rank on the ease of enforcing contracts
Source: Doing Business database.
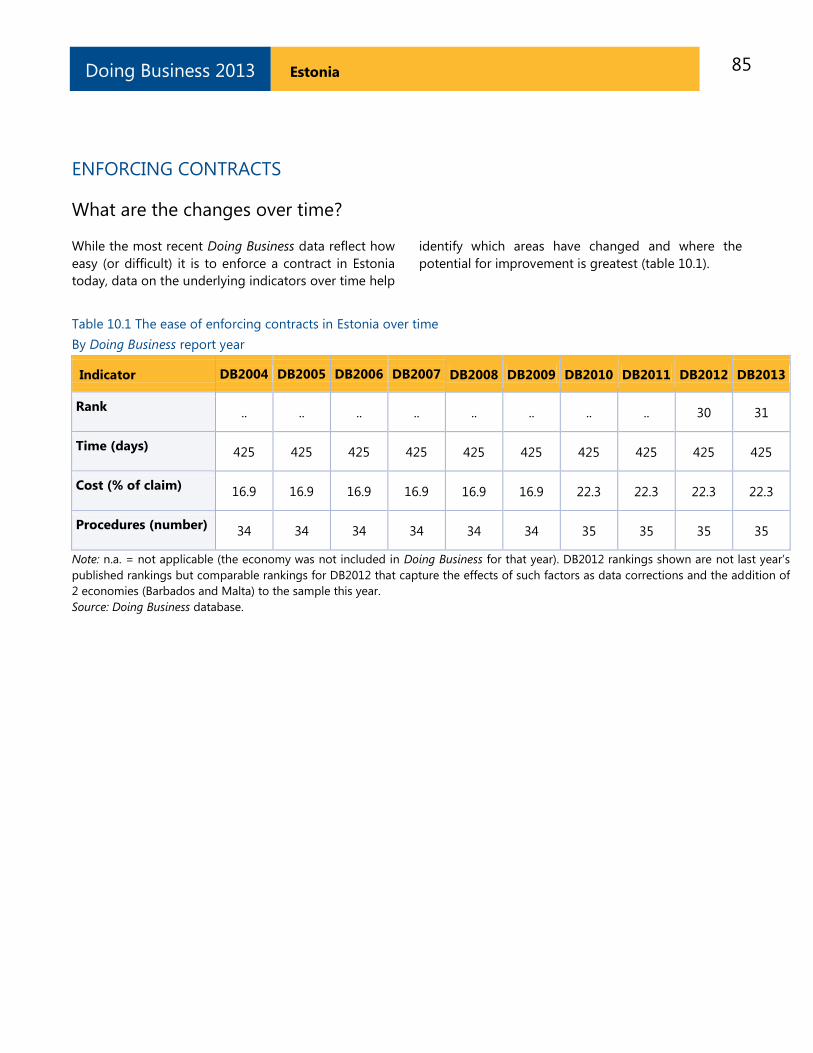
85 Estonia Doing Business 2013
ENFORCING CONTRACTS
What are the changes over time?
While the most recent Doing Business data reflect how
easy (or difficult) it is to enforce a contract in Estonia
today, data on the underlying indicators over time help
identify which areas have changed and where the
potential for improvement is greatest (table 10.1).
Table 10.1 The ease of enforcing contracts in Estonia over time
By Doing Business report year
Indicator DB2004 DB2005 DB2006 DB2007 DB2008 DB2009 DB2010 DB2011 DB2012 DB2013
Rank .. .. .. .. .. .. .. .. 30 31
Time (days) 425 425 425 425 425 425 425 425 425 425
Cost (% of claim) 16.9 16.9 16.9 16.9 16.9 16.9 22.3 22.3 22.3 22.3
Procedures (number) 34 34 34 34 34 34 35 35 35 35
Note: n.a. = not applicable (the economy was not included in Doing Business for that year). DB2012 rankings shown are not last year‘s
published rankings but comparable rankings for DB2012 that capture the effects of such factors as data corrections and the addition of
2 economies (Barbados and Malta) to the sample this year.
Source: Doing Business database.
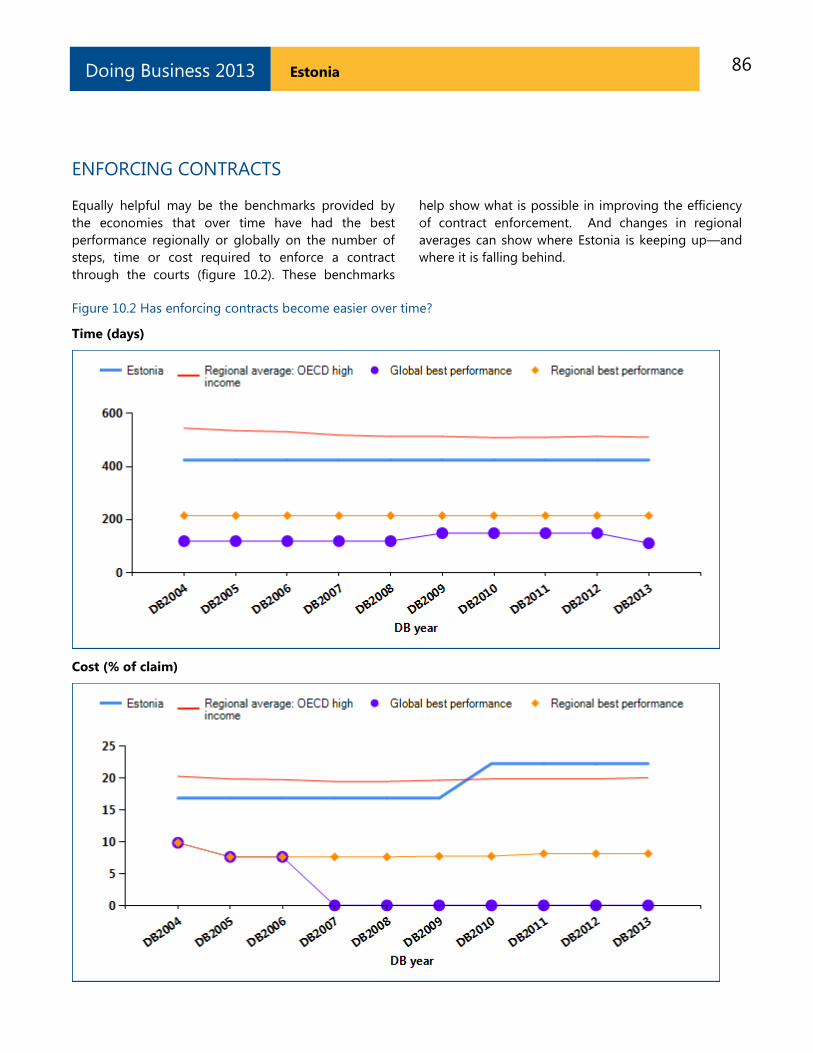
86 Estonia Doing Business 2013
ENFORCING CONTRACTS
Equally helpful may be the benchmarks provided by
the economies that over time have had the best
performance regionally or globally on the number of
steps, time or cost required to enforce a contract
through the courts (figure 10.2). These benchmarks
help show what is possible in improving the efficiency
of contract enforcement. And changes in regional
averages can show where Estonia is keeping up—and
where it is falling behind.
Figure 10.2 Has enforcing contracts become easier over time?
Time (days)
Cost (% of claim)
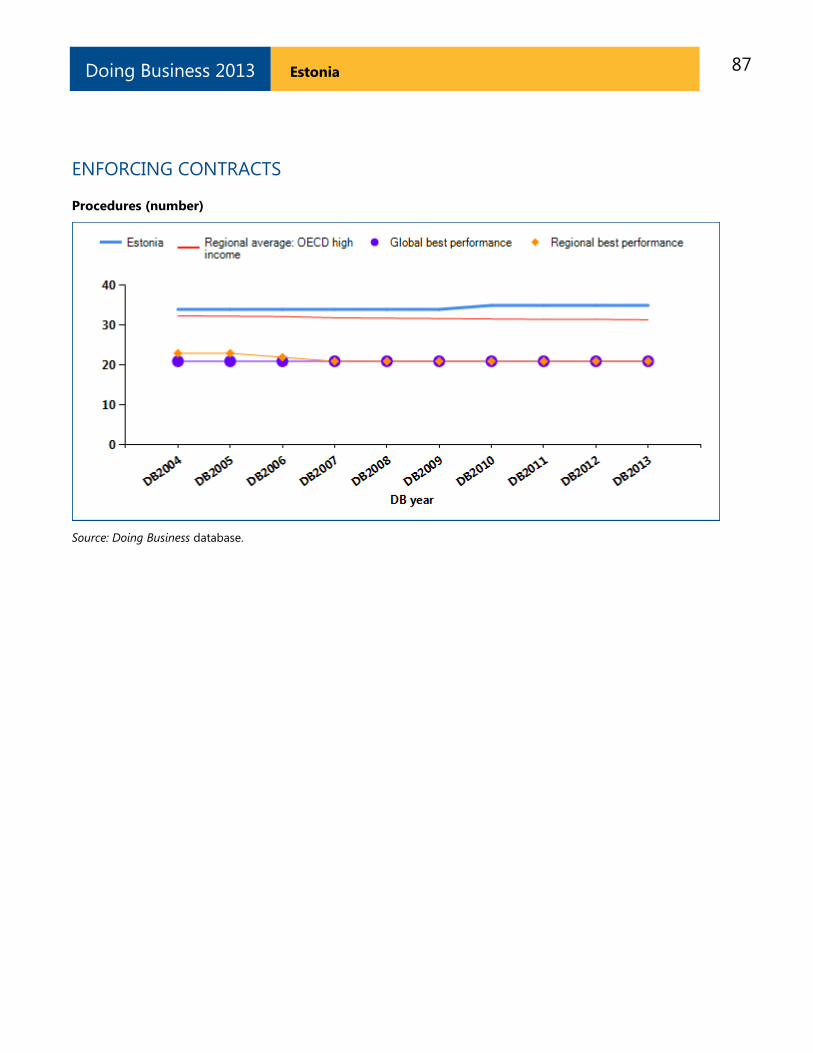
87 Estonia Doing Business 2013
ENFORCING CONTRACTS
Procedures (number)
Source: Doing Business database.
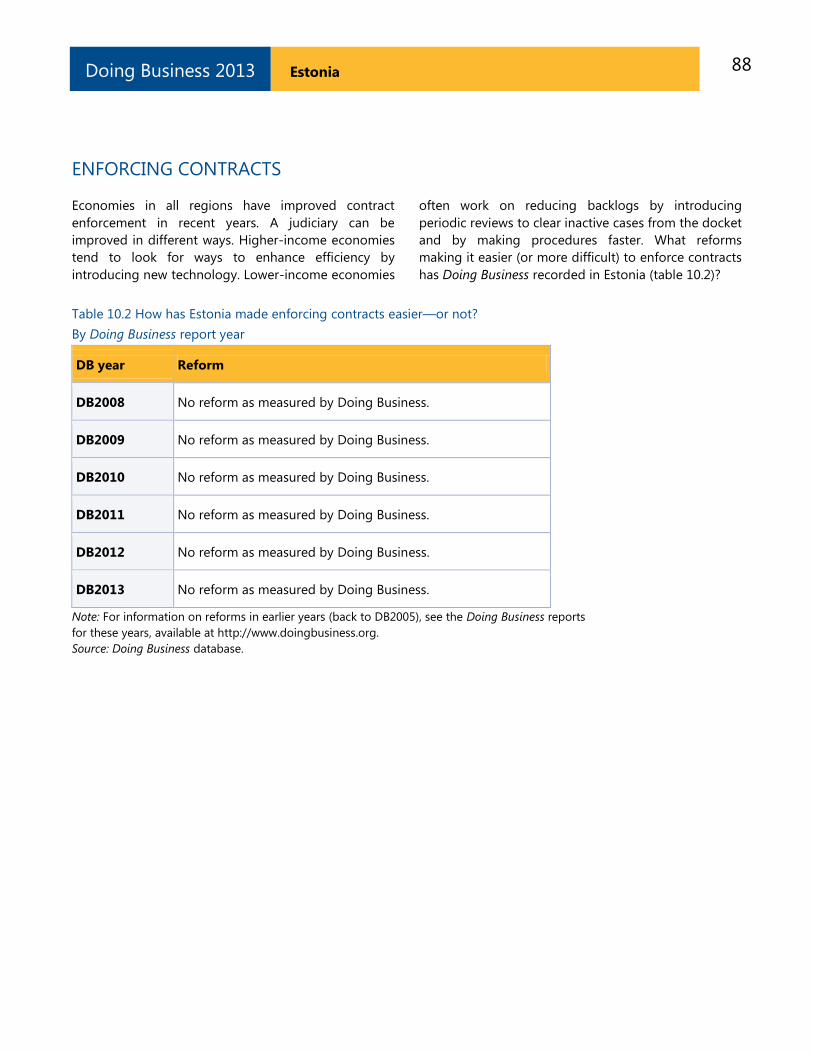
88 Estonia Doing Business 2013
ENFORCING CONTRACTS
Economies in all regions have improved contract
enforcement in recent years. A judiciary can be
improved in different ways. Higher-income economies
tend to look for ways to enhance efficiency by
introducing new technology. Lower-income economies
often work on reducing backlogs by introducing
periodic reviews to clear inactive cases from the docket
and by making procedures faster. What reforms
making it easier (or more difficult) to enforce contracts
has Doing Business recorded in Estonia (table 10.2)?
Table 10.2 How has Estonia made enforcing contracts easier—or not?
By Doing Business report year
DB year Reform
DB2008 No reform as measured by Doing Business.
DB2009 No reform as measured by Doing Business.
DB2010 No reform as measured by Doing Business.
DB2011 No reform as measured by Doing Business.
DB2012 No reform as measured by Doing Business.
DB2013 No reform as measured by Doing Business.
Note: For information on reforms in earlier years (back to DB2005), see the Doing Business reports
for these years, available at http://www.doingbusiness.org.
Source: Doing Business database.
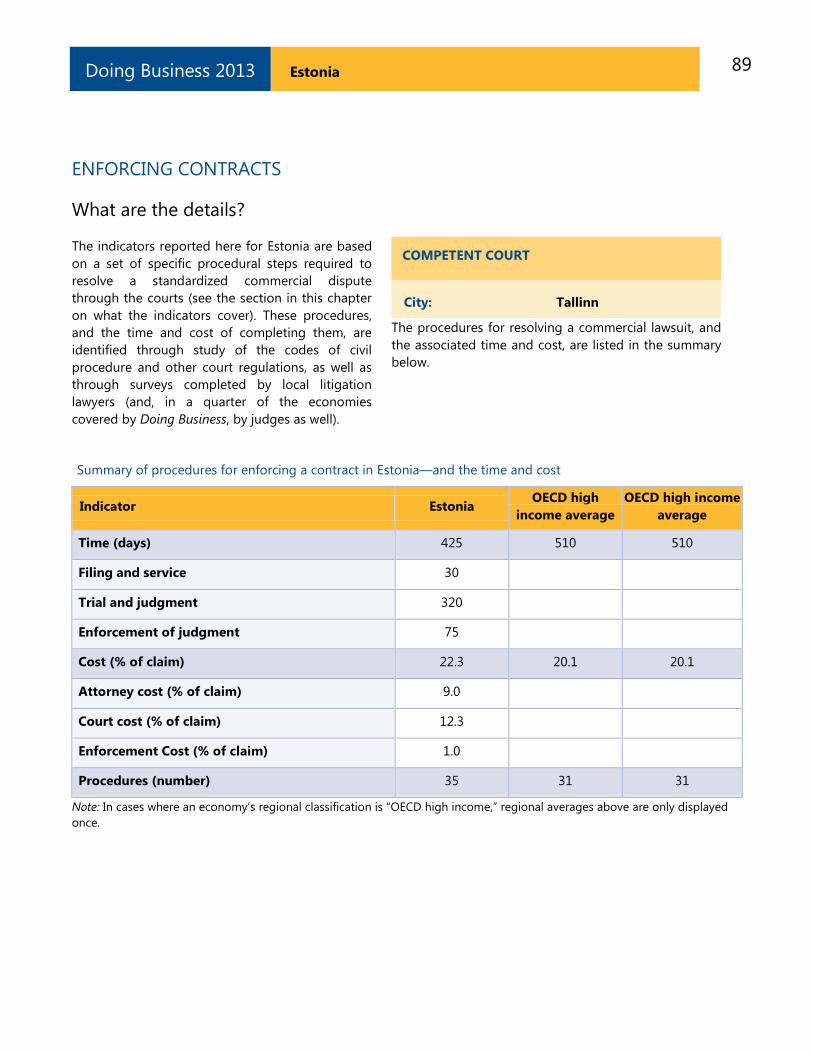
89 Estonia Doing Business 2013
ENFORCING CONTRACTS
What are the details?
The indicators reported here for Estonia are based
on a set of specific procedural steps required to
resolve a standardized commercial dispute
through the courts (see the section in this chapter
on what the indicators cover). These procedures,
and the time and cost of completing them, are
identified through study of the codes of civil
procedure and other court regulations, as well as
through surveys completed by local litigation
lawyers (and, in a quarter of the economies
covered by Doing Business, by judges as well).
COMPETENT COURT
City: Tallinn
The procedures for resolving a commercial lawsuit, and
the associated time and cost, are listed in the summary
below.
Summary of procedures for enforcing a contract in Estonia—and the time and cost
Indicator Estonia OECD high
income average
OECD high income
average
Time (days) 425 510 510
Filing and service 30
Trial and judgment 320
Enforcement of judgment 75
Cost (% of claim) 22.3 20.1 20.1
Attorney cost (% of claim) 9.0
Court cost (% of claim) 12.3
Enforcement Cost (% of claim) 1.0
Procedures (number) 35 31 31
Note: In cases where an economy‘s regional classification is ―OECD high income,‖ regional averages above are only displayed
once.
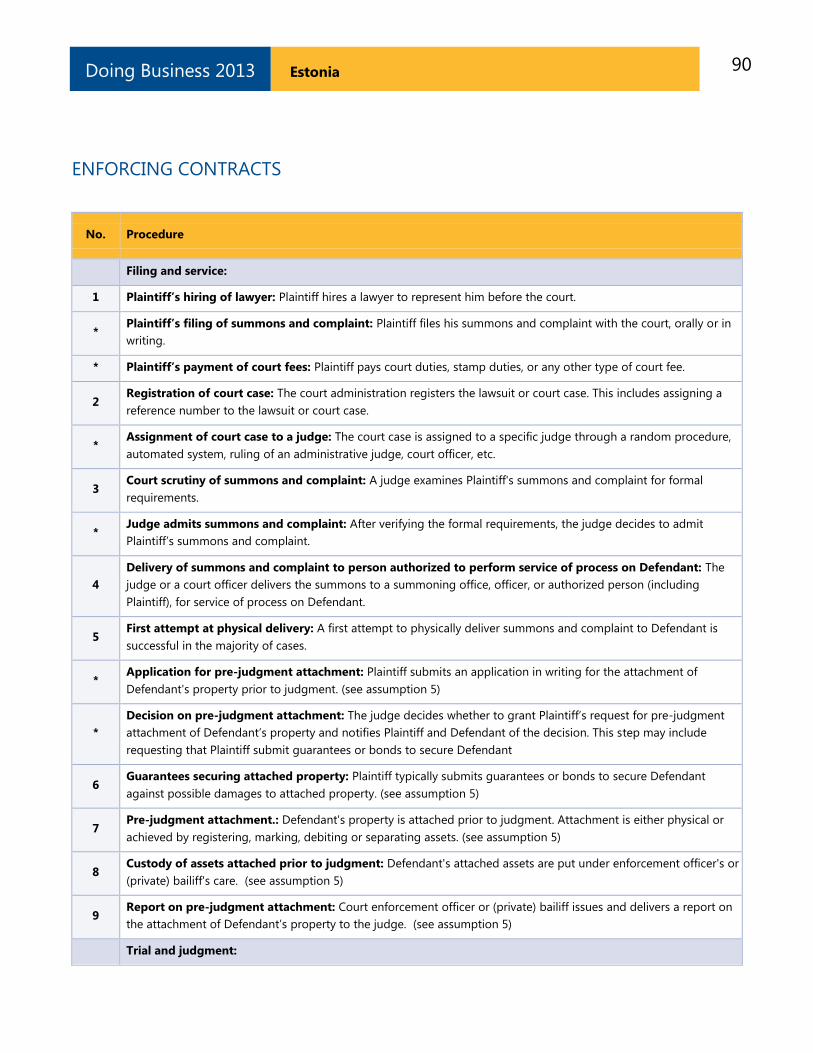
90 Estonia Doing Business 2013
ENFORCING CONTRACTS
No. Procedure
Filing and service:
1 Plaintiff’s hiring of lawyer: Plaintiff hires a lawyer to represent him before the court.
* Plaintiff’s filing of summons and complaint: Plaintiff files his summons and complaint with the court, orally or in
writing.
* Plaintiff’s payment of court fees: Plaintiff pays court duties, stamp duties, or any other type of court fee.
2 Registration of court case: The court administration registers the lawsuit or court case. This includes assigning a
reference number to the lawsuit or court case.
* Assignment of court case to a judge: The court case is assigned to a specific judge through a random procedure,
automated system, ruling of an administrative judge, court officer, etc.
3 Court scrutiny of summons and complaint: A judge examines Plaintiff's summons and complaint for formal
requirements.
* Judge admits summons and complaint: After verifying the formal requirements, the judge decides to admit
Plaintiff‘s summons and complaint.
4
Delivery of summons and complaint to person authorized to perform service of process on Defendant: The
judge or a court officer delivers the summons to a summoning office, officer, or authorized person (including
Plaintiff), for service of process on Defendant.
5 First attempt at physical delivery: A first attempt to physically deliver summons and complaint to Defendant is
successful in the majority of cases.
* Application for pre-judgment attachment: Plaintiff submits an application in writing for the attachment of
Defendant's property prior to judgment. (see assumption 5)
*
Decision on pre-judgment attachment: The judge decides whether to grant Plaintiff‘s request for pre-judgment
attachment of Defendant‘s property and notifies Plaintiff and Defendant of the decision. This step may include
requesting that Plaintiff submit guarantees or bonds to secure Defendant
6 Guarantees securing attached property: Plaintiff typically submits guarantees or bonds to secure Defendant
against possible damages to attached property. (see assumption 5)
7 Pre-judgment attachment.: Defendant's property is attached prior to judgment. Attachment is either physical or
achieved by registering, marking, debiting or separating assets. (see assumption 5)
8 Custody of assets attached prior to judgment: Defendant's attached assets are put under enforcement officer's or
(private) bailiff's care. (see assumption 5)
9 Report on pre-judgment attachment: Court enforcement officer or (private) bailiff issues and delivers a report on
the attachment of Defendant‘s property to the judge. (see assumption 5)
Trial and judgment:
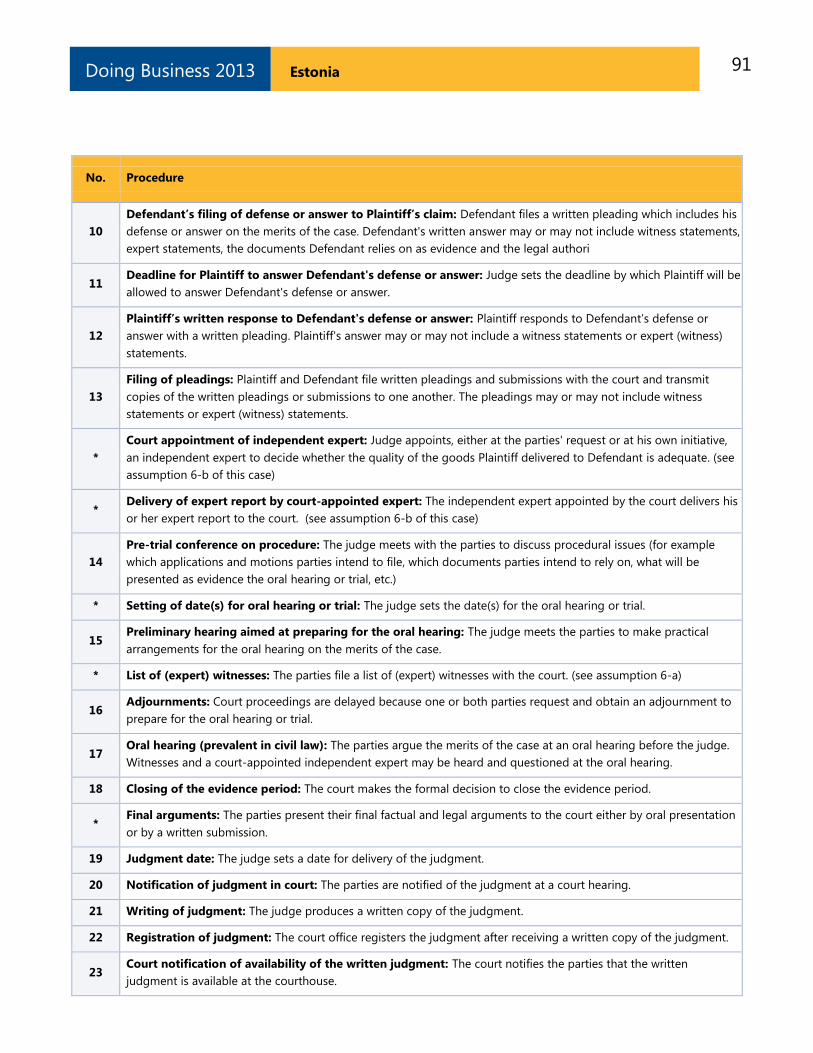
91 Estonia Doing Business 2013
No. Procedure
10
Defendant’s filing of defense or answer to Plaintiff’s claim: Defendant files a written pleading which includes his
defense or answer on the merits of the case. Defendant's written answer may or may not include witness statements,
expert statements, the documents Defendant relies on as evidence and the legal authori
11 Deadline for Plaintiff to answer Defendant's defense or answer: Judge sets the deadline by which Plaintiff will be
allowed to answer Defendant's defense or answer.
12
Plaintiff’s written response to Defendant's defense or answer: Plaintiff responds to Defendant‘s defense or
answer with a written pleading. Plaintiff's answer may or may not include a witness statements or expert (witness)
statements.
13
Filing of pleadings: Plaintiff and Defendant file written pleadings and submissions with the court and transmit
copies of the written pleadings or submissions to one another. The pleadings may or may not include witness
statements or expert (witness) statements.
*
Court appointment of independent expert: Judge appoints, either at the parties' request or at his own initiative,
an independent expert to decide whether the quality of the goods Plaintiff delivered to Defendant is adequate. (see
assumption 6-b of this case)
* Delivery of expert report by court-appointed expert: The independent expert appointed by the court delivers his
or her expert report to the court. (see assumption 6-b of this case)
14
Pre-trial conference on procedure: The judge meets with the parties to discuss procedural issues (for example
which applications and motions parties intend to file, which documents parties intend to rely on, what will be
presented as evidence the oral hearing or trial, etc.)
* Setting of date(s) for oral hearing or trial: The judge sets the date(s) for the oral hearing or trial.
15 Preliminary hearing aimed at preparing for the oral hearing: The judge meets the parties to make practical
arrangements for the oral hearing on the merits of the case.
* List of (expert) witnesses: The parties file a list of (expert) witnesses with the court. (see assumption 6-a)
16 Adjournments: Court proceedings are delayed because one or both parties request and obtain an adjournment to
prepare for the oral hearing or trial.
17 Oral hearing (prevalent in civil law): The parties argue the merits of the case at an oral hearing before the judge.
Witnesses and a court-appointed independent expert may be heard and questioned at the oral hearing.
18 Closing of the evidence period: The court makes the formal decision to close the evidence period.
* Final arguments: The parties present their final factual and legal arguments to the court either by oral presentation
or by a written submission.
19 Judgment date: The judge sets a date for delivery of the judgment.
20 Notification of judgment in court: The parties are notified of the judgment at a court hearing.
21 Writing of judgment: The judge produces a written copy of the judgment.
22 Registration of judgment: The court office registers the judgment after receiving a written copy of the judgment.
23 Court notification of availability of the written judgment: The court notifies the parties that the written
judgment is available at the courthouse.
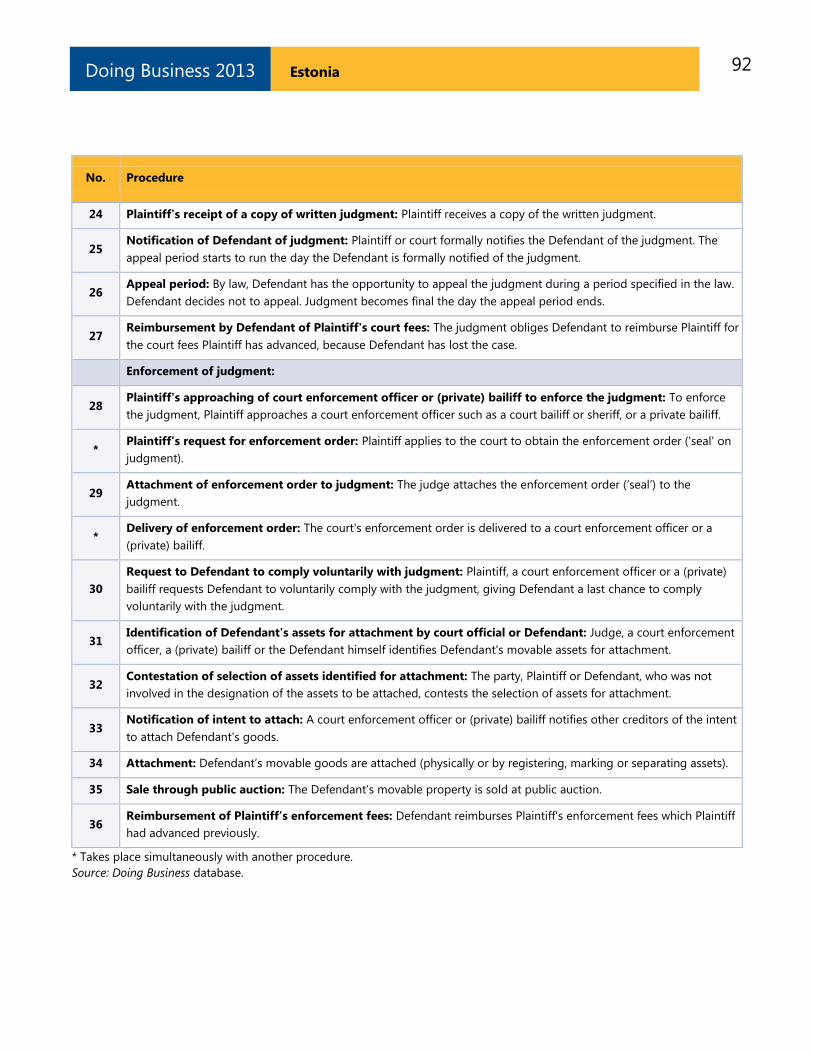
92 Estonia Doing Business 2013
No. Procedure
24 Plaintiff's receipt of a copy of written judgment: Plaintiff receives a copy of the written judgment.
25 Notification of Defendant of judgment: Plaintiff or court formally notifies the Defendant of the judgment. The
appeal period starts to run the day the Defendant is formally notified of the judgment.
26 Appeal period: By law, Defendant has the opportunity to appeal the judgment during a period specified in the law.
Defendant decides not to appeal. Judgment becomes final the day the appeal period ends.
27 Reimbursement by Defendant of Plaintiff's court fees: The judgment obliges Defendant to reimburse Plaintiff for
the court fees Plaintiff has advanced, because Defendant has lost the case.
Enforcement of judgment:
28 Plaintiff's approaching of court enforcement officer or (private) bailiff to enforce the judgment: To enforce
the judgment, Plaintiff approaches a court enforcement officer such as a court bailiff or sheriff, or a private bailiff.
* Plaintiff’s request for enforcement order: Plaintiff applies to the court to obtain the enforcement order ('seal' on
judgment).
29 Attachment of enforcement order to judgment: The judge attaches the enforcement order (‗seal‘) to the
judgment.
* Delivery of enforcement order: The court's enforcement order is delivered to a court enforcement officer or a
(private) bailiff.
30
Request to Defendant to comply voluntarily with judgment: Plaintiff, a court enforcement officer or a (private)
bailiff requests Defendant to voluntarily comply with the judgment, giving Defendant a last chance to comply
voluntarily with the judgment.
31 Identification of Defendant's assets for attachment by court official or Defendant: Judge, a court enforcement
officer, a (private) bailiff or the Defendant himself identifies Defendant's movable assets for attachment.
32 Contestation of selection of assets identified for attachment: The party, Plaintiff or Defendant, who was not
involved in the designation of the assets to be attached, contests the selection of assets for attachment.
33 Notification of intent to attach: A court enforcement officer or (private) bailiff notifies other creditors of the intent
to attach Defendant's goods.
34 Attachment: Defendant‘s movable goods are attached (physically or by registering, marking or separating assets).
35 Sale through public auction: The Defendant‘s movable property is sold at public auction.
36 Reimbursement of Plaintiff’s enforcement fees: Defendant reimburses Plaintiff's enforcement fees which Plaintiff
had advanced previously.
* Takes place simultaneously with another procedure.
Source: Doing Business database.
93 Estonia Doing Business 2013
RESOLVING INSOLVENCY
A robust bankruptcy system functions as a filter,
ensuring the survival of economically efficient
companies and reallocating the resources of
inefficient ones. Fast and cheap insolvency
proceedings result in the speedy return of
businesses to normal operation and increase
returns to creditors. By improving the expectations
of creditors and debtors about the outcome of
insolvency proceedings, well-functioning
insolvency systems can facilitate access to finance,
save more viable businesses and thereby improve
growth and sustainability in the economy overall.
What do the indicators cover?
Doing Business studies the time, cost and outcome
of insolvency proceedings involving domestic
entities. It does not measure insolvency
proceedings of individuals and financial
institutions. The data are derived from survey
responses by local insolvency practitioners and
verified through a study of laws and regulations as
well as public information on bankruptcy systems.
The ranking on the ease of resolving insolvency is
based on the recovery rate, which is recorded as
cents on the dollar recouped by creditors through
reorganization, liquidation or debt enforcement
(foreclosure) proceedings. The recovery rate is a
function of time, cost and other factors, such as
lending rate and the likelihood of the company
continuing to operate.
To make the data comparable across economies,
Doing Business uses several assumptions about the
business and the case. It assumes that the
company:
Is a domestically owned, limited liability
company operating a hotel.
Operates in the economy‘s largest business
city.
WHAT THE RESOLVING INSOLVENCY
INDICATORS MEASURE
Time required to recover debt (years)
Measured in calendar years
Appeals and requests for extension are
included
Cost required to recover debt (% of debtor’s
estate)
Measured as percentage of estate value
Court fees
Fees of insolvency administrators
Lawyers‘ fees
Assessors‘ and auctioneers‘ fees
Other related fees
Recovery rate for creditors (cents on the
dollar)
Measures the cents on the dollar recovered
by creditors
Present value of debt recovered
Official costs of the insolvency proceedings
are deducted
Depreciation of furniture is taken into
account
Outcome for the business (survival or not)
affects the maximum value that can be
recovered
Has 201 employees, 1 main secured creditor
and 50 unsecured creditors.
Has a higher value as a going concern—and
the efficient outcome is either reorganization
or sale as a going concern, not piecemeal
liquidation.
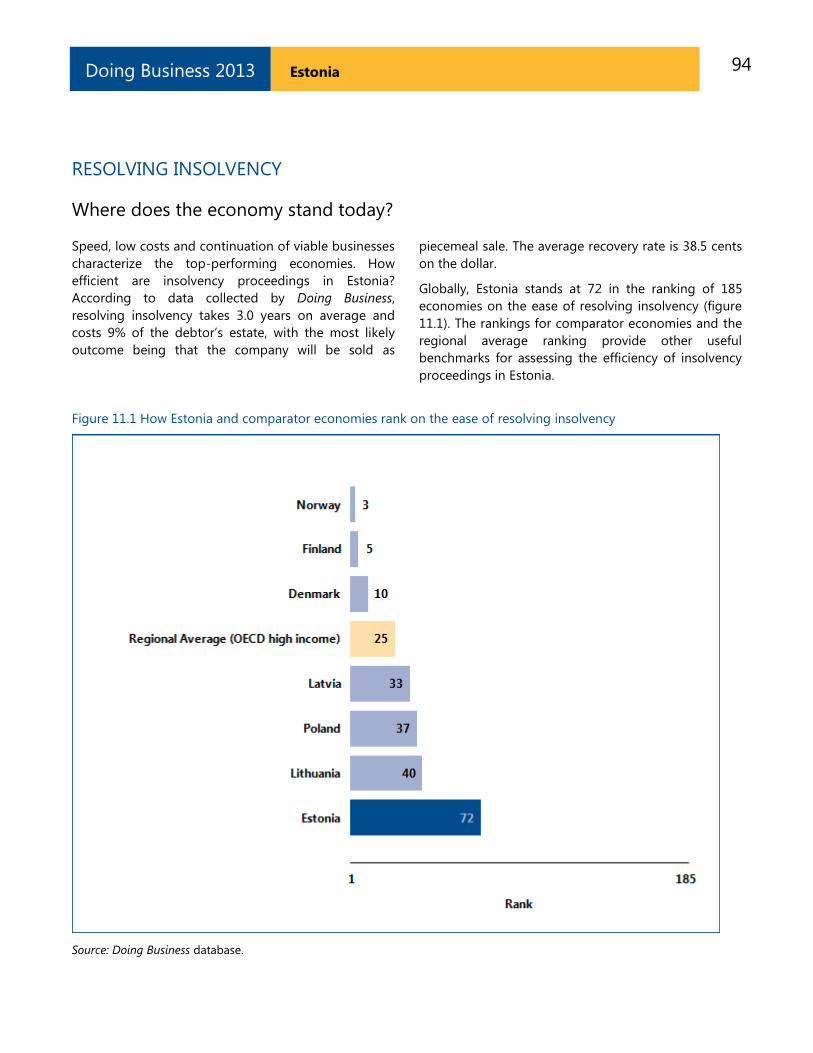
94 Estonia Doing Business 2013
RESOLVING INSOLVENCY
Where does the economy stand today?
Speed, low costs and continuation of viable businesses
characterize the top-performing economies. How
efficient are insolvency proceedings in Estonia?
According to data collected by Doing Business,
resolving insolvency takes 3.0 years on average and
costs 9% of the debtor‘s estate, with the most likely
outcome being that the company will be sold as
piecemeal sale. The average recovery rate is 38.5 cents
on the dollar.
Globally, Estonia stands at 72 in the ranking of 185
economies on the ease of resolving insolvency (figure
11.1). The rankings for comparator economies and the
regional average ranking provide other useful
benchmarks for assessing the efficiency of insolvency
proceedings in Estonia.
Figure 11.1 How Estonia and comparator economies rank on the ease of resolving insolvency
Source: Doing Business database.
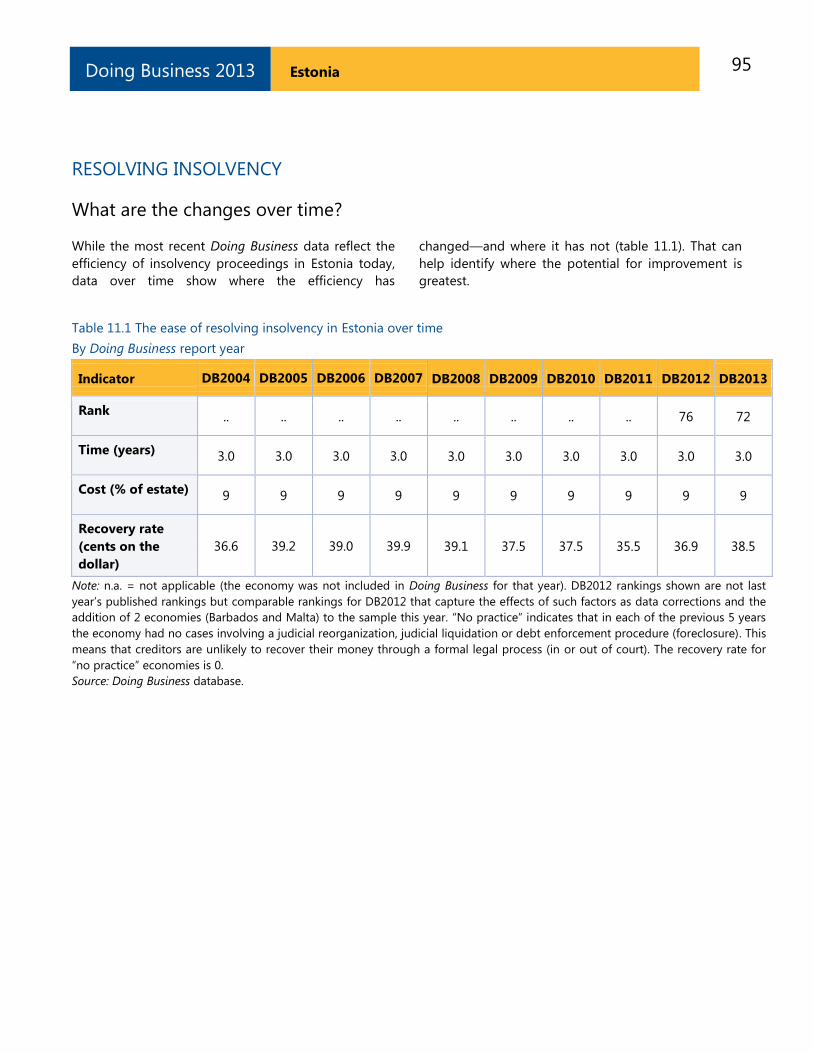
95 Estonia Doing Business 2013
RESOLVING INSOLVENCY
What are the changes over time?
While the most recent Doing Business data reflect the
efficiency of insolvency proceedings in Estonia today,
data over time show where the efficiency has
changed—and where it has not (table 11.1). That can
help identify where the potential for improvement is
greatest.
Table 11.1 The ease of resolving insolvency in Estonia over time
By Doing Business report year
Indicator DB2004 DB2005 DB2006 DB2007 DB2008 DB2009 DB2010 DB2011 DB2012 DB2013
Rank .. .. .. .. .. .. .. .. 76 72
Time (years) 3.0 3.0 3.0 3.0 3.0 3.0 3.0 3.0 3.0 3.0
Cost (% of estate) 9 9 9 9 9 9 9 9 9 9
Recovery rate
(cents on the
dollar)
36.6 39.2 39.0 39.9 39.1 37.5 37.5 35.5 36.9 38.5
Note: n.a. = not applicable (the economy was not included in Doing Business for that year). DB2012 rankings shown are not last
year‘s published rankings but comparable rankings for DB2012 that capture the effects of such factors as data corrections and the
addition of 2 economies (Barbados and Malta) to the sample this year. ―No practice‖ indicates that in each of the previous 5 years
the economy had no cases involving a judicial reorganization, judicial liquidation or debt enforcement procedure (foreclosure). This
means that creditors are unlikely to recover their money through a formal legal process (in or out of court). The recovery rate for
―no practice‖ economies is 0.
Source: Doing Business database.
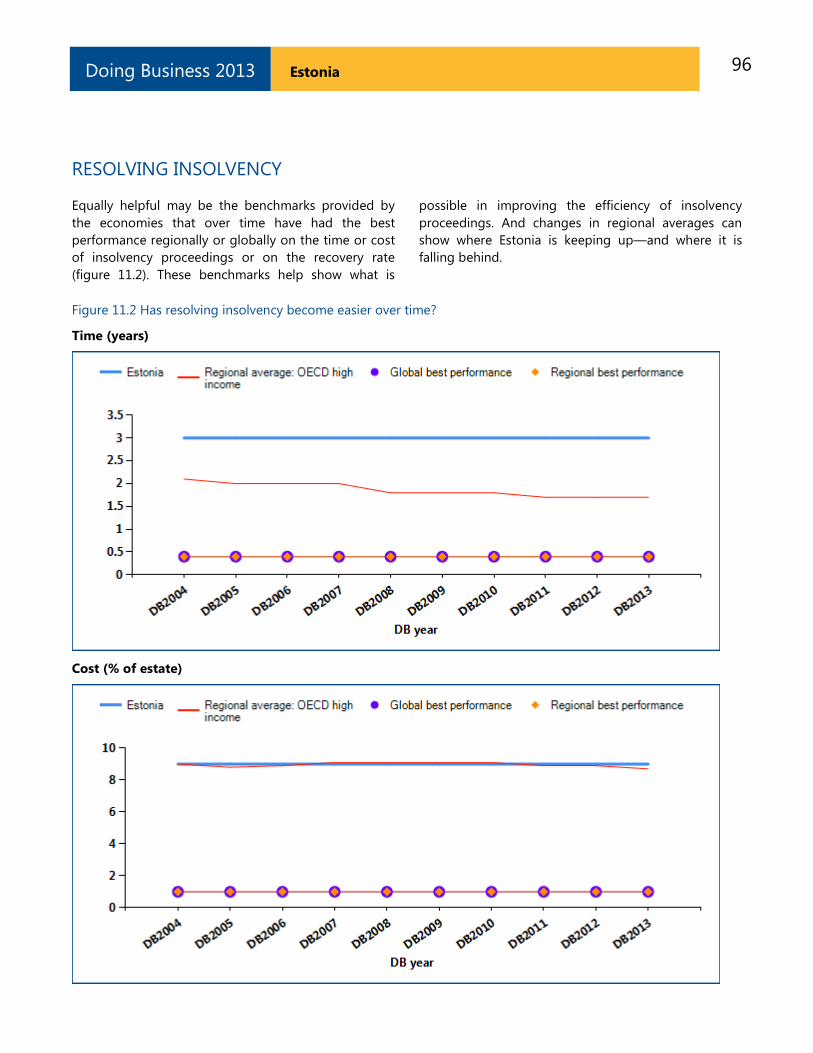
96 Estonia Doing Business 2013
RESOLVING INSOLVENCY
Equally helpful may be the benchmarks provided by
the economies that over time have had the best
performance regionally or globally on the time or cost
of insolvency proceedings or on the recovery rate
(figure 11.2). These benchmarks help show what is
possible in improving the efficiency of insolvency
proceedings. And changes in regional averages can
show where Estonia is keeping up—and where it is
falling behind.
Figure 11.2 Has resolving insolvency become easier over time?
Time (years)
Cost (% of estate)
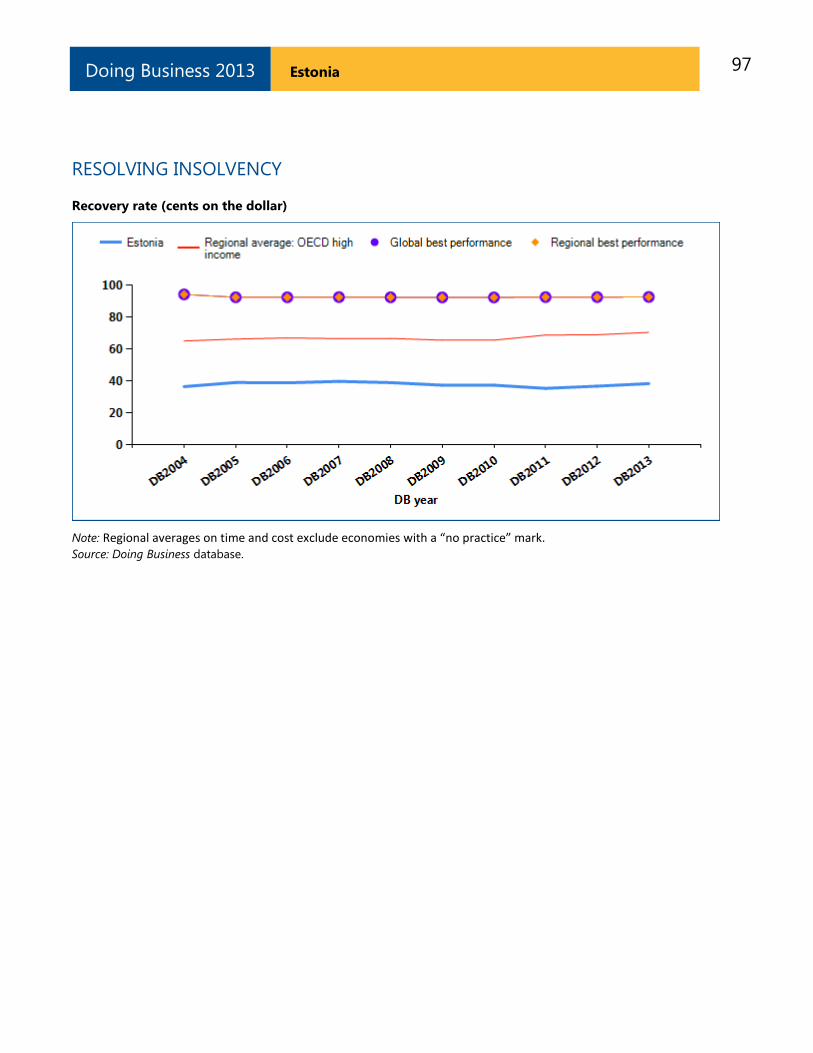
97 Estonia Doing Business 2013
RESOLVING INSOLVENCY
Recovery rate (cents on the dollar)
Note: Regional averages on time and cost exclude economies with a “no practice” mark. Source: Doing Business database.
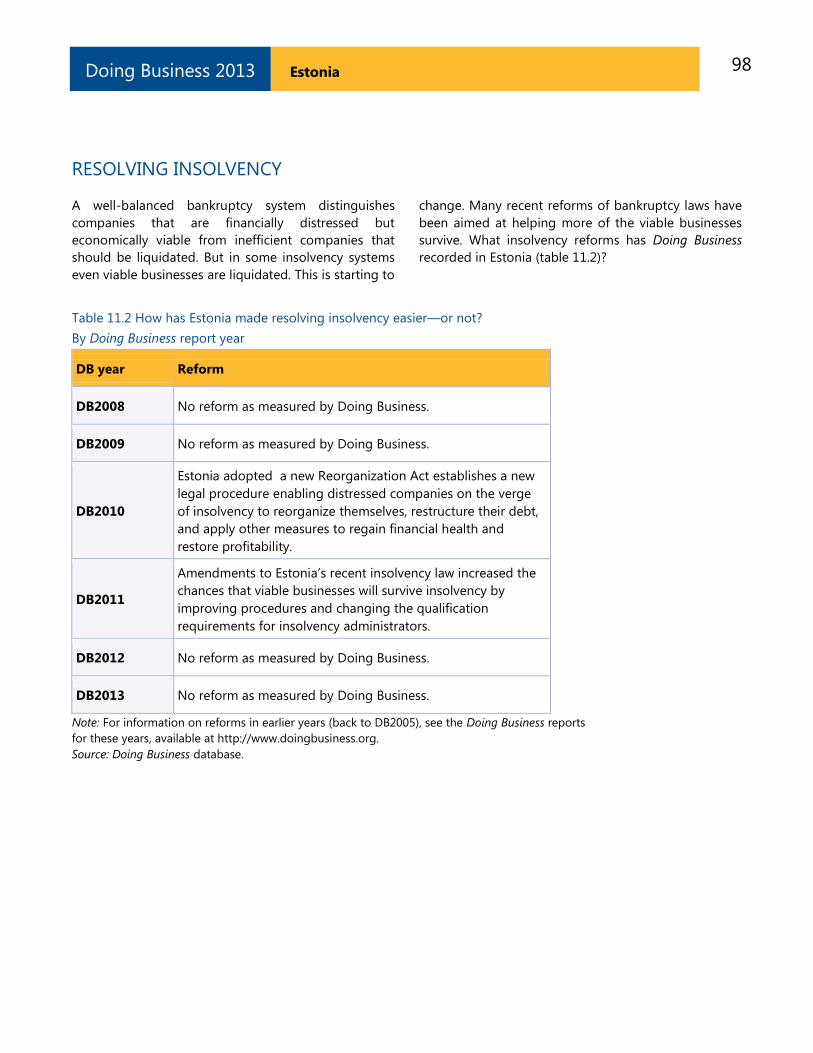
98 Estonia Doing Business 2013
RESOLVING INSOLVENCY
A well-balanced bankruptcy system distinguishes
companies that are financially distressed but
economically viable from inefficient companies that
should be liquidated. But in some insolvency systems
even viable businesses are liquidated. This is starting to
change. Many recent reforms of bankruptcy laws have
been aimed at helping more of the viable businesses
survive. What insolvency reforms has Doing Business
recorded in Estonia (table 11.2)?
Table 11.2 How has Estonia made resolving insolvency easier—or not?
By Doing Business report year
DB year Reform
DB2008 No reform as measured by Doing Business.
DB2009 No reform as measured by Doing Business.
DB2010
Estonia adopted a new Reorganization Act establishes a new
legal procedure enabling distressed companies on the verge
of insolvency to reorganize themselves, restructure their debt,
and apply other measures to regain financial health and
restore profitability.
DB2011
Amendments to Estonia‘s recent insolvency law increased the
chances that viable businesses will survive insolvency by
improving procedures and changing the qualification
requirements for insolvency administrators.
DB2012 No reform as measured by Doing Business.
DB2013 No reform as measured by Doing Business.
Note: For information on reforms in earlier years (back to DB2005), see the Doing Business reports
for these years, available at http://www.doingbusiness.org.
Source: Doing Business database.
99 Estonia Doing Business 2013
EMPLOYING WORKERS
Doing Business measures flexibility in the regulation of
employment, specifically as it affects the hiring and
redundancy of workers and the rigidity of working
hours. From 2007 to 2011 improvements were made to
align the methodology for the employing workers
indicators with the letter and spirit of the International
Labour Organization (ILO) conventions. Only 4 of the
188 ILO conventions cover areas measured by Doing
Business: employee termination, weekend work,
holiday with pay and night work. The Doing Business
methodology is fully consistent with these 4
conventions. The ILO conventions covering areas
related to the employing workers indicators do not
include the ILO core labor standards—8 conventions
covering the right to collective bargaining, the
elimination of forced labor, the abolition of child labor
and equitable treatment in employment practices.
Between 2009 and 2011 the World Bank Group worked
with a consultative group—including labor lawyers,
employer and employee representatives, and experts
from the ILO, the Organisation for Economic Co-
operation and Development, civil society and the
private sector—to review the employing workers
methodology and explore future areas of research.
A full report with the conclusions of the consultative
group is available at http://www.doingbusiness.org/
methodology/employing-workers.
Doing Business 2013 does not present rankings of
economies on the employing workers indicators or
include the topic in the aggregate ranking on the ease
of doing business. The report does present the data on
the employing workers indicators in an annex. Detailed
data collected on labor regulations are available on the
Doing Business website (http://www.doing business.org).
Particular data for Estonia are presented here without
scoring.
To make the data on employing workers comparable
across economies, several assumptions about the
worker and the business are used.
The worker:
Earns a salary plus benefits equal to the
economy‘s average wage during the entire
period of his employment.
Has a pay period that is the most common for
workers in the economy.
Is a lawful citizen who belongs to the same
race and religion as the majority of the
economy‘s population.
Resides in the economy‘s largest business city.
Is not a member of a labor union, unless
membership is mandatory.
The business:
Is a limited liability company.
Operates in the economy‘s largest business
city.
Is 100% domestically owned.
Operates in the manufacturing sector.
Has 60 employees.
Is subject to collective bargaining agreements
in economies where such agreements cover
more than half the manufacturing sector and
apply even to firms not party to them.
Abides by every law and regulation but does
not grant workers more benefits than
mandated by law, regulation or (if applicable)
collective bargaining agreement.
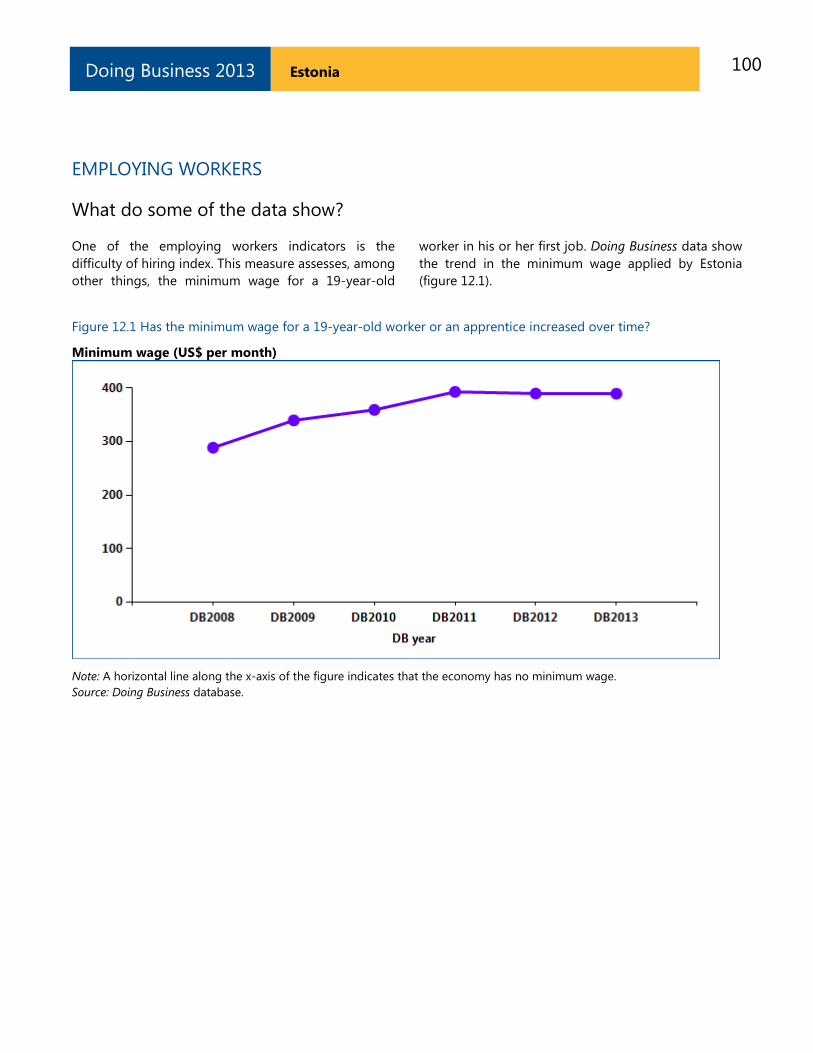
100 Estonia Doing Business 2013
EMPLOYING WORKERS
What do some of the data show?
One of the employing workers indicators is the
difficulty of hiring index. This measure assesses, among
other things, the minimum wage for a 19-year-old
worker in his or her first job. Doing Business data show
the trend in the minimum wage applied by Estonia
(figure 12.1).
Figure 12.1 Has the minimum wage for a 19-year-old worker or an apprentice increased over time?
Minimum wage (US$ per month)
Note: A horizontal line along the x-axis of the figure indicates that the economy has no minimum wage.
Source: Doing Business database.
101 Estonia Doing Business 2013
EMPLOYING WORKERS
Employment laws are needed to protect workers from
arbitrary or unfair treatment and to ensure efficient
contracting between employers and workers. Many
economies that changed their labor regulations in the
past 4 years did so in ways that increased labor market
flexibility. What changes did Estonia adopt that
affected the Doing Business indicators on employing
workers (table 12.1)?
Table 12.1 What changes did Estonia make in employing workers in 2012?
Reform
No reform as measured by Doing Business.
Source: Doing Business database.
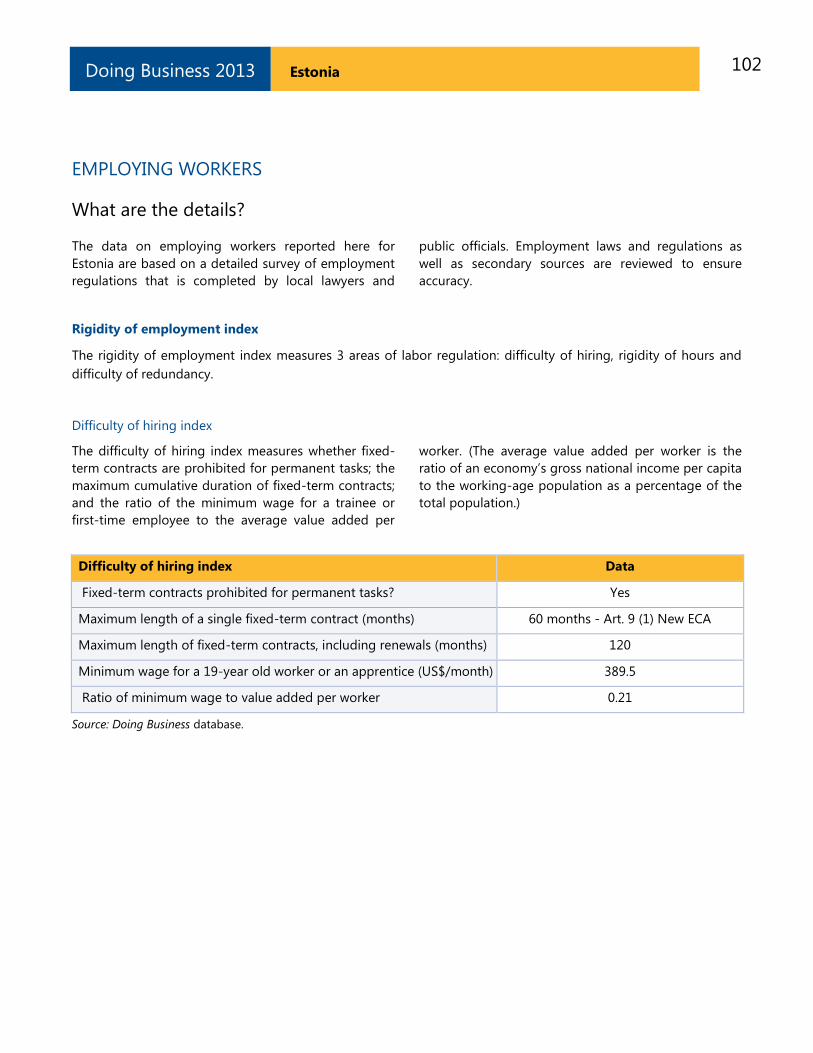
102 Estonia Doing Business 2013
EMPLOYING WORKERS
What are the details?
The data on employing workers reported here for
Estonia are based on a detailed survey of employment
regulations that is completed by local lawyers and
public officials. Employment laws and regulations as
well as secondary sources are reviewed to ensure
accuracy.
Rigidity of employment index
The rigidity of employment index measures 3 areas of labor regulation: difficulty of hiring, rigidity of hours and
difficulty of redundancy.
Difficulty of hiring index
The difficulty of hiring index measures whether fixed-
term contracts are prohibited for permanent tasks; the
maximum cumulative duration of fixed-term contracts;
and the ratio of the minimum wage for a trainee or
first-time employee to the average value added per
worker. (The average value added per worker is the
ratio of an economy‘s gross national income per capita
to the working-age population as a percentage of the
total population.)
Difficulty of hiring index Data
Fixed-term contracts prohibited for permanent tasks? Yes
Maximum length of a single fixed-term contract (months) 60 months - Art. 9 (1) New ECA
Maximum length of fixed-term contracts, including renewals (months) 120
Minimum wage for a 19-year old worker or an apprentice (US$/month) 389.5
Ratio of minimum wage to value added per worker 0.21
Source: Doing Business database.
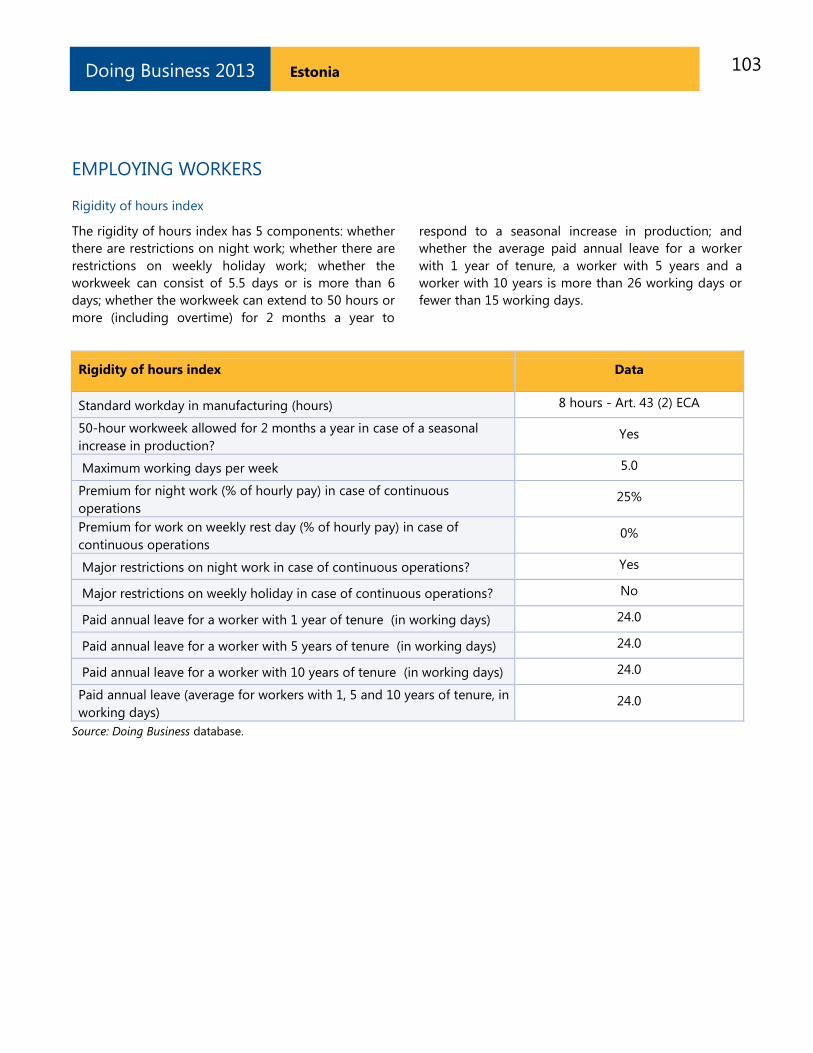
103 Estonia Doing Business 2013
EMPLOYING WORKERS
Rigidity of hours index
The rigidity of hours index has 5 components: whether
there are restrictions on night work; whether there are
restrictions on weekly holiday work; whether the
workweek can consist of 5.5 days or is more than 6
days; whether the workweek can extend to 50 hours or
more (including overtime) for 2 months a year to
respond to a seasonal increase in production; and
whether the average paid annual leave for a worker
with 1 year of tenure, a worker with 5 years and a
worker with 10 years is more than 26 working days or
fewer than 15 working days.
Rigidity of hours index Data
Standard workday in manufacturing (hours) 8 hours - Art. 43 (2) ECA
50-hour workweek allowed for 2 months a year in case of a seasonal
increase in production? Yes
Maximum working days per week 5.0
Premium for night work (% of hourly pay) in case of continuous
operations 25%
Premium for work on weekly rest day (% of hourly pay) in case of
continuous operations 0%
Major restrictions on night work in case of continuous operations? Yes
Major restrictions on weekly holiday in case of continuous operations? No
Paid annual leave for a worker with 1 year of tenure (in working days) 24.0
Paid annual leave for a worker with 5 years of tenure (in working days) 24.0
Paid annual leave for a worker with 10 years of tenure (in working days) 24.0
Paid annual leave (average for workers with 1, 5 and 10 years of tenure, in
working days) 24.0
Source: Doing Business database.
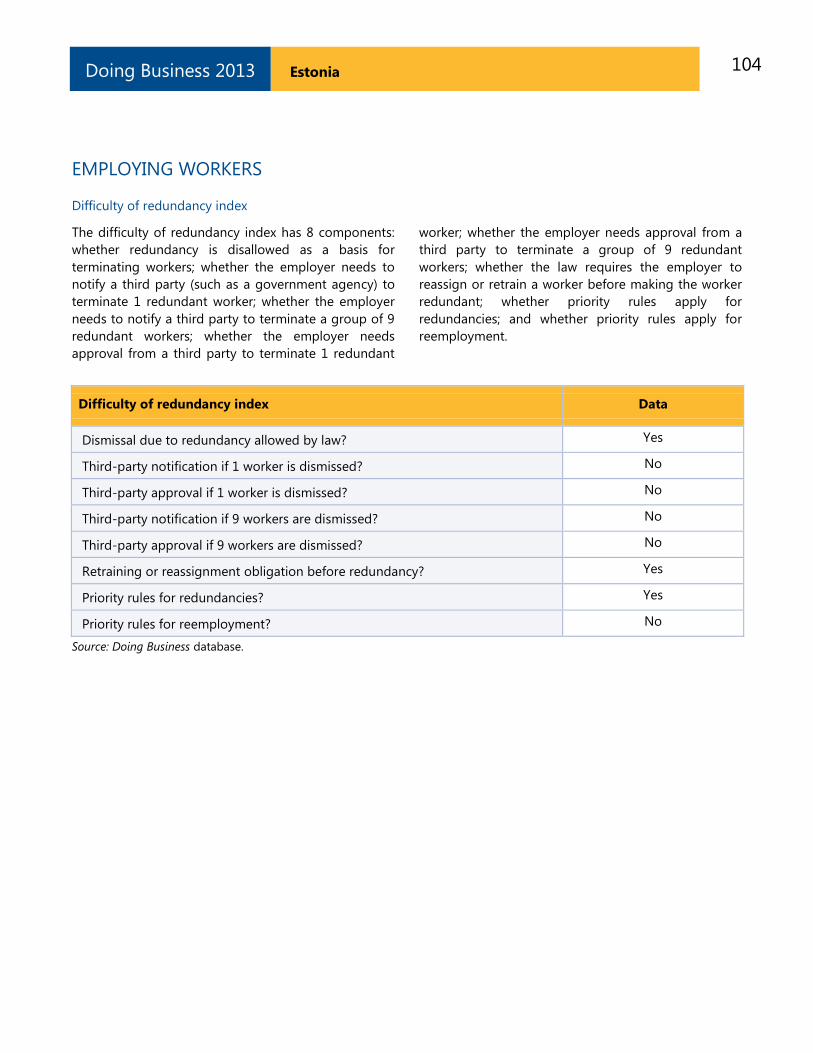
104 Estonia Doing Business 2013
EMPLOYING WORKERS
Difficulty of redundancy index
The difficulty of redundancy index has 8 components:
whether redundancy is disallowed as a basis for
terminating workers; whether the employer needs to
notify a third party (such as a government agency) to
terminate 1 redundant worker; whether the employer
needs to notify a third party to terminate a group of 9
redundant workers; whether the employer needs
approval from a third party to terminate 1 redundant
worker; whether the employer needs approval from a
third party to terminate a group of 9 redundant
workers; whether the law requires the employer to
reassign or retrain a worker before making the worker
redundant; whether priority rules apply for
redundancies; and whether priority rules apply for
reemployment.
Difficulty of redundancy index Data
Dismissal due to redundancy allowed by law? Yes
Third-party notification if 1 worker is dismissed? No
Third-party approval if 1 worker is dismissed? No
Third-party notification if 9 workers are dismissed? No
Third-party approval if 9 workers are dismissed? No
Retraining or reassignment obligation before redundancy? Yes
Priority rules for redundancies? Yes
Priority rules for reemployment? No
Source: Doing Business database.
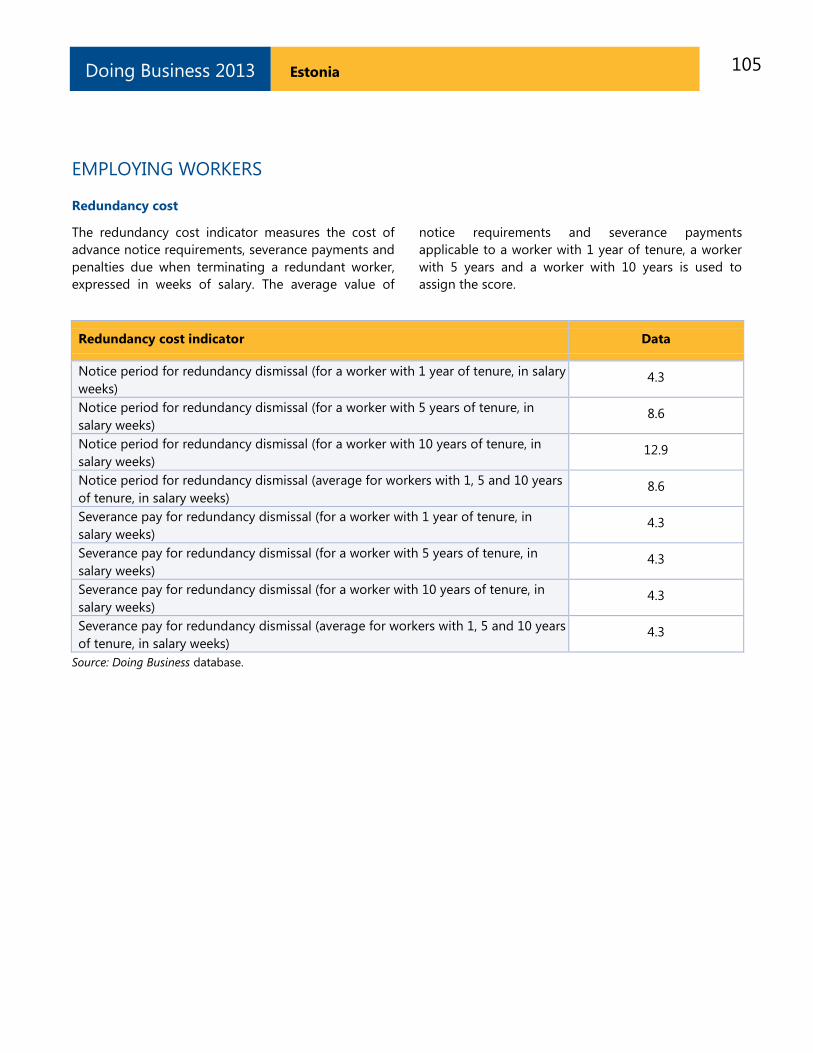
105 Estonia Doing Business 2013
EMPLOYING WORKERS
Redundancy cost
The redundancy cost indicator measures the cost of
advance notice requirements, severance payments and
penalties due when terminating a redundant worker,
expressed in weeks of salary. The average value of
notice requirements and severance payments
applicable to a worker with 1 year of tenure, a worker
with 5 years and a worker with 10 years is used to
assign the score.
Redundancy cost indicator Data
Notice period for redundancy dismissal (for a worker with 1 year of tenure, in salary
weeks) 4.3
Notice period for redundancy dismissal (for a worker with 5 years of tenure, in
salary weeks) 8.6
Notice period for redundancy dismissal (for a worker with 10 years of tenure, in
salary weeks) 12.9
Notice period for redundancy dismissal (average for workers with 1, 5 and 10 years
of tenure, in salary weeks) 8.6
Severance pay for redundancy dismissal (for a worker with 1 year of tenure, in
salary weeks) 4.3
Severance pay for redundancy dismissal (for a worker with 5 years of tenure, in
salary weeks) 4.3
Severance pay for redundancy dismissal (for a worker with 10 years of tenure, in
salary weeks) 4.3
Severance pay for redundancy dismissal (average for workers with 1, 5 and 10 years
of tenure, in salary weeks) 4.3
Source: Doing Business database.
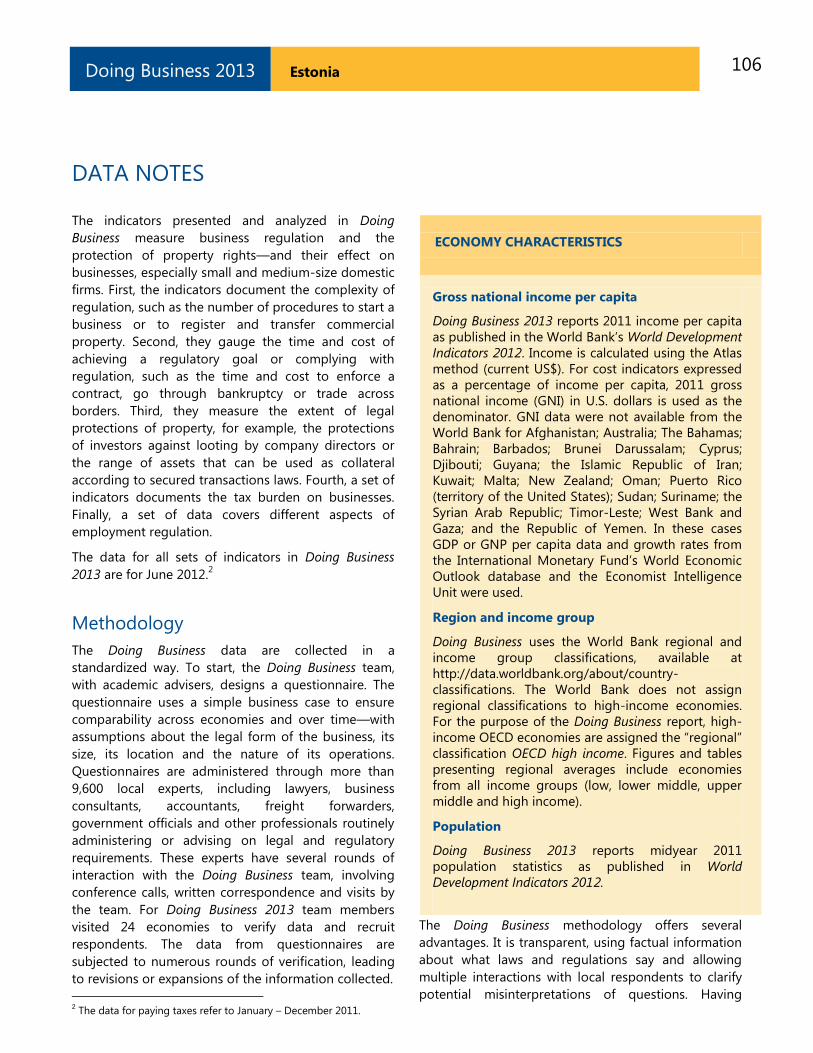
106 Estonia Doing Business 2013
DATA NOTES
The indicators presented and analyzed in Doing
Business measure business regulation and the
protection of property rights—and their effect on
businesses, especially small and medium-size domestic
firms. First, the indicators document the complexity of
regulation, such as the number of procedures to start a
business or to register and transfer commercial
property. Second, they gauge the time and cost of
achieving a regulatory goal or complying with
regulation, such as the time and cost to enforce a
contract, go through bankruptcy or trade across
borders. Third, they measure the extent of legal
protections of property, for example, the protections
of investors against looting by company directors or
the range of assets that can be used as collateral
according to secured transactions laws. Fourth, a set of
indicators documents the tax burden on businesses.
Finally, a set of data covers different aspects of
employment regulation.
The data for all sets of indicators in Doing Business
2013 are for June 2012.2
Methodology
The Doing Business data are collected in a
standardized way. To start, the Doing Business team,
with academic advisers, designs a questionnaire. The
questionnaire uses a simple business case to ensure
comparability across economies and over time—with
assumptions about the legal form of the business, its
size, its location and the nature of its operations.
Questionnaires are administered through more than
9,600 local experts, including lawyers, business
consultants, accountants, freight forwarders,
government officials and other professionals routinely
administering or advising on legal and regulatory
requirements. These experts have several rounds of
interaction with the Doing Business team, involving
conference calls, written correspondence and visits by
the team. For Doing Business 2013 team members
visited 24 economies to verify data and recruit
respondents. The data from questionnaires are
subjected to numerous rounds of verification, leading
to revisions or expansions of the information collected.
2 The data for paying taxes refer to January – December 2011.
The Doing Business methodology offers several
advantages. It is transparent, using factual information
about what laws and regulations say and allowing
multiple interactions with local respondents to clarify
potential misinterpretations of questions. Having
ECONOMY CHARACTERISTICS
Gross national income per capita
Doing Business 2013 reports 2011 income per capita
as published in the World Bank‘s World Development
Indicators 2012. Income is calculated using the Atlas
method (current US$). For cost indicators expressed
as a percentage of income per capita, 2011 gross
national income (GNI) in U.S. dollars is used as the
denominator. GNI data were not available from the
World Bank for Afghanistan; Australia; The Bahamas;
Bahrain; Barbados; Brunei Darussalam; Cyprus;
Djibouti; Guyana; the Islamic Republic of Iran;
Kuwait; Malta; New Zealand; Oman; Puerto Rico
(territory of the United States); Sudan; Suriname; the
Syrian Arab Republic; Timor-Leste; West Bank and
Gaza; and the Republic of Yemen. In these cases
GDP or GNP per capita data and growth rates from
the International Monetary Fund‘s World Economic
Outlook database and the Economist Intelligence
Unit were used.
Region and income group
Doing Business uses the World Bank regional and
income group classifications, available at http://data.worldbank.org/about/country-
classifications. The World Bank does not assign
regional classifications to high-income economies.
For the purpose of the Doing Business report, high-
income OECD economies are assigned the ―regional‖
classification OECD high income. Figures and tables
presenting regional averages include economies
from all income groups (low, lower middle, upper
middle and high income).
Population
Doing Business 2013 reports midyear 2011
population statistics as published in World
Development Indicators 2012.
107 Estonia Doing Business 2013
representative samples of respondents is not an issue;
Doing Business is not a statistical survey, and the texts
of the relevant laws and regulations are collected and
answers checked for accuracy. The methodology is
inexpensive and easily replicable, so data can be
collected in a large sample of economies. Because
standard assumptions are used in the data collection,
comparisons and benchmarks are valid across
economies. Finally, the data not only highlight the
extent of specific regulatory obstacles to business but
also identify their source and point to what might be
reformed.
Information on the methodology for each Doing
Business topic can be found on the Doing Business
website at http://www.doingbusiness.org/methodology/.
Limits to what is measured
The Doing Business methodology has 5 limitations that
should be considered when interpreting the data. First,
the collected data refer to businesses in the economy‘s
largest business city (which in some economies differs
from the capital) and may not be representative of
regulation in other parts of the economy. To address
this limitation, subnational Doing Business indicators
were created (see the section on subnational Doing
Business indicators). Second, the data often focus on a
specific business form—generally a limited liability
company (or its legal equivalent) of a specified size—
and may not be representative of the regulation on
other businesses, for example, sole proprietorships.
Third, transactions described in a standardized case
scenario refer to a specific set of issues and may not
represent the full set of issues a business encounters.
Fourth, the measures of time involve an element of
judgment by the expert respondents. When sources
indicate different estimates, the time indicators
reported in Doing Business represent the median
values of several responses given under the
assumptions of the standardized case.
Finally, the methodology assumes that a business has
full information on what is required and does not
waste time when completing procedures. In practice,
completing a procedure may take longer if the
business lacks information or is unable to follow up
promptly. Alternatively, the business may choose to
disregard some burdensome procedures. For both
reasons the time delays reported in Doing Business
2013 would differ from the recollection of
entrepreneurs reported in the World Bank Enterprise
Surveys or other perception surveys.
Subnational Doing Business indicators
This year Doing Business completed subnational
studies for Indonesia, Kenya, Mexico, the Russian
Federation and the United Arab Emirates. Each of
these countries had already asked to have subnational
data in the past, and this year Doing Business updated
the indicators, measured improvements over time and
expanded geographic coverage to additional cities or
added additional indicators. Doing Business also
published regional studies for the Arab world, the East
African Community and member states of the
Organization for the Harmonization of Business Law in
Africa (OHADA).
The subnational studies point to differences in
business regulation and its implementation—as well as
in the pace of regulatory reform—across cities in the
same economy. For several economies subnational
studies are now periodically updated to measure
change over time or to expand geographic coverage
to additional cities. This year that is the case for all the
subnational studies published.
Changes in what is measured
The ranking methodology for paying taxes was
updated this year. The threshold for the total tax rate
introduced last year for the purpose of calculating the
ranking on the ease of paying taxes was updated. All
economies with a total tax rate below the threshold
(which is calculated and adjusted on a yearly basis)
receive the same ranking on the total tax rate
indicator. The threshold is not based on any economic
theory of an ―optimal tax rate‖ that minimizes
distortions or maximizes efficiency in the tax system of
an economy overall. Instead, it is mainly empirical in
nature, set at the lower end of the distribution of tax
rates levied on medium-size enterprises in the
manufacturing sector as observed through the paying
taxes indicators. This reduces the bias in the indicators
toward economies that do not need to levy significant
taxes on companies like the Doing Business
standardized case study company because they raise
public revenue in other ways—for example, through
108 Estonia Doing Business 2013
taxes on foreign companies, through taxes on sectors
other than manufacturing or from natural resources
(all of which are outside the scope of the
methodology). Giving the same ranking to all
economies whose total tax rate is below the threshold
avoids awarding economies in the scoring for having
an unusually low total tax rate, often for reasons
unrelated to government policies toward enterprises.
For example, economies that are very small or that are
rich in natural resources do not need to levy broad-
based taxes.
Data challenges and revisions
Most laws and regulations underlying the Doing
Business data are available on the Doing Business
website at http://www.doingbusiness.org. All the
sample questionnaires and the details underlying the
indicators are also published on the website. Questions
on the methodology and challenges to data can be
submitted through the website‘s ―Ask a Question‖
function at http://www.doingbusiness.org.
Ease of doing business and distance to frontier
Doing Business 2013 presents results for 2 aggregate
measures: the aggregate ranking on the ease of doing
business and the distance to frontier measure. The
ease of doing business ranking compares economies
with one another, while the distance to frontier
measure benchmarks economies to the frontier in
regulatory practice, measuring the absolute distance to
the best performance on each indicator. Both
measures can be used for comparisons over time.
When compared across years, the distance to frontier
measure shows how much the regulatory environment
for local entrepreneurs in each economy has changed
over time in absolute terms, while the ease of doing
business ranking can show only relative change.
Ease of doing business
The ease of doing business index ranks economies
from 1 to 185. For each economy the ranking is
calculated as the simple average of the percentile
rankings on each of the 10 topics included in the index
in Doing Business 2013: starting a business, dealing
with construction permits, getting electricity,
registering property, getting credit, protecting
investors, paying taxes, trading across borders,
enforcing contracts, and resolving insolvency. The
employing workers indicators are not included in this
year‘s aggregate ease of doing business ranking. In
addition to this year‘s ranking, Doing Business presents
a comparable ranking for the previous year, adjusted
for any changes in methodology as well as additions of
economies or topics.3
Construction of the ease of doing business index
Here is one example of how the ease of doing business
index is constructed. In Finland it takes 3 procedures,
14 days and 4% of annual income per capita in fees to
register a property. On these 3 indicators Finland ranks
in the 6th, 16th and 39th percentiles. So on average
Finland ranks in the 20th percentile on the ease of
registering property. It ranks in the 30th percentile on
starting a business, 28th
percentile on getting credit,
24th percentile on paying taxes, 13th percentile on
enforcing contracts, 5th percentile on trading across
borders and so on. Higher rankings indicate simpler
regulation and stronger protection of property rights.
The simple average of Finland‘s percentile rankings on
all topics is 21st. When all economies are ordered by
their average percentile rankings, Finland stands at 11
in the aggregate ranking on the ease of doing
business.
More complex aggregation methods—such as
principal components and unobserved components—
yield a ranking nearly identical to the simple average
used by Doing Business.4 Thus, Doing Business uses
the simplest method: weighting all topics equally and,
3 In case of revisions to the methodology or corrections to the
underlying data, the data are back-calculated to provide a
comparable time series since the year the relevant economy or topic
was first included in the data set. The time series is available on the
Doing Business website (http://www.doingbusiness.org). Six topics
and more than 50 economies have been added since the inception
of the project. Earlier rankings on the ease of doing business are
therefore not comparable. 4 See Simeon Djankov, Darshini Manraj, Caralee McLiesh and Rita
Ramalho, ―Doing Business Indicators: Why Aggregate, and How to
Do It‖ (World Bank, Washington, DC, 2005). Principal components
and unobserved components methods yield a ranking nearly
identical to that from the simple average method because both
these methods assign roughly equal weights to the topics, since the
pairwise correlations among indicators do not differ much. An
alternative to the simple average method is to give different weights
to the topics, depending on which are considered of more or less
importance in the context of a specific economy.
109 Estonia Doing Business 2013
within each topic, giving equal weight to each of the
topic components.5
If an economy has no laws or regulations covering a
specific area—for example, insolvency—it receives a
―no practice‖ mark. Similarly, an economy receives a
―no practice‖ or ―not possible‖ mark if regulation exists
but is never used in practice or if a competing
regulation prohibits such practice. Either way, a ―no
practice‖ mark puts the economy at the bottom of the
ranking on the relevant indicator.
The ease of doing business index is limited in scope. It
does not account for an economy‘s proximity to large
markets, the quality of its infrastructure services (other
than services related to trading across borders and
getting electricity), the strength of its financial system,
the security of property from theft and looting,
macroeconomic conditions or the strength of
underlying institutions.
Variability of economies‘ rankings across topics
Each indicator set measures a different aspect of the
business regulatory environment. The rankings of an
economy can vary, sometimes significantly, across
indicator sets. The average correlation coefficient
between the 10 indicator sets included in the
aggregate ranking is 0.37, and the coefficients
between any 2 sets of indicators range from 0.19
(between dealing with construction permits and
getting credit) to 0.60 (between starting a business
and protecting investors). These correlations suggest
that economies rarely score universally well or
universally badly on the indicators.
Consider the example of Canada. It stands at 17 in the
aggregate ranking on the ease of doing business. Its
ranking is 3 on starting a business, and 4 on both
resolving insolvency and protecting investors. But its
ranking is only 62 on enforcing contracts, 69 on
dealing with construction permits and 152 on getting
electricity.
Variation in performance across the indicator sets is
not at all unusual. It reflects differences in the degree
of priority that government authorities give to
particular areas of business regulation reform and the
5 A technical note on the different aggregation and weighting
methods is available on the Doing Business website
(http://www.doingbusiness.org).
ability of different government agencies to deliver
tangible results in their area of responsibility.
Economies that improved the most across 3 or more
Doing Business topics in 2011/12
Doing Business 2013 uses a simple method to calculate
which economies improved the most in the ease of
doing business. First, it selects the economies that in
2011/12 implemented regulatory reforms making it
easier to do business in 3 or more of the 10 topics
included in this year‘s ease of doing business ranking.6
Twenty-three economies meet this criterion: Benin,
Burundi, Costa Rica, the Czech Republic, Georgia,
Greece, Guinea, Kazakhstan, Korea, the Lao People‘s
Democratic Republic, Liberia, Mongolia, the
Netherlands, Panama, Poland, Portugal, Serbia, the
Slovak Republic, Slovenia, Sri Lanka, Ukraine, the
United Arab Emirates and Uzbekistan. Second, Doing
Business ranks these economies on the increase in
their ranking on the ease of doing business from the
previous year using comparable rankings.
Selecting the economies that implemented regulatory
reforms in at least 3 topics and improved the most in
the aggregate ranking is intended to highlight
economies with ongoing, broad-based reform
programs.
Distance to frontier measure
A drawback of the ease of doing business ranking is
that it can measure the regulatory performance of
economies only relative to the performance of others.
It does not provide information on how the absolute
quality of the regulatory environment is improving
over time. Nor does it provide information on how
large the gaps are between economies at a single
point in time.
The distance to frontier measure is designed to
address both shortcomings, complementing the ease
of doing business ranking. This measure illustrates the
distance of an economy to the ―frontier,‖ and the
change in the measure over time shows the extent to
which the economy has closed this gap. The frontier is
a score derived from the most efficient practice or
highest score achieved on each of the component
indicators in 9 Doing Business indicator sets (excluding
6 Doing Business reforms making it more difficult to do business are
subtracted from the total number of those making it easier to do
business.
110 Estonia Doing Business 2013
the employing workers and getting electricity
indicators) by any economy since 2005. In starting a
business, for example, New Zealand has achieved the
highest performance on the time (1 day), Canada and
New Zealand on the number of procedures required
(1), Slovenia on the cost (0% of income per capita) and
Australia and 90 other economies on the paid-in
minimum capital requirement (0% of income per
capita). Calculating the distance to frontier for each
economy involves 2 main steps. First, individual
indicator scores are normalized to a common unit:
except for the total tax rate. To do so, each of the 28
component indicators y is rescaled to (max − y)/(max
− min), with the minimum value (min) representing the
frontier—the highest performance on that indicator
across all economies since 2005. For the total tax rate,
consistent with the calculation of the rankings, the
frontier is defined as the total tax rate corresponding
to the 15th
percentile based on the overall distribution
of total tax rates for all years. Second, for each
economy the scores obtained for individual indicators
are aggregated through simple averaging into one
distance to frontier score. An economy‘s distance to
frontier is indicated on a scale from 0 to 100, where 0
represents the lowest performance and 100 the
frontier.
The difference between an economy‘s distance to
frontier score in 2005 and its score in 2012 illustrates
the extent to which the economy has closed the gap to
the frontier over time. And in any given year the score
measures how far an economy is from the highest
performance at that time.
The maximum (max) and minimum (min) observed
values are computed for the 174 economies included
in the Doing Business sample since 2005 and for all
years (from 2005 to 2012). The year 2005 was chosen
as the baseline for the economy sample because it was
the first year in which data were available for the
majority of economies (a total of 174) and for all 9
indicator sets included in the measure. To mitigate the
effects of extreme outliers in the distributions of the
rescaled data (very few economies need 694 days to
complete the procedures to start a business, but many
need 9 days), the maximum (max) is defined as the 95th
percentile of the pooled data for all economies and all
years for each indicator. The exceptions are the getting
credit, protecting investors and resolving insolvency
indicators, whose construction precludes outliers.
Take Ghana, which has a score of 67 on the distance to
frontier measure for 2012. This score indicates that the
economy is 33 percentage points away from the
frontier constructed from the best performances
across all economies and all years. Ghana was further
from the frontier in 2005, with a score of 54. The
difference between the scores shows an improvement
over time.
The distance to frontier measure can also be used for
comparisons across economies in the same year,
complementing the ease of doing business ranking.
For example, Ghana stands at 64 this year in the ease
of doing business ranking, while Peru, which is 29
percentage points from the frontier, stands at 43.
111 Estonia Doing Business 2013
RESOURCES ON THE DOING BUSINESS WEBSITE
Current features
News on the Doing Business project
http://www.doingbusiness.org
Rankings
How economies rank—from 1 to 185
http://www.doingbusiness.org/rankings/
Data
All the data for 185 economies—topic rankings,
indicator values, lists of regulatory procedures and
details underlying indicators
http://www.doingbusiness.org/data/
Reports
Access to Doing Business reports as well as
subnational and regional reports, reform case
studies and customized economy and regional
profiles
http://www.doingbusiness.org/reports/
Methodology
The methodologies and research papers
underlying Doing Business
http://www.doingbusiness.org/methodology/
Research
Abstracts of papers on Doing Business topics and
related policy issues
http://www.doingbusiness.org/research/
Doing Business reforms
Short summaries of DB2013 business regulation
reforms, lists of reforms since DB2008 and a
ranking simulation tool
http://www.doingbusiness.org/reforms/
Historical data
Customized data sets since DB2004
http://www.doingbusiness.org/custom-query/
Law library
Online collection of business laws and regulations
relating to business and gender issues
http://www.doingbusiness.org/law-library/
http://wbl.worldbank.org/
Contributors
More than 9,600 specialists in 185 economies who
participate in Doing Business
http://www.doingbusiness.org/contributors/doing-
business/
NEW! Entrepreneurship data
Data on business density for 130 economies
http://www.doingbusiness.org/data/exploretopics/e
ntrepreneurship
More to come
Coming soon—information on good practices and
data on transparency and on the distance to
frontier

112 Estonia Doing Business 2013