Embed Size (px)
Citation preview
Demonstration Thermography report
Company
Device
Customer
E-Mail: [email protected]
Phone: 01420 544433
Andy McGrath - Testo
Tester:
01799300Serial No.:Testo 875-2
Alton, Hampshire, GU34 2QJ
Newman Lane
Power Flushing Contractor
12th July 2011Measuring Date:
Alton
Testo Avenue,
Power Flushing Customer
Measuring Site:
Demonstration Thermography Report to highlight the capabilities of theTesto 875 series Thermal Imaging camera to a Heating / Power FlushingContractor for the application of Power Flushing of Radiators.
Task
Alton, Hampshire, GU34 2QJ
Cheriton House, NewmanLane,
Testo Ltd
1/21Page
Demonstration Thermography report
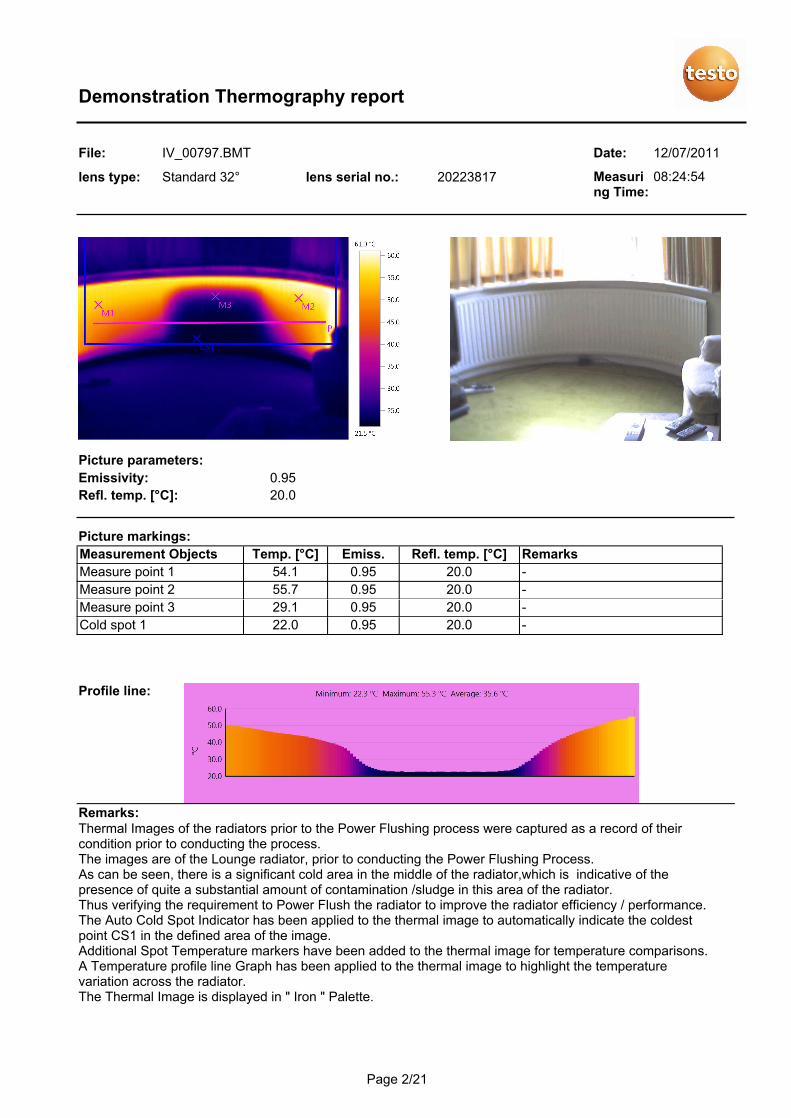
File: IV_00797.BMT 12/07/2011
Measuring Time:
08:24:54
20.0Refl. temp. [°C]:
0.95Emissivity:
Picture parameters:
lens type: Standard 32° 20223817lens serial no.:
Date:
Picture markings:
RemarksRefl. temp. [°C]Emiss.Temp. [°C]Measurement Objects
-20.00.9554.1Measure point 1
-20.00.9555.7Measure point 2
-20.00.9529.1Measure point 3
-20.00.9522.0Cold spot 1
Profile line:
Thermal Images of the radiators prior to the Power Flushing process were captured as a record of theircondition prior to conducting the process.The images are of the Lounge radiator, prior to conducting the Power Flushing Process.As can be seen, there is a significant cold area in the middle of the radiator,which is indicative of thepresence of quite a substantial amount of contamination /sludge in this area of the radiator.Thus verifying the requirement to Power Flush the radiator to improve the radiator efficiency / performance.The Auto Cold Spot Indicator has been applied to the thermal image to automatically indicate the coldestpoint CS1 in the defined area of the image.Additional Spot Temperature markers have been added to the thermal image for temperature comparisons.A Temperature profile line Graph has been applied to the thermal image to highlight the temperaturevariation across the radiator.The Thermal Image is displayed in " Iron " Palette.
Remarks:
2/21Page
Demonstration Thermography report
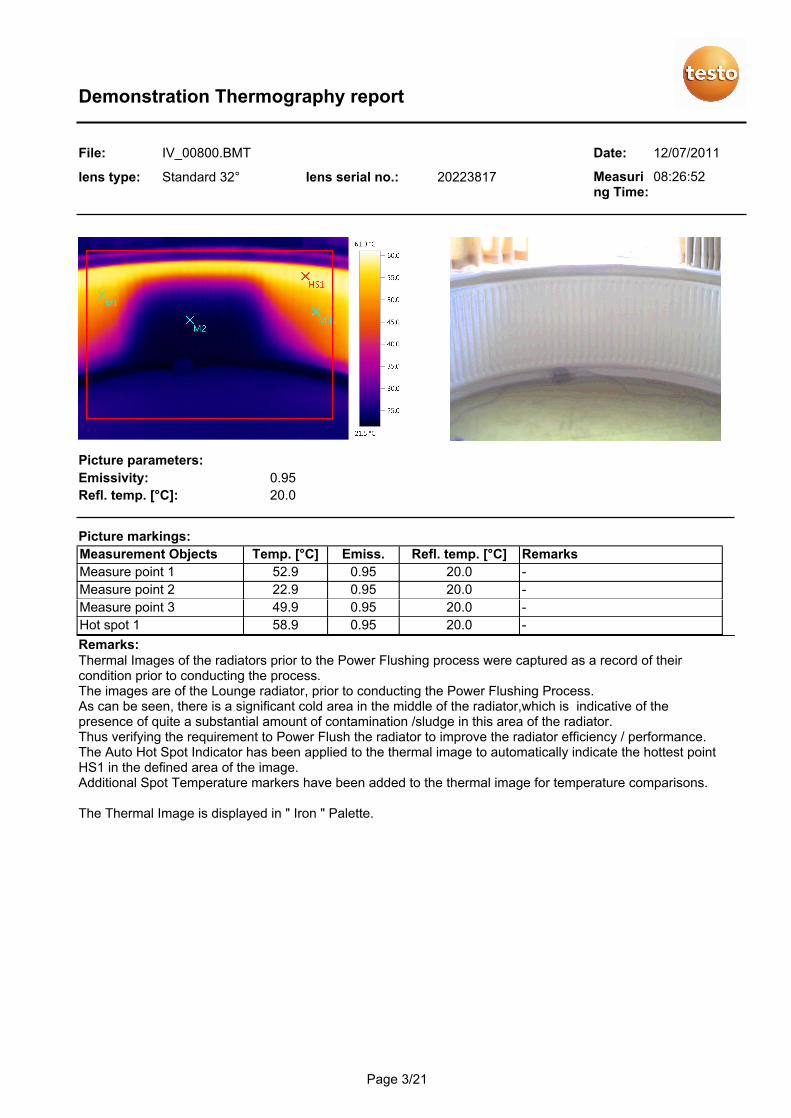
File: IV_00800.BMT 12/07/2011
Measuring Time:
08:26:52
20.0Refl. temp. [°C]:
0.95Emissivity:
Picture parameters:
lens type: Standard 32° 20223817lens serial no.:
Date:
Picture markings:
RemarksRefl. temp. [°C]Emiss.Temp. [°C]Measurement Objects
-20.00.9552.9Measure point 1
-20.00.9522.9Measure point 2
-20.00.9549.9Measure point 3
-20.00.9558.9Hot spot 1
Thermal Images of the radiators prior to the Power Flushing process were captured as a record of theircondition prior to conducting the process.The images are of the Lounge radiator, prior to conducting the Power Flushing Process.As can be seen, there is a significant cold area in the middle of the radiator,which is indicative of thepresence of quite a substantial amount of contamination /sludge in this area of the radiator.Thus verifying the requirement to Power Flush the radiator to improve the radiator efficiency / performance.The Auto Hot Spot Indicator has been applied to the thermal image to automatically indicate the hottest pointHS1 in the defined area of the image.Additional Spot Temperature markers have been added to the thermal image for temperature comparisons.
The Thermal Image is displayed in " Iron " Palette.
Remarks:
3/21Page
Demonstration Thermography report
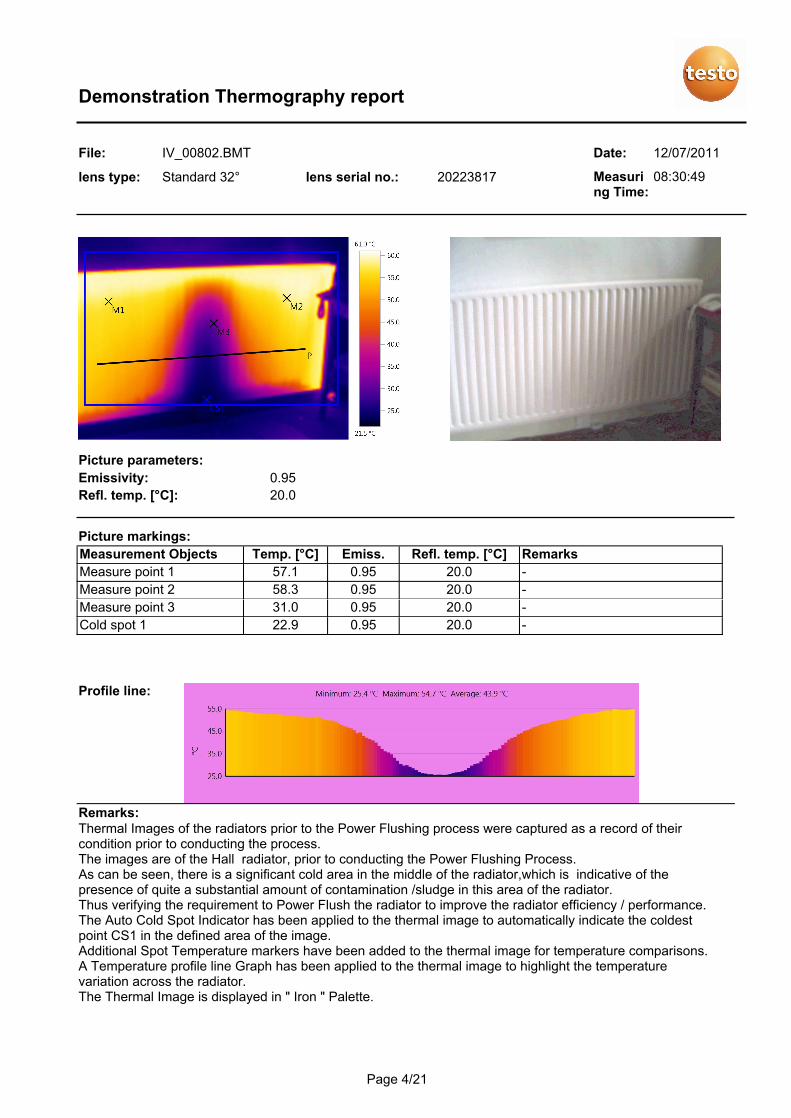
File: IV_00802.BMT 12/07/2011
Measuring Time:
08:30:49
20.0Refl. temp. [°C]:
0.95Emissivity:
Picture parameters:
lens type: Standard 32° 20223817lens serial no.:
Date:
Picture markings:
RemarksRefl. temp. [°C]Emiss.Temp. [°C]Measurement Objects
-20.00.9557.1Measure point 1
-20.00.9558.3Measure point 2
-20.00.9531.0Measure point 3
-20.00.9522.9Cold spot 1
Profile line:
Thermal Images of the radiators prior to the Power Flushing process were captured as a record of theircondition prior to conducting the process.The images are of the Hall radiator, prior to conducting the Power Flushing Process.As can be seen, there is a significant cold area in the middle of the radiator,which is indicative of thepresence of quite a substantial amount of contamination /sludge in this area of the radiator.Thus verifying the requirement to Power Flush the radiator to improve the radiator efficiency / performance.The Auto Cold Spot Indicator has been applied to the thermal image to automatically indicate the coldestpoint CS1 in the defined area of the image.Additional Spot Temperature markers have been added to the thermal image for temperature comparisons.A Temperature profile line Graph has been applied to the thermal image to highlight the temperaturevariation across the radiator.The Thermal Image is displayed in " Iron " Palette.
Remarks:
4/21Page
Demonstration Thermography report
File: IV_00824.BMT 12/07/2011
Measuring Time:
08:54:34
20.0Refl. temp. [°C]:
0.95Emissivity:
Picture parameters:
lens type: Standard 32° 20223817lens serial no.:
Date:
Picture markings:
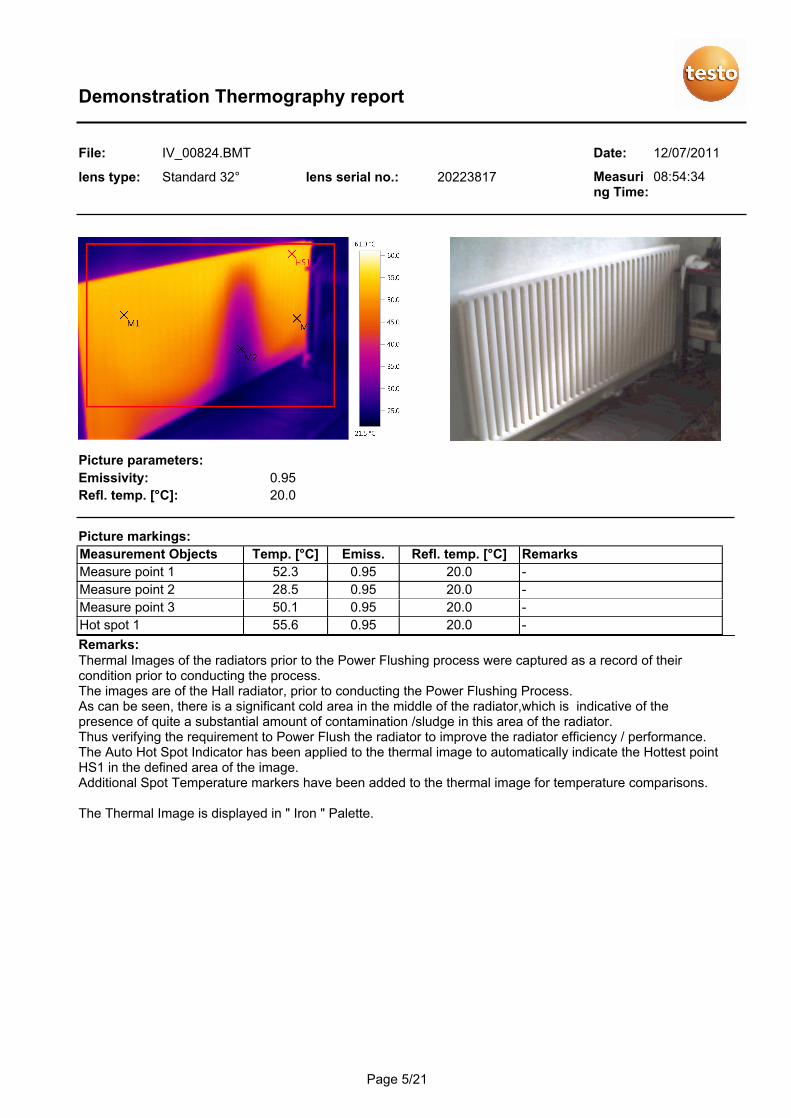
RemarksRefl. temp. [°C]Emiss.Temp. [°C]Measurement Objects
-20.00.9552.3Measure point 1
-20.00.9528.5Measure point 2
-20.00.9550.1Measure point 3
-20.00.9555.6Hot spot 1
Thermal Images of the radiators prior to the Power Flushing process were captured as a record of theircondition prior to conducting the process.The images are of the Hall radiator, prior to conducting the Power Flushing Process.As can be seen, there is a significant cold area in the middle of the radiator,which is indicative of thepresence of quite a substantial amount of contamination /sludge in this area of the radiator.Thus verifying the requirement to Power Flush the radiator to improve the radiator efficiency / performance.The Auto Hot Spot Indicator has been applied to the thermal image to automatically indicate the Hottest pointHS1 in the defined area of the image.Additional Spot Temperature markers have been added to the thermal image for temperature comparisons.
The Thermal Image is displayed in " Iron " Palette.
Remarks:
5/21Page
Demonstration Thermography report
File: IV_00808.BMT 12/07/2011
Measuring Time:
08:35:40
20.0Refl. temp. [°C]:
0.95Emissivity:
Picture parameters:
lens type: Standard 32° 20223817lens serial no.:
Date:
Picture markings:
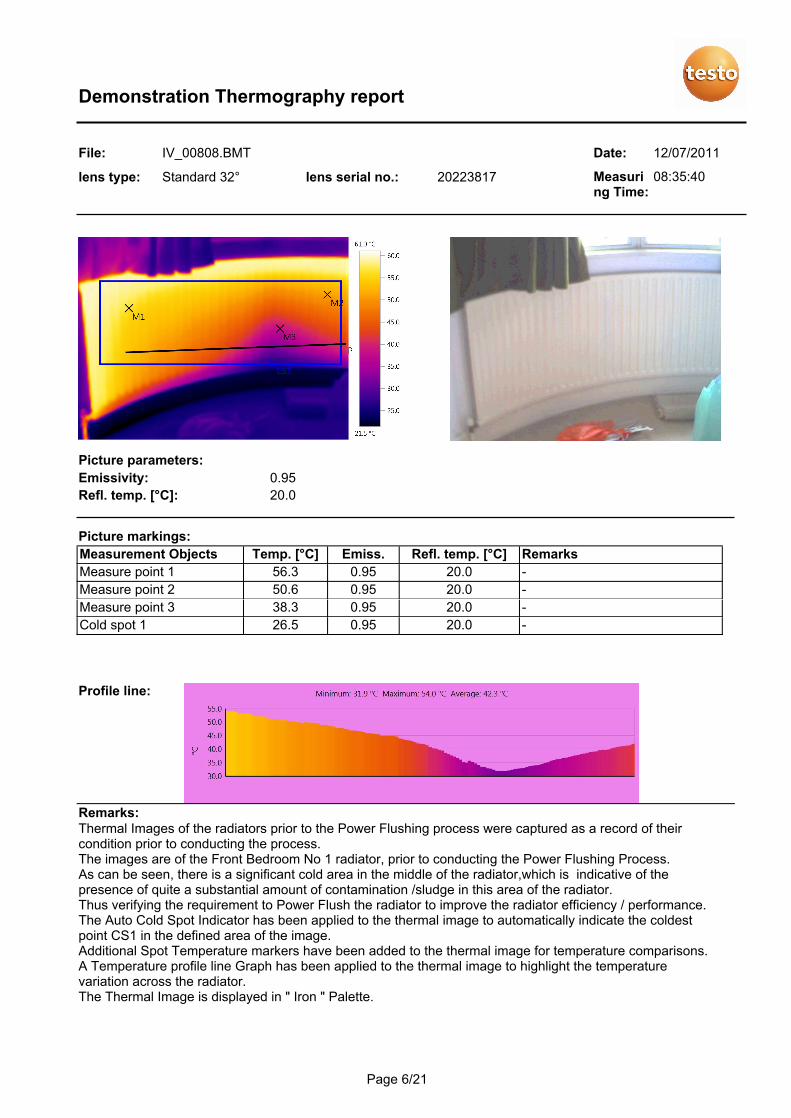
RemarksRefl. temp. [°C]Emiss.Temp. [°C]Measurement Objects
-20.00.9556.3Measure point 1
-20.00.9550.6Measure point 2
-20.00.9538.3Measure point 3
-20.00.9526.5Cold spot 1
Profile line:
Thermal Images of the radiators prior to the Power Flushing process were captured as a record of theircondition prior to conducting the process.The images are of the Front Bedroom No 1 radiator, prior to conducting the Power Flushing Process.As can be seen, there is a significant cold area in the middle of the radiator,which is indicative of thepresence of quite a substantial amount of contamination /sludge in this area of the radiator.Thus verifying the requirement to Power Flush the radiator to improve the radiator efficiency / performance.The Auto Cold Spot Indicator has been applied to the thermal image to automatically indicate the coldestpoint CS1 in the defined area of the image.Additional Spot Temperature markers have been added to the thermal image for temperature comparisons.A Temperature profile line Graph has been applied to the thermal image to highlight the temperaturevariation across the radiator.The Thermal Image is displayed in " Iron " Palette.
Remarks:
6/21Page
Demonstration Thermography report
File: IV_00811.BMT 12/07/2011
Measuring Time:
08:37:02
20.0Refl. temp. [°C]:
0.95Emissivity:
Picture parameters:
lens type: Standard 32° 20223817lens serial no.:
Date:
Picture markings:
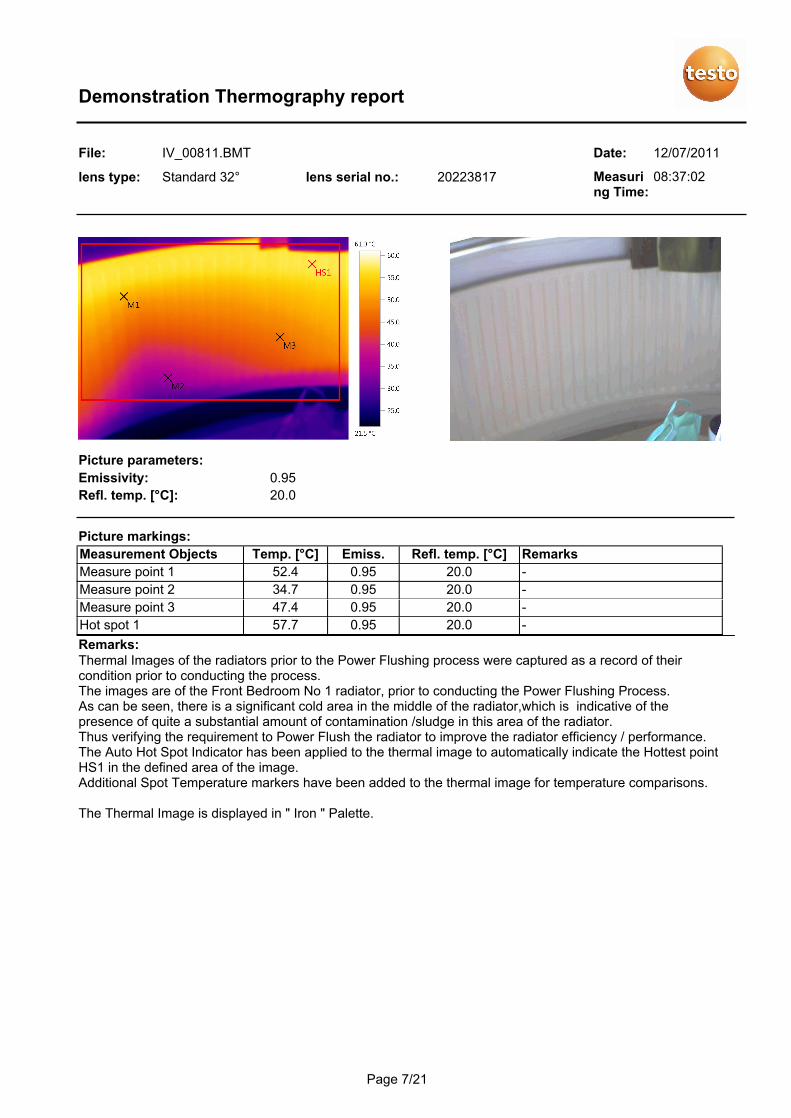
RemarksRefl. temp. [°C]Emiss.Temp. [°C]Measurement Objects
-20.00.9552.4Measure point 1
-20.00.9534.7Measure point 2
-20.00.9547.4Measure point 3
-20.00.9557.7Hot spot 1
Thermal Images of the radiators prior to the Power Flushing process were captured as a record of theircondition prior to conducting the process.The images are of the Front Bedroom No 1 radiator, prior to conducting the Power Flushing Process.As can be seen, there is a significant cold area in the middle of the radiator,which is indicative of thepresence of quite a substantial amount of contamination /sludge in this area of the radiator.Thus verifying the requirement to Power Flush the radiator to improve the radiator efficiency / performance.The Auto Hot Spot Indicator has been applied to the thermal image to automatically indicate the Hottest pointHS1 in the defined area of the image.Additional Spot Temperature markers have been added to the thermal image for temperature comparisons.
The Thermal Image is displayed in " Iron " Palette.
Remarks:
7/21Page
Demonstration Thermography report
File: IV_00812.BMT 12/07/2011
Measuring Time:
08:40:36
20.0Refl. temp. [°C]:
0.95Emissivity:
Picture parameters:
lens type: Standard 32° 20223817lens serial no.:
Date:
Picture markings:
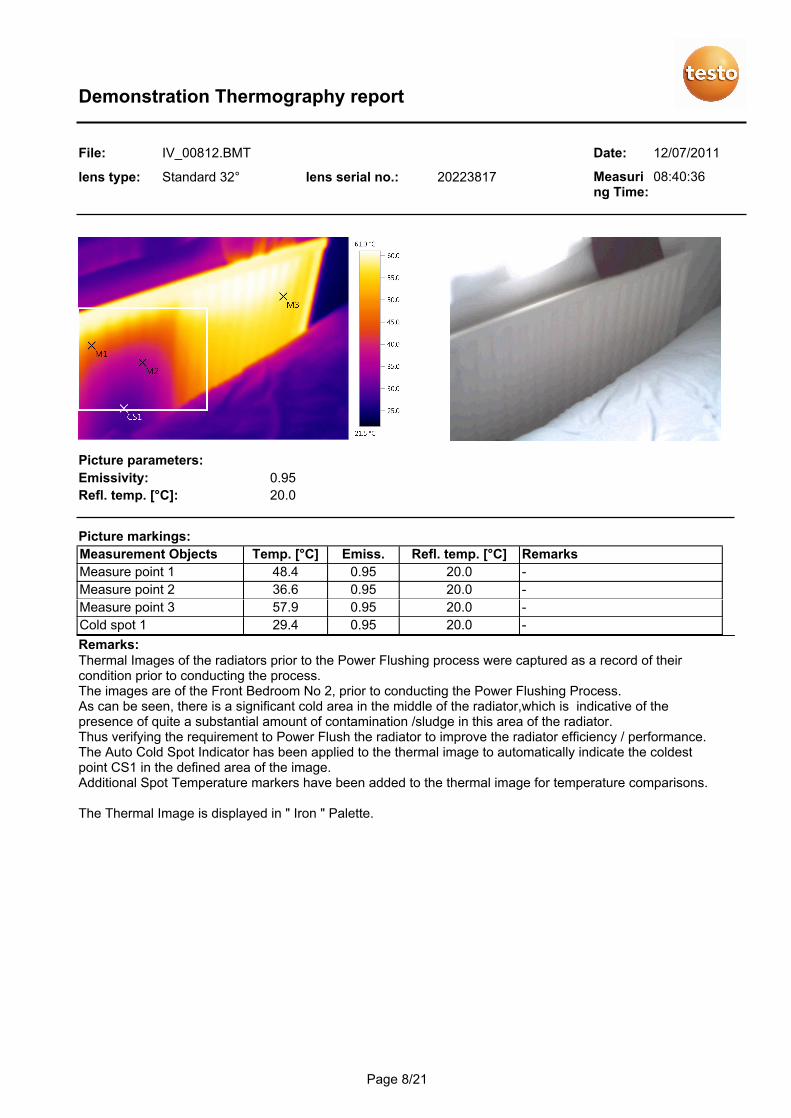
RemarksRefl. temp. [°C]Emiss.Temp. [°C]Measurement Objects
-20.00.9548.4Measure point 1
-20.00.9536.6Measure point 2
-20.00.9557.9Measure point 3
-20.00.9529.4Cold spot 1
Thermal Images of the radiators prior to the Power Flushing process were captured as a record of theircondition prior to conducting the process.The images are of the Front Bedroom No 2, prior to conducting the Power Flushing Process.As can be seen, there is a significant cold area in the middle of the radiator,which is indicative of thepresence of quite a substantial amount of contamination /sludge in this area of the radiator.Thus verifying the requirement to Power Flush the radiator to improve the radiator efficiency / performance.The Auto Cold Spot Indicator has been applied to the thermal image to automatically indicate the coldestpoint CS1 in the defined area of the image.Additional Spot Temperature markers have been added to the thermal image for temperature comparisons.
The Thermal Image is displayed in " Iron " Palette.
Remarks:
8/21Page
Demonstration Thermography report
File: IV_00813.BMT 12/07/2011
Measuring Time:
08:41:02
20.0Refl. temp. [°C]:
0.95Emissivity:
Picture parameters:
lens type: Standard 32° 20223817lens serial no.:
Date:
Picture markings:
RemarksRefl. temp. [°C]Emiss.Temp. [°C]Measurement Objects
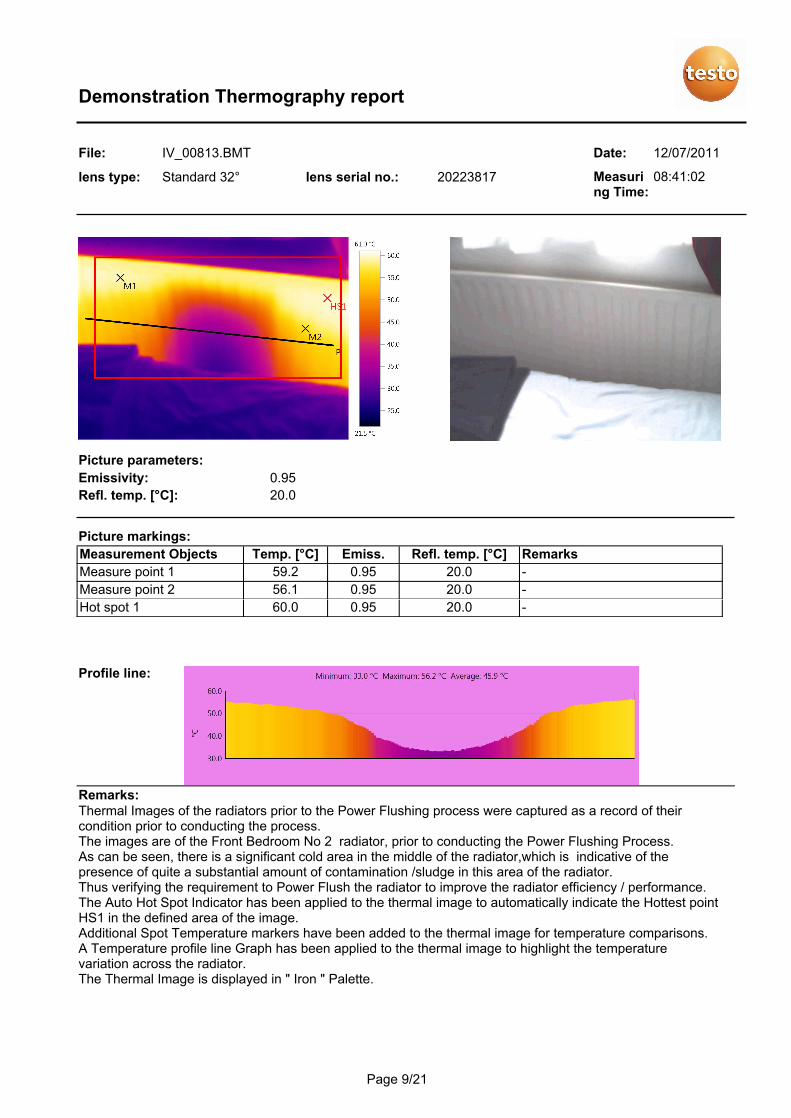
-20.00.9559.2Measure point 1
-20.00.9556.1Measure point 2
-20.00.9560.0Hot spot 1
Profile line:
Thermal Images of the radiators prior to the Power Flushing process were captured as a record of theircondition prior to conducting the process.The images are of the Front Bedroom No 2 radiator, prior to conducting the Power Flushing Process.As can be seen, there is a significant cold area in the middle of the radiator,which is indicative of thepresence of quite a substantial amount of contamination /sludge in this area of the radiator.Thus verifying the requirement to Power Flush the radiator to improve the radiator efficiency / performance.The Auto Hot Spot Indicator has been applied to the thermal image to automatically indicate the Hottest pointHS1 in the defined area of the image.Additional Spot Temperature markers have been added to the thermal image for temperature comparisons.A Temperature profile line Graph has been applied to the thermal image to highlight the temperaturevariation across the radiator.The Thermal Image is displayed in " Iron " Palette.
Remarks:
9/21Page
Demonstration Thermography report
File: IV_00836.BMT 12/07/2011
Measuring Time:
09:18:02
20.0Refl. temp. [°C]:
0.95Emissivity:
Picture parameters:
lens type: Standard 32° 20223817lens serial no.:
Date:
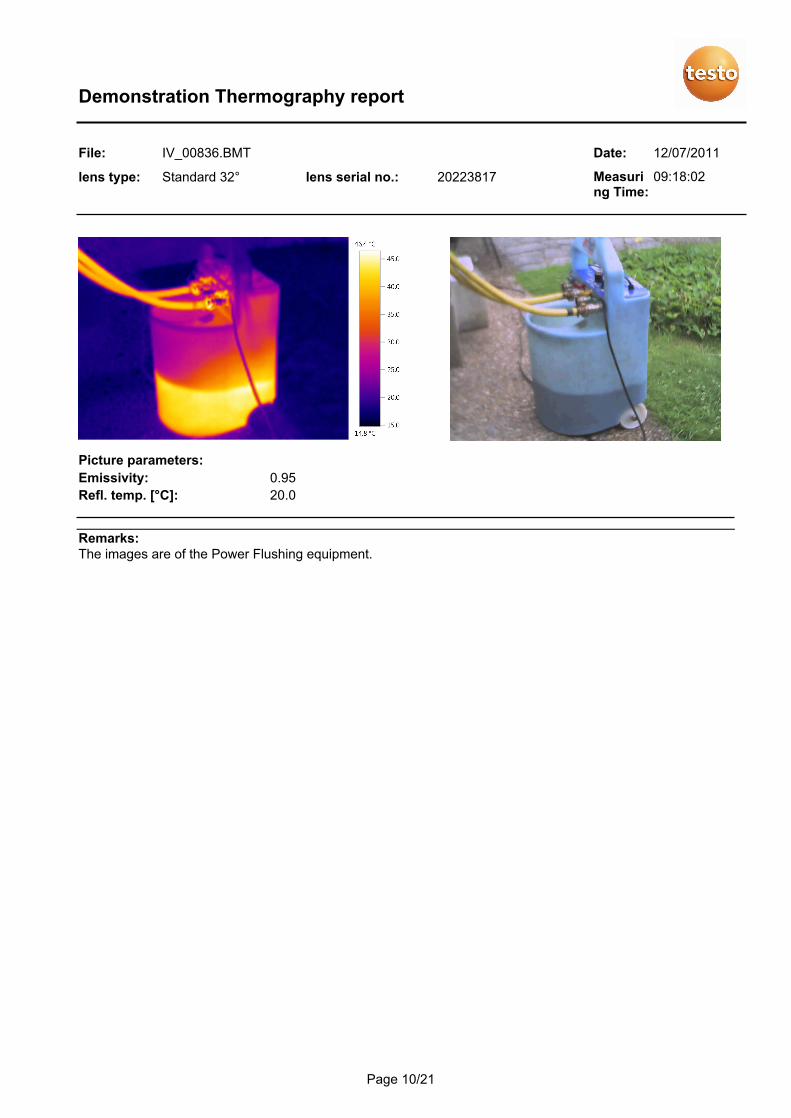
The images are of the Power Flushing equipment.Remarks:
10/21Page
Demonstration Thermography report
File: IV_00839.BMT 12/07/2011
Measuring Time:
09:31:04
20.0Refl. temp. [°C]:
0.95Emissivity:
Picture parameters:
lens type: Standard 32° 20223817lens serial no.:
Date:
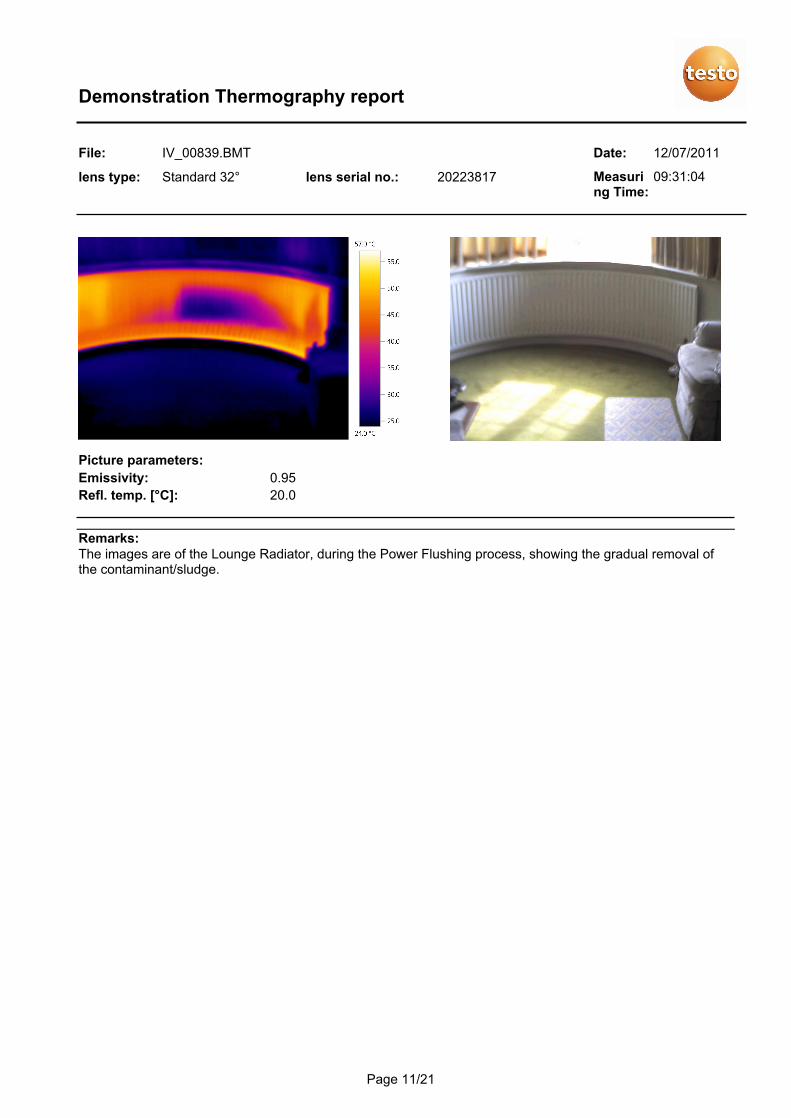
The images are of the Lounge Radiator, during the Power Flushing process, showing the gradual removal ofthe contaminant/sludge.
Remarks:
11/21Page
Demonstration Thermography report
File: IV_00840.BMT 12/07/2011
Measuring Time:
09:33:31
20.0Refl. temp. [°C]:
0.95Emissivity:
Picture parameters:
lens type: Standard 32° 20223817lens serial no.:
Date:
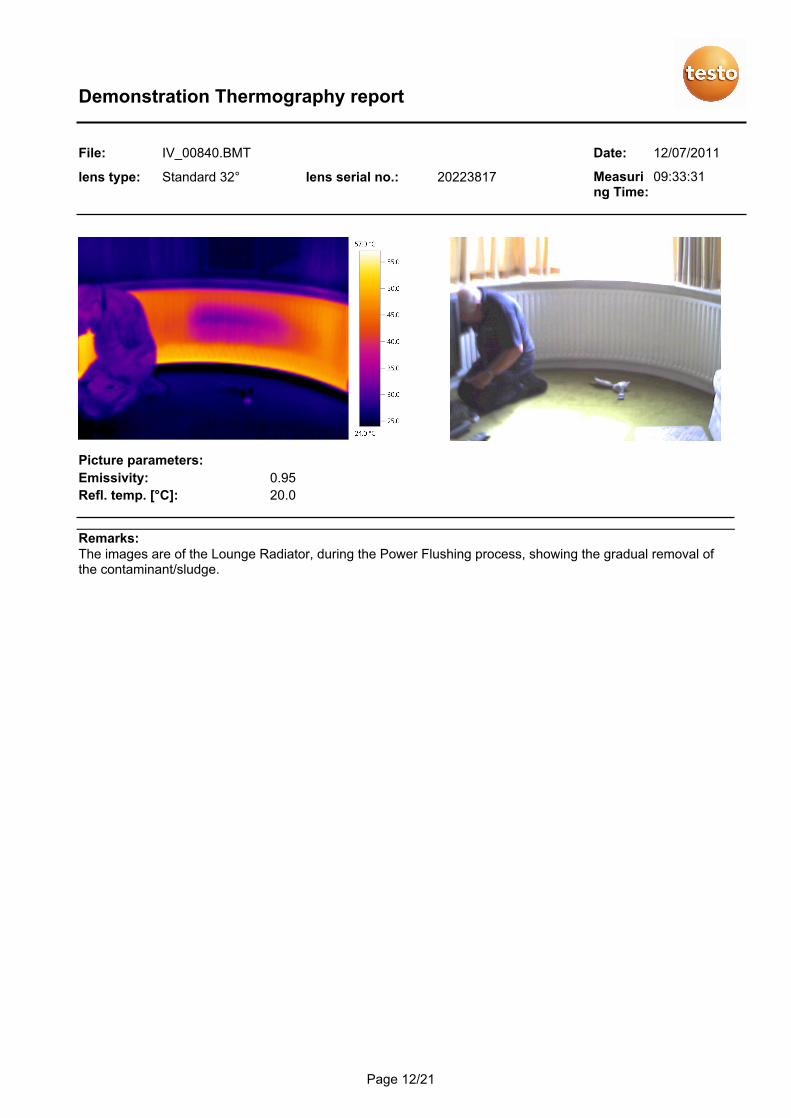
The images are of the Lounge Radiator, during the Power Flushing process, showing the gradual removal ofthe contaminant/sludge.
Remarks:
12/21Page
Demonstration Thermography report
File: IV_00845.BMT 12/07/2011
Measuring Time:
09:46:33
20.0Refl. temp. [°C]:
0.95Emissivity:
Picture parameters:
lens type: Standard 32° 20223817lens serial no.:
Date:
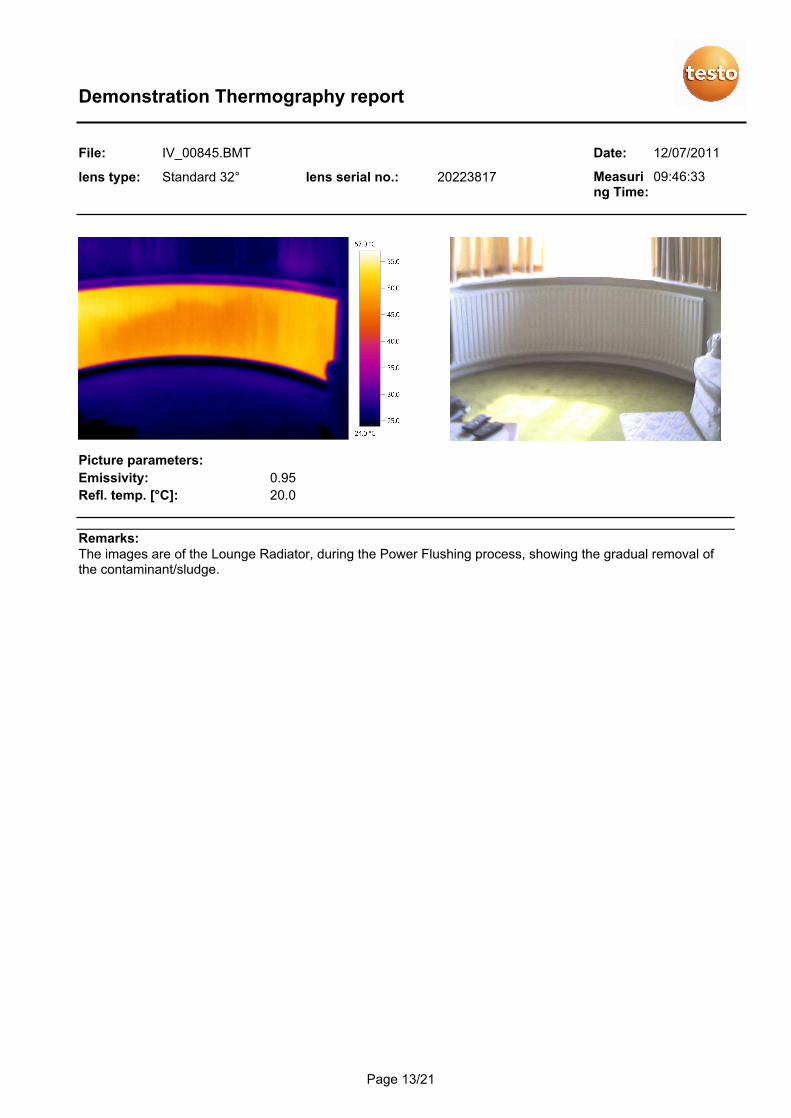
The images are of the Lounge Radiator, during the Power Flushing process, showing the gradual removal ofthe contaminant/sludge.
Remarks:
13/21Page
Demonstration Thermography report
File: IV_00842.BMT 12/07/2011
Measuring Time:
09:39:14
20.0Refl. temp. [°C]:
0.95Emissivity:
Picture parameters:
lens type: Standard 32° 20223817lens serial no.:
Date:
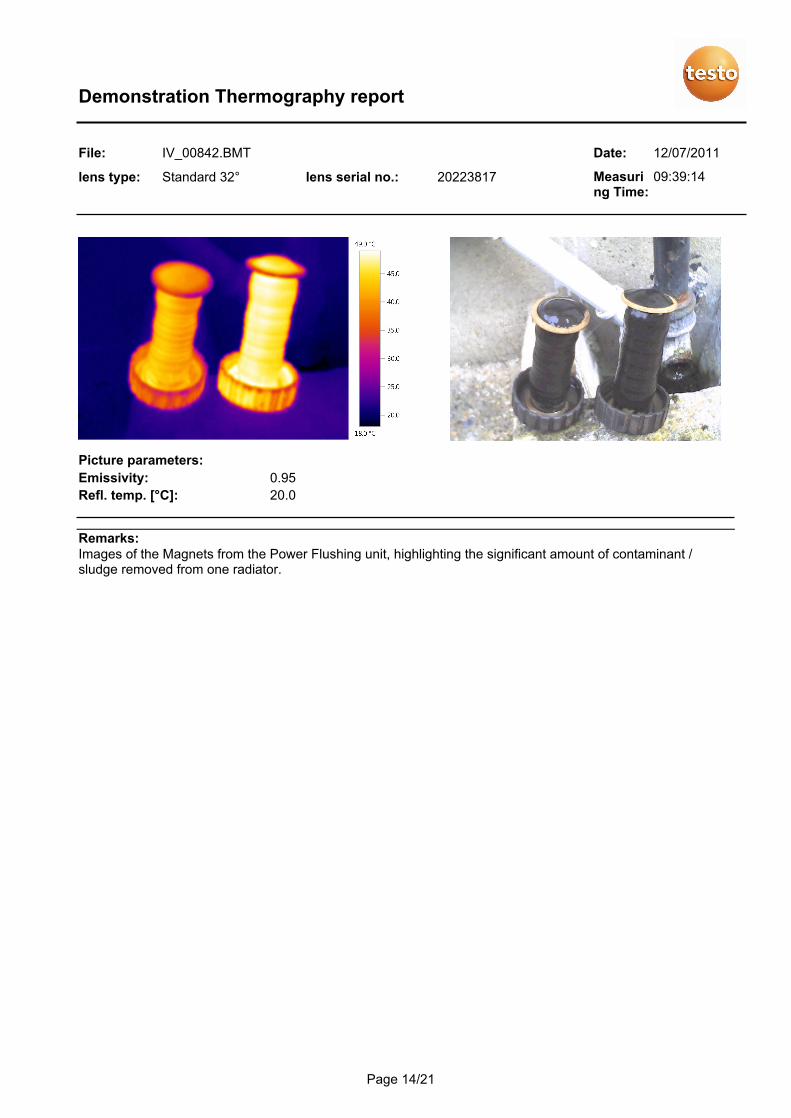
Images of the Magnets from the Power Flushing unit, highlighting the significant amount of contaminant /sludge removed from one radiator.
Remarks:
14/21Page
Demonstration Thermography report
File: IV_00843.BMT 12/07/2011
Measuring Time:
09:40:53
20.0Refl. temp. [°C]:
0.95Emissivity:
Picture parameters:
lens type: Standard 32° 20223817lens serial no.:
Date:
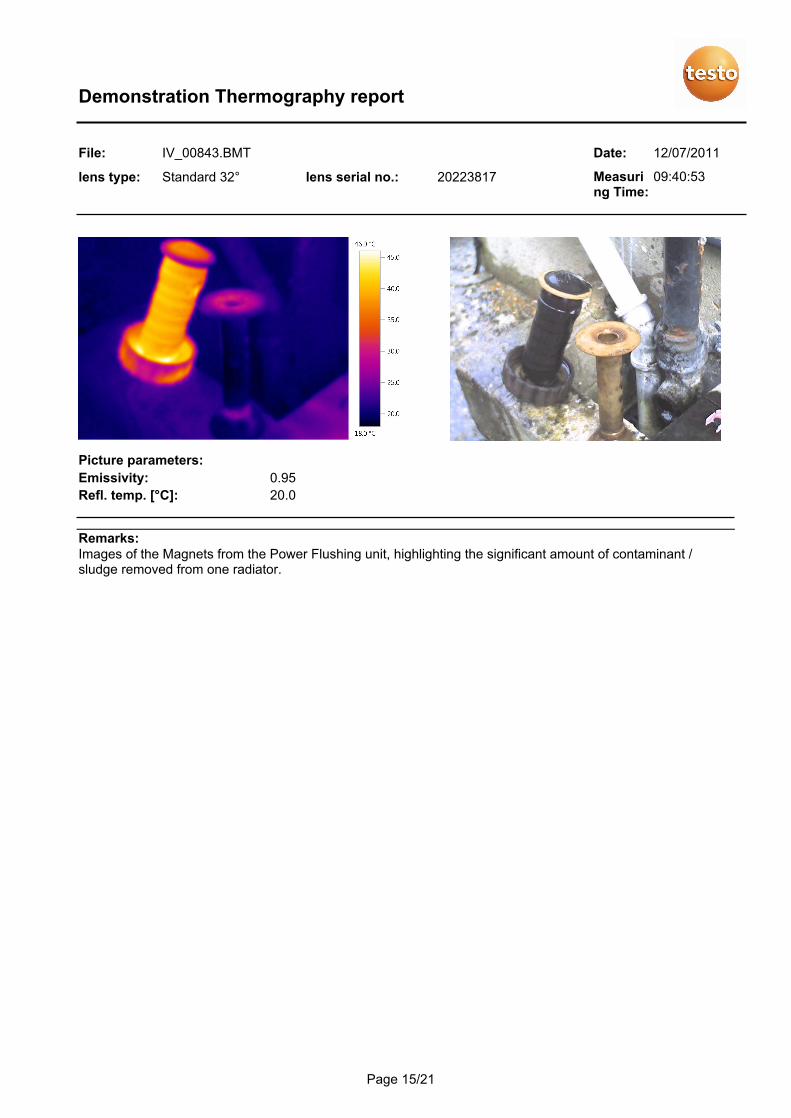
Images of the Magnets from the Power Flushing unit, highlighting the significant amount of contaminant /sludge removed from one radiator.
Remarks:
15/21Page
Demonstration Thermography report
File: IV_00878.BMT 12/07/2011
Measuring Time:
14:36:24
20.0Refl. temp. [°C]:
0.95Emissivity:
Picture parameters:
lens type: Standard 32° 20223817lens serial no.:
Date:
Picture markings:
RemarksRefl. temp. [°C]Emiss.Temp. [°C]Measurement Objects
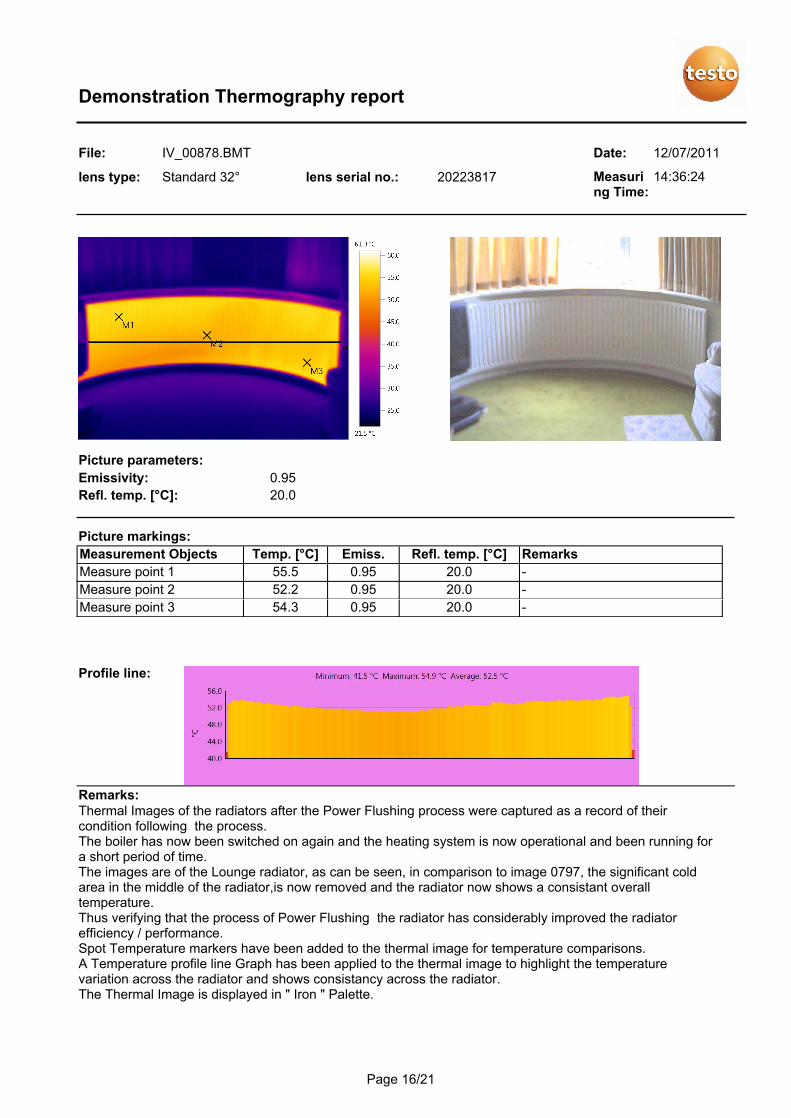
-20.00.9555.5Measure point 1
-20.00.9552.2Measure point 2
-20.00.9554.3Measure point 3
Profile line:
Thermal Images of the radiators after the Power Flushing process were captured as a record of theircondition following the process.The boiler has now been switched on again and the heating system is now operational and been running fora short period of time.The images are of the Lounge radiator, as can be seen, in comparison to image 0797, the significant coldarea in the middle of the radiator,is now removed and the radiator now shows a consistant overalltemperature.Thus verifying that the process of Power Flushing the radiator has considerably improved the radiatorefficiency / performance.Spot Temperature markers have been added to the thermal image for temperature comparisons.A Temperature profile line Graph has been applied to the thermal image to highlight the temperaturevariation across the radiator and shows consistancy across the radiator.The Thermal Image is displayed in " Iron " Palette.
Remarks:
16/21Page
Demonstration Thermography report
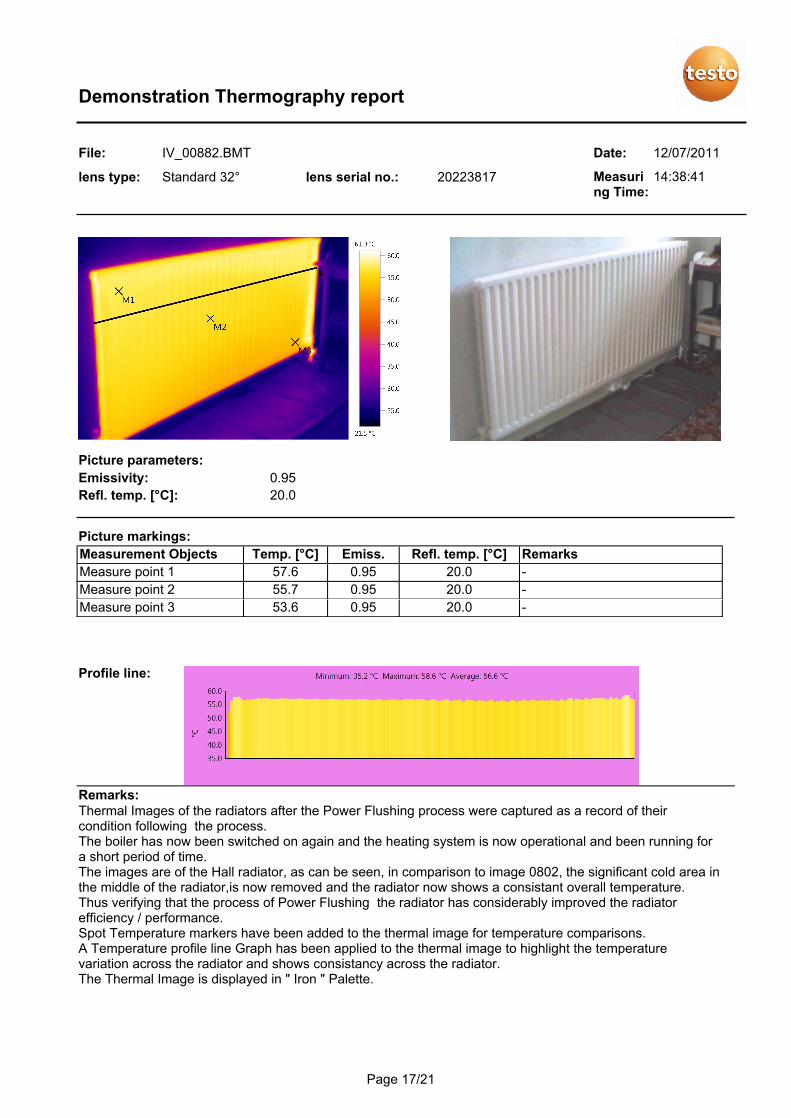
File: IV_00882.BMT 12/07/2011
Measuring Time:
14:38:41
20.0Refl. temp. [°C]:
0.95Emissivity:
Picture parameters:
lens type: Standard 32° 20223817lens serial no.:
Date:
Picture markings:
RemarksRefl. temp. [°C]Emiss.Temp. [°C]Measurement Objects
-20.00.9557.6Measure point 1
-20.00.9555.7Measure point 2
-20.00.9553.6Measure point 3
Profile line:
Thermal Images of the radiators after the Power Flushing process were captured as a record of theircondition following the process.The boiler has now been switched on again and the heating system is now operational and been running fora short period of time.The images are of the Hall radiator, as can be seen, in comparison to image 0802, the significant cold area inthe middle of the radiator,is now removed and the radiator now shows a consistant overall temperature.Thus verifying that the process of Power Flushing the radiator has considerably improved the radiatorefficiency / performance.Spot Temperature markers have been added to the thermal image for temperature comparisons.A Temperature profile line Graph has been applied to the thermal image to highlight the temperaturevariation across the radiator and shows consistancy across the radiator.The Thermal Image is displayed in " Iron " Palette.
Remarks:
17/21Page
Demonstration Thermography report
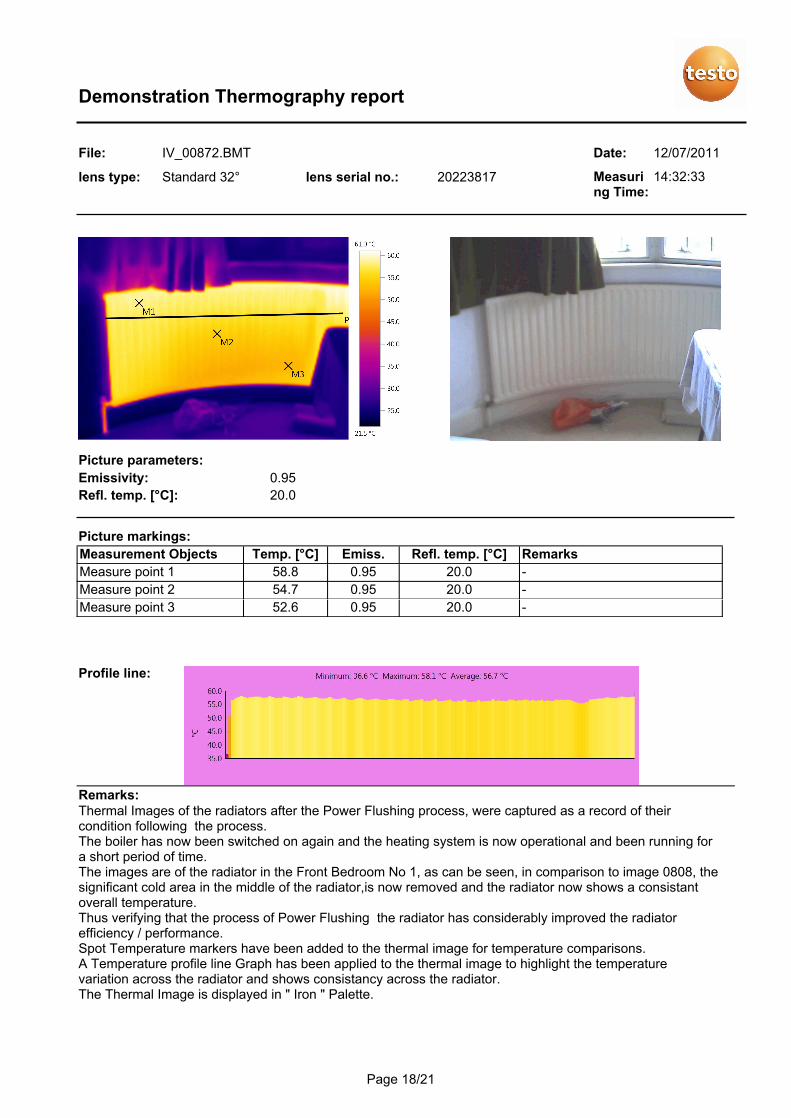
File: IV_00872.BMT 12/07/2011
Measuring Time:
14:32:33
20.0Refl. temp. [°C]:
0.95Emissivity:
Picture parameters:
lens type: Standard 32° 20223817lens serial no.:
Date:
Picture markings:
RemarksRefl. temp. [°C]Emiss.Temp. [°C]Measurement Objects
-20.00.9558.8Measure point 1
-20.00.9554.7Measure point 2
-20.00.9552.6Measure point 3
Profile line:
Thermal Images of the radiators after the Power Flushing process, were captured as a record of theircondition following the process.The boiler has now been switched on again and the heating system is now operational and been running fora short period of time.The images are of the radiator in the Front Bedroom No 1, as can be seen, in comparison to image 0808, thesignificant cold area in the middle of the radiator,is now removed and the radiator now shows a consistantoverall temperature.Thus verifying that the process of Power Flushing the radiator has considerably improved the radiatorefficiency / performance.Spot Temperature markers have been added to the thermal image for temperature comparisons.A Temperature profile line Graph has been applied to the thermal image to highlight the temperaturevariation across the radiator and shows consistancy across the radiator.The Thermal Image is displayed in " Iron " Palette.
Remarks:
18/21Page
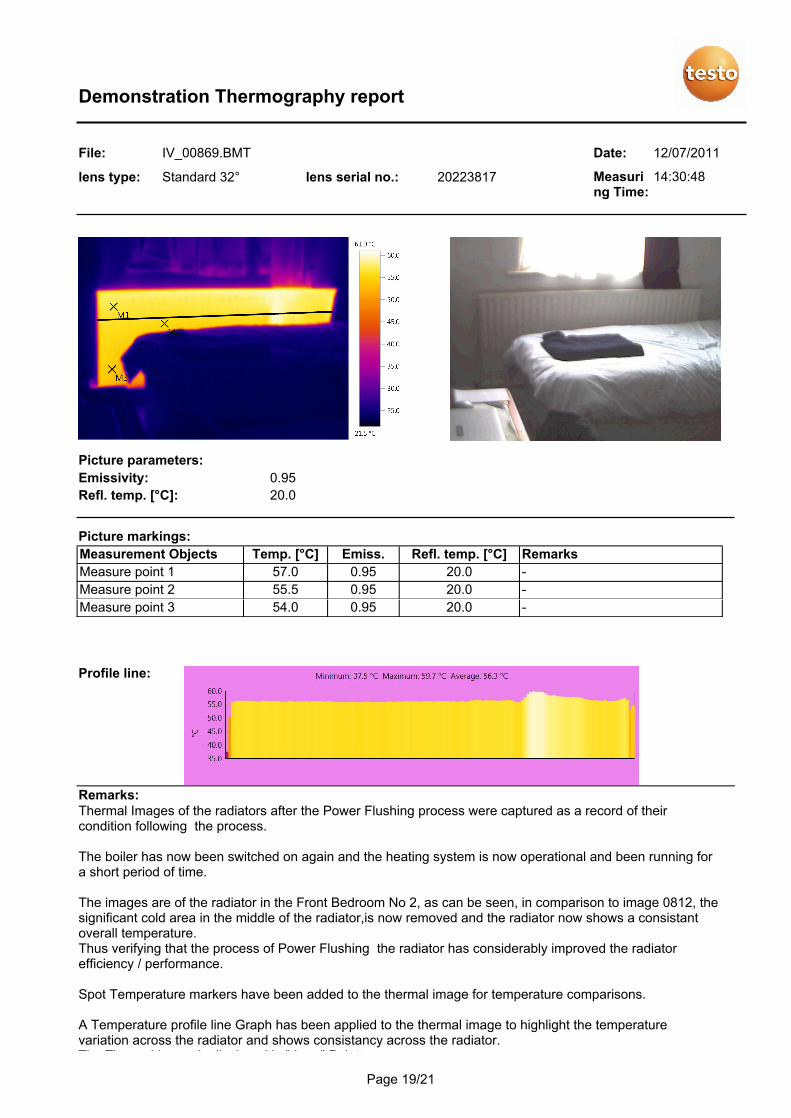
Thermal Images of the radiators after the Power Flushing process were captured as a record of theircondition following the process.
The boiler has now been switched on again and the heating system is now operational and been running fora short period of time.
The images are of the radiator in the Front Bedroom No 2, as can be seen, in comparison to image 0812, thesignificant cold area in the middle of the radiator,is now removed and the radiator now shows a consistantoverall temperature.Thus verifying that the process of Power Flushing the radiator has considerably improved the radiatorefficiency / performance.
Spot Temperature markers have been added to the thermal image for temperature comparisons.
A Temperature profile line Graph has been applied to the thermal image to highlight the temperaturevariation across the radiator and shows consistancy across the radiator.The Thermal Image is displayed in " Iron " Palette.
Demonstration Thermography report
File: IV_00869.BMT 12/07/2011
Measuring Time:
14:30:48
20.0Refl. temp. [°C]:
0.95Emissivity:
Picture parameters:
lens type: Standard 32° 20223817lens serial no.:
Date:
Picture markings:
RemarksRefl. temp. [°C]Emiss.Temp. [°C]Measurement Objects
-20.00.9557.0Measure point 1
-20.00.9555.5Measure point 2
-20.00.9554.0Measure point 3
Profile line:
Remarks:
19/21Page
Demonstration Thermography Report to highlight the capabilities of the Testo 875 series Thermal Imaging camera and the Testo IR software.
This is an example report for Demonstration purposes only. The report format is using the "Standard" report template from the selection of Report Templates available in the Testo IR software.
A demonstration of the Testo 875-2 Thermal Imaging camera was conducted for a Heating / Power Fluching Contractor, during the course of Power Flushing being conducted at Dwelling.The objective was to demonstrate how a Testo 875-2 Thermal Imaging camera could be used to record Thermal and Digital images during the course of the Power Flushing process, to show the conditions of the radiators prior to and after the process and to verify the the improvements made, using Power Flushing.The Boiler was switched on just prior to arrival and images were subsequently captured of the radiators, to record their condition / performance.With reference to the images at this stage, a number of the radiators had significant cold areas, indicating substantial contaminant / sludge and the need for Power Flushing. Images of the Lounge, Hall, Bedroom 1 and Bedroom 2 Radiators, (which were the radiators in the worst condition), were recorded for the purpose of comparison, following the process.
Images were also recorded during the Power Flushing process and specifically the images 0839, 0840 & 0845 show the Lounge radiator changing / improving condition during the process.
Following completion of the Power Flushing process on all the radiators, the boiler was switched on and the heating system was operational and images of the Lounge, Hall, Bedroom 1 and Bedroom 2 radiators were recorded for comparison purposes and to highlight the significant improvements in Condition / Performance.
As can be seen, the thermal images clearly show the conditions of the radiators before, during and after the Power Flushing process and verify the improvements that this process produces.
The purpose of the report is to demonstrate the capabilities of the Testo 875-2, a 160 x 120 pixel configuration Thermal Imaging camera in respect of the image quality / resolution that is recorded/produced with this level of Thermal Imaging camera and to demonstrate how it can be used to verify the Power Flushing process.
Please note that any temperatures indicated on the images are "Apparent Temperatures" and may not be truely representative. An overall emissivity value has been used in the images for these demonstration purposes. For accurate temperature measurement, the relevant emissivity value to the specific material to be measured, would have to be established.
It should be noted that Testo do not provide a Thermography Consultancy Service, the images are purely for Equipment Demonstration purposes to highlight the capabilities of the Testo range of Thermal Imaging cameras and the Testo IR software.It is not the purpose of the images/report to specifically identify/highlight any faults or Thermal Anomalies, or to provide comment/observation relating to any anomalies.
Some of the features of the camera and software have also been applied to the Thermal images.
Spot Temperature markers have been added to the thermal images to indicate temperatures.
Auto Hot / Cold Spot Indicator has been applied, which automatically highlights the Hottest or Coldest point in the defined area.
Temperature Profile Line Graph shows the temperature variation in graph form across the subject.
Palettes a variety of palettes have been used for the thermal images. Eight palettes are available on the camera and in the software.
Demonstration Thermography report
Thermal Images of the radiators after the Power Flushing process were captured as a record of theircondition following the process.
The boiler has now been switched on again and the heating system is now operational and been running fora short period of time.
The images are of the radiator in the Front Bedroom No 2, as can be seen, in comparison to image 0812, thesignificant cold area in the middle of the radiator,is now removed and the radiator now shows a consistantoverall temperature.Thus verifying that the process of Power Flushing the radiator has considerably improved the radiatorefficiency / performance.
Spot Temperature markers have been added to the thermal image for temperature comparisons.
A Temperature profile line Graph has been applied to the thermal image to highlight the temperaturevariation across the radiator and shows consistancy across the radiator.The Thermal Image is displayed in " Iron " Palette.
Review:
20/21Page
Demonstration Thermography report
The images are automatically Time and Date Stamped to verify the time and date when the images were taken.
The report also details the Emissivity value relating to the image taken.
Andy McGrath - Testo
,12/07/2011
21/21Page