Embed Size (px)
DESCRIPTION
Citation preview
Second Quarter 2013 Financial Results
Conference Call
July 25, 2013
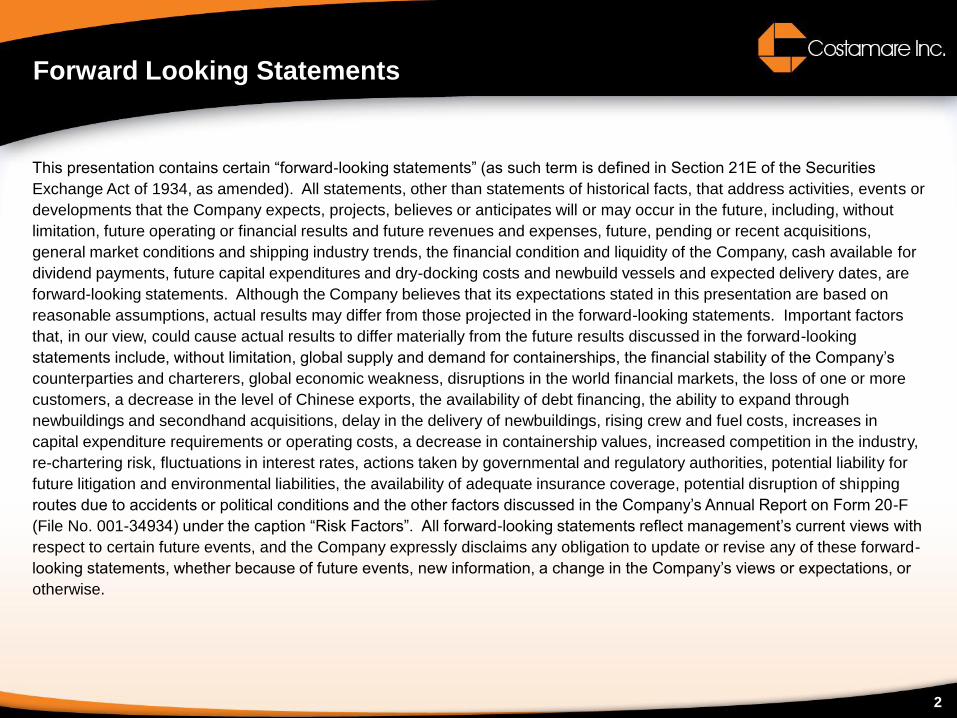
Forward Looking Statements
2
This presentation contains certain “forward-looking statements” (as such term is defined in Section 21E of the Securities
Exchange Act of 1934, as amended). All statements, other than statements of historical facts, that address activities, events or
developments that the Company expects, projects, believes or anticipates will or may occur in the future, including, without
limitation, future operating or financial results and future revenues and expenses, future, pending or recent acquisitions,
general market conditions and shipping industry trends, the financial condition and liquidity of the Company, cash available for
dividend payments, future capital expenditures and dry-docking costs and newbuild vessels and expected delivery dates, are
forward-looking statements. Although the Company believes that its expectations stated in this presentation are based on
reasonable assumptions, actual results may differ from those projected in the forward-looking statements. Important factors
that, in our view, could cause actual results to differ materially from the future results discussed in the forward-looking
statements include, without limitation, global supply and demand for containerships, the financial stability of the Company’s
counterparties and charterers, global economic weakness, disruptions in the world financial markets, the loss of one or more
customers, a decrease in the level of Chinese exports, the availability of debt financing, the ability to expand through
newbuildings and secondhand acquisitions, delay in the delivery of newbuildings, rising crew and fuel costs, increases in
capital expenditure requirements or operating costs, a decrease in containership values, increased competition in the industry,
re-chartering risk, fluctuations in interest rates, actions taken by governmental and regulatory authorities, potential liability for
future litigation and environmental liabilities, the availability of adequate insurance coverage, potential disruption of shipping
routes due to accidents or political conditions and the other factors discussed in the Company’s Annual Report on Form 20-F
(File No. 001-34934) under the caption “Risk Factors”. All forward-looking statements reflect management’s current views with
respect to certain future events, and the Company expressly disclaims any obligation to update or revise any of these forward-
looking statements, whether because of future events, new information, a change in the Company’s views or expectations, or
otherwise.
3
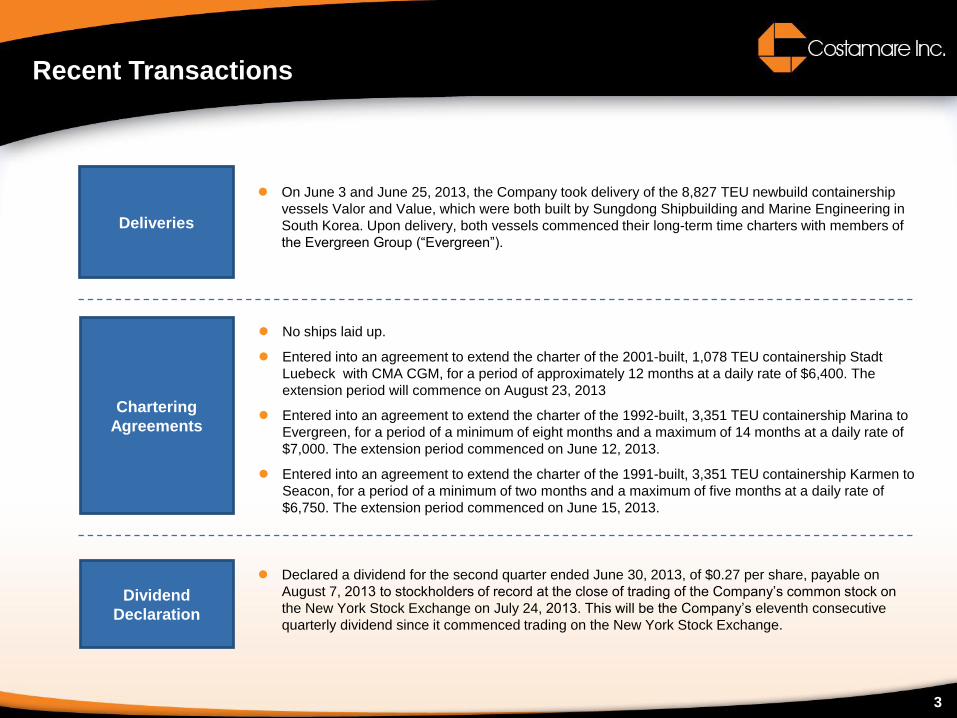
Recent Transactions
Deliveries
On June 3 and June 25, 2013, the Company took delivery of the 8,827 TEU newbuild containership
vessels Valor and Value, which were both built by Sungdong Shipbuilding and Marine Engineering in
South Korea. Upon delivery, both vessels commenced their long-term time charters with members of
the Evergreen Group (“Evergreen”).
Chartering
Agreements
No ships laid up.
Entered into an agreement to extend the charter of the 2001-built, 1,078 TEU containership Stadt
Luebeck with CMA CGM, for a period of approximately 12 months at a daily rate of $6,400. The
extension period will commence on August 23, 2013
Entered into an agreement to extend the charter of the 1992-built, 3,351 TEU containership Marina to
Evergreen, for a period of a minimum of eight months and a maximum of 14 months at a daily rate of
$7,000. The extension period commenced on June 12, 2013.
Entered into an agreement to extend the charter of the 1991-built, 3,351 TEU containership Karmen to
Seacon, for a period of a minimum of two months and a maximum of five months at a daily rate of
$6,750. The extension period commenced on June 15, 2013.
Dividend
Declaration
Declared a dividend for the second quarter ended June 30, 2013, of $0.27 per share, payable on
August 7, 2013 to stockholders of record at the close of trading of the Company’s common stock on
the New York Stock Exchange on July 24, 2013. This will be the Company’s eleventh consecutive
quarterly dividend since it commenced trading on the New York Stock Exchange.
4
Recent Transactions under the Framework Agreement
Acquisitions
and
Chartering
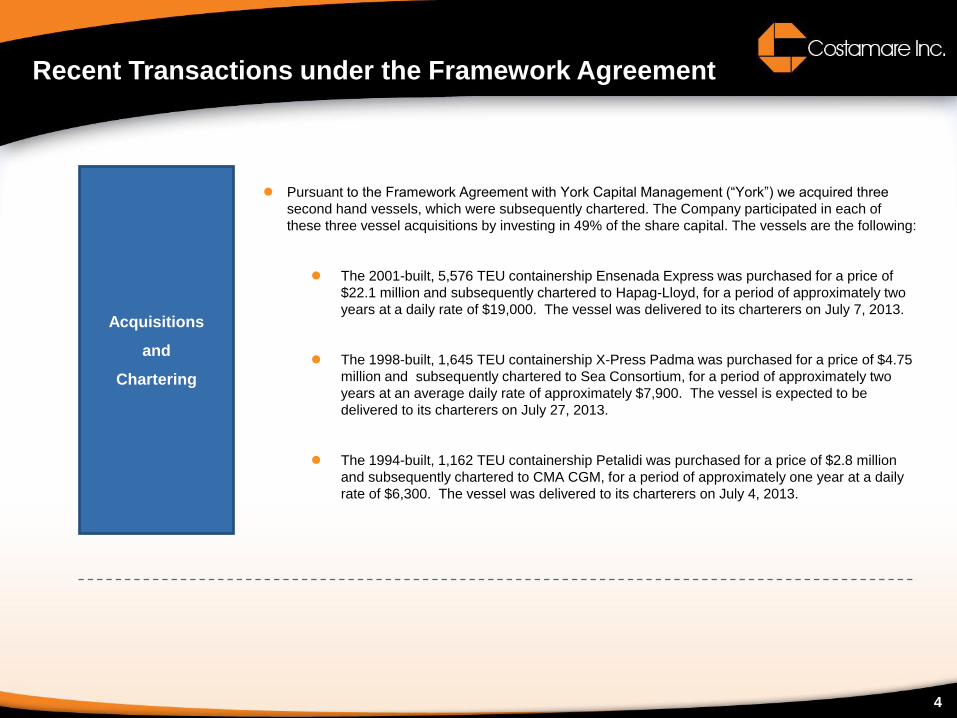
Pursuant to the Framework Agreement with York Capital Management (“York”) we acquired three
second hand vessels, which were subsequently chartered. The Company participated in each of
these three vessel acquisitions by investing in 49% of the share capital. The vessels are the following:
The 2001-built, 5,576 TEU containership Ensenada Express was purchased for a price of
$22.1 million and subsequently chartered to Hapag-Lloyd, for a period of approximately two
years at a daily rate of $19,000. The vessel was delivered to its charterers on July 7, 2013.
The 1998-built, 1,645 TEU containership X-Press Padma was purchased for a price of $4.75
million and subsequently chartered to Sea Consortium, for a period of approximately two
years at an average daily rate of approximately $7,900. The vessel is expected to be
delivered to its charterers on July 27, 2013.
The 1994-built, 1,162 TEU containership Petalidi was purchased for a price of $2.8 million
and subsequently chartered to CMA CGM, for a period of approximately one year at a daily
rate of $6,300. The vessel was delivered to its charterers on July 4, 2013.
5
Income Statement
5
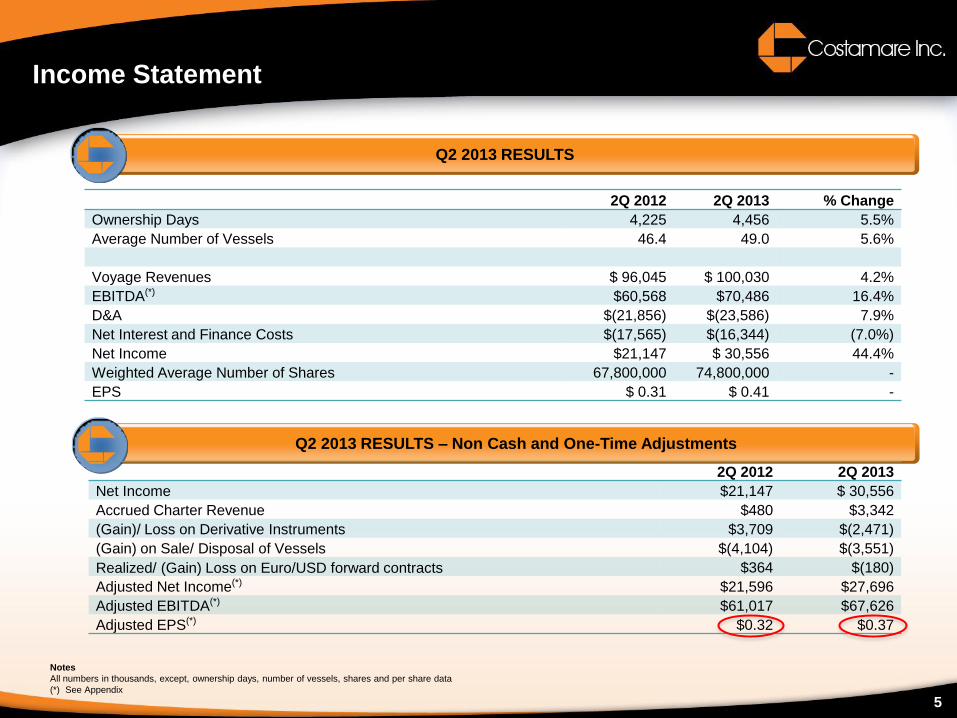
2Q 2012 2Q 2013 % Change
Ownership Days 4,225 4,456 5.5%
Average Number of Vessels 46.4 49.0 5.6%
Voyage Revenues $ 96,045 $ 100,030 4.2%
EBITDA(*) $60,568 $70,486 16.4%
D&A $(21,856) $(23,586) 7.9%
Net Interest and Finance Costs $(17,565) $(16,344) (7.0%)
Net Income $21,147 $ 30,556 44.4%
Weighted Average Number of Shares 67,800,000 74,800,000 -
EPS $ 0.31 $ 0.41 -
Q2 2013 RESULTS
Q2 2013 RESULTS – Non Cash and One-Time Adjustments
2Q 2012 2Q 2013
Net Income $21,147 $ 30,556
Accrued Charter Revenue $480 $3,342
(Gain)/ Loss on Derivative Instruments $3,709 $(2,471)
(Gain) on Sale/ Disposal of Vessels $(4,104) $(3,551)
Realized/ (Gain) Loss on Euro/USD forward contracts $364 $(180)
Adjusted Net Income(*) $21,596 $27,696
Adjusted EBITDA(*) $61,017 $67,626
Adjusted EPS(*) $0.32 $0.37
Notes
All numbers in thousands, except, ownership days, number of vessels, shares and per share data
(*) See Appendix
1.000 2.000 3.000
APM-Maersk
MSC
CMA CGM
Evergreen
COSCO
Hapag-Lloyd
APL
Hanjin
CSCL
MOL
OOCL
NYK Line
Hamburg Süd
Yang Ming
PIL
K Line
Zim
Hyundai M.M.
UASC
CSAV Group
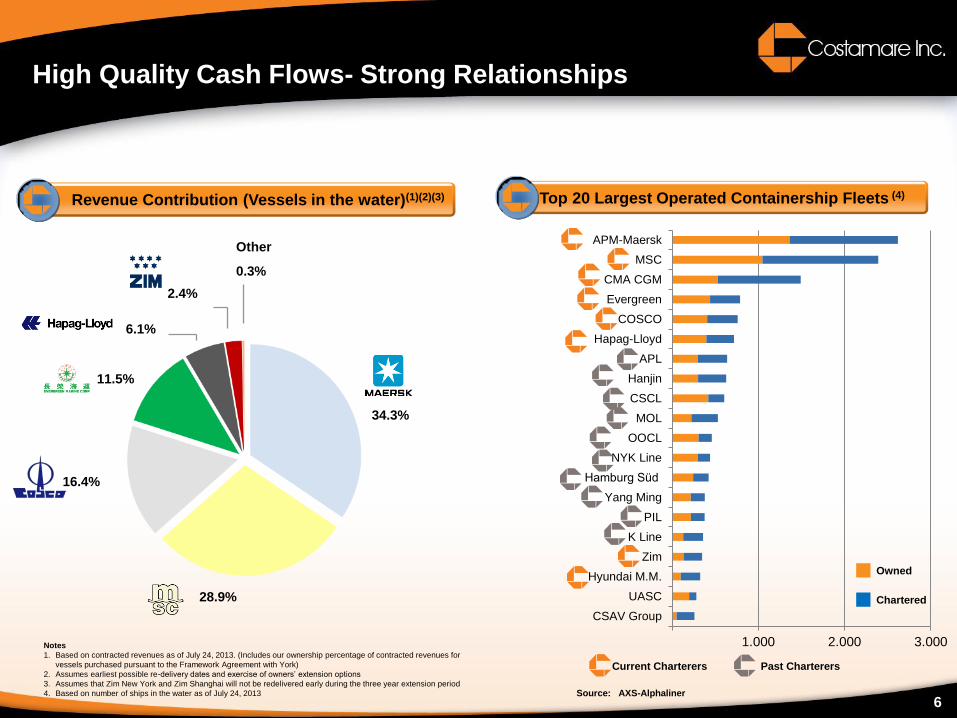
High Quality Cash Flows- Strong Relationships
Revenue Contribution (Vessels in the water)(1)(2)(3)
11.5%
16.4%
6.1%
34.3%
28.9%
Other
0.3%
2.4%
Top 20 Largest Operated Containership Fleets (4)
Source: AXS-Alphaliner
Current Charterers
Owned
Chartered
Past Charterers
Notes
1. Based on contracted revenues as of July 24, 2013. (Includes our ownership percentage of contracted revenues for
vessels purchased pursuant to the Framework Agreement with York)
2. Assumes earliest possible re-delivery dates and exercise of owners’ extension options
3. Assumes that Zim New York and Zim Shanghai will not be redelivered early during the three year extension period
4. Based on number of ships in the water as of July 24, 2013
6
7
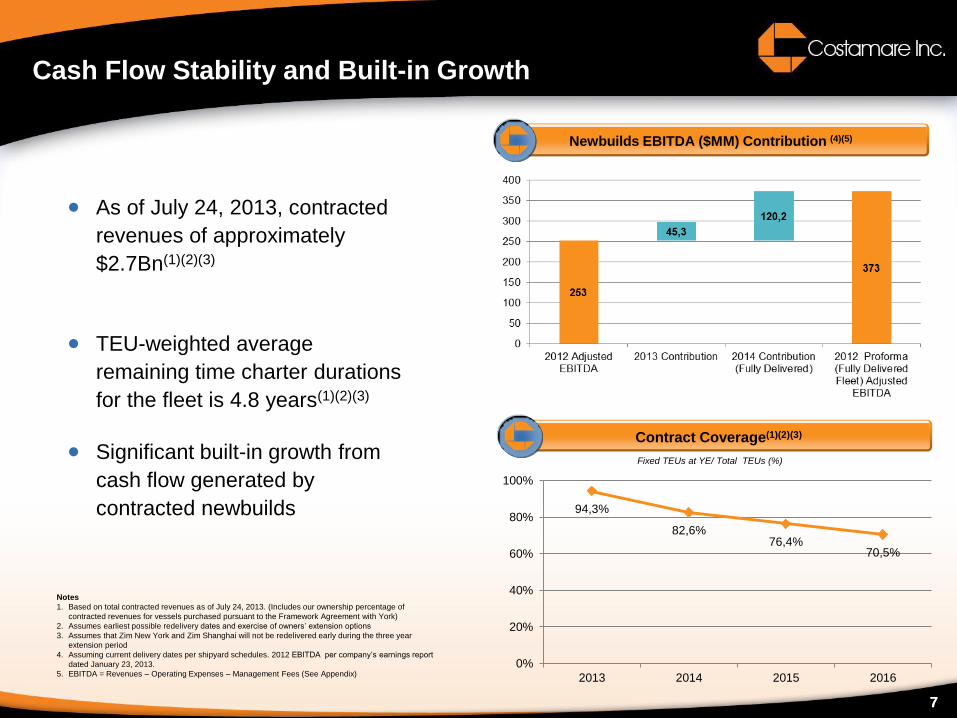
As of July 24, 2013, contracted
revenues of approximately
$2.7Bn(1)(2)(3)
TEU-weighted average
remaining time charter durations
for the fleet is 4.8 years(1)(2)(3)
Significant built-in growth from
cash flow generated by
contracted newbuilds
Cash Flow Stability and Built-in Growth
Notes
1. Based on total contracted revenues as of July 24, 2013. (Includes our ownership percentage of
contracted revenues for vessels purchased pursuant to the Framework Agreement with York)
2. Assumes earliest possible redelivery dates and exercise of owners’ extension options
3. Assumes that Zim New York and Zim Shanghai will not be redelivered early during the three year
extension period
4. Assuming current delivery dates per shipyard schedules. 2012 EBITDA per company’s earnings report
dated January 23, 2013.
5. EBITDA = Revenues – Operating Expenses – Management Fees (See Appendix)
7
Contract Coverage(1)(2)(3)
Newbuilds EBITDA ($MM) Contribution (4)(5)
Fixed TEUs at YE/ Total TEUs (%)
94,3%
82,6% 76,4%
70,5%
0%
20%
40%
60%
80%
100%
2013 2014 2015 2016
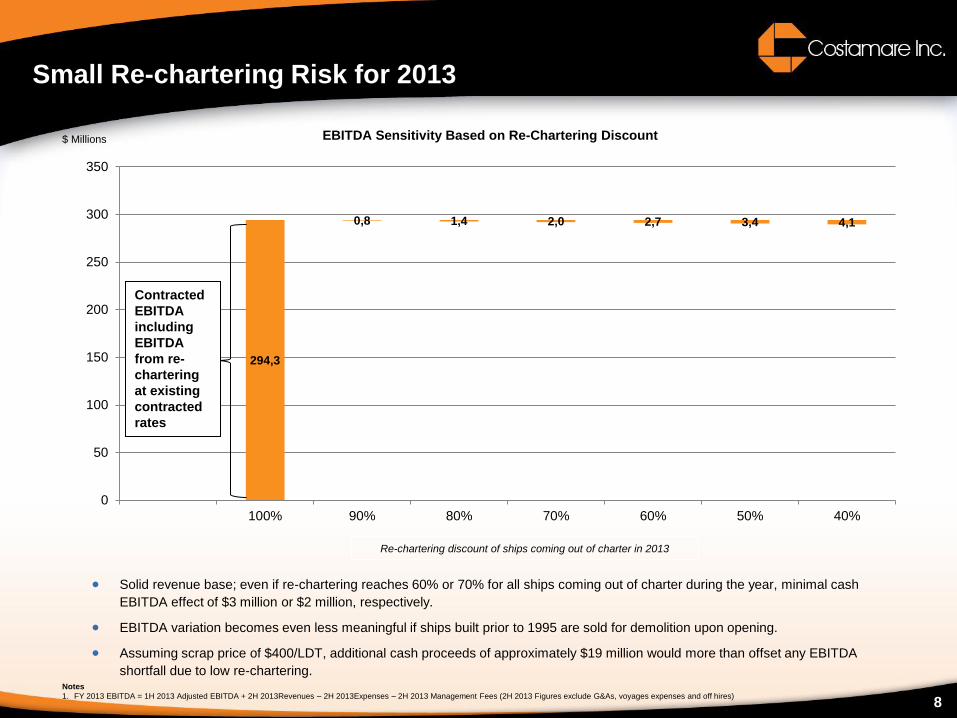
294,3
0,8 1,4 2,0 2,7 3,4 4,1
0
50
100
150
200
250
300
350
100% 90% 80% 70% 60% 50% 40%
8
Small Re-chartering Risk for 2013
Solid revenue base; even if re-chartering reaches 60% or 70% for all ships coming out of charter during the year, minimal cash
EBITDA effect of $3 million or $2 million, respectively.
EBITDA variation becomes even less meaningful if ships built prior to 1995 are sold for demolition upon opening.
Assuming scrap price of $400/LDT, additional cash proceeds of approximately $19 million would more than offset any EBITDA
shortfall due to low re-chartering.
Contracted
EBITDA
including
EBITDA
from re-
chartering
at existing
contracted
rates
Notes
1. FY 2013 EBITDA = 1H 2013 Adjusted EBITDA + 2H 2013Revenues – 2H 2013Expenses – 2H 2013 Management Fees (2H 2013 Figures exclude G&As, voyages expenses and off hires)
$ Millions EBITDA Sensitivity Based on Re-Chartering Discount
Re-chartering discount of ships coming out of charter in 2013
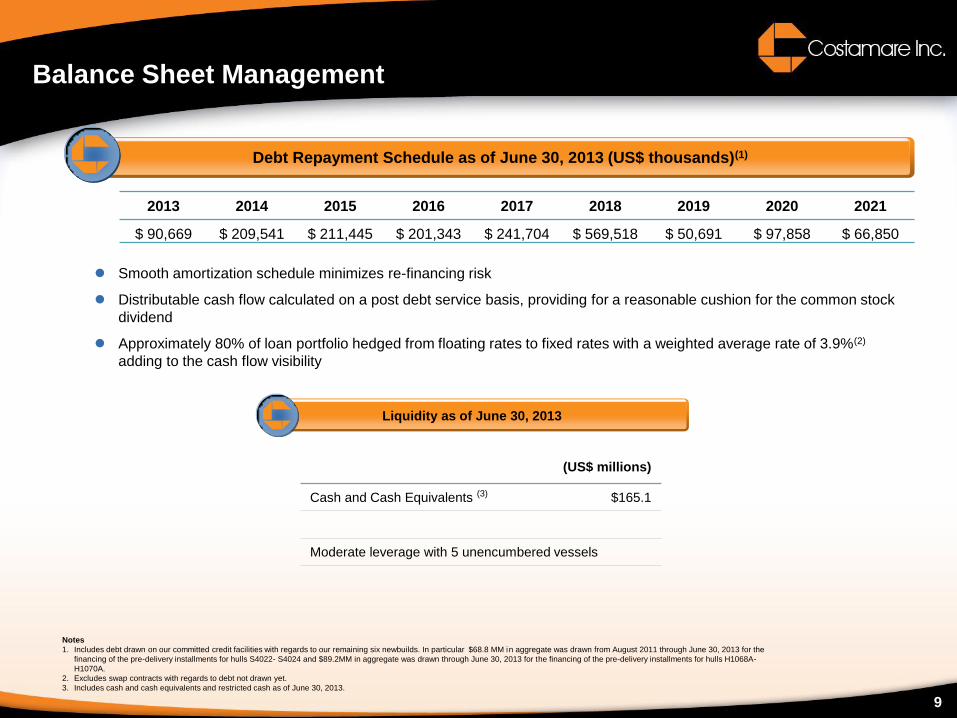
Debt Repayment Schedule as of June 30, 2013 (US$ thousands)(1)
Balance Sheet Management
Notes
1. Includes debt drawn on our committed credit facilities with regards to our remaining six newbuilds. In particular $68.8 MM in aggregate was drawn from August 2011 through June 30, 2013 for the
financing of the pre-delivery installments for hulls S4022- S4024 and $89.2MM in aggregate was drawn through June 30, 2013 for the financing of the pre-delivery installments for hulls H1068A-
H1070A.
2. Excludes swap contracts with regards to debt not drawn yet.
3. Includes cash and cash equivalents and restricted cash as of June 30, 2013.
2013 2014 2015 2016 2017 2018 2019 2020 2021
$ 90,669 $ 209,541 $ 211,445 $ 201,343 $ 241,704 $ 569,518 $ 50,691 $ 97,858 $ 66,850
Smooth amortization schedule minimizes re-financing risk
Distributable cash flow calculated on a post debt service basis, providing for a reasonable cushion for the common stock
dividend
Approximately 80% of loan portfolio hedged from floating rates to fixed rates with a weighted average rate of 3.9%(2)
adding to the cash flow visibility
9
(US$ millions)
Cash and Cash Equivalents (3) $165.1
Moderate leverage with 5 unencumbered vessels
Liquidity as of June 30, 2013
0%
10%
20%
30%
40%
50%
60%
70%
0
1000
2000
3000
4000
5000
6000
7000
8000
Jan
-08
Ap
r-08
Jul-0
8
Oct-
08
Jan
-09
Ap
r-09
Jul-0
9
Oct-
09
Jan
-10
Ap
r-10
Jul-1
0
Oct-
10
Jan
-11
Ap
r-11
Jul-1
1
Oct-
11
Jan
-12
Ap
r-12
Jul-1
2
Oct-
12
Jan
-13
Ap
r-13
Jul-1
3
Orderbook Orderbook as % of Fleet
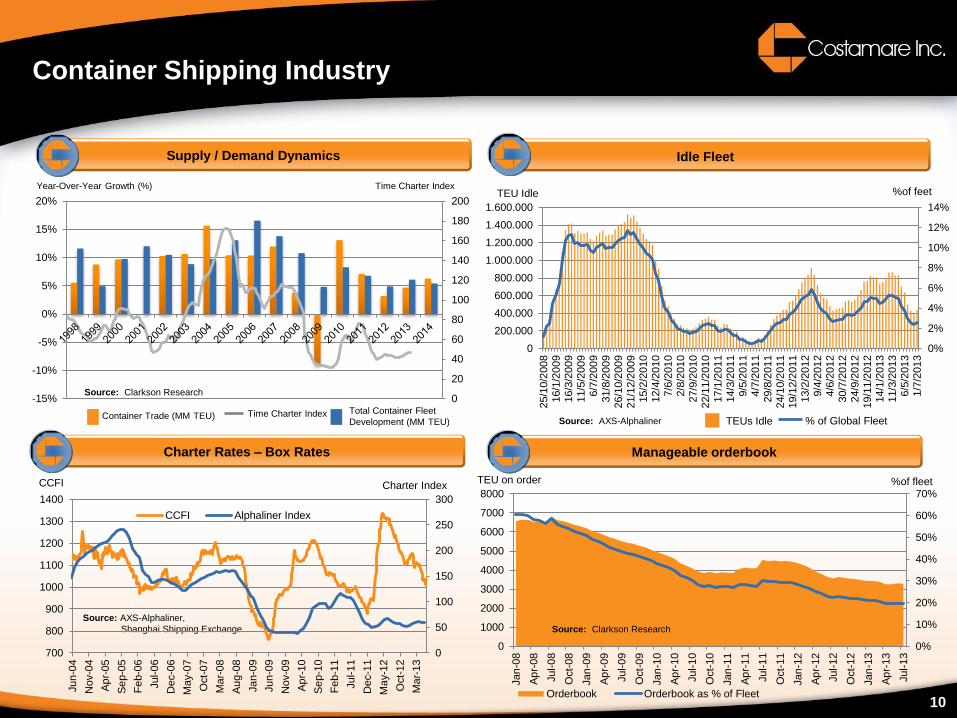
Container Shipping Industry
Idle Fleet Supply / Demand Dynamics
Year-Over-Year Growth (%) Time Charter Index
Container Trade (MM TEU) Total Container Fleet
Development (MM TEU) Time Charter Index
TEU Idle
TEUs Idle % of Global Fleet
%of feet
Source: Clarkson Research
Manageable orderbook
%of fleet TEU on order
Source: Clarkson Research
Source: AXS-Alphaliner
10
Charter Rates – Box Rates
Source: AXS-Alphaliner,
Shanghai Shipping Exchange
CCFI Charter Index
0%
2%
4%
6%
8%
10%
12%
14%
0
200.000
400.000
600.000
800.000
1.000.000
1.200.000
1.400.000
1.600.000
25/1
0/2
008
16/1
/20
09
16/3
/20
09
11/5
/20
09
6/7
/200
931/8
/20
09
26/1
0/2
009
21/1
2/2
009
15/2
/20
10
12/4
/20
10
7/6
/201
02/8
/201
027/9
/20
10
22/1
1/2
010
17/1
/20
11
14/3
/20
11
9/5
/201
14/7
/201
129/8
/20
11
24/1
0/2
011
19/1
2/2
011
13/2
/20
12
9/4
/201
24/6
/201
230/7
/20
12
24/9
/20
12
19/1
1/2
012
14/1
/20
13
11/3
/20
13
6/5
/201
31/7
/201
3
0
50
100
150
200
250
300
700
800
900
1000
1100
1200
1300
1400
Jun
-04
Nov-0
4
Ap
r-05
Se
p-0
5
Fe
b-0
6
Jul-0
6
Dec-0
6
Ma
y-0
7
Oct-
07
Ma
r-08
Au
g-0
8
Jan
-09
Jun
-09
Nov-0
9
Ap
r-10
Se
p-1
0
Fe
b-1
1
Jul-1
1
Dec-1
1
Ma
y-1
2
Oct-
12
Ma
r-13
CCFI Alphaliner Index
0
20
40
60
80
100
120
140
160
180
200
-15%
-10%
-5%
0%
5%
10%
15%
20%

Q & A
11
12
APPENDIX
13
Appendix
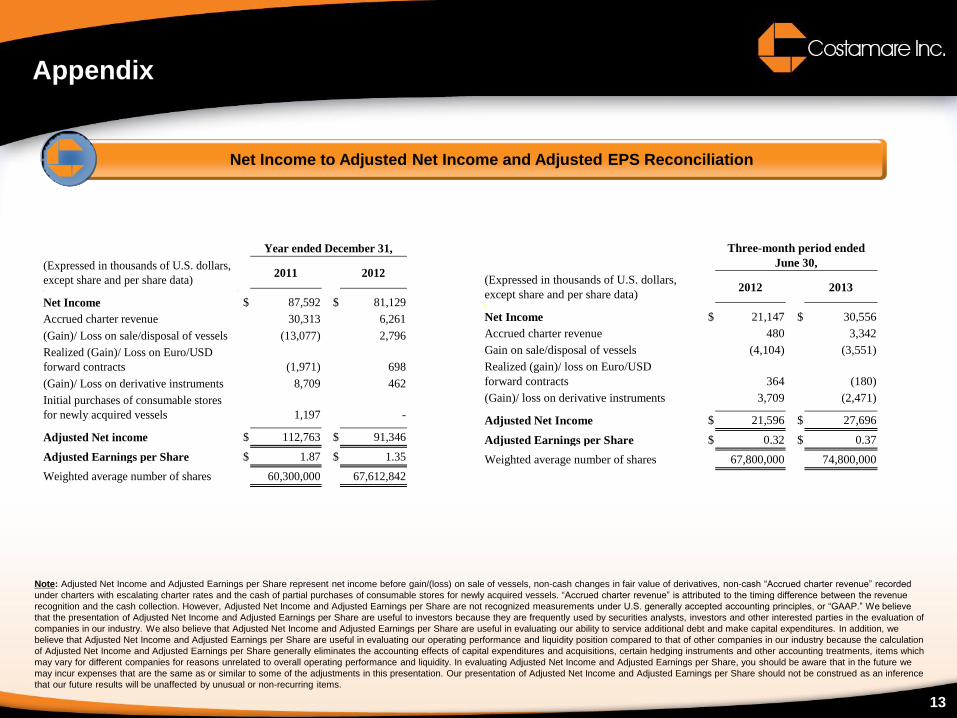
Net Income to Adjusted Net Income and Adjusted EPS Reconciliation
Note: Adjusted Net Income and Adjusted Earnings per Share represent net income before gain/(loss) on sale of vessels, non-cash changes in fair value of derivatives, non-cash “Accrued charter revenue” recorded
under charters with escalating charter rates and the cash of partial purchases of consumable stores for newly acquired vessels. “Accrued charter revenue” is attributed to the timing difference between the revenue
recognition and the cash collection. However, Adjusted Net Income and Adjusted Earnings per Share are not recognized measurements under U.S. generally accepted accounting principles, or “GAAP.” We believe
that the presentation of Adjusted Net Income and Adjusted Earnings per Share are useful to investors because they are frequently used by securities analysts, investors and other interested parties in the evaluation of
companies in our industry. We also believe that Adjusted Net Income and Adjusted Earnings per Share are useful in evaluating our ability to service additional debt and make capital expenditures. In addition, we
believe that Adjusted Net Income and Adjusted Earnings per Share are useful in evaluating our operating performance and liquidity position compared to that of other companies in our industry because the calculation
of Adjusted Net Income and Adjusted Earnings per Share generally eliminates the accounting effects of capital expenditures and acquisitions, certain hedging instruments and other accounting treatments, items which
may vary for different companies for reasons unrelated to overall operating performance and liquidity. In evaluating Adjusted Net Income and Adjusted Earnings per Share, you should be aware that in the future we
may incur expenses that are the same as or similar to some of the adjustments in this presentation. Our presentation of Adjusted Net Income and Adjusted Earnings per Share should not be construed as an inference
that our future results will be unaffected by unusual or non-recurring items.
Year ended December 31,
(Expressed in thousands of U.S. dollars,
except share and per share data)
2011 2012
Net Income $ 87,592 $ 81,129
Accrued charter revenue
30,313
6,261
(Gain)/ Loss on sale/disposal of vessels
(13,077)
2,796
Realized (Gain)/ Loss on Euro/USD
forward contracts
(1,971)
698
(Gain)/ Loss on derivative instruments
8,709
462
Initial purchases of consumable stores
for newly acquired vessels
1,197
-
Adjusted Net income $ 112,763 $ 91,346
Adjusted Earnings per Share $ 1.87 $ 1.35
Weighted average number of shares
60,300,000
67,612,842
Three-month period ended
June 30,
(Expressed in thousands of U.S. dollars,
except share and per share data)
2012 2013
Net Income $ 21,147 $ 30,556
Accrued charter revenue
480
3,342
Gain on sale/disposal of vessels
(4,104)
(3,551)
Realized (gain)/ loss on Euro/USD
forward contracts
364
(180)
(Gain)/ loss on derivative instruments
3,709
(2,471)
Adjusted Net Income $ 21,596 $ 27,696
Adjusted Earnings per Share $ 0.32 $ 0.37
Weighted average number of shares
67,800,000
74,800,000
14
Appendix
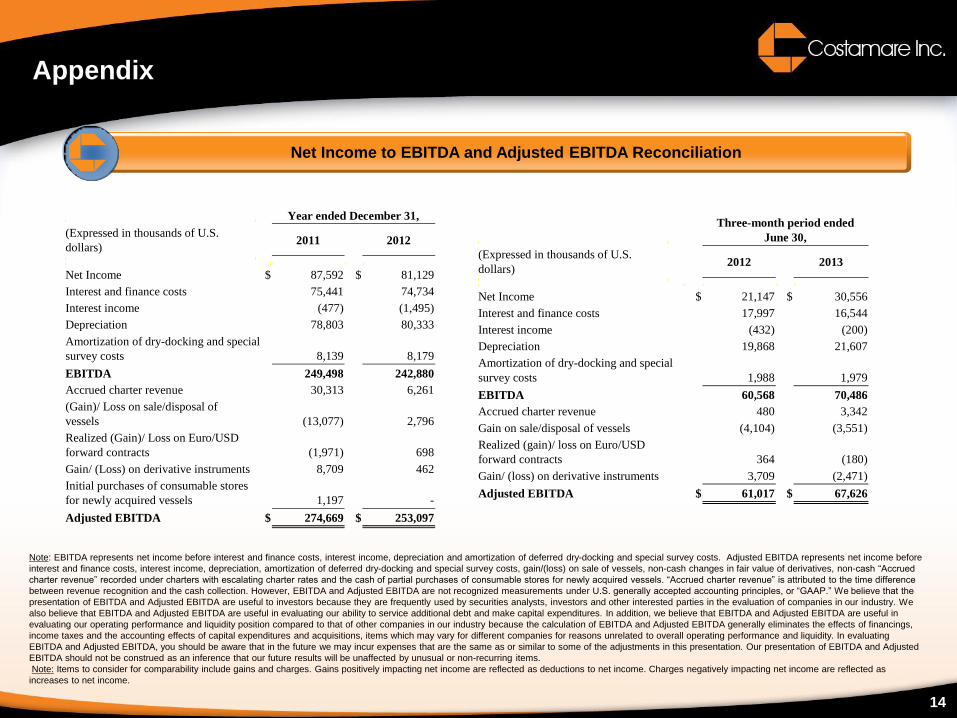
Net Income to EBITDA and Adjusted EBITDA Reconciliation
Note: EBITDA represents net income before interest and finance costs, interest income, depreciation and amortization of deferred dry-docking and special survey costs. Adjusted EBITDA represents net income before
interest and finance costs, interest income, depreciation, amortization of deferred dry-docking and special survey costs, gain/(loss) on sale of vessels, non-cash changes in fair value of derivatives, non-cash “Accrued
charter revenue” recorded under charters with escalating charter rates and the cash of partial purchases of consumable stores for newly acquired vessels. “Accrued charter revenue” is attributed to the time difference
between revenue recognition and the cash collection. However, EBITDA and Adjusted EBITDA are not recognized measurements under U.S. generally accepted accounting principles, or “GAAP.” We believe that the
presentation of EBITDA and Adjusted EBITDA are useful to investors because they are frequently used by securities analysts, investors and other interested parties in the evaluation of companies in our industry. We
also believe that EBITDA and Adjusted EBITDA are useful in evaluating our ability to service additional debt and make capital expenditures. In addition, we believe that EBITDA and Adjusted EBITDA are useful in
evaluating our operating performance and liquidity position compared to that of other companies in our industry because the calculation of EBITDA and Adjusted EBITDA generally eliminates the effects of financings,
income taxes and the accounting effects of capital expenditures and acquisitions, items which may vary for different companies for reasons unrelated to overall operating performance and liquidity. In evaluating
EBITDA and Adjusted EBITDA, you should be aware that in the future we may incur expenses that are the same as or similar to some of the adjustments in this presentation. Our presentation of EBITDA and Adjusted
EBITDA should not be construed as an inference that our future results will be unaffected by unusual or non-recurring items.
Note: Items to consider for comparability include gains and charges. Gains positively impacting net income are reflected as deductions to net income. Charges negatively impacting net income are reflected as
increases to net income.
Year ended December 31,
(Expressed in thousands of U.S.
dollars)
2011 2012
Net Income $ 87,592 $ 81,129
Interest and finance costs
75,441
74,734
Interest income
(477)
(1,495)
Depreciation
78,803
80,333
Amortization of dry-docking and special
survey costs 8,139
8,179
EBITDA
249,498
242,880
Accrued charter revenue
30,313
6,261
(Gain)/ Loss on sale/disposal of
vessels
(13,077)
2,796
Realized (Gain)/ Loss on Euro/USD
forward contracts
(1,971)
698
Gain/ (Loss) on derivative instruments
8,709
462
Initial purchases of consumable stores
for newly acquired vessels
1,197
-
Adjusted EBITDA $ 274,669 $ 253,097
Three-month period ended
June 30,
(Expressed in thousands of U.S.
dollars)
2012 2013
Net Income $ 21,147 $ 30,556
Interest and finance costs
17,997
16,544
Interest income
(432)
(200)
Depreciation
19,868
21,607
Amortization of dry-docking and special
survey costs
1,988
1,979
EBITDA
60,568
70,486
Accrued charter revenue
480
3,342
Gain on sale/disposal of vessels
(4,104)
(3,551)
Realized (gain)/ loss on Euro/USD
forward contracts
364
(180)
Gain/ (loss) on derivative instruments
3,709
(2,471)
Adjusted EBITDA $ 61,017 $ 67,626
15
Appendix
Assumptions for 2013 – 2014 Projected Newbuild Revenues and EBITDA
9 newbuild vessels delivered in 2013; 1 newbuild vessel delivered in 2014
Delivery dates per current shipyard schedules
Utilization of 364 days per year
Operating expenses per current estimates
Management fees per current management agreement
16
Appendix
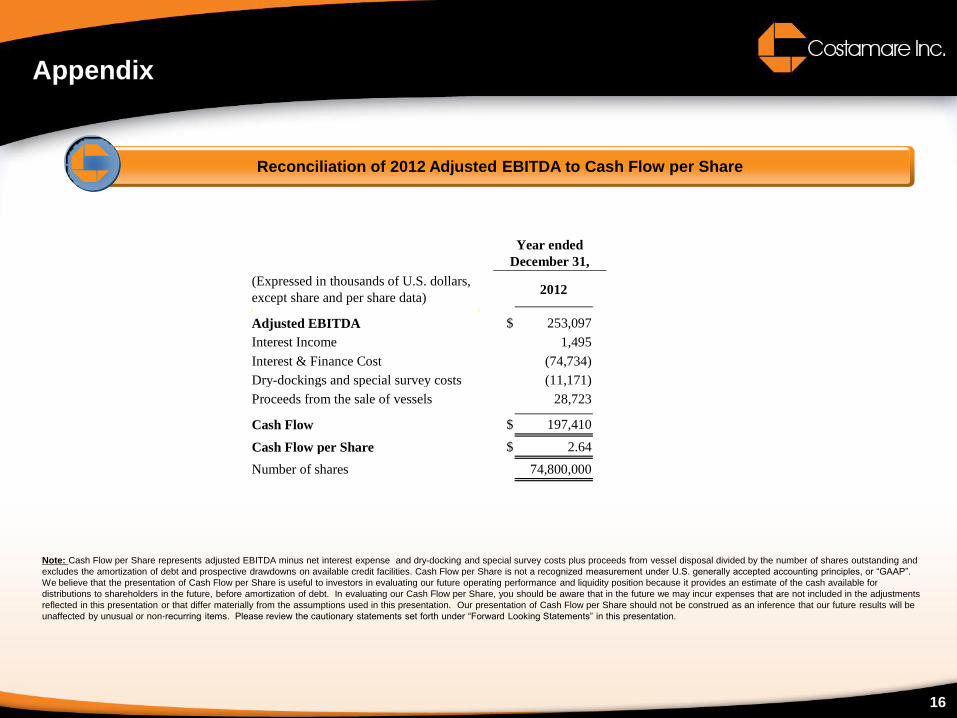
Reconciliation of 2012 Adjusted EBITDA to Cash Flow per Share
Note: Cash Flow per Share represents adjusted EBITDA minus net interest expense and dry-docking and special survey costs plus proceeds from vessel disposal divided by the number of shares outstanding and
excludes the amortization of debt and prospective drawdowns on available credit facilities. Cash Flow per Share is not a recognized measurement under U.S. generally accepted accounting principles, or “GAAP”.
We believe that the presentation of Cash Flow per Share is useful to investors in evaluating our future operating performance and liquidity position because it provides an estimate of the cash available for
distributions to shareholders in the future, before amortization of debt. In evaluating our Cash Flow per Share, you should be aware that in the future we may incur expenses that are not included in the adjustments
reflected in this presentation or that differ materially from the assumptions used in this presentation. Our presentation of Cash Flow per Share should not be construed as an inference that our future results will be
unaffected by unusual or non-recurring items. Please review the cautionary statements set forth under “Forward Looking Statements” in this presentation.
Year ended
December 31,
(Expressed in thousands of U.S. dollars,
except share and per share data)
2012
Adjusted EBITDA $ 253,097
Interest Income
1,495
Interest & Finance Cost
(74,734)
Dry-dockings and special survey costs
(11,171)
Proceeds from the sale of vessels
28,723
Cash Flow $ 197,410
Cash Flow per Share $ 2.64
Number of shares
74,800,000