Embed Size (px)
Citation preview
Ratio Analysis of Hays plc
Amany Hamza
Student number: 21202244
Tutor: Pat Coyle
Course
MBA / CFM
Word Count: 1990
(excluding Table of Contents, Cover Page, References and other
Appendices)
Date
14th December 2012
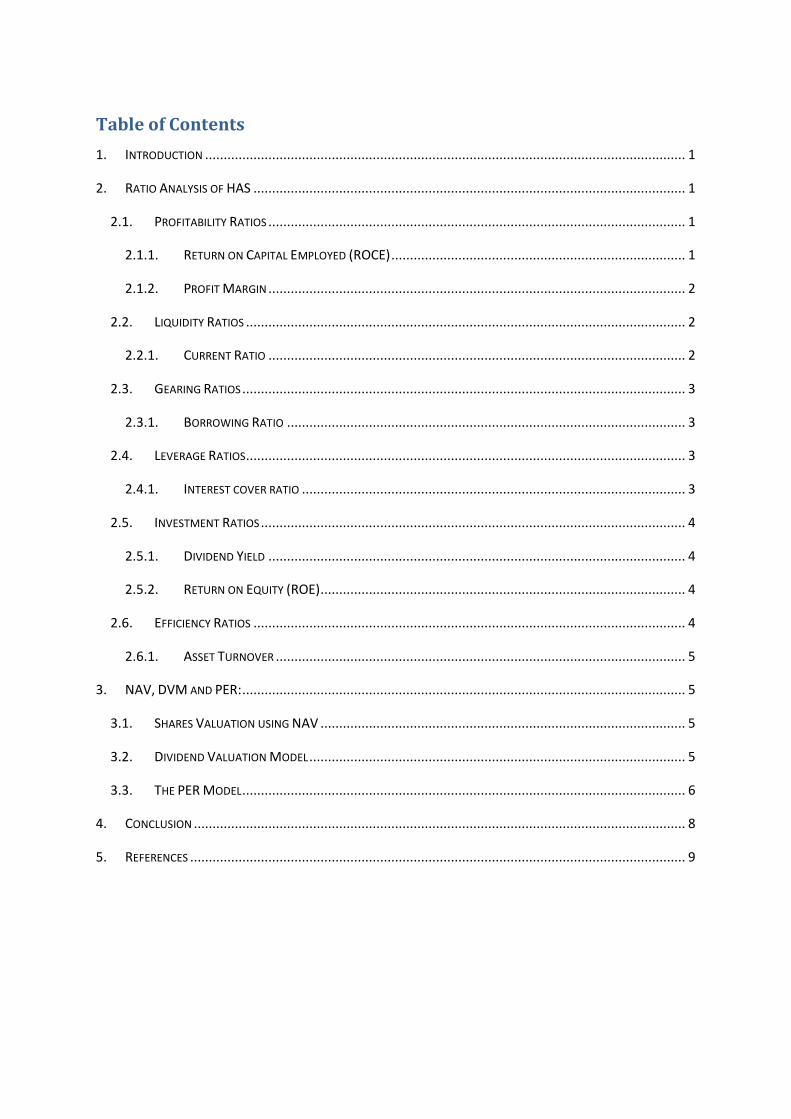
Table of Contents
1. INTRODUCTION ................................................................................................................................. 1
2. RATIO ANALYSIS OF HAS .................................................................................................................... 1
2.1. PROFITABILITY RATIOS ................................................................................................................ 1
2.1.1. RETURN ON CAPITAL EMPLOYED (ROCE) ............................................................................... 1
2.1.2. PROFIT MARGIN ................................................................................................................ 2
2.2. LIQUIDITY RATIOS ...................................................................................................................... 2
2.2.1. CURRENT RATIO ................................................................................................................ 2
2.3. GEARING RATIOS ....................................................................................................................... 3
2.3.1. BORROWING RATIO ........................................................................................................... 3
2.4. LEVERAGE RATIOS ...................................................................................................................... 3
2.4.1. INTEREST COVER RATIO ....................................................................................................... 3
2.5. INVESTMENT RATIOS .................................................................................................................. 4
2.5.1. DIVIDEND YIELD ................................................................................................................ 4
2.5.2. RETURN ON EQUITY (ROE) .................................................................................................. 4
2.6. EFFICIENCY RATIOS .................................................................................................................... 4
2.6.1. ASSET TURNOVER .............................................................................................................. 5
3. NAV, DVM AND PER: ....................................................................................................................... 5
3.1. SHARES VALUATION USING NAV .................................................................................................. 5
3.2. DIVIDEND VALUATION MODEL ..................................................................................................... 5
3.3. THE PER MODEL ....................................................................................................................... 6
4. CONCLUSION .................................................................................................................................... 8
5. REFERENCES ..................................................................................................................................... 9
1
1. INTRODUCTION
This report investigates the performance of Hays plc (HAS) during the period 2011-2012 to evaluate
the worthiness of HAS as a good investment.
HAS are ‘leading global experts in qualified, professional and skilled recruitment…They employ 7,800
staff in 245 offices across 33 countries’ (Hays plc, 2012)
2. RATIO ANALYSIS OF HAS
Gerald et al (2003) suggests that ‘Financial Ratios are computed by the managers to evaluate the
performance, progress and achievements of the company…They also help investors, creditors,
lenders and analysts in critically analysing an investment opportunity and credit decisions.’
2.1. PROFITABILITY RATIOS
They tell us whether a business is making profits - and if so whether at an acceptable rate
(Tutor2u, 2012).
2.1.1. RETURN ON CAPITAL EMPLOYED (ROCE)
It indicates the efficiency and profitability of a company's capital investments (Investopedia,
2012).
Return on Capital Employed (ROCE) = x 100%
On 30 June (£s millions)
2011 2012
= 25.9%110.70x 100
878.3-450.1
= 30.7%122.4x 100
862.5-463.6
Interpretation:
ROCE of 2012 is higher than 2011, which is an indication that the efficiency and
profitability of the company's capital investments in 2012 are better than 2011.
The ROCE grew by 4.8% which means that the return is £30.7 for every £100 of capital
employed. That can be due to:
1. The increase of 14m in the operating profit from 110.7m in 2011 to 122.4m in
2012.
2. The reduction in the amount of total assets by 15.8m; which could be associated
with the efficiency of assets’ utilization and generating more trade receivable as
noted¹ in the Annual Report.
Pre-tax Profit
Capital Employed
1 2
3 4 5 6
2
2.1.2. PROFIT MARGIN
It represents the percentage of revenue that a company keeps as profit after accounting for
fixed and variable costs (Ycharts, 2012).
Profit Margin= x 100%
2011 2012
= 3.50%
3,256.00
114.10 x 100
= 3.51%
3,654.60
128.10x 100
Interpretation:
The increase of 0.01% is associated with the 9% growth in operating profit in 2012. This
is driven by 8% growth in net fees and selective investments to improve productivity.
This growth indicates that HAS has good efficiency in managing its operations of sales
and also has control over direct and indirect costs.
2.2. LIQUIDITY RATIOS
Are used to determine a company's ability to pay off its short-terms debts obligations.
(Investopedia, 2012).
2.2.1. CURRENT RATIO
It measures the company's ability to pay back its short-term liabilities with its short-term
assets (Investopedia, 2012).
Current Ratio =
2011 2012
= 1.29T
450.1
579.3
= 1.25T
463.6
577.3
Interpretation:
The current ratio shows that, for every £1 in current liabilities, there is £1.25 available in
current assets.
The current ratio of Hays over the last two years has fluctuated slightly from 1.29T to
1.25T which is not a typical change. Therefore Hays has the ability to stay solvent. The
decline could be due to the decrease in the current assets or the increase of the current
Operating Profit
Sales
Current Assets
Current Liabilities
7 8
9 10
11 12
5 6
3
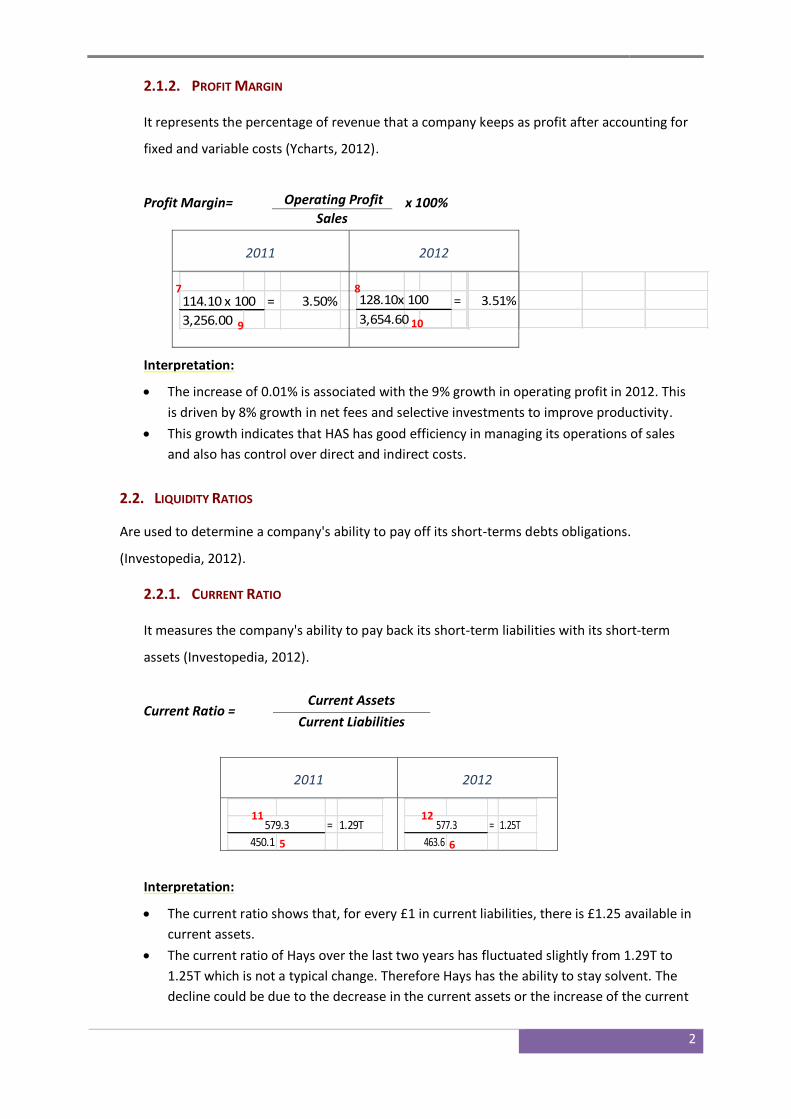
liabilities as a result of the state of fragile stability in the recruitment business (Ezine
Articles 2012)
2.3. GEARING RATIOS
A general term describing a ratio that compares some form of owner's equity (or capital) to
borrowed funds (Investopedia, 2012)
2.3.1. BORROWING RATIO
x 100% Total debt/Total equity =
2011 2012
= 96.69%
196.4
(185 + 4.9) X 100%
= 90.03%
190.6
(170 + 1.6) x 100%
Interpretation:
The 2012 ratio indicates that every £1.00 of capital that stockholders provided, creditors
provided £0.90. That means external debts are equal to 90.03% of shareholders’ funds.
The decline in the total debt-to-equity is a positive indicator of Hays having sufficient
funds to meet its financial obligations when they fall due.
2.4. LEVERAGE RATIOS
A company's leverage relates to how much debt it has on its balance sheet (Morningstar 2010).
2.4.1. INTEREST COVER RATIO
It gives a clear picture of the short-term financial health of a business.
Interest Cover =
2011 2012
114.1 = 15.21
8.5 - 1.0
128.1 = 22.47
6.6 - 0.9
Interpretation:
The ratio indicates that HAS can cover its interest charges as the operating profit is
considerably higher than net interest payable.
In the previous year, this ratio was 15.21T associated with higher net interest payable –
Finance cost was 7.5m - on total borrowing for the year 189.9m though HAS managed to
Total borrowings (Long-term +short term debt)
Equity
Operating Profit
Net Interest Payable
13 14 15 16
17 18
7 8
19 20 21 22
4
lower its borrowing in 2012 to 171.6m. Therefore the interest cover in 2012 came better
indicating a better financial health which means that Hays is more capable of meeting its
interest obligations from operating earnings.
2.5. INVESTMENT RATIOS
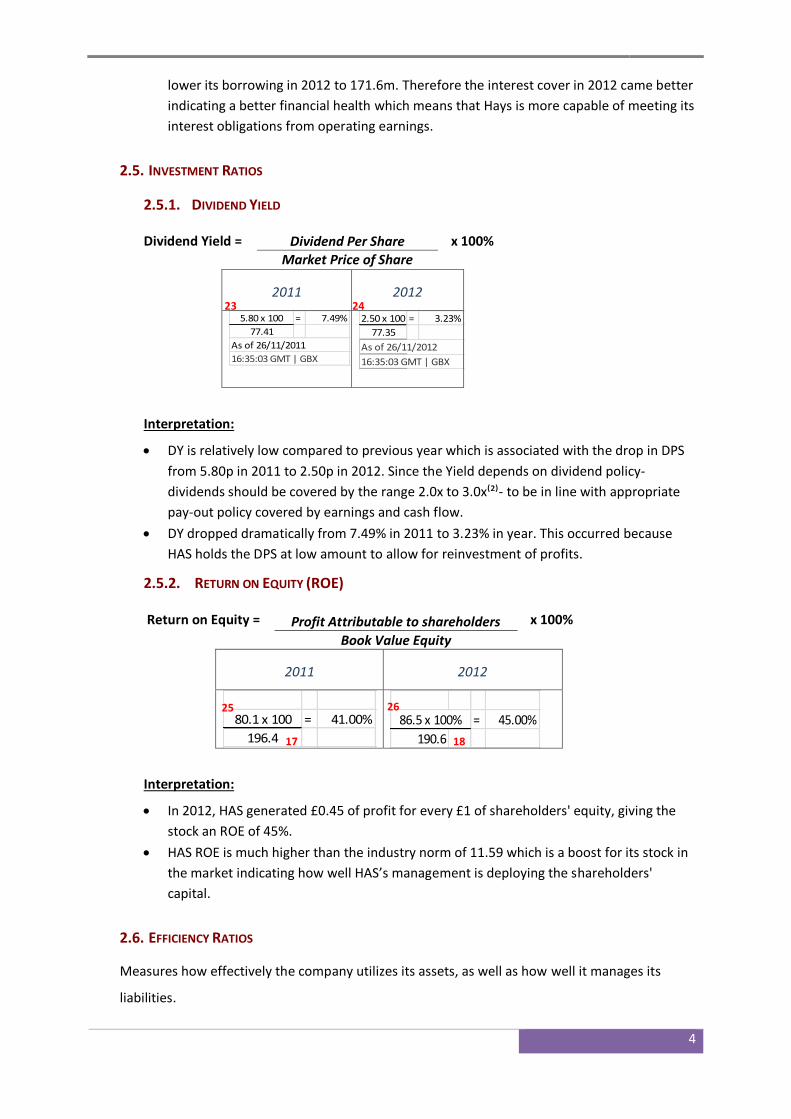
2.5.1. DIVIDEND YIELD
Dividend Yield = x 100%
2011 2012
5.80 x 100 = 7.49%
77.41
As of 26/11/2011
16:35:03 GMT | GBX
2.50 x 100 = 3.23%
77.35
As of 26/11/2012
16:35:03 GMT | GBX
Interpretation:
DY is relatively low compared to previous year which is associated with the drop in DPS
from 5.80p in 2011 to 2.50p in 2012. Since the Yield depends on dividend policy-
dividends should be covered by the range 2.0x to 3.0x⁽²⁾- to be in line with appropriate
pay-out policy covered by earnings and cash flow.
DY dropped dramatically from 7.49% in 2011 to 3.23% in year. This occurred because
HAS holds the DPS at low amount to allow for reinvestment of profits.
2.5.2. RETURN ON EQUITY (ROE)
Return on Equity = x 100%
2011 2012
80.1 x 100 = 41.00%
196.4
= 45.00%
190.6
86.5 x 100%
Interpretation:
In 2012, HAS generated £0.45 of profit for every £1 of shareholders' equity, giving the
stock an ROE of 45%.
HAS ROE is much higher than the industry norm of 11.59 which is a boost for its stock in
the market indicating how well HAS’s management is deploying the shareholders'
capital.
2.6. EFFICIENCY RATIOS
Measures how effectively the company utilizes its assets, as well as how well it manages its
liabilities.
Dividend Per Share
Market Price of Share
Profit Attributable to shareholders
Book Value Equity
23 24
25 26
17 18
5
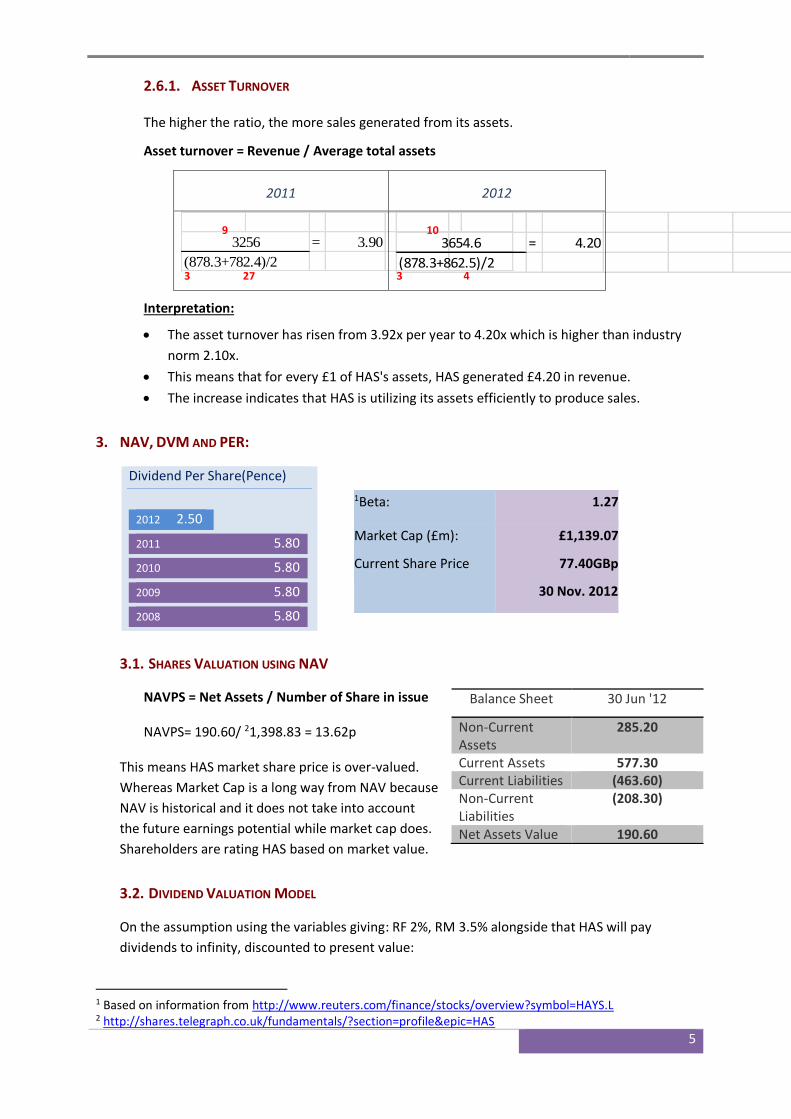
2.6.1. ASSET TURNOVER
The higher the ratio, the more sales generated from its assets.
Asset turnover = Revenue / Average total assets
2011 2012
= 3.90
(878.3+782.4)/2
3256
= 4.20
(878.3+862.5)/2
3654.6
Interpretation:
The asset turnover has risen from 3.92x per year to 4.20x which is higher than industry
norm 2.10x.
This means that for every £1 of HAS's assets, HAS generated £4.20 in revenue.
The increase indicates that HAS is utilizing its assets efficiently to produce sales.
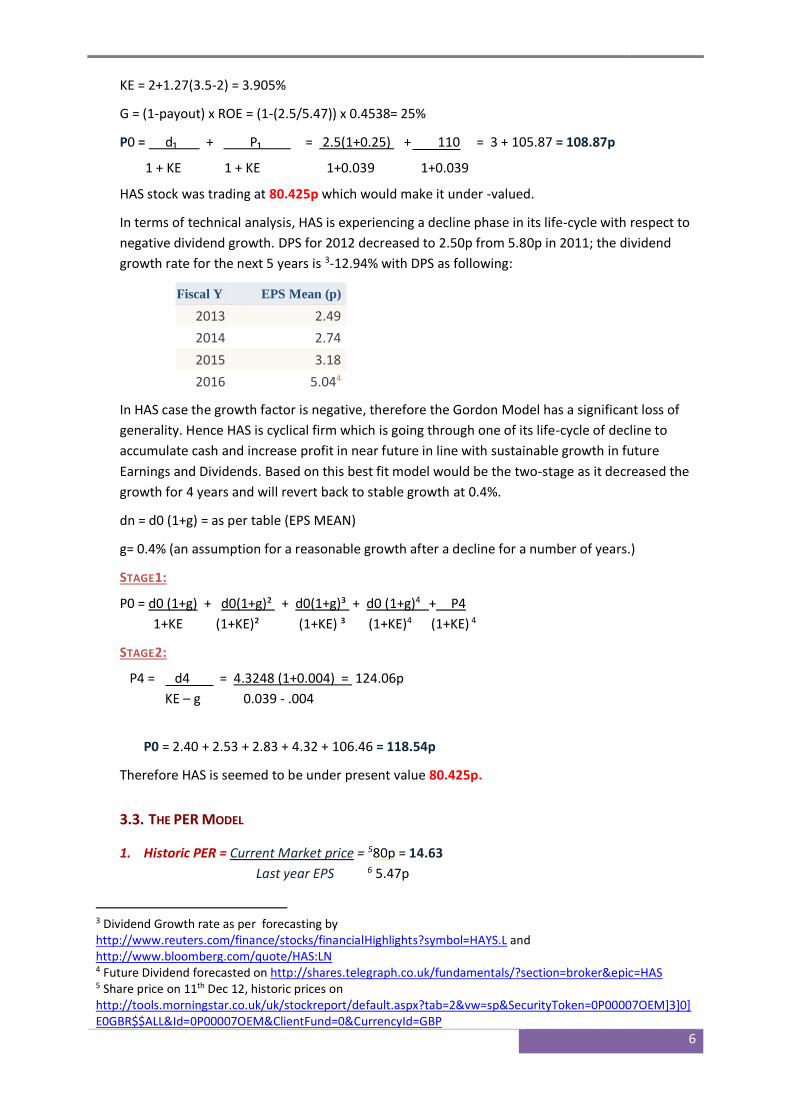
3. NAV, DVM AND PER:
Dividend Per Share(Pence)
2012 2.50
2011 5.80
2010 5.80
2009 5.80
2008 5.80
3.1. SHARES VALUATION USING NAV
NAVPS = Net Assets / Number of Share in issue
NAVPS= 190.60/ 21,398.83 = 13.62p
This means HAS market share price is over-valued.
Whereas Market Cap is a long way from NAV because
NAV is historical and it does not take into account
the future earnings potential while market cap does.
Shareholders are rating HAS based on market value.
3.2. DIVIDEND VALUATION MODEL
On the assumption using the variables giving: RF 2%, RM 3.5% alongside that HAS will pay
dividends to infinity, discounted to present value:
1 Based on information from http://www.reuters.com/finance/stocks/overview?symbol=HAYS.L 2 http://shares.telegraph.co.uk/fundamentals/?section=profile&epic=HAS
1Beta: 1.27
Market Cap (£m):
Current Share Price
£1,139.07
77.40GBp
30 Nov. 2012
Balance Sheet 30 Jun '12
Non-Current Assets
285.20
Current Assets 577.30 Current Liabilities (463.60) Non-Current Liabilities
(208.30)
Net Assets Value 190.60
10 9
3 3 27 4
6
KE = 2+1.27(3.5-2) = 3.905%
G = (1-payout) x ROE = (1-(2.5/5.47)) x 0.4538= 25%
P0 = d₁ + P₁ === 2.5(1+0.25) + 110 = 3 + 105.87 = 108.87p
1 + KE 1 + KE 1+0.039 1+0.039
HAS stock was trading at 80.425p which would make it under -valued.
In terms of technical analysis, HAS is experiencing a decline phase in its life-cycle with respect to
negative dividend growth. DPS for 2012 decreased to 2.50p from 5.80p in 2011; the dividend
growth rate for the next 5 years is 3-12.94% with DPS as following:
Fiscal Y EPS Mean (p)
2013 2.49
2014 2.74
2015 3.18
2016 5.044
In HAS case the growth factor is negative, therefore the Gordon Model has a significant loss of
generality. Hence HAS is cyclical firm which is going through one of its life-cycle of decline to
accumulate cash and increase profit in near future in line with sustainable growth in future
Earnings and Dividends. Based on this best fit model would be the two-stage as it decreased the
growth for 4 years and will revert back to stable growth at 0.4%.
dn = d0 (1+g) = as per table (EPS MEAN)
g= 0.4% (an assumption for a reasonable growth after a decline for a number of years.)
STAGE1:
P0 = d0 (1+g) + d0(1+g)² + d0(1+g)³ + d0 (1+g)4 + P4
1+KE (1+KE)² (1+KE) ³ (1+KE)4 (1+KE) 4
STAGE2:
P4 = d4 = 4.3248 (1+0.004) = 124.06p
KE – g 0.039 - .004
P0 = 2.40 + 2.53 + 2.83 + 4.32 + 106.46 = 118.54p
Therefore HAS is seemed to be under present value 80.425p.
3.3. THE PER MODEL
1. Historic PER = Current Market price = 580p = 14.63
Last year EPS 6 5.47p
3 Dividend Growth rate as per forecasting by http://www.reuters.com/finance/stocks/financialHighlights?symbol=HAYS.L and http://www.bloomberg.com/quote/HAS:LN 4 Future Dividend forecasted on http://shares.telegraph.co.uk/fundamentals/?section=broker&epic=HAS 5 Share price on 11th Dec 12, historic prices on http://tools.morningstar.co.uk/uk/stockreport/default.aspx?tab=2&vw=sp&SecurityToken=0P00007OEM]3]0]E0GBR$$ALL&Id=0P00007OEM&ClientFund=0&CurrencyId=GBP
7
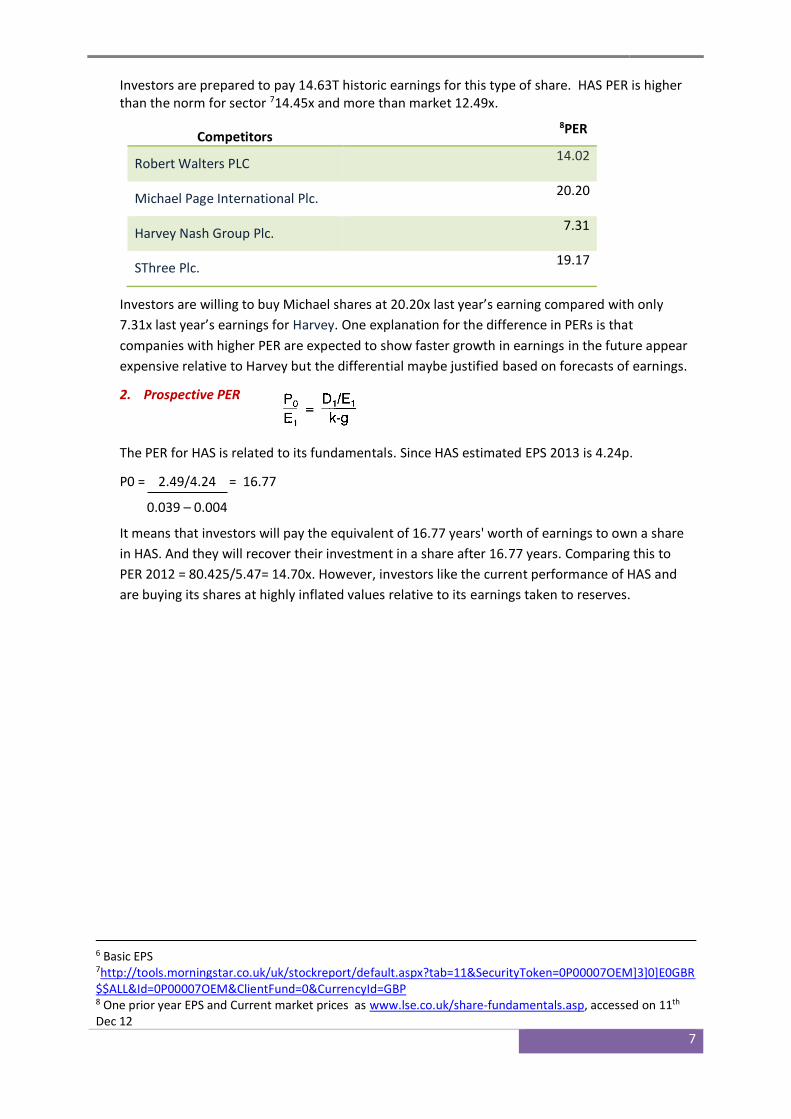
Investors are prepared to pay 14.63T historic earnings for this type of share. HAS PER is higher than the norm for sector 714.45x and more than market 12.49x.
Competitors 8PER
Robert Walters PLC 14.02
Michael Page International Plc. 20.20
Harvey Nash Group Plc. 7.31
SThree Plc. 19.17
Investors are willing to buy Michael shares at 20.20x last year’s earning compared with only
7.31x last year’s earnings for Harvey. One explanation for the difference in PERs is that
companies with higher PER are expected to show faster growth in earnings in the future appear
expensive relative to Harvey but the differential maybe justified based on forecasts of earnings.
2. Prospective PER
The PER for HAS is related to its fundamentals. Since HAS estimated EPS 2013 is 4.24p.
P0 = 2.49/4.24 = 16.77
0.039 – 0.004
It means that investors will pay the equivalent of 16.77 years' worth of earnings to own a share
in HAS. And they will recover their investment in a share after 16.77 years. Comparing this to
PER 2012 = 80.425/5.47= 14.70x. However, investors like the current performance of HAS and
are buying its shares at highly inflated values relative to its earnings taken to reserves.
6 Basic EPS 7http://tools.morningstar.co.uk/uk/stockreport/default.aspx?tab=11&SecurityToken=0P00007OEM]3]0]E0GBR$$ALL&Id=0P00007OEM&ClientFund=0&CurrencyId=GBP 8 One prior year EPS and Current market prices as www.lse.co.uk/share-fundamentals.asp, accessed on 11th Dec 12
8
4. CONCLUSION
Based on the Ratios, the expectations of the HAS performance look profitable. This is because they delivered good net fee growth of 8% driven by a strong performance of the International business, and taking appropriate action to defend the profit of the Group by focusing on strong cost control. This has positive impact on the financial performance in the long-term by increasing sales and reducing costs. This will give positive signals to investors that HAS is well worth buying.
On the other hand, Share Valuations which are based on projected characteristics rated shares as under-valued. However these intrinsic values have to take into account adjustments to estimate other value-enhancing traits to be a constructive tool. However low share prices comparable with competitors would be attractive to new investors who looked over consensus market analysis and found out that HAS is a good prospective share.
The capital structure of the Group consists of net debt of 90% of its equity, represented in cash and cash equivalents (note 19, p86), bank loans and overdrafts (note 20) and equity attributable to equity holders of the parent, comprising issued share capital, reserves and retained earnings (notes 24 to 28, p.93). HAS has an unsecured £300 million revolving credit facility, in place until January 2014. HAS has begun refinancing discussions with their banking group. Therefore they significantly decreased 18.3m in the debt from 189.90m to 171.60m to get better credit facilities.
So , based on this analysis, HAS seems to be a good company to invest in, since the company has showed sustainable growth in profit, and hacked back on dividends to restructure its capital to pay for its debt in terms of getting better credit facility and inject it into its capital with cheap cost. The investor sentiment is to pay for HAS stock which will get the price to increase piecemeal.
9
5. REFERENCES
EzineArticles (2012) What is the current ratio? [Accessed 13 Dec 2012] http://ezinearticles.com/?What-is-Current-Ratio?&id=1621448 Gerald I. White, Ashwinpaul C. Sondhi and Dov Fried (2003) The Analysis and Use of Financial Statements, 3rd edn, Wiley, p111 HAS (2012) Our business|Hays – Recruiting Experts Worldwide [Accessed 12 Dec 2012] http://www.hays.com/about-hays/our-business/index.htm Investopedia (2012) Return on Capital Empoyed (ROCE) Definition [Accessed 12 Dec 2012] http://www.investopedia.com/terms/r/roce.asp#axzz2EsRuris1 Investopedia (2012) Liquidity Ratios Definition [Accessed 13 Dec 2012] http://www.investopedia.com/terms/l/liquidityratios.asp#axzz2EsRuris1 Investopedia (2012) Current Ratio Defintion [Accessed 13 Dec 2012] http://www.investopedia.com/terms/c/currentratio.asp#axzz2EsRuris1 Investopedia (2012) Gearing Ratio Definition [Accessed 13 Dec 2012] http://www.investopedia.com/terms/g/gearingratio.asp#axzz2EsRuris1 Morningstar (2012) Leverage Ratios [Accessed 13 Dec 2012] http://news.morningstar.com/classroom2/course.asp?docId=145093&page=5&CN= Morningstar (2010) Efficiency Ratios [Accessed 13 Dec 2012] http://news.morningstar.com/classroom2/course.asp?docId=145093&page=3&CN Tutor2u (2012) Main Financial Ratios [Accessed 12 Dec 2012) http://www.tutor2u.net/business/accounts/main_ratios.htm Ycharts (2012) Profit Margin Definition [Accessed 13 Dec 2012) http://ycharts.com/glossary/terms/profit_margin