Embed Size (px)
Citation preview

Content Creation
The
Infographic
Way
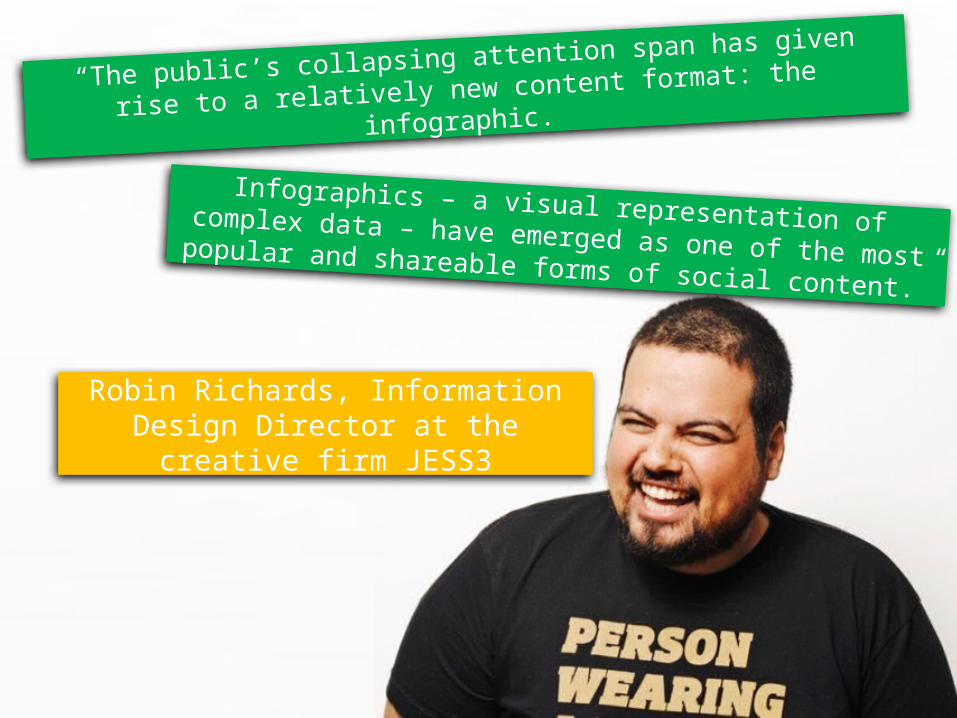
“The public’s collapsing attention span has given rise to a
relatively new content format: the infographic.
Infographics – a visual representation of complex data – have emerged as one of the most popular and shareable forms of social content.”
Robin Richards, Information Design Director at the creative
firm JESS3
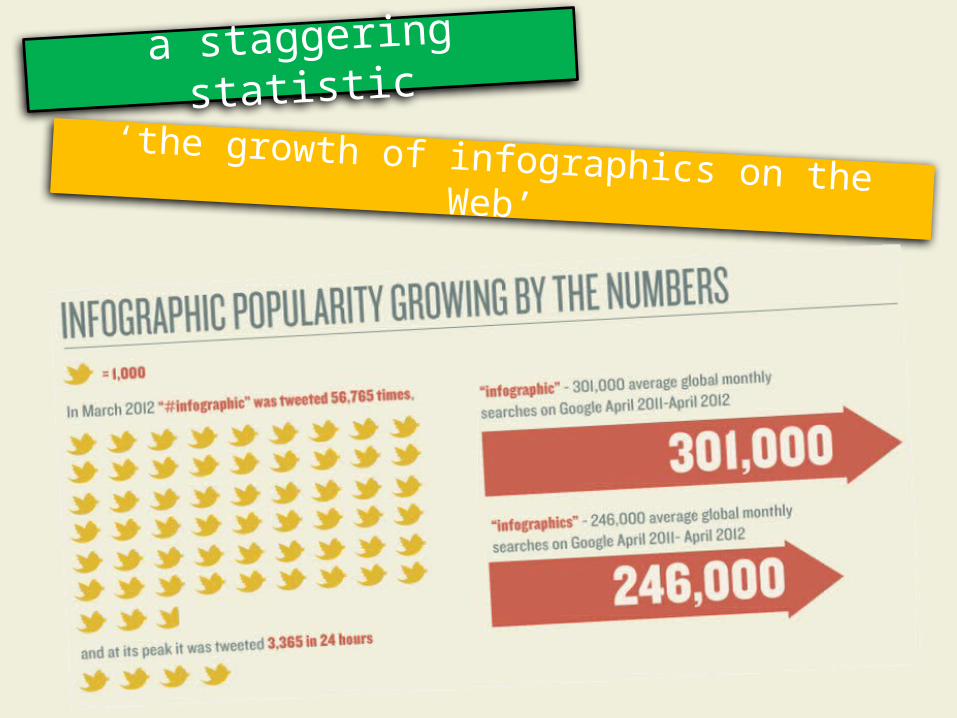
a staggering statistic
‘the growth of infographics on the Web’

Why Create INFOGRAPHICS?
• Easily understood
• Easily sharable
• Cater to a learning style
Takes fraction of the time to read, absorb and understand the information
65% of people are visual learners
the human brain processes visual information about 60,000 times faster than text.

A Strategic APPROACH TO INFOGRAPHICS
Static dynamic interactive
INFOGRAPHIC Formats

static INFOGRAPHIC
and versatile format
For utilizing
Information design
Most Prevalent

static INFOGRAPHIC
Editorial
Brand centric
2 primary b2b marketing applications

Editorial content - objectives
• Editorial
• virality
Content to establish the brand as a thought leader and an expert in the
industry
Creating viral impact, providing brand exposure and generating high volume
traffic

Brand centric content - objectives
The viewer is provided with
an explanation of the
business/campaign and/or
the communication of its
values
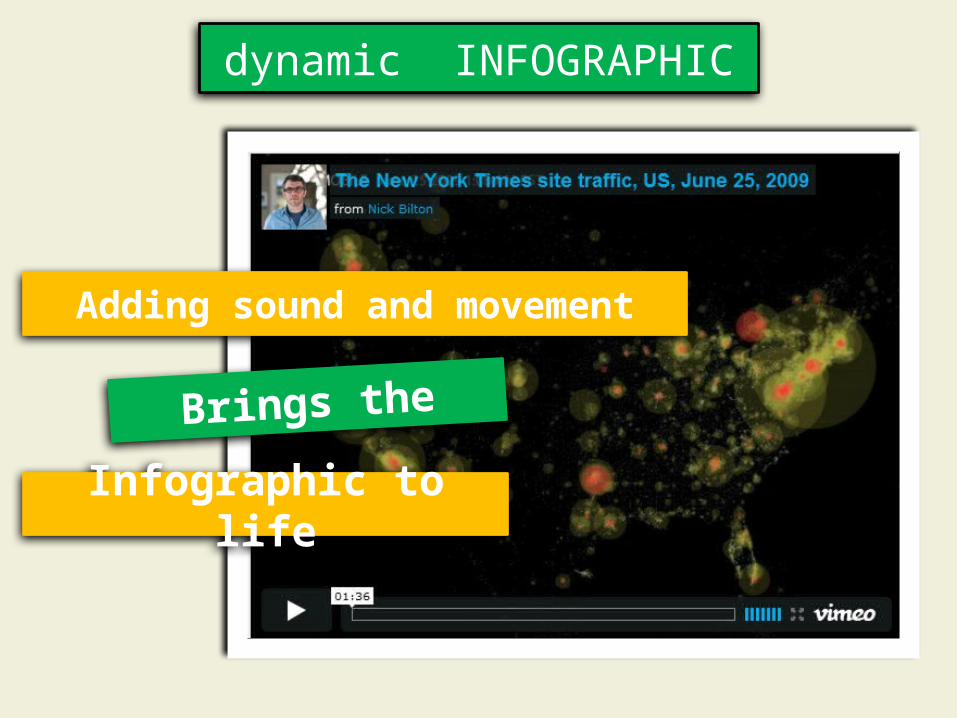
dynamic INFOGRAPHIC
Adding sound and movement
Brings the
Infographic to life

interactive INFOGRAPHIC
A customized exploration for the viewer
Allows for visualization
Of multiple layers of data

So, what makes a killer INFOGRAPHIC?
Sensible info+graphics that leave the
user informed and delighted
utility
attractivenesscredibility

Hang on …there are just a few things to remember
Keep It Simple
Ideas rule
Break up complex ideas, concepts or
processes
Its not just about skill or art. Conveying information effectively is the key

Also …
Tell A story
Make sharing
easy
What is the objective? Bring it out through a story
Use a Creative Commons license to make it easy for people to share infographics on their blogs and websites.

Return On Infographics (r.o.i)Adding Value to
business
Brand visibility
indicators
conversation
Business opportunity
What are your thoughts about the use of infographics for business?
Have you used infographics to share information or knowledge?
How did you measure the results?
- Pariket Doshi


![The Way We Email - 2015 [Infographic]](https://img.pdfslide.us/doc/110x75/55cd67b3bb61ebd3178b45c0/the-way-we-email-2015-infographic.jpg)


![EPCS - The better way to prescribe controlled substances [Infographic]](https://img.pdfslide.us/doc/110x75/589b9b281a28abd63e8b510b/epcs-the-better-way-to-prescribe-controlled-substances-infographic.jpg)


![The best way to build a website [Infographic]](https://img.pdfslide.us/doc/110x75/58a245b81a28ab7b3c8b6dc5/the-best-way-to-build-a-website-infographic.jpg)