Embed Size (px)
DESCRIPTION
For an Executive Summary of this report please contact [email protected] (+44 (0)20 7549 9976) or refer to our website https://www.visiongain.com/Report/1268/Chemical-Enhanced-Oil-Recovery-%28EOR%29-Market-Forecast-2014-2024
Citation preview

Chemical Enhanced Oil Recovery (EOR) Market Forecast 2014-2024
Prospects for Top Companies in Polymers, Biopolymers, Surfactants, CDG, SP & ASP
©noticeThis material is copyright by visiongain. It is against the law to reproduce any of this material without the prior written agreement of visiongain. You cannot photocopy, fax, download to database or duplicate in any other way any of the material contained in this report. Each purchase and single copy is for personal use only.
www.visiongain.com
Contents
1. Report Overview 1.1 Global Chemical EOR Market Overview
1.2 Global Chemical EOR Market Segmentation
1.3 Why You Should Read This Report
1.4 How This Report Delivers
1.5 Key Questions Answered by This Analytical Report Include:
1.6 Who is This Report For?
1.7 Chemical EOR Market Definition
1.8 Methodology
1.9 Frequently Asked Questions (FAQ)
1.10 Associated Visiongain Reports
1.11 About Visiongain
2. Introduction to Chemical Enhanced Oil Recovery (EOR) Market 2.1 How is the Enhanced Oil Recovery (EOR) Market Structured?
2.1.1 Primary Recovery
2.1.2 Secondary Recovery
2.1.3 Tertiary Recovery
2.2 Chemical EOR Processes
2.2.1 Polymer Flooding
2.2.2 Surfactant Flooding
2.2.3 Alkaline Flooding
2.2.4 Micellar Flooding
2.3 Major Chemicals Used in EOR Projects
2.4 Chemical EOR Market Definition
2.5 Major Themes Impacting the Chemical EOR Market
3. Global Chemical EOR Market Forecast 2014-2024 3.1 What are the Drivers and Restraints of the Global Chemical EOR Market?
3.1.1 Major Chemical EOR Drivers
3.1.2 Major Chemical EOR Restraints
4. Chemical EOR Submarket Analysis 4.1 Polymer Flooding as the Leading Technology
www.visiongain.com
Contents
4.2 What About Surfactants?
4.3 Are Hybrids the Future?
4.4 The Current Status of EOR Projects Globally
5. Leading National Chemical EOR Market 2014-2024 5.1 The Leading National Chemical EOR Markets 2014-2024
5.2 The Chinese Chemical EOR Market Forecast 2014-2024
5.2.1 The Chinese Chemical EOR Market Analysis
5.2.1.1 A Focus on Chinese Oil Operators and Opportunities for Chemical EOR
5.2.2 The Drivers and Restraints Impacting the Chinese Market
5.2.2.1 China: A World Leader in Chemical EOR
5.2.2.2 Despite Opportunity, Could the Chinese Chemical EOR Market be Limited by Competition?
5.2.3 The Outlook for China: Will Its Dominance Continue?
5.3 The Canadian Chemical EOR Market Forecast 2014-2024
5.3.1 The Canadian Chemical EOR Market Analysis
5.3.1.1 Cenovus’ Experience with Chemical EOR at Pelican Lake
5.3.1.2 CNRL’s Experience with Chemical EOR at Pelican Lake
5.3.1.3 Other Projects in Canada
5.3.1.4 A Focus on ASP Projects
5.3.2 What is Driving and Restraining the Canadian Chemical EOR Market?
5.3.2.1 Is Experience Enough to Drive the Canadian Chemical EOR Market Forward?
5.3.2.2 Will Costs and Technicalities Restrict the Canadian Chemical EOR Market?
5.3.3 Future Opportunities for Chemical EOR in Canada
5.4 The Russian Chemical EOR Market Forecast 2014-2024
5.4.1 The Russian Chemical EOR Market Analysis
5.4.1.1 The Use of Chemical EOR by Lukoil
5.4.2 Drivers and Restraints in the Russian Chemical EOR Market
5.4.2.1 Western Siberia and Falling Production
5.4.2.2 What Are the Restraints in Russia?
5.5 The Omani Chemical EOR Market Forecast 2014-2024
5.5.1 The Omani Chemical EOR Market Analysis
5.5.1.1 Marmul Chemical EOR: A Case Study
5.5.1.2 Does Oman Have Any Further Chemical EOR Experience?
5.5.2 The Drivers and Restraints Impacting the Omani Chemical EOR Market
5.5.2.1 PDO EOR Strategies
5.5.2.2 Oman’s Pilot Experience and Goals

www.visiongain.com
Contents
5.5.2.3 The Implications of Investment in Alternative EOR Techniques
5.5.3 What is the Overall Outlook for Oman?
5.6 The Rest of the Middle East Chemical EOR Market Forecast 2014-2024
5.6.1 The Rest of the Middle East Chemical EOR Market Analysis
5.6.1.1 Opportunities in Kuwait
5.6.1.2 Potential for the UAE
5.6.1.3 The Chemical EOR Market in Saudi Arabia
5.7 The Indonesian Chemical EOR Market Forecast 2014-2024
5.7.1 The Indonesian Chemical EOR Market Analysis
5.7.2 Drivers and Restraints for the Indonesian Chemical EOR Market
5.7.2.1 The Importance of Chemical EOR in Indonesia
5.7.2.2 Chemical EOR Potential in Indonesia
5.8 The Venezuelan Chemical EOR Market Forecast 2014-2024
5.8.1 The Venezuelan Chemical EOR Market Analysis
5.8.1.1 Are There Any Chemical EOR Projects in Venezuela Currently?
5.8.2 The Drivers and Restraints in the Venezuelan Chemical EOR Market
5.8.2.1 Extra-Heavy Oil and Falling Production Set to Provide Lift for the Chemical EOR Market in
Venezuela
5.8.2.2 The Future for PDVSA
5.8.3 What is the Outlook for Venezuela?
5.9 The Colombian Chemical EOR Market Forecast 2014-2024
5.9.1 The Columbian Chemical EOR Market Analysis
5.9.1.1 Are There Current Chemical EOR Projects in Colombia?
5.9.2 The Drivers and Restraints Impacting the Colombian Market
5.9.2.1 What is Driving the Colombian Market?
5.9.2.2 Will a Lack of Experience Detract from Chemical EOR Growth?
5.10 The Rest of Latin American Chemical EOR Market Forecast 2014-2024
5.10.1 The Rest of Latin America Chemical EOR Market Analysis
5.10.1.1 Argentina
5.10.1.1.1 What Are the Main Drivers and Restraints Impacting the Argentine Chemical
EOR Market?
5.10.1.1.2 The Outlook for Chemical EOR in Argentina
5.10.1.2 Brazil
5.10.1.3 Ecuador
5.11 The United States Chemical EOR Market Forecast 2014-2024
5.11.1 The United States Chemical EOR Market Analysis
5.11.1.1 What Is the Current Status of Chemical EOR In the US?

www.visiongain.com
Contents
5.11.2 The Drivers and Restraints Impacting the US Chemical EOR Market
5.11.2.1 Will the Chemical EOR Market in the US Rebound?
5.11.2.2 Will Increased Energy Security and Competition from Other EOR Techniques Push Chemical
EOR Out?
5.11.3 The Outlook for the US: Experience from Pilot Projects
5.12 The Indian Chemical EOR Market Forecast 2014-2024
5.12.1 The Indian Chemical EOR Market Analysis
5.12.2 What are the Major Drivers and Restraints in the Indian Chemical EOR Market?
5.12.2.1 As Energy Consumption Increases, and Oil Fields Mature, Will Chemical EOR be a Panacea
for India?
5.12.2.2 How Will Market Restraints Impact the Indian Chemical EOR Market?
5.12.3 Indian Chemical EOR Market Outlook: Future Projects and Opportunities
5.13 The Mexican Chemical EOR Market Forecast 2014-2024
5.13.1 The Mexican Chemical EOR Market Analysis
5.13.2 The Drivers and Restraints in the Mexican Chemical EOR Market
5.13.2.1 PEMEX’s EOR Strategy and the Mexican Reform
5.13.3 What is the Outlook for Mexico?
5.14 The North Sea Chemical EOR Market Forecast 2014-2024
5.14.1 The North Sea Chemical EOR Market
5.14.1.1 What Projects Exist in the UK?
5.14.1.2 What Projects Exist in Norway?
5.14.2 The Drivers and Restraints for the North Sea Market
5.14.2.1 Will Chemical EOR Be a Solution for Production Depletion?
5.14.2.2 The Realities of Chemical EOR Offshore
5.14.3 Is Chemical EOR Likely to be the Chosen Technology Going Forward?
5.15 The Malaysian Chemical EOR Market Forecast 2014-2024
5.15.1 The Malaysian Chemical EOR Market
5.15.1.1 Petronas and ExxonMobil’s Angsi Development
5.15.1.2 The Development of the St Joseph Field
5.15.2 Drivers and Restraints for the Malaysian Chemical EOR Market
5.15.2.1 Production Sharing Contracts as a Support Mechanism for Chemical EOR
5.15.2.2 Will Costs and Delays Weigh Down on Market Sentiment?
5.15.3 The Outlook for Chemical EOR in Malaysia
5.16 The Rest of the World Chemical EOR Market Forecast 2014-2024
5.16.1 Chemical EOR Markets in the Rest of the World
5.16.1.1 The German Chemical EOR Market
5.16.1.2 The Egyptian Chemical EOR Market
www.visiongain.com
Contents
5.16.1.3 The Angolan Chemical EOR Market
5.16.1.4 The Kazakh Chemical EOR Market
6. Emerging Technologies and Future Trends 6.1 Biopolymers
6.2 Hybrid Chemical Formulas
6.3 Nanoplate Surfactants
6.4 Microbial EOR
6.5 The Outlook for Emerging Technologies
7. PEST Analysis of the Chemical EOR Market 2014-2024
8. Expert Opinion 8.1 Huntsman
8.1.1 Huntsman’s Role in the Chemical EOR Market
8.1.2 How Falling Oil Production is Driving the Chemical EOR Market
8.1.3 The Role of Different Chemical EOR Techniques
8.1.4 Can There Be a Greater Deployment of Large-Scale Chemical EOR Projects?
8.1.5 Is Cost an Important Consideration for Chemical EOR?
8.1.6 Growth in the Chemical EOR Market Going Forward
8.2 Kemira
8.2.1 Kemira’s Role within the Chemical EOR Market
8.2.2 What Trends are being Witnessed in the Chemical EOR Market?
8.2.3 Factors Affecting Chemical EOR Growth
8.2.4 Opportunities for Growth
8.3 Oil Chem Technologies
8.3.1 Oil Chem Technologies’ Role in the Chemical EOR Market
8.3.2 Defining the Physical Properties that Impact Chemical EOR
8.3.3 What are the Oil Recovery Rates and Costs for Chemical EOR?
8.3.4 What is Driving the Chemical EOR Market and Where are the Market Leaders?
8.3.5 Restraints on the Chemical EOR Market Do Persist
8.3.6 A Focus on the Chemical Submarkets
8.3.7 The Potential for Offshore Chemical EOR Growth
www.visiongain.com
Contents
8.4 Solvay
8.4.1 Solvay’s Involvement in the Chemical EOR Market
8.4.2 Major Global Trends for the Chemical EOR Market
8.4.3 How Long does a Chemical EOR Project Take?
8.4.4 Chemical EOR Characteristics and Applications
8.4.5 Future Opportunities for Chemical EOR
8.4.6 How is Chemical EOR Expected to Develop?
9. Major Companies in the Chemical EOR Market 2014-2024 9.1 Major Oil Companies in the Chemical EOR Market
9.1.1 CNPC
9.1.1.1 CNPC Analysis
9.1.1.2 CNPC Chemical EOR Projects
9.1.1.3 The Outlook for CNPC
9.1.2 Sinopec Corp (China Petroleum & Chemical Corporation)
9.1.2.1 Sinopec Analysis
9.1.2.2 Sinopec Chemical EOR Projects
9.1.2.3 The Outlook for Sinopec
9.1.3 CNRL
9.1.3.1 CNRL Analysis
9.1.3.2 CNRL Chemical EOR Projects
9.1.3.3 The Outlook for CNRL
9.1.4 Cenovus Energy Inc.
9.1.4.1 Cenovus Analysis
9.1.4.2 Cenovus Chemical EOR Projects
9.1.4.3 The Outlook for Cenovus
9.1.5 PDO
9.1.5.1 PDO Analysis
9.1.5.2 PDO Chemical EOR Projects
9.1.5.3 The Outlook for PDO
9.1.6 BlackPearl Resources Inc.
9.1.6.1 BlackPearl Resources Analysis
9.1.6.2 BlackPearl Resources Chemical EOR Projects
9.1.6.3 The Outlook for BlackPearl Resources
9.1.7 CNOOC Ltd.
9.1.7.1 CNOOC Analysis
www.visiongain.com
Contents
9.1.7.2 CNOOC Chemical EOR Projects
9.1.7.3 The Outlook for CNOOC
9.1.8 Chevron (PT Chevron Pacific Indonesia)
9.1.8.1 Chevron Analysis
9.1.8.2 Chevron Chemical EOR Projects
9.1.8.3 The Outlook for Chevron
9.1.9 Murphy Oil Corporation
9.1.9.1Murphy Oil Analysis
9.1.9.2 Murphy Oil Chemical EOR Projects
9.1.9.3 The Outlook for Murphy Oil
9.1.10 Rex Energy
9.1.10.1 Rex Energy Analysis
9.1.10.2 Rex Energy Chemical EOR Projects
9.1.10.3 The Outlook for Rex Energy
9.2 Chemical Companies – Providers and Developers
10. Conclusions & Recommendations 10.1 Chemical EOR Market Outlook
10.2 Key Findings in the Chemical EOR Market
10.3 Recommendations for the Chemical EOR Market
11. Glossary
Page 82
www.visiongain.com
Chemical Enhanced Oil Recovery (EOR) Market Forecast 2014-2024: Prospects for Top Companies in Polymers, Biopolymers, Surfactants, CDG, SP & ASP
spend of $22m. It is estimated that the incremental oil production could be between 5% and 15%. It
is also acknowledged that Harvest Energy are currently using a Chinese supplied nano-particle
technology as an alternative to polymer flooding, due to cost.
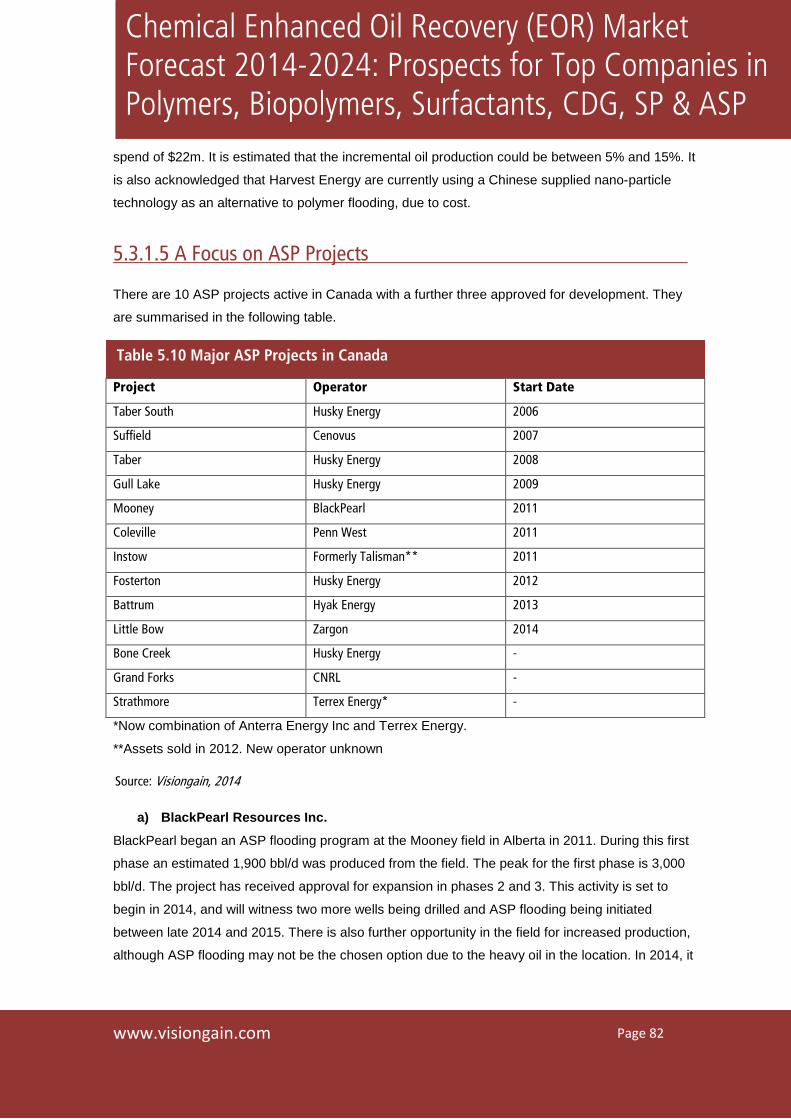
5.3.1.5 A Focus on ASP Projects
There are 10 ASP projects active in Canada with a further three approved for development. They
are summarised in the following table.
Project Operator Start Date
Taber South Husky Energy 2006
Suffield Cenovus 2007
Taber Husky Energy 2008
Gull Lake Husky Energy 2009
Mooney BlackPearl 2011
Coleville Penn West 2011
Instow Formerly Talisman** 2011
Fosterton Husky Energy 2012
Battrum Hyak Energy 2013
Little Bow Zargon 2014
Bone Creek Husky Energy -
Grand Forks CNRL -
Strathmore Terrex Energy* -
*Now combination of Anterra Energy Inc and Terrex Energy.
**Assets sold in 2012. New operator unknown
a) BlackPearl Resources Inc.
BlackPearl began an ASP flooding program at the Mooney field in Alberta in 2011. During this first
phase an estimated 1,900 bbl/d was produced from the field. The peak for the first phase is 3,000
bbl/d. The project has received approval for expansion in phases 2 and 3. This activity is set to
begin in 2014, and will witness two more wells being drilled and ASP flooding being initiated
between late 2014 and 2015. There is also further opportunity in the field for increased production,
although ASP flooding may not be the chosen option due to the heavy oil in the location. In 2014, it
Table 5.10 Major ASP Projects in Canada
Source: Visiongain, 2014
Page 95
www.visiongain.com
Chemical Enhanced Oil Recovery (EOR) Market Forecast 2014-2024: Prospects for Top Companies in Polymers, Biopolymers, Surfactants, CDG, SP & ASP
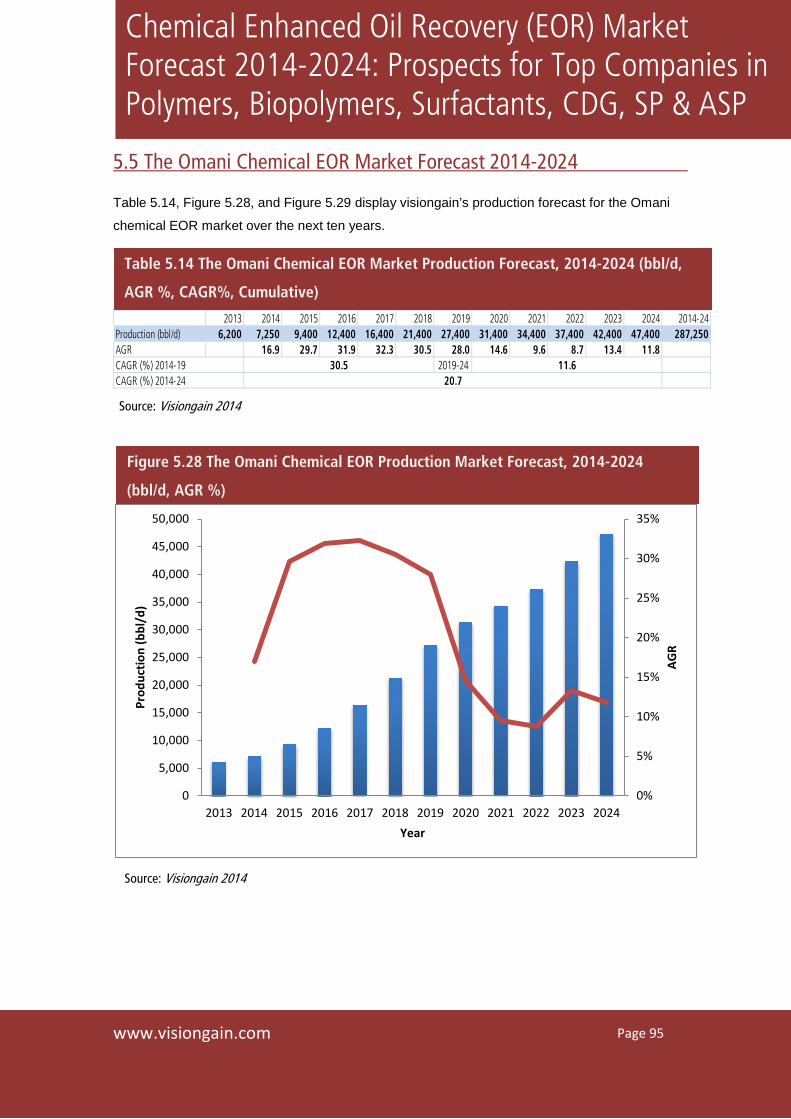
5.5 The Omani Chemical EOR Market Forecast 2014-2024
Table 5.14, Figure 5.28, and Figure 5.29 display visiongain’s production forecast for the Omani
chemical EOR market over the next ten years.
2013 2014 2015 2016 2017 2018 2019 2020 2021 2022 2023 2024 2014-24Production (bbl/d) 6,200 7,250 9,400 12,400 16,400 21,400 27,400 31,400 34,400 37,400 42,400 47,400 287,250AGR 16.9 29.7 31.9 32.3 30.5 28.0 14.6 9.6 8.7 13.4 11.8
2019-24CAGR (%) 2014-19 30.5 11.6CAGR (%) 2014-24 20.7
0%
5%
10%
15%
20%
25%
30%
35%
0
5,000
10,000
15,000
20,000
25,000
30,000
35,000
40,000
45,000
50,000
2013 2014 2015 2016 2017 2018 2019 2020 2021 2022 2023 2024
AGR
Prod
uctio
n (b
bl/d
)
Year
Table 5.14 The Omani Chemical EOR Market Production Forecast, 2014-2024 (bbl/d,
AGR %, CAGR%, Cumulative)
Source: Visiongain 2014
Figure 5.28 The Omani Chemical EOR Production Market Forecast, 2014-2024
(bbl/d, AGR %)
Source: Visiongain 2014
Page 187
www.visiongain.com
Chemical Enhanced Oil Recovery (EOR) Market Forecast 2014-2024: Prospects for Top Companies in Polymers, Biopolymers, Surfactants, CDG, SP & ASP
8. Expert Opinion
8.1 Huntsman
Huntsman is a global manufacturer and marketer of differentiated chemicals. The company is split
into five business units, one of which is Performance Products. Within Performance Products is the
Energy Global Strategic Business unit. As a surfactant manufacturer, the majority of surfactant
production facilities are centred in Europe, although there is also a facility in Australia and the US,
with Huntsman offering both off-the-shelf products as well as custom made solutions for ASP and
SP flooding and surfactants for use with gas injection schemes. Visiongain spoke to Guy
Biesmans, Senior Marketing Manager for Global Alternative Energy Solutions, in May 2014.
Visiongain would like to thank Mr. Biesmans for his contribution to the report.
8.1.1 Huntsman’s Role in the Chemical EOR Market
Visiongain: Can you tell me about Huntsman and your role within the chemical EOR market?
Guy Biesmans: Huntsman is a chemical manufacturer and is divided into five different divisions.
One of those divisions is called Huntsman Performance Products, and that is where the activities
for Enhanced Oil Recovery (EOR) are based. Huntsman Performance Products, again, operates
with six global strategic business units (SBU), and one of those business units (BU) is called
Energy.
I am globally responsible within the Energy SBU for a segment that we call Alternative Energy
Solutions. Alternative Energy Solutions incorporates different markets and chemical EOR is one of
them, but the segment also includes alternative energy such as solar energy, wind energy, and
energy storage.
8.1.2 How Falling Oil Production is Driving the Chemical EOR Market
Visiongain: From a wider perspective, what would you say are the main factors driving the
chemical EOR market?
Guy Biesmans: The main drivers are the need for continued oil production from existing
reservoirs, and the fact that the easy oil is depleted. We are now seeing a global decline in
production and therefore there is a need to look at new methods and technologies to increase oil
production. Although conventional secondary recoveries are well established, you still only have an
Page 220
www.visiongain.com
Chemical Enhanced Oil Recovery (EOR) Market Forecast 2014-2024: Prospects for Top Companies in Polymers, Biopolymers, Surfactants, CDG, SP & ASP
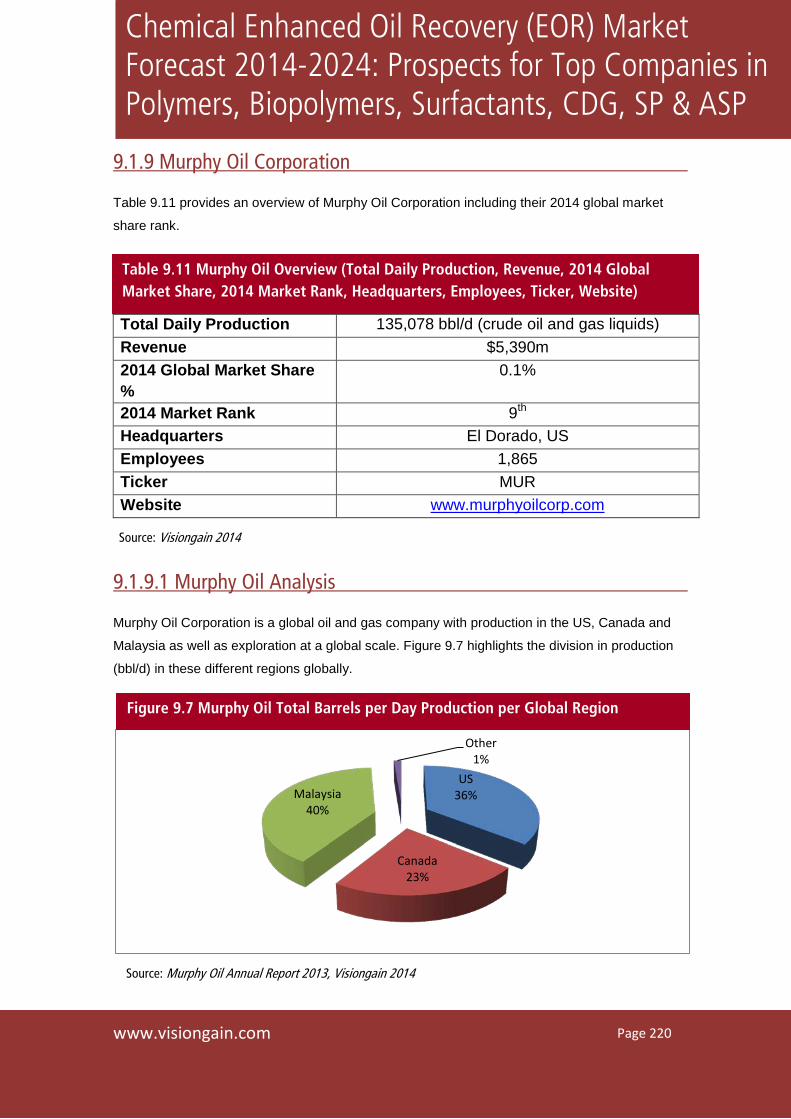
9.1.9 Murphy Oil Corporation
Table 9.11 provides an overview of Murphy Oil Corporation including their 2014 global market
share rank.
Total Daily Production 135,078 bbl/d (crude oil and gas liquids) Revenue $5,390m 2014 Global Market Share %
0.1%
2014 Market Rank 9th Headquarters El Dorado, US Employees 1,865 Ticker MUR Website www.murphyoilcorp.com
9.1.9.1 Murphy Oil Analysis
Murphy Oil Corporation is a global oil and gas company with production in the US, Canada and
Malaysia as well as exploration at a global scale. Figure 9.7 highlights the division in production
(bbl/d) in these different regions globally.
US 36%
Canada 23%
Malaysia 40%
Other 1%
Table 9.11 Murphy Oil Overview (Total Daily Production, Revenue, 2014 Global Market Share, 2014 Market Rank, Headquarters, Employees, Ticker, Website)
Source: Visiongain 2014
Figure 9.7 Murphy Oil Total Barrels per Day Production per Global Region
Source: Murphy Oil Annual Report 2013, Visiongain 2014


![EOR - Enhanced Oil Recovery 01[1]](https://img.pdfslide.us/doc/110x75/577d2f9e1a28ab4e1eb22aa6/eor-enhanced-oil-recovery-011.jpg)