Embed Size (px)
Citation preview
Collaborative Action on Climate Risk
Supply Chain Report 2013–14
Report written forCDP by:
[email protected]+44 (0) 20 7970 5660www.cdp.net
2
CDP Supply Chain Member Companies
Corporate MembersAbbott LaboratoriesAccentureAcer Inc.Amdocs Ltd.AT&T Inc.Autodesk Inc.Banco Bradesco S/ABraskem S/ABristol-Myers SquibbBritish American TobaccoBritish Sky BroadcastingBT GroupCisco Systems, Inc.Colgate Palmolive CompanyCSX CorporationDiageo Plc.Domtar Corporation Eaton CorporationEletropaulo Metropolitana Eletricidade de São Paulo S/AElopakEndesaEni SpAFiatFord Motor CompanyGas Natural SDG S.A.
General Motors CompanyGroupe SteriaHess CorporationIMIImperial Tobacco GroupJaguar Land Rover LtdJohnson & JohnsonJohnson ControlsJT International SAKAO CorporationKPMG UKMarfrig AlimentosMetLife, Inc.National GridNestléNokia Solutions and NetworksRexamRoyal PhilipsS.C. Johnson & Son, Inc.SABMillerStarwood Hotels & Resorts Worldwide, IncSwisscomTaisei Corporation
{UnileverVodafone Group
Lead MembersBank of America
{Dell Inc.FIBRIA Celulose S/AGoldman Sachs Group Inc.Juniper Networks
{L’OréalMicrosoft CorporationPepsiCo
{Pfizer Inc.PricewaterhouseCoopers LLPSuzano Pulp and Paper S.A.The Coca-Cola CompanyValeWalmart
{ Founding CDP supply chain water members
Contents
3 Executive Summary
5 The Accenture Perspective
6 About the CDP’s Supply Chain report
8 Introduction
14 Rethinking Supply Chain Resilience
21 CDP Action Exchange
27 The Need for a Wider View of Supply Chain Sustainability
29 The Importance of Engaging in the Policy Process
30 Conclusion
31 Supplier Climate Performance Leadership Index
3
Executive Summary
But regulatory uncertainty is making companies cautious about investing in emissions reductions and supply chain sustainability. Seven of the ten sectors report investment falling from 2012 or 2011 levels, or from both. They are also increasingly focusing on investments with shorter payback periods, which tend to deliver only incremental benefits.
And while the leadership of the 64 member companies continues to improve, they are leaving their suppliers behind. For example, 34% of members have set both absolute and intensity-based emissions reductions targets, up from 33% in 2012. For suppliers, the figure is 7%, up from 5% in 2012.
Suppliers realized savings of US$11.5 billion from emissions reduction investments this year, down from US$13.7 billion in 2012.
Against this worrying backdrop, this year’s report drills down into the CDP supply chain data to examine how companies should best prioritize their investments and work with their supply chains to reduce climate risks and seize the opportunities presented.
Companies must assess the scope of the climate challenge Fundamentally, companies need to place climate change and sustainability at the heart of their strategy. Indeed,
some leading companies are beginning to reposition themselves in this way. Meanwhile, substantial emissions reductions and monetary savings are to be found in existing supply chains.
Analysis based on CDP’s supply chain program data has, for the first time, identified where emissions are generated within supply chains, and which sections of those supply chains are most likely to provide a return on investments in terms of reducing emissions and generating monetary savings.
Companies must complement such top-down analysis with a bottom-up assessment of the emissions throughout the lifecycle of key products and services.
Once those risks are identified, their management is crucial. 78% of supply chain program participants that identify regulatory, physical and other classes of climate risk and report a risk management approach integrate the issue into their company-wide, multi-disciplinary risk management processes. Worryingly, 38% of suppliers reported no documented processes for assessing and managing climate-related risks.
Collaboration along the supply chain is crucial Collaboration is at the very heart of supply chain sustainability – and it yields results. In 2013, suppliers reported 427 member-prompted organizational-level emissions reductions initiatives, leading to the reduction of the equivalent of 2.3 million metric tonnes of carbon dioxide (CO2e). However, there is enormous scope for more collaboration: program participants identified 2,186 customer-supplier collaborative opportunities that have not yet been implemented.
Collaboration can work. Those companies that engage with two or more suppliers, consumers or other partners are more than twice as likely to see a financial return from their emissions reductions investments, and almost twice as likely to reduce emissions than those who don’t engage with their value chain.
This year’s sixth annual CDP supply chain information request generated its largest response yet: with 2,868 companies, supplying 64 supply chain program member companies, disclosing their carbon emissions and approach to climate risk management. They provided a wealth of data on how suppliers and their customers are collaborating to drive down carbon emissions, mitigating water risk, seizing opportunities, and building revenue and brand along the way.
Suppliers report that both climate risk and opportunity are at high levels: 72% identify a current or future risk related to climate change; 56% of companies identifying climate change related opportunities say that consumers are becoming more receptive to low-carbon products and services.
Suppliers realized savings of US$11.5 billion from emissions reduction investments this year, down from US$13.7 billion in 2012
4
To encourage closer collaboration between members and suppliers, CDP has launched its Action Exchange initiative. Six supply chain member companies will work with suppliers, academic researchers and leading service providers to identify – and hopefully implement – the most attractive emissions reductions opportunities.
Staff, suppliers and customers must be more effectively motivatedCompanies also need to ensure they have the internal capacity to identify climate change risks and opportunities, and they need to better motivate their employees to deliver on their objectives.
They need to get governance right, by integrating climate change into business strategy. They need to engage employees, invest in employee engagement and incentive programs. They need to support suppliers to help address the growing gap between member company and supplier emissions reduction performance. And they need to communicate progress: communication is correlated with performance.
Companies must take a wider view of supply chain sustainability Carbon and climate risks are linked to other sustainability issues, such as water and resource scarcity. Companies can use these as levers to bear down on carbon emissions.
Investing in resource efficiency: nearly half (302) of the 676 climate change mitigation projects reported in 2013 are in renewable energy, providing climate and energy security benefits. Companies should look to reduce commodity inputs across the board to deliver carbon and cost reduction.
The water-energy-carbon nexus: CDP extended its water program to supply chain participants, revealing high levels of awareness of water risks, but also lagging preparedness. Leading companies are beginning to recognize that the true value of water resides in business continuity, license to operate and brand value.
And engage in the policy process Given the lack of regulatory progress, companies should consider engaging more with policymakers and those that do deliver better emissions reduction performance and potentially higher financial returns from emissions reductions efforts. Those companies that engage are almost three times more likely to report monetary savings from their reduction projects than those that do not.
5
The Accenture Perspective
Take scope 3 emissions. Measurements and reporting here is often a leading indicator of supply chain action. But of the 2,868 companies responding to the supplier information request in 2013, only 36% report scope 3 emissions and, more worryingly, only about 11% set either absolute or intensity scope 3 targets. More broadly, we’ve seen investment in emissions reductions level off, in the face of regulatory uncertainty and tough economic conditions.
But the dynamics within supply chains are changing rapidly. New technologies, pressure on resources and new operational models promise to help transform supply chain sustainability.
Next-generation digital technologies, for example, can be applied to help deliver emissions reductions across extended supply chains. Sensors and mobile devices can help revolutionize the flow of information within companies and throughout supply chains, possibly leading to efficiencies and energy, cost and carbon reductions. For example, Accenture’s joint research in 2009 with Vodafone identified 13 specific opportunities supported by mobile services that, by 2020, could save 2.4% of expected EU emissions – or 113 million tonnes of CO2e.
Meanwhile, pressure on resources will accelerate progress towards the adoption of circular economy principles. As energy becomes more expensive, and other natural resources scarcer, companies may increasingly embrace principles of reuse, recycle, remanufacture, refurbish and repair. Adoption of circular economy principles could potentially create over US$2 trillion of value in material savings and save millions of tonnes of CO2 emissions in the process.
The circular economy depends upon collaboration with suppliers and customers – and will see the extension into sustainability of the ‘shared services’ approach, that has already been adopted in other aspects of supply chain operations. Sharing talent and infrastructure has been shown to help drive cost efficiency; it will be employed to drive resource efficiency and emissions reductions.
In essence, Accenture envisions a ‘Control Tower’ approach to supply chain sustainability, combining three key capabilities: Visibility, Analytics and Execution. Enhanced visibility will be enabled by the digital technology revolution. Analytical advances will turn this flood of supply chain data into information, to help prioritize emissions reductions activities, identify performance gaps and drive targeted actions. Finally, execution will be facilitated by collaboration, involving more corporate functions as well as engaging suppliers and customers.
Over the last three years, CDP and Accenture have worked closely together to analyze the emissions performance of thousands of companies who participate in CDP’s supply chain program. Over that time, we’ve seen enormous progress, and groundbreaking initiatives and collaborations emerge. But, as this year’s report shows, much more needs to be done.
Without doubt, the challenges in driving supply chain sustainability are undiminished – if anything, they are proving more intractable than ever. But the tools and thinking are emerging to help drive transformational outcomes in terms of reducing environmental impacts, and creating sustainable business value.
6
About CDP’s Supply Chain Report
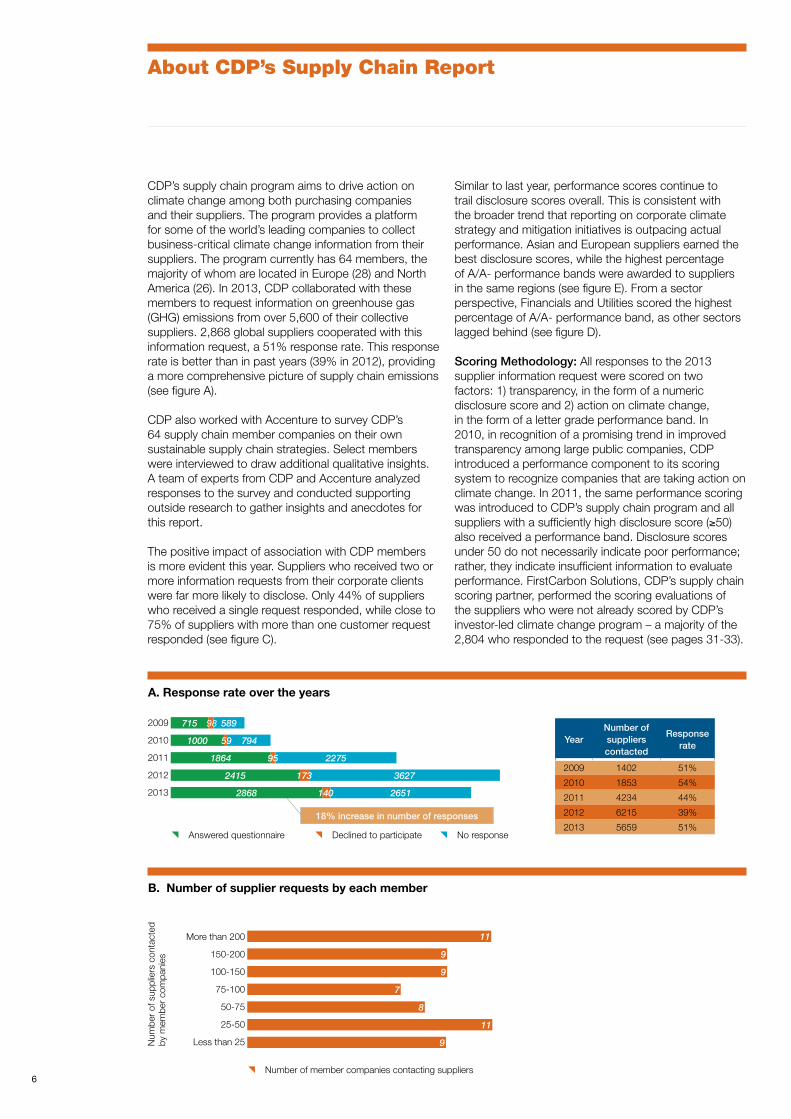
CDP’s supply chain program aims to drive action on climate change among both purchasing companies and their suppliers. The program provides a platform for some of the world’s leading companies to collect business-critical climate change information from their suppliers. The program currently has 64 members, the majority of whom are located in Europe (28) and North America (26). In 2013, CDP collaborated with these members to request information on greenhouse gas (GHG) emissions from over 5,600 of their collective suppliers. 2,868 global suppliers cooperated with this information request, a 51% response rate. This response rate is better than in past years (39% in 2012), providing a more comprehensive picture of supply chain emissions (see figure A).
CDP also worked with Accenture to survey CDP’s 64 supply chain member companies on their own sustainable supply chain strategies. Select members were interviewed to draw additional qualitative insights. A team of experts from CDP and Accenture analyzed responses to the survey and conducted supporting outside research to gather insights and anecdotes for this report.
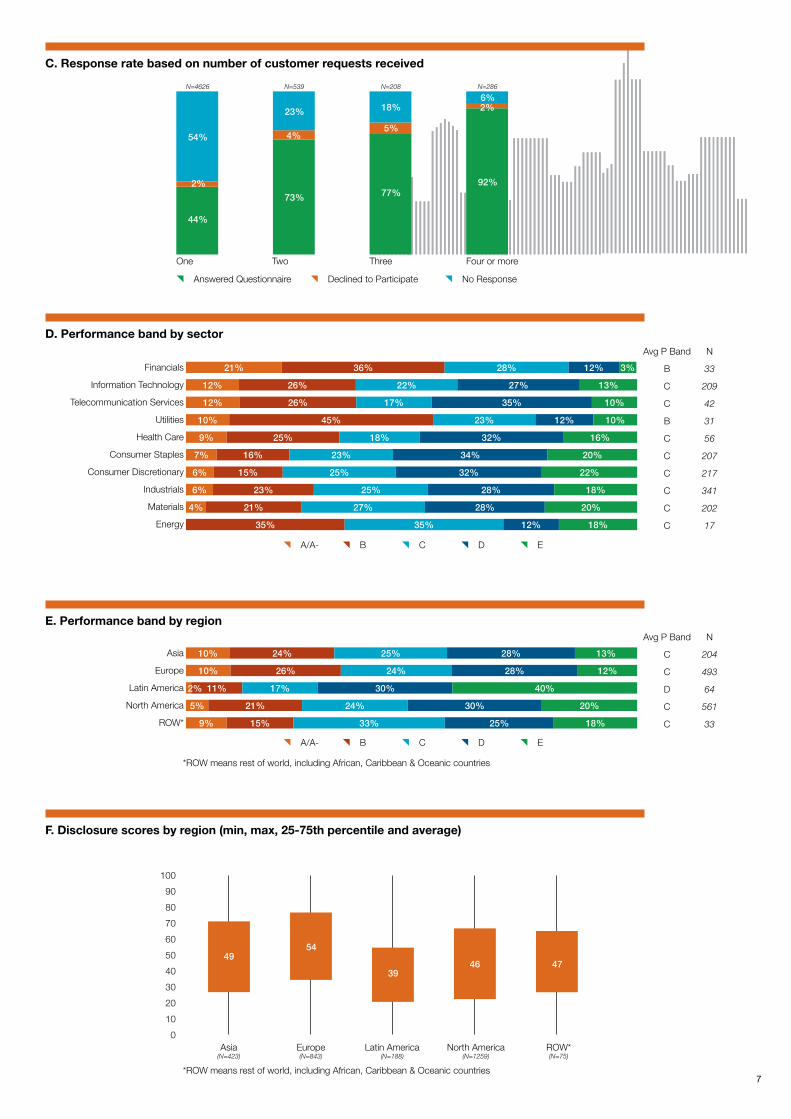
The positive impact of association with CDP members is more evident this year. Suppliers who received two or more information requests from their corporate clients were far more likely to disclose. Only 44% of suppliers who received a single request responded, while close to 75% of suppliers with more than one customer request responded (see figure C).
Similar to last year, performance scores continue to trail disclosure scores overall. This is consistent with the broader trend that reporting on corporate climate strategy and mitigation initiatives is outpacing actual performance. Asian and European suppliers earned the best disclosure scores, while the highest percentage of A/A- performance bands were awarded to suppliers in the same regions (see figure E). From a sector perspective, Financials and Utilities scored the highest percentage of A/A- performance band, as other sectors lagged behind (see figure D).
Scoring Methodology: All responses to the 2013 supplier information request were scored on two factors: 1) transparency, in the form of a numeric disclosure score and 2) action on climate change, in the form of a letter grade performance band. In 2010, in recognition of a promising trend in improved transparency among large public companies, CDP introduced a performance component to its scoring system to recognize companies that are taking action on climate change. In 2011, the same performance scoring was introduced to CDP’s supply chain program and all suppliers with a sufficiently high disclosure score (≥50) also received a performance band. Disclosure scores under 50 do not necessarily indicate poor performance; rather, they indicate insufficient information to evaluate performance. FirstCarbon Solutions, CDP’s supply chain scoring partner, performed the scoring evaluations of the suppliers who were not already scored by CDP’s investor-led climate change program – a majority of the 2,804 who responded to the request (see pages 31-33).
A. Response rate over the years
B. Number of supplier requests by each member
18% increase in number of responses
715 58998
1000 79459
2868 2651140
2415 3627173
1864 227595
2009
2010
2011
2012
2013
More than 200
150-200
100-150
75-100
50-75
25-50
Less than 25
YearNumber of suppliers contacted
Response rate
2009 1402 51%
2010 1853 54%
2011 4234 44%
2012 6215 39%
2013 5659 51%
{Number of member companies contacting suppliers
{Answered questionnaire {Declined to participate {No response
11
7
9
8
9
11
9Num
ber
of s
uppl
iers
con
tact
ed
by m
embe
r co
mpa
nies
7
D. Performance band by sector
E. Performance band by region
F. Disclosure scores by region (min, max, 25-75th percentile and average)
C. Response rate based on number of customer requests received
One Two Three Four or more
2%
44%
54%
N=4626
4%
73%
23%
N=539
5%
77%
18%
N=208
2%
92%
6%N=286
100
90
80
70
60
50
40
30
20
10
0
{Answered Questionnaire {Declined to Participate {No Response
21% 36% 28% 12% 3%
10% 24% 25% 28% 13%
7% 16% 23% 34% 20%
12% 26% 22% 27% 13%
10% 26% 24% 28% 12%
6% 15% 25% 32% 22%
12% 26% 17% 35% 10%
11% 17% 30% 40%
6% 23% 25% 28% 18%
10% 45% 23% 12% 10%
5% 21% 24% 30% 20%
4% 21% 27% 28% 20%
9% 25% 18% 32% 16%
9% 15% 33% 25% 18%
35% 35% 12% 18%
Financials
Information Technology
Telecommunication Services
Utilities
Health Care
Consumer Staples
Consumer Discretionary
Industrials
Materials
Energy
Asia
Europe
Latin America
North America
ROW*
Avg P Band
B
C
C
B
C
C
C
C
C
C
Avg P Band
C
C
D
C
C
N
33
209
42
31
56
207
217
341
202
17
N
204
493
64
561
33
{A/A- {B {C {D {E
{A/A- {B {C {D {E
2%
Asia (N=423)
Europe (N=843)
Latin America (N=188)
North America (N=1259)
ROW*(N=75)
*ROW means rest of world, including African, Caribbean & Oceanic countries
*ROW means rest of world, including African, Caribbean & Oceanic countries
4954
3946 47
8
Introduction
The disconnect could not be more striking; as officials from around the world were arriving in Warsaw in November 2013 for the latest round of UN climate talks, the most powerful typhoon ever to make landfall smashed into the Philippines. Yet even as the country struggled to cope with the death and devastation wrought by Typhoon Haiyan, the climate change negotiations remained mired in deadlock and backsliding.
No one weather event can be directly blamed on climate change. But the science is clear - extreme weather events, exacerbated by rising sea levels, will become more destructive as the world warms. The latest report from the Intergovernmental Panel on Climate Change (IPCC) says it is now 95% certain that emissions are heating up the atmosphere and the oceans, and warns of the need for “substantial and sustained reductions of greenhouse gas emissions”.1
However, while the science seems clear, our politics is not. Governments around the world are – by and large – failing to put in place all of the policies needed to help slow and possibly reverse rising carbon emissions. And, in some parts of the world at least, the policy signals are pointing in precisely the wrong direction. This is despite clear calls from CEOs for public policy to be aligned with sustainability goals, as depicted by the UN Global Compact-Accenture CEO Study on Sustainability 2013, the largest survey to date of CEO attitudes about sustainability.2
The corporate world is in a bind. Company executives understand the issues rather than the science. They are already seeing the effects of climate change on their operations and on their supply chains. They are seeing consumer preferences begin to change. They anticipate regulatory action to cut emissions.
And, crucially, they recognize that opportunities exist to leverage their supply chain to reduce emissions and climate risk, and drive business value. CDP supply chain member companies represent US$1.15 trillion of purchasing power. The Scope 1 emissions captured by the program account for 14 percent of 2013’s global industrial emissions.3 If member companies can help drive better emissions performance within their tier 1 suppliers, they can make a material impact on climate change mitigation.
But, at present, the highly uncertain policy environment in which they operate is holding them back.
Companies see increasing regulatory uncertainty on climate changeThese challenges are reflected in the participation in the CDP’s supply chain program. In 2013, a record number of companies were involved: 2,868 companies, supplying 64 supply chain program member companies (listed on page 2) disclosed information about their emissions and approaches to identifying and managing climate change issues. Of these, fully 72% identify a
current or future risk related to climate change that has the potential to significantly affect its business or revenues.
Of those who identify climate change related risks, 90% cite regulatory risk. This is a clear indication of the current uncertain direction of regulatory travel. Certainly, the regulatory environment is tightening in some parts of the world. In the US, for example, the Environmental Protection Agency is working on emissions controls for coal-fired power plants. In China, pilot carbon emission trading schemes will dovetail with a range of regulations designed to improve energy efficiency and reduce pollution. But in September, a new government won elections in Australia promising to scrap carbon pricing legislation. In November, Japan reversed its pledge to cut emissions. And in Europe, leadership on climate policy seems to be losing out to concerns over competitiveness.
Regulatory uncertainty is affecting investments by companies. E.I. du Pont de Nemours and Company says that “as it makes long term capital and R&D investment decisions, the uncertainty surrounding new regulations adds complexity to those business decisions”.4
There are two conclusions that can be drawn from this policy slowdown. One is that governments are unlikely to put pressure on companies in the short term to reduce emissions. The other, much more credible conclusion is that a gulf is growing between the increasingly urgent calls from climate science and the regulatory response. And, ultimately, bridging that gulf is likely to require more rapid, more stringent, and therefore more costly policy measures than would otherwise be the case.
1. http://www.ipcc.ch/news_and_events/docs/ar5/press_release_ar5_wgi_en.pdf
2. UN Global Compact-Accenture, “The UN Global Compact-Accenture CEO Study on Sustainability2013”, available at http://www.unglobal-compact.org/resources/451
3. Climate Analysis Indicators Tool (CAIT 2.0) of World Resources Insti-tute - http://cait2.wri.org/wri
4. Complete response available in their public response at www.cdp.net
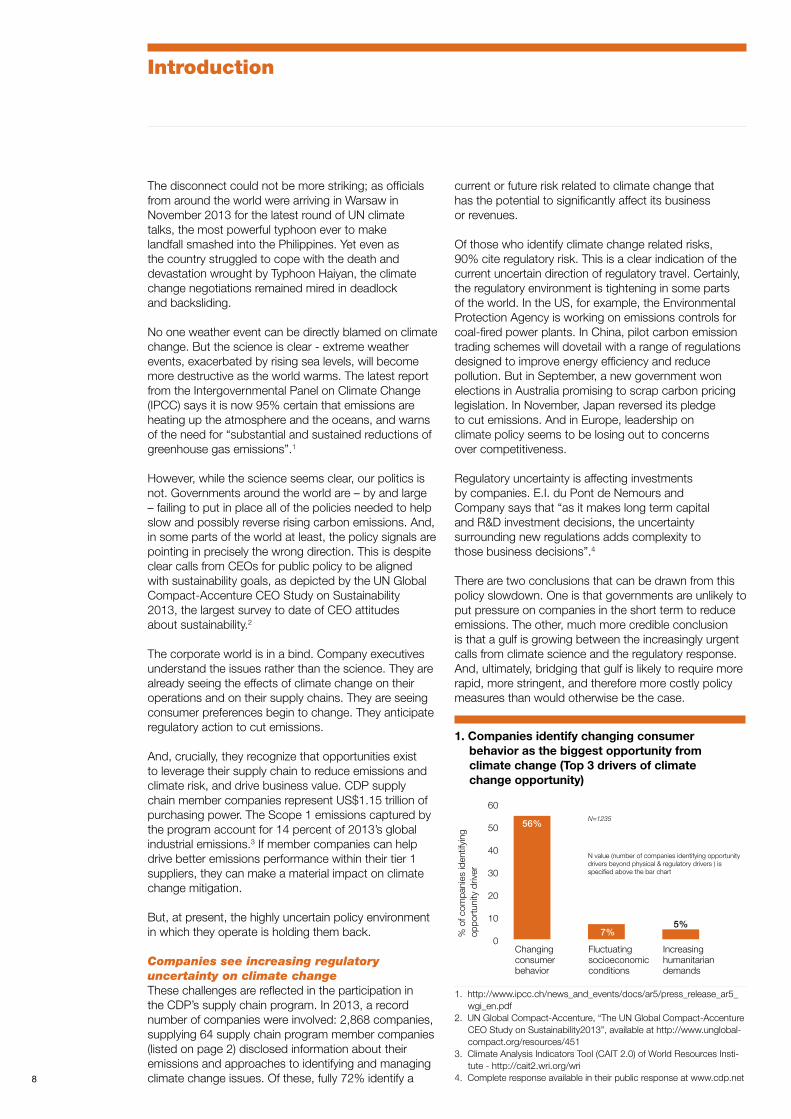
1. Companies identify changing consumer behavior as the biggest opportunity from climate change (Top 3 drivers of climate change opportunity)
Changing consumer behavior
Fluctuating socioeconomic conditions
Increasing humanitarian demands
60
50
40
30
20
10
0
% o
f com
pani
es id
entif
ying
op
port
unity
driv
er
56%
7%5%
N=1235
N value (number of companies identifying opportunity drivers beyond physical & regulatory drivers ) is specified above the bar chart
9
Despite the regulatory headwinds, those companies that do embrace the low-carbon agenda could be pushing at an open door, in terms of the receptiveness of their existing and potential customers. Participants were asked to report which other opportunities – aside from those presented by regulation or physical climate changes – they expect climate change to present, and over what time period they are likely to materialize. More than half (56%) identified changing consumer behavior (see figure 1).
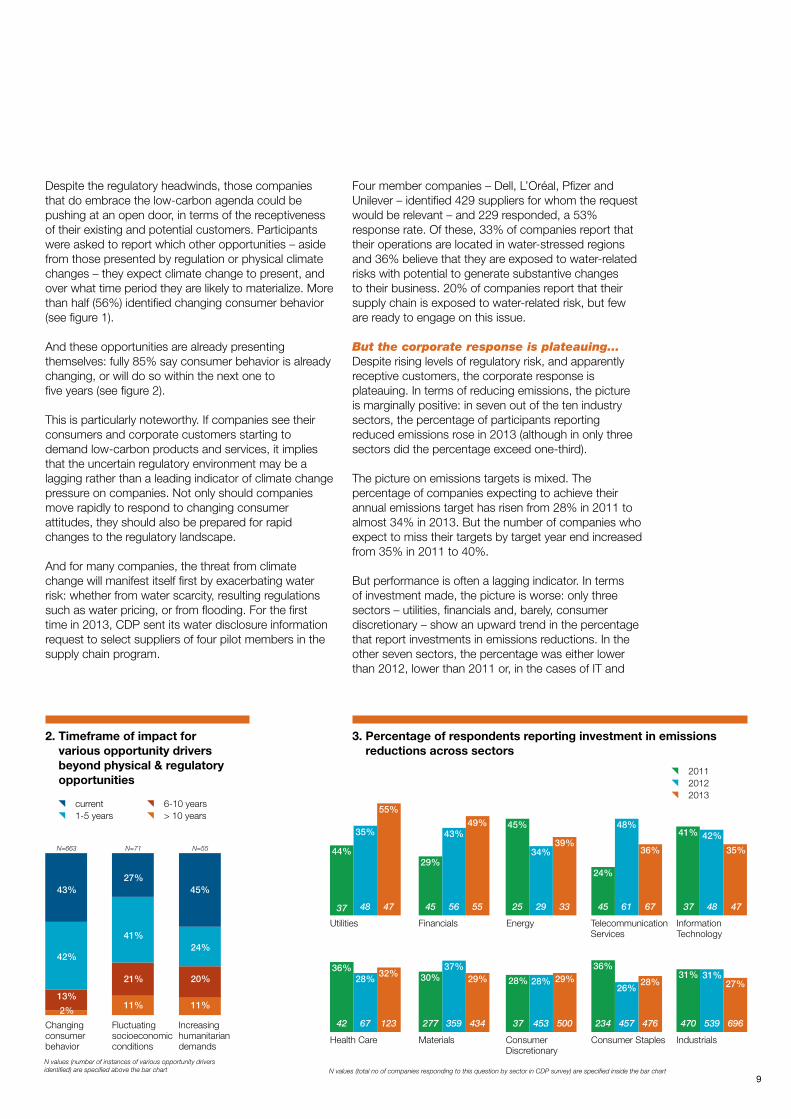
And these opportunities are already presenting themselves: fully 85% say consumer behavior is already changing, or will do so within the next one to five years (see figure 2).
This is particularly noteworthy. If companies see their consumers and corporate customers starting to demand low-carbon products and services, it implies that the uncertain regulatory environment may be a lagging rather than a leading indicator of climate change pressure on companies. Not only should companies move rapidly to respond to changing consumer attitudes, they should also be prepared for rapid changes to the regulatory landscape.
And for many companies, the threat from climate change will manifest itself first by exacerbating water risk: whether from water scarcity, resulting regulations such as water pricing, or from flooding. For the first time in 2013, CDP sent its water disclosure information request to select suppliers of four pilot members in the supply chain program.
Four member companies – Dell, L’Oréal, Pfizer and Unilever – identified 429 suppliers for whom the request would be relevant – and 229 responded, a 53% response rate. Of these, 33% of companies report that their operations are located in water-stressed regions and 36% believe that they are exposed to water-related risks with potential to generate substantive changes to their business. 20% of companies report that their supply chain is exposed to water-related risk, but few are ready to engage on this issue.
But the corporate response is plateauing… Despite rising levels of regulatory risk, and apparently receptive customers, the corporate response is plateauing. In terms of reducing emissions, the picture is marginally positive: in seven out of the ten industry sectors, the percentage of participants reporting reduced emissions rose in 2013 (although in only three sectors did the percentage exceed one-third).
The picture on emissions targets is mixed. The percentage of companies expecting to achieve their annual emissions target has risen from 28% in 2011 to almost 34% in 2013. But the number of companies who expect to miss their targets by target year end increased from 35% in 2011 to 40%.
But performance is often a lagging indicator. In terms of investment made, the picture is worse: only three sectors – utilities, financials and, barely, consumer discretionary – show an upward trend in the percentage that report investments in emissions reductions. In the other seven sectors, the percentage was either lower than 2012, lower than 2011 or, in the cases of IT and
2. Timeframe of impact for various opportunity drivers beyond physical & regulatory opportunities
3. Percentage of respondents reporting investment in emissions reductions across sectors
Changing consumer behavior
Fluctuating socioeconomic conditions
Increasing humanitarian demands
13%
2%
42%
43%
20%
11%
24%
45%
{current{1-5 years
{6-10 years{> 10 years
11%
41%
27%
21%
N=663 N=71 N=55
27%
696
28%
476
29%
500
29%
434
32%
123
35%
47
24%
45
39%
33
29%
45
55%
47
Utilities
35%
44%
4837
28%36%
6742
49%43%
5556
37%30%
359277
34%
45%
2925
28%28%
45337
36%
48%
6761
26%
36%
457234
42%41%
4837
31%31%
539470
Health Care
Financials
Materials
Energy
Consumer Discretionary
Telecommunication Services
Consumer Staples
Information Technology
Industrials
{2011{2012{2013
N values (number of instances of various opportunity drivers identified) are specified above the bar chart N values (total no of companies responding to this question by sector in CDP survey) are specified inside the bar chart
10
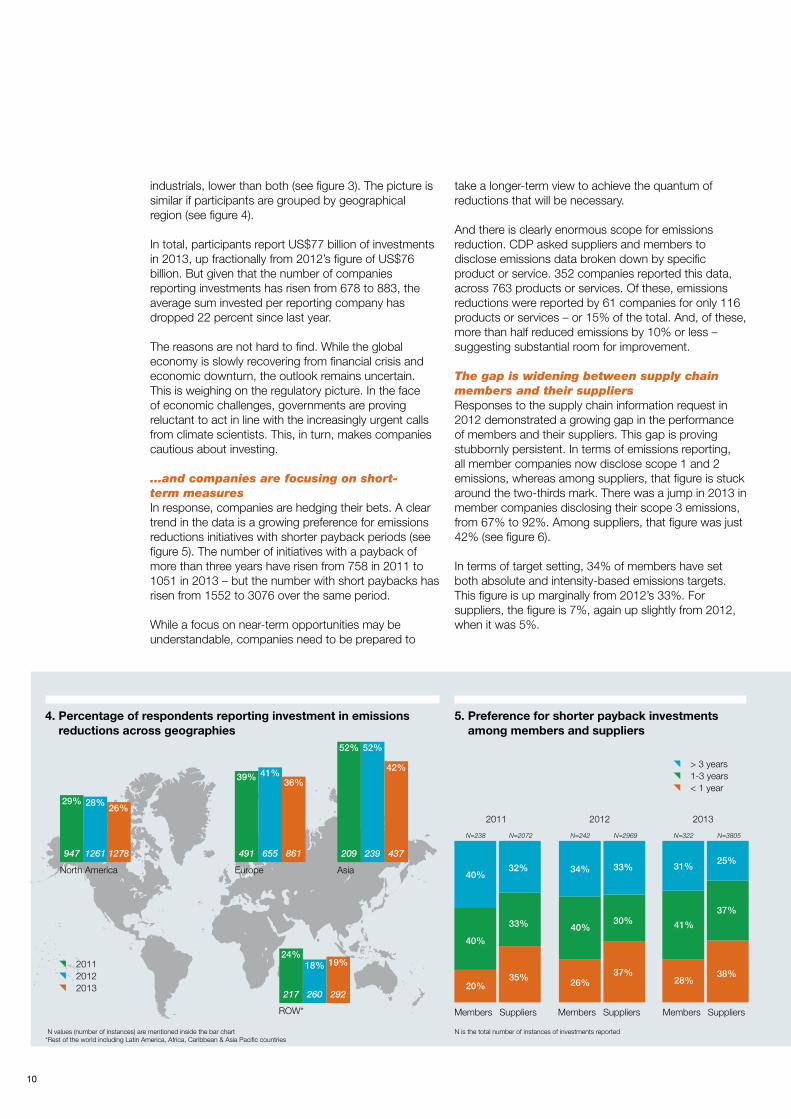
industrials, lower than both (see figure 3). The picture is similar if participants are grouped by geographical region (see figure 4).
In total, participants report US$77 billion of investments in 2013, up fractionally from 2012’s figure of US$76 billion. But given that the number of companies reporting investments has risen from 678 to 883, the average sum invested per reporting company has dropped 22 percent since last year.
The reasons are not hard to find. While the global economy is slowly recovering from financial crisis and economic downturn, the outlook remains uncertain. This is weighing on the regulatory picture. In the face of economic challenges, governments are proving reluctant to act in line with the increasingly urgent calls from climate scientists. This, in turn, makes companies cautious about investing.
…and companies are focusing on short- term measures In response, companies are hedging their bets. A clear trend in the data is a growing preference for emissions reductions initiatives with shorter payback periods (see figure 5). The number of initiatives with a payback of more than three years have risen from 758 in 2011 to 1051 in 2013 – but the number with short paybacks has risen from 1552 to 3076 over the same period.
While a focus on near-term opportunities may be understandable, companies need to be prepared to
take a longer-term view to achieve the quantum of reductions that will be necessary.
And there is clearly enormous scope for emissions reduction. CDP asked suppliers and members to disclose emissions data broken down by specific product or service. 352 companies reported this data, across 763 products or services. Of these, emissions reductions were reported by 61 companies for only 116 products or services – or 15% of the total. And, of these, more than half reduced emissions by 10% or less – suggesting substantial room for improvement.
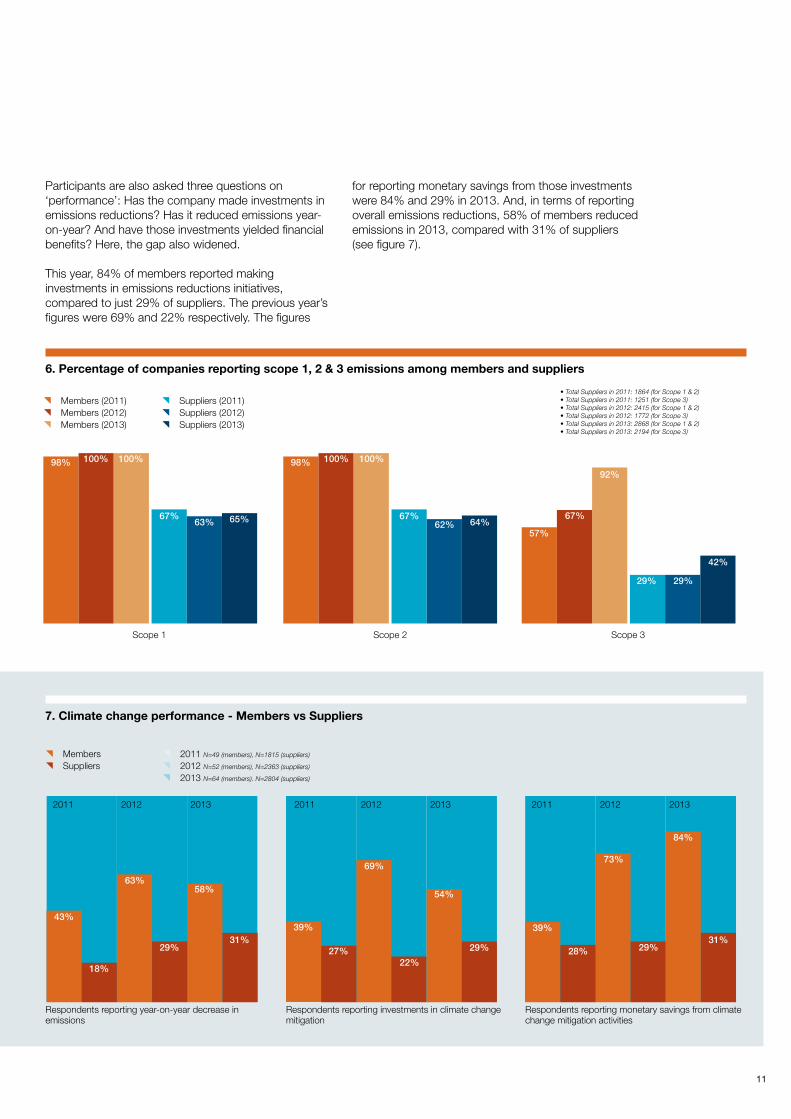
The gap is widening between supply chain members and their suppliersResponses to the supply chain information request in 2012 demonstrated a growing gap in the performance of members and their suppliers. This gap is proving stubbornly persistent. In terms of emissions reporting, all member companies now disclose scope 1 and 2 emissions, whereas among suppliers, that figure is stuck around the two-thirds mark. There was a jump in 2013 in member companies disclosing their scope 3 emissions, from 67% to 92%. Among suppliers, that figure was just 42% (see figure 6).
In terms of target setting, 34% of members have set both absolute and intensity-based emissions targets. This figure is up marginally from 2012’s 33%. For suppliers, the figure is 7%, again up slightly from 2012, when it was 5%.
42%
437
Asia
52%52%
239209
36%
861
41%39%
655491
Europe
26%
1278
28%29%
1261947
North America
19%
292
18%24%
260217
ROW* Members Members Members Suppliers Suppliers Suppliers
40%
20%
40%
{> 3 years{1-3 years{< 1 year
N=238
40%
26%
34%
N=242
41%
28%
31%
N=322
33%
35%
32%
N=2072
30%
37%
33%
N=2969
37%
38%
25%
N=3805
2011 2012 2013
4. Percentage of respondents reporting investment in emissions reductions across geographies
5. Preference for shorter payback investments among members and suppliers
{2011{2012{2013
N is the total number of instances of investments reportedN values (number of instances) are mentioned inside the bar chart*Rest of the world including Latin America, Africa, Caribbean & Asia Pacific countries
11
Participants are also asked three questions on ‘performance’: Has the company made investments in emissions reductions? Has it reduced emissions year-on-year? And have those investments yielded financial benefits? Here, the gap also widened.
This year, 84% of members reported making investments in emissions reductions initiatives, compared to just 29% of suppliers. The previous year’s figures were 69% and 22% respectively. The figures
for reporting monetary savings from those investments were 84% and 29% in 2013. And, in terms of reporting overall emissions reductions, 58% of members reduced emissions in 2013, compared with 31% of suppliers (see figure 7).
6. Percentage of companies reporting scope 1, 2 & 3 emissions among members and suppliers
7. Climate change performance - Members vs Suppliers
98% 98%
57%
67% 67%
29%
100% 100%
67%63% 62%
29%
100% 100%
92%
65% 64%
42%
Scope 1 Scope 2 Scope 3
{Members (2011){Members (2012){Members (2013)
{Suppliers (2011){Suppliers (2012){Suppliers (2013)
• Total Suppliers in 2011: 1864 (for Scope 1 & 2)• Total Suppliers in 2011: 1251 (for Scope 3)• Total Suppliers in 2012: 2415 (for Scope 1 & 2)• Total Suppliers in 2012: 1772 (for Scope 3)• Total Suppliers in 2013: 2868 (for Scope 1 & 2)• Total Suppliers in 2013: 2194 (for Scope 3)
69%
43%
63%
73%
29%
22%
29%
58% 54%
84%
31%29%
31%39% 39%
18%
27% 28%
Respondents reporting year-on-year decrease in emissions
Respondents reporting investments in climate change mitigation
Respondents reporting monetary savings from climate change mitigation activities
{Members{Suppliers
{2011 N=49 (members), N=1815 (suppliers)
{2012 N=52 (members), N=2363 (suppliers)
{2013 N=64 (members). N=2804 (suppliers)
2011 2011 20112012 2012 20122013 2013 2013
12
On the positive side, the number of projects reported by companies has grown dramatically: Suppliers reported 3,805 initiatives in 2013, compared with 2,072 in 2011. Among supply chain members, the figure has risen to 322 from 236. This suggests that opportunities abound, and program participants are beginning to grasp them.
Companies are leaving value on the table… One of the key messages from 2012’s analysis is that, in addition to the environmental benefits of reducing emissions, there is significant value to companies in reducing their emissions, and those of their supply chain. These can deliver benefits in terms of increased revenues, improved brand, lower costs, and reduced risks:
{Italian automotive company Pirelli reports that 45% of its €6.3 billion revenue in 2012 came from its ‘green performance’ products, up from 36% in 2010.
{Japanese electronics firm Ricoh’s commitment to environmental management was recognized with the highest environmental rating from the Development Bank of Japan (DBJ) – which provided not only a boost to its brand, but also enabled it to refinance a Y30 billion loan from DBJ at a lower rate.
{In the 2012 financial year, FedEx Corporation’s sustainability initiatives helped the logistics giant realize more than 1 million metric tonnes of avoided greenhouse gas emissions and more than US$320 million in estimated fuel and energy cost savings and materials recycling revenues.
{Spanish infrastructure firm Ferrovial believes that failure to meet its carbon reduction targets risks a loss of business to the tune of €755 million, or 10% of its turnover, mainly in its low-carbon infrastructure business line. Inevitably, lower investment leads to poorer performance. In 2012, participants reported monetary savings from emissions reductions investments of US$13.7 billion. For 2013, the figure has fallen to US$11.5 billion. Although the number of companies reporting savings has increased from 698 to 929, average monetary savings has fallen 44% in the past 12 months. There is substantial value to be had by improving supply chain sustainability and, in many companies, this value is going unclaimed.
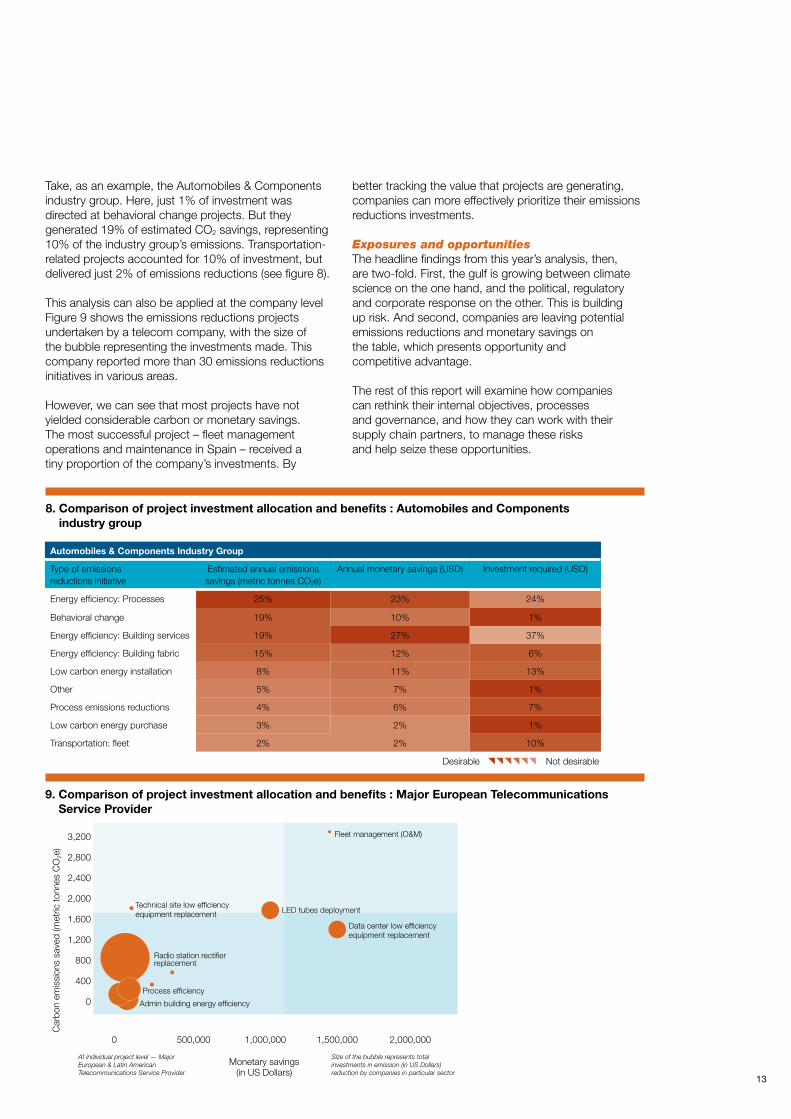
…and are misdirecting investments Of even more concern is that companies may be misdirecting the investments that they are making. Our analysis found that investment spend is not necessarily correlated with carbon emissions reductions, nor monetary savings from emissions reductions.
13
Take, as an example, the Automobiles & Components industry group. Here, just 1% of investment was directed at behavioral change projects. But they generated 19% of estimated CO2 savings, representing 10% of the industry group’s emissions. Transportation-related projects accounted for 10% of investment, but delivered just 2% of emissions reductions (see figure 8).
This analysis can also be applied at the company level Figure 9 shows the emissions reductions projects undertaken by a telecom company, with the size of the bubble representing the investments made. This company reported more than 30 emissions reductions initiatives in various areas.
However, we can see that most projects have not yielded considerable carbon or monetary savings. The most successful project – fleet management operations and maintenance in Spain – received a tiny proportion of the company’s investments. By
better tracking the value that projects are generating, companies can more effectively prioritize their emissions reductions investments.
Exposures and opportunities The headline findings from this year’s analysis, then, are two-fold. First, the gulf is growing between climate science on the one hand, and the political, regulatory and corporate response on the other. This is building up risk. And second, companies are leaving potential emissions reductions and monetary savings on the table, which presents opportunity and competitive advantage.
The rest of this report will examine how companies can rethink their internal objectives, processes and governance, and how they can work with their supply chain partners, to manage these risks and help seize these opportunities.
Automobiles & Components Industry Group
Type of emissions reductions initiative
Estimated annual emissions savings (metric tonnes CO2e)
Annual monetary savings (USD) Investment required (USD)
Energy efficiency: Processes 25% 23% 24%
Behavioral change 19% 10% 1%
Energy efficiency: Building services 19% 27% 37%
Energy efficiency: Building fabric 15% 12% 6%
Low carbon energy installation 8% 11% 13%
Other 5% 7% 1%
Process emissions reductions 4% 6% 7%
Low carbon energy purchase 3% 2% 1%
Transportation: fleet 2% 2% 10%
8. Comparison of project investment allocation and benefits : Automobiles and Components industry group
9. Comparison of project investment allocation and benefits : Major European Telecommunications Service Provider
3,200
2,800
2,400
2,000
1,600
1,200
800
400
0
0 500,000 1,000,000 1,500,000 2,000,000
Technical site low efficiencyequipment replacement
Process efficiency
Admin building energy efficiency
LED tubes deployment
Fleet management (O&M)
Data center low efficiencyequipment replacement
Radio station rectifier replacement
Car
bon
emis
sion
s sa
ved
(met
ric to
nnes
CO
2e)
Monetary savings(in US Dollars)
At individual project level — Major European & Latin American Telecommunications Service Provider
Size of the bubble represents total investments in emission (in US Dollars) reduction by companies in particular sector
Desirable {{{{{{Not desirable
14
Rethinking Supply Chain Resilience
This year, the report considers how companies and their suppliers can seize these opportunities – what practical steps they can take to manage climate and other sustainability risks, while at the same time adding financial value. This work is all the more pressing, given the slowdown seen in action and investment.
Whether companies are starting out on the journey, or have taken their first steps towards addressing supply chain sustainability, a three-stage process should be followed. Companies should consider the following:
{Assess the scope of their climate and sustainability exposures, and the opportunity set they present;
{Collaborate with their supply chain partners to help reduce risk and exploit opportunities; and
{Motivate their own staff, and their suppliers, to ensure sustainability objectives are prioritized.
Assessing the scope of the climate challenge Before any organization can decide what path to take, it has to know where it needs to get. The first step for an organization that is serious about embedding sustainability is to assess the big picture – and position climate change firmly within its strategic vision. The data CDP’s supply chain program has collected can also help companies understand where they are now, and help them identify points in their supply chains where scarce resources can best be deployed to improve sustainability performance.
Placing sustainability within the strategic vision Corporate efforts to reduce emissions have, to date, largely been focused on process efficiencies and incremental improvements. But, ultimately, global emissions will need to fall substantially if we are to prevent dangerous climate change. The Intergovernmental Panel on Climate Change has called for industrialized countries to reduce emissions to 25-40% below 1990 levels by 2040. Longer term, these cuts must be much deeper. The EU, for example, has a target to reduce emissions to 20% of 1990 levels by the middle of this century – meaning that much economic activity will need to be entirely decarbonized.
A handful of leading companies have begun to reposition themselves strategically in anticipation of this fundamental transition to a low-carbon world. For example:
{ABB’s Growth Strategy 2011-2015 identifies mitigation of climate change, renewable energy and energy efficiency as key drivers and growth opportunities for its business. About 55 percent of the Swiss engineering corporation’s revenues are already related to products and services in its energy efficiency portfolio that help customers save energy and reduce greenhouse gas emissions.
{In fiscal 2012, revenue from Siemens AG’s continuing operations from its Environmental Portfolio amounted to €33.2 billion, accounting for 43 percent of the German engineering giant’s total sales.
Without doubt, such fundamental repositionings take time. They are an investment in the future. But, for almost every company, there are also substantial emissions reductions and monetary savings to be made in existing supply chains.
Allocating emissions across supply chains In the context of limited resources available for emissions reductions, management needs to understand where its investments are likely to generate the best returns. To help with this process, the performance of supply chains is measured in terms of their propensity to act to reduce emissions, and the degree to which they have realized benefits when they have acted see the methodology - on next page. This information will allow managers to target their efforts and investments on those parts of their supply chain most likely to deliver emissions reductions and financial benefits.
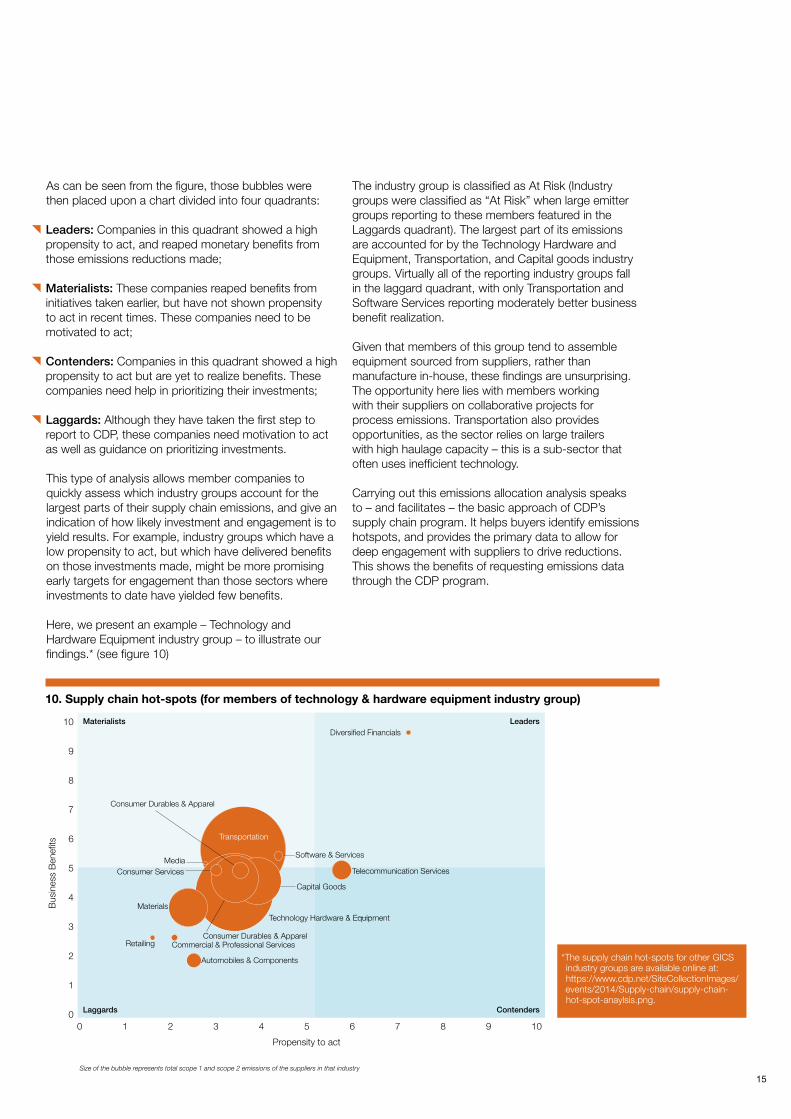
We carried out this emissions allocation analysis across the 19 industry groups represented by the 64 members of CDP’s supply chain program. Figure 10 (page 15) – showing the Technology and Hardware Equipment industry group – provides an illustrative example. The X axis shows propensity to act; the Y axis business benefits; while the magnitude of the bubble (the Z axis) is the total supplier scope 1 and 2 emissions for the goods and services supplied to that sector.
Previous editions of CDP’s supply chain report have examined the sustainability challenges posed by today’s globalized supply chains. CDP set out the business case for addressing these challenges, explaining the opportunities they present for revenue growth, cost savings and reduced risk.
15
As can be seen from the figure, those bubbles were then placed upon a chart divided into four quadrants:
{Leaders: Companies in this quadrant showed a high propensity to act, and reaped monetary benefits from those emissions reductions made;
{Materialists: These companies reaped benefits from initiatives taken earlier, but have not shown propensity to act in recent times. These companies need to be motivated to act;
{Contenders: Companies in this quadrant showed a high propensity to act but are yet to realize benefits. These companies need help in prioritizing their investments;
{Laggards: Although they have taken the first step to report to CDP, these companies need motivation to act as well as guidance on prioritizing investments.
This type of analysis allows member companies to quickly assess which industry groups account for the largest parts of their supply chain emissions, and give an indication of how likely investment and engagement is to yield results. For example, industry groups which have a low propensity to act, but which have delivered benefits on those investments made, might be more promising early targets for engagement than those sectors where investments to date have yielded few benefits.
Here, we present an example – Technology and Hardware Equipment industry group – to illustrate our findings.* (see figure 10)
Materialists Leaders
Laggards Contenders
10. Supply chain hot-spots (for members of technology & hardware equipment industry group)
The industry group is classified as At Risk (Industry groups were classified as “At Risk” when large emitter groups reporting to these members featured in the Laggards quadrant). The largest part of its emissions are accounted for by the Technology Hardware and Equipment, Transportation, and Capital goods industry groups. Virtually all of the reporting industry groups fall in the laggard quadrant, with only Transportation and Software Services reporting moderately better business benefit realization.
Given that members of this group tend to assemble equipment sourced from suppliers, rather than manufacture in-house, these findings are unsurprising. The opportunity here lies with members working with their suppliers on collaborative projects for process emissions. Transportation also provides opportunities, as the sector relies on large trailers with high haulage capacity – this is a sub-sector that often uses inefficient technology.
Carrying out this emissions allocation analysis speaks to – and facilitates – the basic approach of CDP’s supply chain program. It helps buyers identify emissions hotspots, and provides the primary data to allow for deep engagement with suppliers to drive reductions. This shows the benefits of requesting emissions data through the CDP program.
Size of the bubble represents total scope 1 and scope 2 emissions of the suppliers in that industry
*The supply chain hot-spots for other GICS industry groups are available online at: https://www.cdp.net/SiteCollectionImages/events/2014/Supply-chain/supply-chain-hot-spot-anaylsis.png.
10
9
8
7
6
5
4
3
2
1
00 1 2 3 4 5 6 7 8 9 10
Bus
ines
s B
enef
its
Consumer Durables & Apparel
Consumer Durables & Apparel
Technology Hardware & Equipment
Capital Goods
Software & Services
Telecommunication Services
Transportation
Consumer ServicesMedia
Materials
Retailing Commercial & Professional Services
Automobiles & Components
Diversified Financials
Propensity to act
16
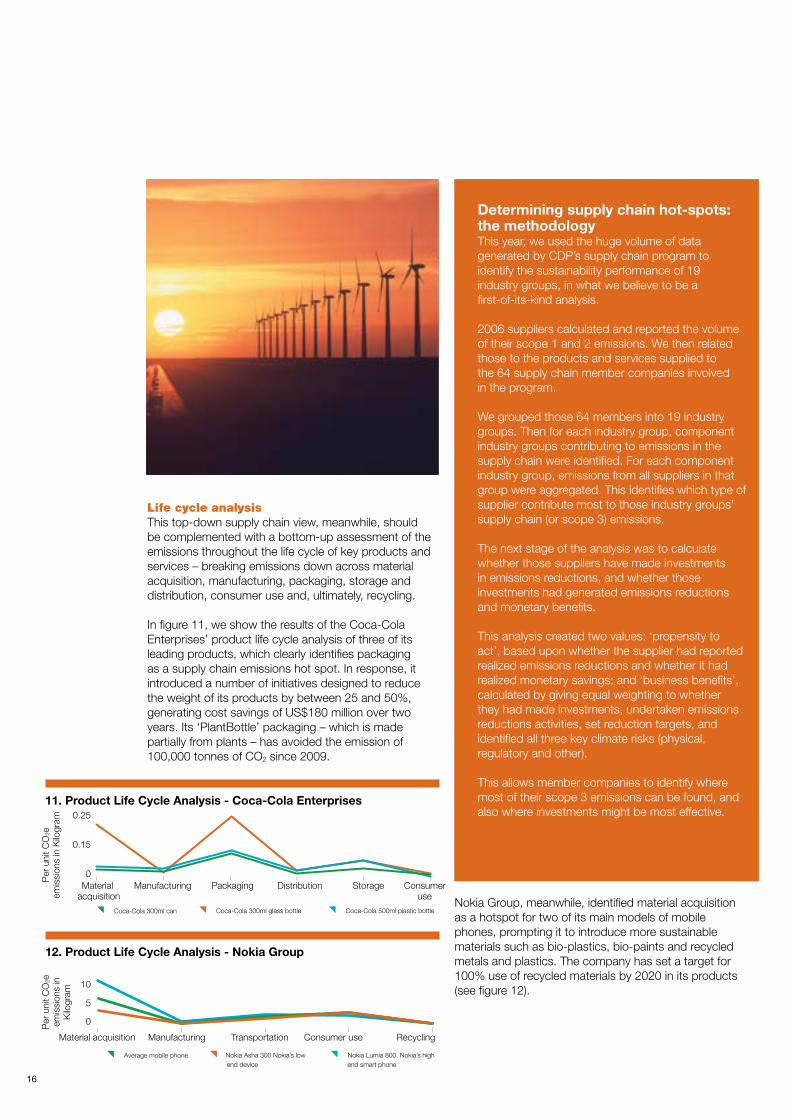
Life cycle analysis This top-down supply chain view, meanwhile, should be complemented with a bottom-up assessment of the emissions throughout the life cycle of key products and services – breaking emissions down across material acquisition, manufacturing, packaging, storage and distribution, consumer use and, ultimately, recycling.
In figure 11, we show the results of the Coca-Cola Enterprises’ product life cycle analysis of three of its leading products, which clearly identifies packaging as a supply chain emissions hot spot. In response, it introduced a number of initiatives designed to reduce the weight of its products by between 25 and 50%, generating cost savings of US$180 million over two years. Its ‘PlantBottle’ packaging – which is made partially from plants – has avoided the emission of 100,000 tonnes of CO2 since 2009.
Determining supply chain hot-spots: the methodology This year, we used the huge volume of data generated by CDP’s supply chain program to identify the sustainability performance of 19 industry groups, in what we believe to be a first-of-its-kind analysis.
2006 suppliers calculated and reported the volume of their scope 1 and 2 emissions. We then related those to the products and services supplied to the 64 supply chain member companies involved in the program.
We grouped those 64 members into 19 industry groups. Then for each industry group, component industry groups contributing to emissions in the supply chain were identified. For each component industry group, emissions from all suppliers in that group were aggregated. This identifies which type of supplier contribute most to those industry groups’ supply chain (or scope 3) emissions.
The next stage of the analysis was to calculate whether those suppliers have made investments in emissions reductions, and whether those investments had generated emissions reductions and monetary benefits.
This analysis created two values: ‘propensity to act’, based upon whether the supplier had reported realized emissions reductions and whether it had realized monetary savings; and ‘business benefits’, calculated by giving equal weighting to whether they had made investments, undertaken emissions reductions activities, set reduction targets, and identified all three key climate risks (physical, regulatory and other).
This allows member companies to identify where most of their scope 3 emissions can be found, and also where investments might be most effective.
Nokia Group, meanwhile, identified material acquisition as a hotspot for two of its main models of mobile phones, prompting it to introduce more sustainable materials such as bio-plastics, bio-paints and recycled metals and plastics. The company has set a target for 100% use of recycled materials by 2020 in its products (see figure 12).
11. Product Life Cycle Analysis - Coca-Cola Enterprises
12. Product Life Cycle Analysis - Nokia Group
Per
uni
t CO
2e
emis
sion
s in
Kilo
gram
Per
uni
t CO
2e
emis
sion
s in
K
ilogr
am
{Coca-Cola 300ml can {Coca-Cola 300ml glass bottle {Coca-Cola 500ml plastic bottle
{Average mobile phone {Nokia Asha 300 Nokia’s low end device
{Nokia Lumia 800. Nokia’s high end smart phone
0.25
0.15
0
10
5
0
Material acquisition
Manufacturing Packaging Distribution Storage Consumer use
Material acquisition Manufacturing Transportation Consumer use Recycling
17
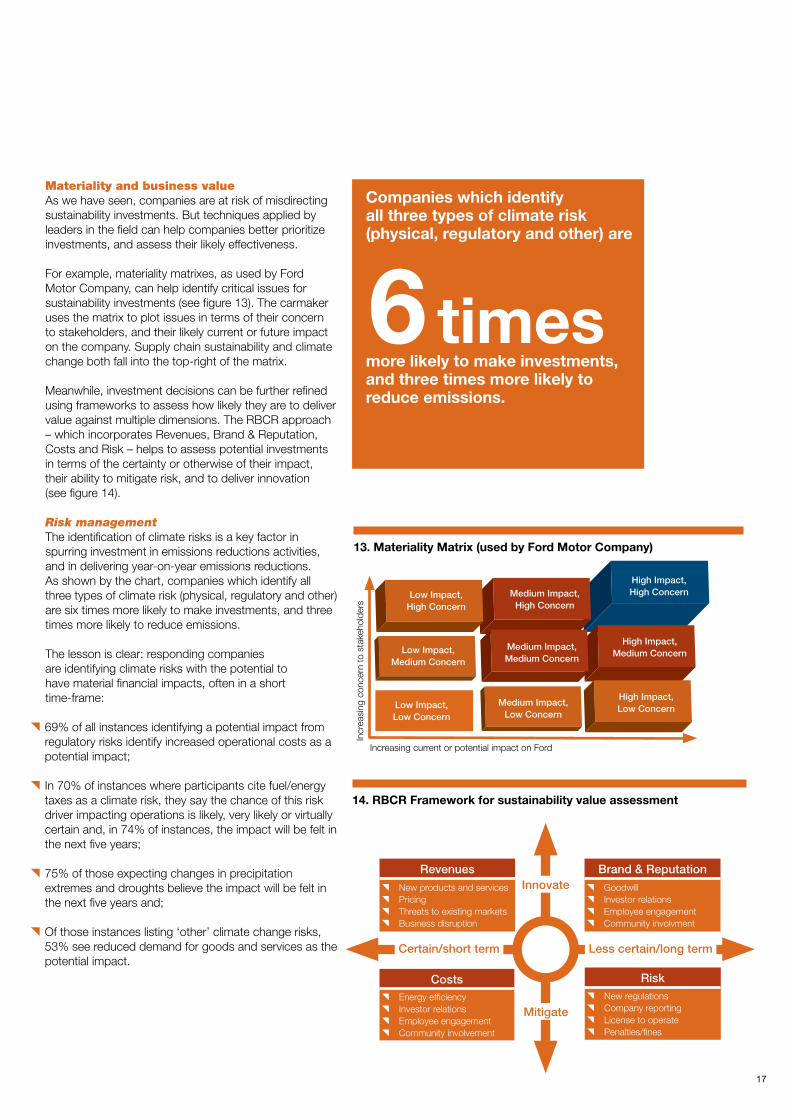
Materiality and business value As we have seen, companies are at risk of misdirecting sustainability investments. But techniques applied by leaders in the field can help companies better prioritize investments, and assess their likely effectiveness.
For example, materiality matrixes, as used by Ford Motor Company, can help identify critical issues for sustainability investments (see figure 13). The carmaker uses the matrix to plot issues in terms of their concern to stakeholders, and their likely current or future impact on the company. Supply chain sustainability and climate change both fall into the top-right of the matrix.
Meanwhile, investment decisions can be further refined using frameworks to assess how likely they are to deliver value against multiple dimensions. The RBCR approach – which incorporates Revenues, Brand & Reputation, Costs and Risk – helps to assess potential investments in terms of the certainty or otherwise of their impact, their ability to mitigate risk, and to deliver innovation (see figure 14).
Risk management The identification of climate risks is a key factor in spurring investment in emissions reductions activities, and in delivering year-on-year emissions reductions. As shown by the chart, companies which identify all three types of climate risk (physical, regulatory and other) are six times more likely to make investments, and three times more likely to reduce emissions.
The lesson is clear: responding companies are identifying climate risks with the potential to have material financial impacts, often in a short time-frame:
{ 69% of all instances identifying a potential impact from regulatory risks identify increased operational costs as a potential impact;
{ In 70% of instances where participants cite fuel/energy taxes as a climate risk, they say the chance of this risk driver impacting operations is likely, very likely or virtually certain and, in 74% of instances, the impact will be felt in the next five years;
{ 75% of those expecting changes in precipitation extremes and droughts believe the impact will be felt in the next five years and;
{ Of those instances listing ‘other’ climate change risks, 53% see reduced demand for goods and services as the potential impact.
Companies which identify all three types of climate risk (physical, regulatory and other) are
more likely to make investments, and three times more likely to reduce emissions.
6 times
14. RBCR Framework for sustainability value assessment
Risk{New regulations{Company reporting{License to operate{Penalties/fines
Brand & Reputation{Goodwill{Investor relations{Employee engagement{Community involvment
Costs{Energy efficiency{Investor relations{Employee engagement{Community involvement
Revenues{New products and services{Pricing{Threats to existing markets{Business disruption
Innovate
Mitigate
Certain/short term Less certain/long term
13. Materiality Matrix (used by Ford Motor Company)
Low Impact, High Concern
Low Impact,Medium Concern
Low Impact,Low Concern
Medium Impact,Low Concern
Medium Impact,Medium Concern
Medium Impact,High Concern
High Impact,High Concern
High Impact,Medium Concern
High Impact,Low Concern
Increasing current or potential impact on Ford
Incr
easi
ng c
once
rn to
sta
keho
lder
s
18
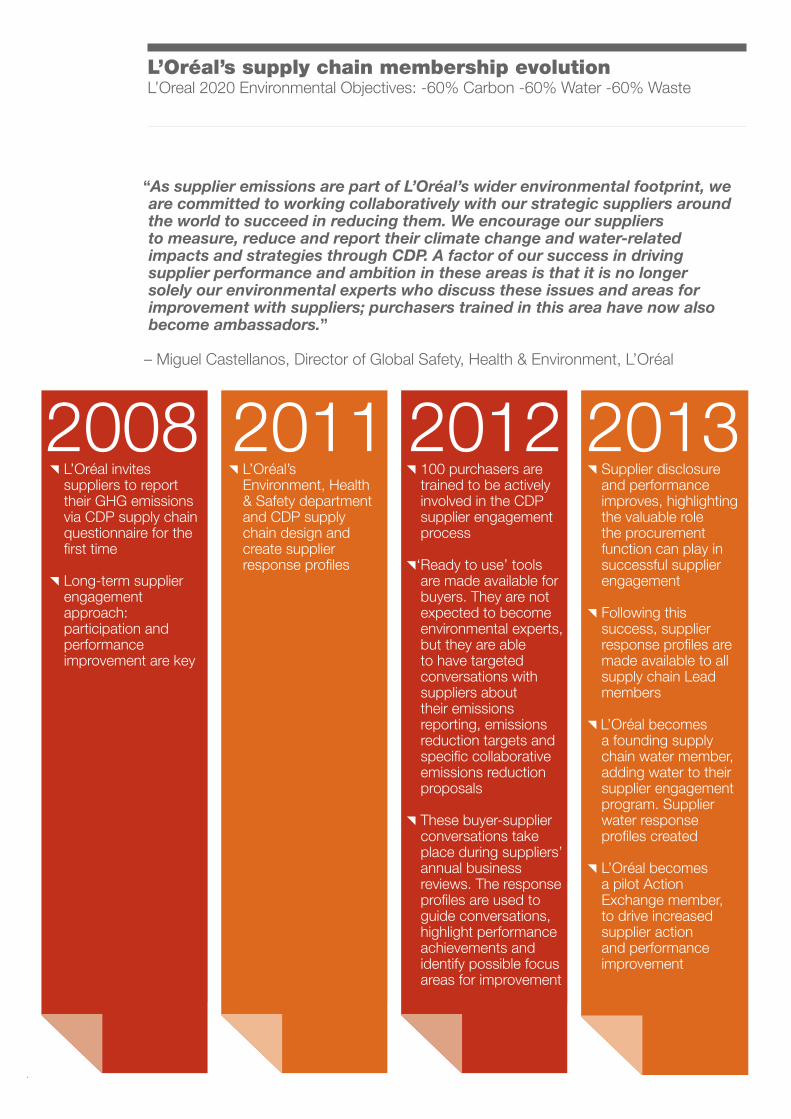
2008 2011 2012 2013{ Supplier disclosure
and performance improves, highlighting the valuable role the procurement function can play in successful supplier engagement
{ Following this success, supplier response profiles are made available to all supply chain Lead members
{ L’Oréal becomes a founding supply chain water member, adding water to their supplier engagement program. Supplier water response profiles created
{ L’Oréal becomes a pilot Action Exchange member, to drive increased supplier action and performance improvement
{ 100 purchasers are trained to be actively involved in the CDP supplier engagement process
{‘Ready to use’ tools are made available for buyers. They are not expected to become environmental experts, but they are able to have targeted conversations with suppliers about their emissions reporting, emissions reduction targets and specific collaborative emissions reduction proposals
{ These buyer-supplier conversations take place during suppliers’ annual business reviews. The response profiles are used to guide conversations, highlight performance achievements and identify possible focus areas for improvement
{ L’Oréal’s Environment, Health & Safety department and CDP supply chain design and create supplier response profiles
{ L’Oréal invites suppliers to report their GHG emissions via CDP supply chain questionnaire for the first time
{ Long-term supplier engagement approach: participation and performance improvement are key
L’Oréal’s supply chain membership evolutionL’Oreal 2020 Environmental Objectives: -60% Carbon -60% Water -60% Waste
“As supplier emissions are part of L’Oréal’s wider environmental footprint, we are committed to working collaboratively with our strategic suppliers around the world to succeed in reducing them. We encourage our suppliers to measure, reduce and report their climate change and water-related impacts and strategies through CDP. A factor of our success in driving supplier performance and ambition in these areas is that it is no longer solely our environmental experts who discuss these issues and areas for improvement with suppliers; purchasers trained in this area have now also become ambassadors.”
– Miguel Castellanos, Director of Global Safety, Health & Environment, L’Oréal
19
reductions they generated. Over 400 initiatives were reported, leading to 2.3 million metric tonnes of CO2e reductions.
CDP’s work has generated plenty of supply chain success stories:
{ The Coca-Cola Company works with its bottlers to identify financially beneficial emissions reduction initiatives. From 2004 to 2011, Coca-Cola achieved close to USUS$900 million in savings, predominantly from energy efficiency investments.5
{ Nike Inc.’s Manufacturing Energy & Carbon Program achieved a 6% absolute reduction in CO2e by contract footwear manufacturers from 2008 to 2011, against a 20% increase in production.6
{ PepsiCo’s Tropicana brand worked with farmers to develop carbon-neutral fertilizers using orange rinds that are byproduct of orange juice processing.7
{ Walmart asked MeadWestvaco Corp. (MWV) to develop a more environmentally efficient package for its retail pharmaceutical adherence business. MWV designed a new paperboard-based packaging system (ShellPak® Renew) to replace a larger, heavier plastic-based packaging system. The new package is about 70% to 80% more greenhouse gas efficient to produce and will also reduce transportation costs and emissions. MWV’s key retail customers will realize greenhouse gas emission savings from this change in packaging of more than 12,000 metric tonnes annually.
As one of Walmart’s suppliers, plant supplier Olson’s Greenhouse, puts it: “Walmart has driven our efforts to become sustainable and has made us aware of many areas where we can make a difference. Walmart’s interests in reducing their own carbon footprint has pushed our company to consider all initiatives in order to be a more responsible supplier.”
This is just scratching the surface. Participants identify 2,186 collaborative opportunities that have been suggested but not yet implemented, (recommended by 1068 supplier companies). The persistent gap in performance between supply chain member companies and their suppliers suggests that there remains a void in knowledge and incentives.
This begs the question: How best can companies work with their suppliers to drive sustainability in the supply chain?
But it is crucial that the information gleaned from risk identification, emissions allocation, lifecycle analyses and materiality matrixes is fed into the right processes. Risk management is a vital component of a company’s response to the sustainability challenge, and our analysis shows that leading companies are integrating climate change risk into business risk management processes. Participants were asked if they have identified current or future climate-related risks across three categories: regulatory, physical, or ‘other’. More than three-quarters (78%) of companies that had identified climate risks across all three categories and provided details about their risk management approaches integrate climate risk into their company-wide, multi-disciplinary risk management processes.
Some companies in the vanguard have established specific climate risk management systems.
{ BASF in 2008 created the position of Climate Protection Officer, leading the Management Team for Climate Protection, with responsibility for integrating climate-related issues into strategy at the business unit and corporate levels.
{ British Sky Broadcasting has been running a specific climate change risk management process since 2009, with each business unit required to submit risks annually to the group’s risk register.
Worryingly, however, 38% of suppliers reported no documented processes for assessing and managing climate-related risks. It is vital that major companies press their suppliers to improve their climate risk management strategies – their shortcomings are exposing their customers to unmanaged climate risk. Moreover, CDP data shows that emissions performance improves as the number of identified risks grows. All companies need a comprehensive risk management approach to help mitigate regulatory and physical climate-related exposures.
Collaboration along the supply chain Collaboration is at the very heart of supply chain sustainability. It is only by working with supply chain partners that companies can drive reductions in the environmental and social impacts that lie outside their direct operations, and address supply chain vulnerabilities that can have crippling impacts on their profitability and reputation. Suppliers listen to their customers; collaboration can encourage suppliers to identify and realize sustainability opportunities that can add monetary value as well as deliver environmental benefits.
It is clear that collaboration yields results but there is huge untapped potential for emissions reductions from supply chain collaboration. For the first time, CDP asked suppliers to report on the number of emissions reduction projects they had implemented following engagement of supply chain members, and the volume of emissions
5. The 3% Solution: Driving Profits Through Carbon Reductions - a report by CDP and WWF
6. The 3% Solution: Driving Profits Through Carbon Reductions - a report by CDP and WWF
7. The 3% Solution: Driving Profits Through Carbon Reductions - a report by CDP and WWF
20
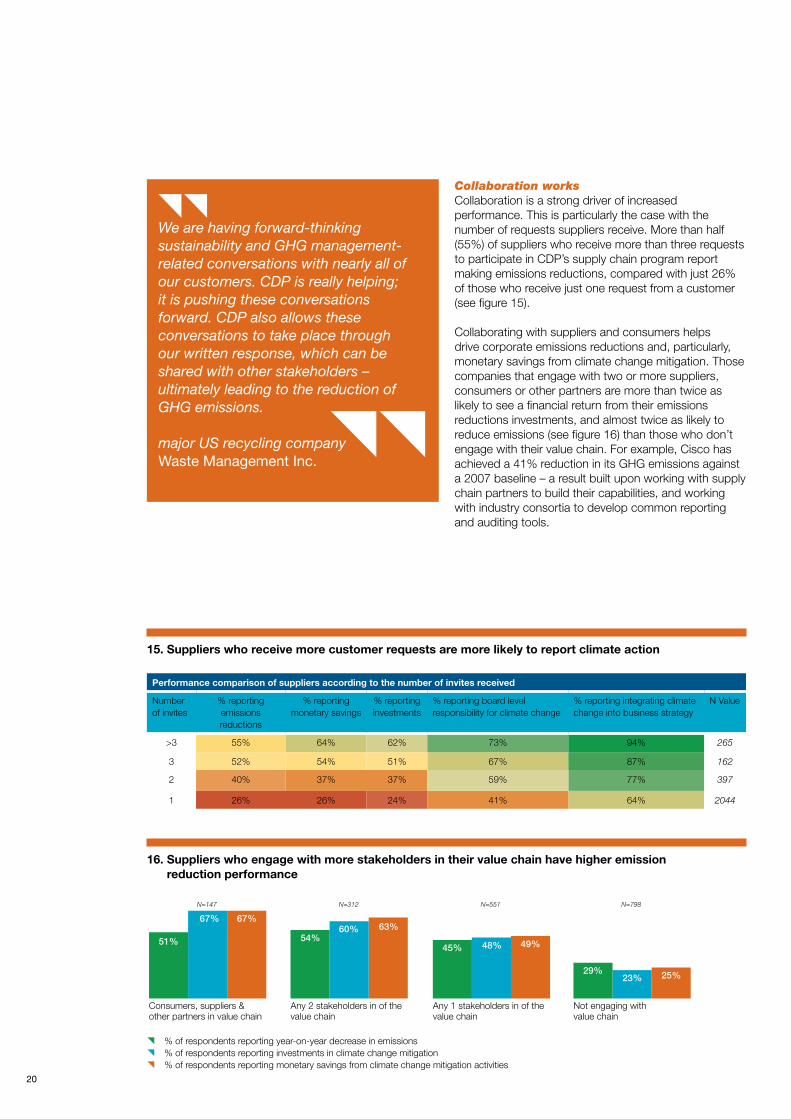
Collaboration works Collaboration is a strong driver of increased performance. This is particularly the case with the number of requests suppliers receive. More than half (55%) of suppliers who receive more than three requests to participate in CDP’s supply chain program report making emissions reductions, compared with just 26% of those who receive just one request from a customer (see figure 15).
Collaborating with suppliers and consumers helps drive corporate emissions reductions and, particularly, monetary savings from climate change mitigation. Those companies that engage with two or more suppliers, consumers or other partners are more than twice as likely to see a financial return from their emissions reductions investments, and almost twice as likely to reduce emissions (see figure 16) than those who don’t engage with their value chain. For example, Cisco has achieved a 41% reduction in its GHG emissions against a 2007 baseline – a result built upon working with supply chain partners to build their capabilities, and working with industry consortia to develop common reporting and auditing tools.
We are having forward-thinking sustainability and GHG management-related conversations with nearly all of our customers. CDP is really helping; it is pushing these conversations forward. CDP also allows these conversations to take place through our written response, which can be shared with other stakeholders – ultimately leading to the reduction of GHG emissions.
major US recycling companyWaste Management Inc.
Performance comparison of suppliers according to the number of invites received
Number of invites
% reporting emissions reductions
% reporting monetary savings
% reporting investments
% reporting board level responsibility for climate change
% reporting integrating climate change into business strategy
N Value
>3 55% 64% 62% 73% 94% 265
3 52% 54% 51% 67% 87% 162
2 40% 37% 37% 59% 77% 397
1 26% 26% 24% 41% 64% 2044
15. Suppliers who receive more customer requests are more likely to report climate action
16. Suppliers who engage with more stakeholders in their value chain have higher emission reduction performance
Consumers, suppliers & other partners in value chain
Any 2 stakeholders in of the value chain
Any 1 stakeholders in of the value chain
Not engaging with value chain
51% 54%45%
67%60%
48%
67%63%
49%
{% of respondents reporting year-on-year decrease in emissions{% of respondents reporting investments in climate change mitigation{% of respondents reporting monetary savings from climate change mitigation activities
N=147 N=312 N=551 N=798
29%23% 25%
21
As US recycling major Waste Management Inc. puts it: “We are having forward-thinking sustainability and GHG management-related conversations with nearly all of our customers. CDP is really helping; it is pushing these conversations forward. CDP also allows these conversations to take place through our written response, which can be shared with other stakeholders – ultimately leading to the reduction of GHG emissions.”
Participation in CDP’s supply chain program is a vital first step – and is driving supplier engagement on sustainability and climate change issues, that is not happening at all within the vast majority of multinationals. But member companies need to do more. High levels of performance among the 64 supply chain members do not necessarily influence suppliers, who are understandably most concerned with their own performance. Indeed, the data shows that suppliers to the climate change leaders (whose performance score is higher than average performance score) cohort slightly underperform those supplying to the laggards.
This result seems counter-intuitive. We can speculate that leaders have perhaps focused on their own performance to the detriment of their supply chain. But this presents a challenge to member company leaders: if they fail to improve the performance of their supply chains then, at best, their designation as leaders will become little more than notional. At worst, they will be exposing themselves to unmanaged climate risks in their supply chains
So how might companies seek to motivate their suppliers?
{ Preferential treatment First, buyers can directly incentivize sustainability
performance by, for example, giving preferential treatment to suppliers who deliver on a particular sustainability metric. Vodafone Group Plc, for instance, bases the share of the business it gives to approved suppliers upon a sustainability scorecard they are required to fill out.
{ Rethinking risk management Buyers can also work with their suppliers on improving
the latter’s risk management, to the benefit of both parties. 94% of member companies integrate climate issues into company-wide risk management processes, compared with 51% of suppliers. It is in customers’ interests to ensure that their suppliers have a handle on risks that could lead to business interruption.
Launching CDP Action Exchange CDP’s supply chain newly-launched Action Exchange program is designed to equip companies with the intelligence and solutions that will help them take action to reduce greenhouse gas emissions and realize financial savings. Six founding CDP supply chain member companies – Bank of America, L’Oreal, PepsiCo, Philips, Vodafone and Walmart – have invited key suppliers to participate. These suppliers will benefit from in-depth analysis, using CDP response data and company-specific information, to identify the most relevant, cost efficient emissions reduction opportunities open to them.
The Institute for Industrial Productivity and the University of Minnesota’s Institute on the Environment will conduct the analysis in partnership with CDP. Action Exchange will also identify and select technology, service and finance providers to undertake the projects identified by the analysis. While participation in the initiative will come at no cost to suppliers, they will be required to give serious consideration to the opportunities presented through Action Exchange.
Action Exchange addresses some of the barriers that prevent companies seizing low- or no-cost emissions reductions opportunities – the lack of management focus, questions over payback periods, and lack of access to finance – with the goal of closing the performance gap between CDP’s supply chain members and their suppliers.
This first phase of Action Exchange has been made possible by the generous support of ClimateWorks Foundation and Energy Foundation.
{ Finding common ground One of the findings this year is a disconnect between
the types of collaboration recommended by suppliers as most effective, and the types of collaboration pursued by member companies. Suppliers recommend process emissions reductions (18% of total instances of collaboration mechanisms reported) and product design (15%) as the most promising collaborative approaches. However, the most favored investments made by member companies are behavioral change initiatives (40%) and transportation and fleet investments (27%). Suppliers favor investments in energy efficiency processes (42%) and energy efficiency in building services (cited by 33% of responding suppliers).
There is clearly room for closer collaboration between member companies and their suppliers. To address this opportunity CDP has launched its Action Exchange initiative (AEX) (see box below).
22
Living in a modern world, it’s clear that everything we do depends on energy. Every waking moment underlines our utter dependence – from switching on the light or heating, to using our computers and smartphones, to using transport to and from work. What we don’t often consider is the energy used in the production of every item we come into contact with during our day.
Industry is responsible for around a third of the world’s total energy use – more than any other sector of the economy. With growing concerns about climate change, it’s clear that the way industry uses energy will need to change. To do this, the market will need to be transformed, new technologies will have to be created, and the price of carbon will need to be considered in everything we produce.
The Action Exchange project will contribute to this important task by enabling multinational corporations to become a beacon for positive change, rather than a symbol of consumption. It will do this by helping companies reduce greenhouse gas emissions throughout their supply chains, which reach into every sector and every corner of the world.
The value of using supply chains to drive change cannot be underestimated. Around 40 to 60% of a manufacturing company’s carbon footprint comes from its supply chain, but this number can be as high as 80%.
IIP will work with participating firms to help them improve their energy efficiency practices, and those of their suppliers. The companies that are part of these supply chains can expect to improve their profitability, productivity and competitiveness in the process.
These aren’t the only benefits. Multiplied on a larger scale, energy efficient practices could bring a host of other benefits to human health and the environment, generate jobs and drive economic growth. It could also trigger a major shift away from outdated electric utility business models and usher in a new era of smart power.
It’s because of these positive outcomes that many companies and governments are turning to energy efficiency to help them meet their business and policy objectives. Energy management, in particular, has been the focus of both policymakers and industry leaders over the last few years, and many major companies now also consider the price of carbon as a core element of their business strategy.
While these efforts will go some way towards reducing growing emissions – it’s not yet enough. The aspiration to be carbon neutral must be at the heart of all business strategies if we are to cut emissions enough to make a real difference. It is our hope that the Action Exchange project will be part of the wave of new policies, programs and products that will drive this change.
Established in 2010, IIP is an independent non-profit organization whose role is to accelerate the uptake of energy efficiency practices amongst industry. It is the only global organization solely dedicated to helping reduce industrial energy use to mitigate climate change and address other relevant environmental issues. IIP has a global team and network of independent experts that provide advice on technology, policy and financing of industrial energy efficiency. It also works at national and local levels to improve energy efficiency policies, practices and technology adoption. www.iipnetwork.org
Action Exchange: helping to put energy efficiency at the heart of business
The Institute for Industrial Productivity (IIP) works to mitigate climate change by helping industry cut its energy use. Working with CDP on the Action Exchange project will support the growing movement towards smarter, cleaner manufacturing.
23
Expectedly, over half of the 5,000 emissions reductions activities reported to CDP’s 2013 Supply Chain Survey fall within the “low hanging fruit” category of energy efficiency. Process improvements (e.g. heat recovery, wastewater treatment) are the most common energy efficiency projects, with building services (e.g. HVAC, lighting) a close second. However, if history serves as a guide, it is safe to say that these reported investments only scratch the surface of potential energy or cost savings. In short, many are investing in easy-to-implement projects with quick hitting, though modest, carbon reductions. Though not insignificant, these efforts, alone, may not be able to meet the carbon reduction targets of an increasing number of companies; nor do they meet the growing expectations of key customers.
Seventy percent of CDP reporting companies indicate that they manage some form of target for carbon emissions reductions. Unlike the pursuit of “low hanging” projects, achieving a specified emissions reduction target necessitates a much greater focus on identifying the most efficient strategies in meeting that goal. The rules of the sustainability game are shifting from justifying the expense of doing anything, to strategically innovating in order to meet specific reductions, often driven by customers. Better understanding this shift across supply chains, through enhanced analysis of CDP’s data resources, is at the heart of recent collaborations between CDP and the University of Minnesota’s NorthStar Initiative for Sustainable Enterprise (NiSE).
Analysis supporting CDP’s new Action Exchange (AEX) initiative indicates that, across all sectors, product design changes yield the largest annual savings per tonne of CO2e saved, significantly greater than any other emissions reductions category. However, these strategies also come with the highest reported initial investment requirements. In contrast, many
lighting efficiency projects require significantly less initial investment, but generate 1/100 of the carbon emissions reductions of product design and 1/166 of the reductions of process emissions reductions. When managing a reduction target, not all projects will generate enough emissions reductions to be worth pursuing – nor will all targeted reductions necessarily be financially net-positive.
For some companies, especially small and medium enterprises hindered by a lack of capital or access to financing, low initial investment costs are key to implementation. For these, energy efficiency projects in building services and processes are the two areas with the best carbon savings per initial investment dollar. However, the biggest-hitting carbon reduction opportunities identified by CDP respondents are found in product design, low carbon energy purchases, behavior change and process emissions reductions.
When large customers ask suppliers, “how are you reducing carbon emissions?” the response, “we aren’t” is not an option. Increasingly, the response, “we do a few of the easy things” may also be falling short of customer expectations. The analytics provided to suppliers participating in AEX is benchmarking performance relative to peers and identifying opportunities to demonstrate meaningful and efficient carbon reductions to the supply chain – helping firms find the lowest-hanging, biggest-hitting emissions reduction strategies.
Getting beyond the question of why companies might invest in carbon reduction activities, many companies are focusing on how to accomplish them – and, discovering that “low hanging fruit” may not produce the “biggest bang for the buck”.
Action Exchange - Going beyond low hanging fruits
24
Motivating staff, suppliers and customers Collaboration is only one part of the story. Companies – whether suppliers or customers – need to build their internal capacity to identify climate change risks and opportunities. They need to ensure that emissions reductions initiatives they pursue, whether internal or in partnership, are successful. They need to motivate their employees to deliver on their objectives.
Getting governance right How climate change is addressed by company governance structures is critical to determining how successful companies are in managing the issue, according to participants in CDP’s supply chain program.
The findings are unequivocal: companies that integrate climate change into business strategy perform better than those that don’t. Of those companies that do so, at least four in ten have reduced emissions, made investments in emissions reductions, or saw monetary savings from those investments. Of those that don’t, the figures are one in six, one in ten, and one in ten, respectively.
Similarly, the higher the level of responsibility for the climate change issue, the better the performance achieved. Board-level responsibility generates between three and six times the level of performance of companies with no individual or committee with overall responsibility.
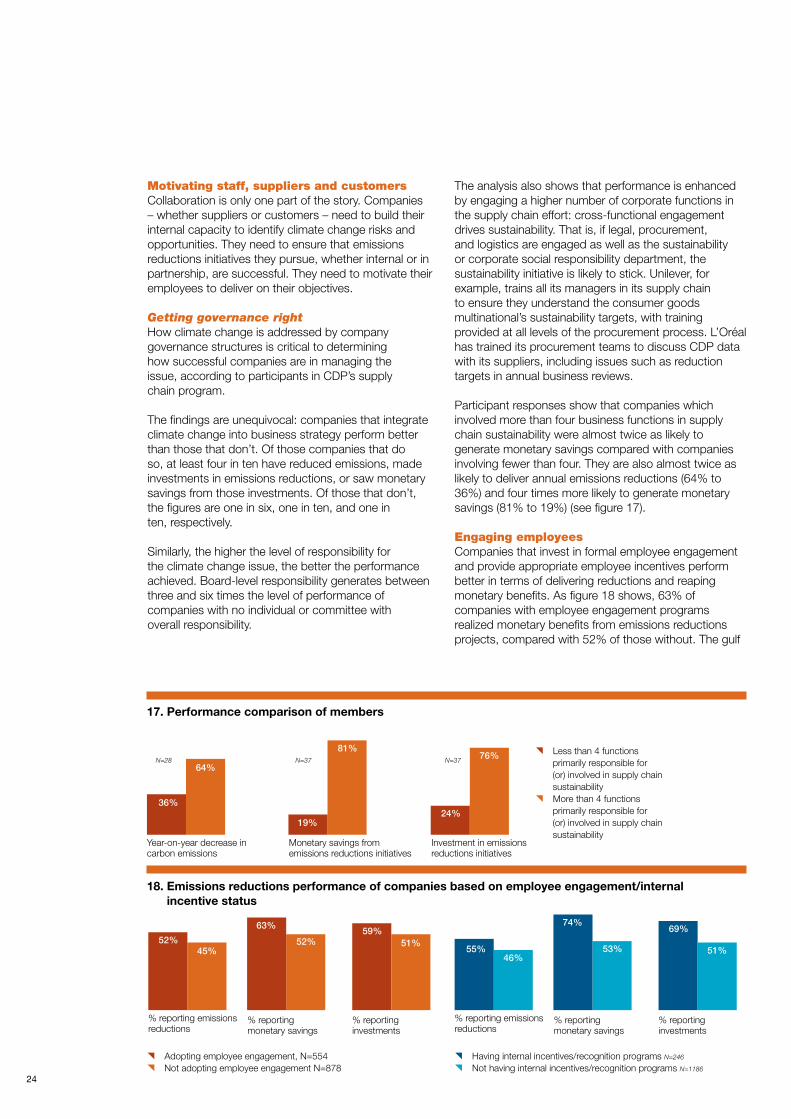
The analysis also shows that performance is enhanced by engaging a higher number of corporate functions in the supply chain effort: cross-functional engagement drives sustainability. That is, if legal, procurement, and logistics are engaged as well as the sustainability or corporate social responsibility department, the sustainability initiative is likely to stick. Unilever, for example, trains all its managers in its supply chain to ensure they understand the consumer goods multinational’s sustainability targets, with training provided at all levels of the procurement process. L’Oréal has trained its procurement teams to discuss CDP data with its suppliers, including issues such as reduction targets in annual business reviews.
Participant responses show that companies whichinvolved more than four business functions in supply chain sustainability were almost twice as likely to generate monetary savings compared with companies involving fewer than four. They are also almost twice as likely to deliver annual emissions reductions (64% to 36%) and four times more likely to generate monetary savings (81% to 19%) (see figure 17).
Engaging employees Companies that invest in formal employee engagement and provide appropriate employee incentives perform better in terms of delivering reductions and reaping monetary benefits. As figure 18 shows, 63% of companies with employee engagement programs realized monetary benefits from emissions reductions projects, compared with 52% of those without. The gulf
17. Performance comparison of members
18. Emissions reductions performance of companies based on employee engagement/internal incentive status
Year-on-year decrease in carbon emissions
Monetary savings from emissions reductions initiatives
Investment in emissions reductions initiatives
36%
19%24%
64%
81%76% {Less than 4 functions
primarily responsible for (or) involved in supply chain sustainability
{More than 4 functions primarily responsible for (or) involved in supply chain sustainability
N=28 N=37 N=37
% reporting emissions reductions
% reporting emissions reductions
% reporting monetary savings
% reporting monetary savings
% reporting investments
% reporting investments
52%55%
63% 74%59% 69%
45%46%
52%53%
51%51%
{Adopting employee engagement, N=554{Not adopting employee engagement N=878
{Having internal incentives/recognition programs N=246
{Not having internal incentives/recognition programs N=1186
25
CDP’s unique insight has provided critical support for the Ministry of Finance in China’s work on green procurement over the last year. We look forward to continuing working with CDP on this important issue to catalyze more sustainable government and business practice. We wish CDP a successful future in China.
Zhai Gang, Director General, Treasury Department, Ministry of Finance, Government of the People’s Republic of China
was even wider with incentive programs: nearly three-quarters of companies with such initiatives reported monetary benefits, compared with a little over half of those without.
Such programs might include specific emissions-related KPIs as a formal part of employee remuneration packages. Examples from CDP reporting include:
{ Diageo Plc’s performance indicator incentivized for business unit managers is focused on progress against its target to reduce carbon emissions by 50% by 2015. The annual business objectives for business unit managers include an annual target for carbon reduction for the manager’s region of responsibility. Achieving this annual carbon target results in a higher bonus payout for the individual.
{ BMW’s management bonus payments are directly linked to the fulfillment of the German carmaker’s corporate and divisional climate change targets.
{ The 5,000 top managers of French bank BNP Paribas participate in its International Sustainability Incentive Scheme, which is indexed to nine CSR targets, including reduction of energy consumption from premises and reduced business travel.
However, such programs appear to be a relatively low priority for companies, despite the performance benefits they bring. In most sectors, fewer than one in ten companies have incentive programs, the exceptions being financials (one in five) utilities (one in seven) and healthcare (one in eight). Employee engagement programs are more widespread, but even here, typically at least three quarters of companies do not have them in place (financials are an exception).
Supporting suppliersAs we have seen, member companies have not paid sufficient attention to supporting their suppliers in improving sustainability performance – leaving risks unaddressed and opportunities unexploited. However, we have found numerous examples of best practice among supply chain program members:
{ A major financial institution and member of CDP’s supply chain program runs a program offering grants to key suppliers to measure their environmental footprint, as well as private coaching and help setting goals.
{ Through its Sustainable Agriculture Code, Unilever asks suppliers, and the farmers who supply them, to adopt sustainable practices on their farms. Unilever expects all suppliers of agricultural raw materials to commit to joining the sustainability journey and to demonstrate that they agree to minimum standards of performance and to improve performance continuously over time.
{ Acer has asked its key suppliers to set up intensity reduction target from 1 to 5 % per unit every year since 2011.
In addition, CDP provides training and support to both CDP supply chain member companies and their direct suppliers. CDP runs workshops all over the world, and a series of online webinars, tailored exclusively to suppliers. Regional events have been particularly beneficial; for the last two years, CDP supply chain has worked with the Chinese government and the UK Foreign & Commonwealth Office on climate change. By providing translated guidance, carbon foot-printing tools and capacity building webinars to Chinese suppliers, the program has encouraged more than 100 Chinese suppliers to disclose their emissions via CDP’s reporting platform.
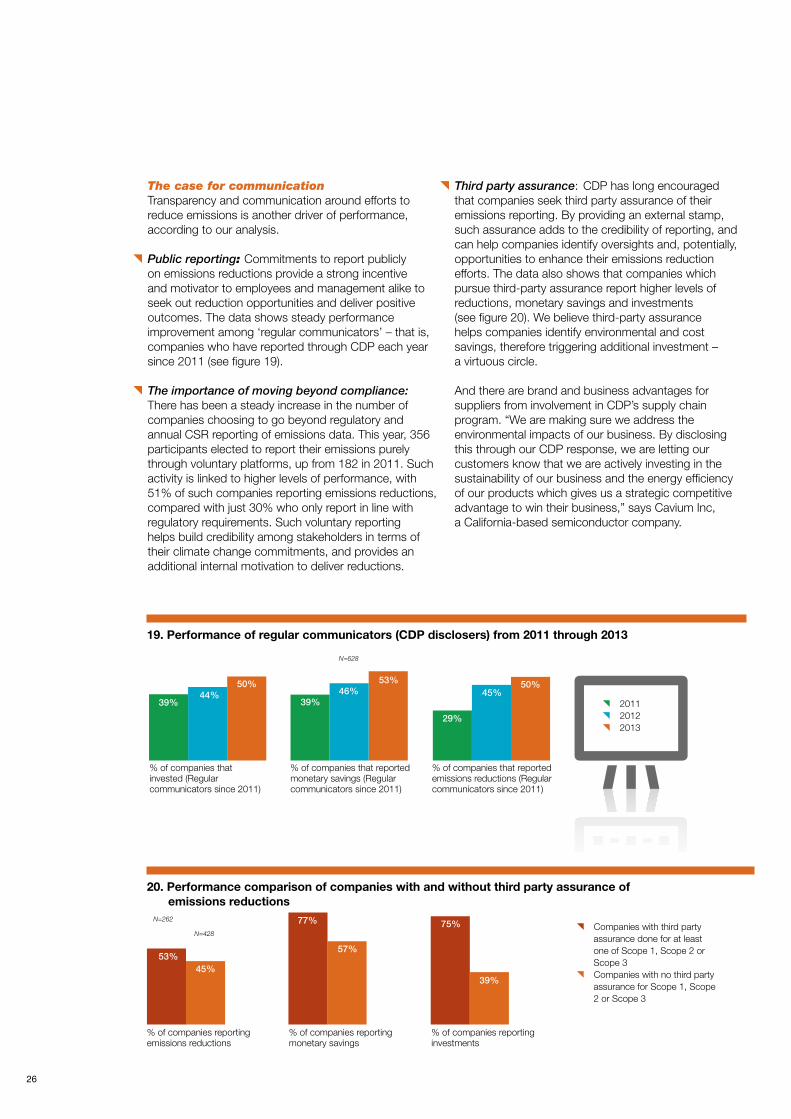
26
The case for communication Transparency and communication around efforts to reduce emissions is another driver of performance, according to our analysis.
{ Public reporting: Commitments to report publicly on emissions reductions provide a strong incentive and motivator to employees and management alike to seek out reduction opportunities and deliver positive outcomes. The data shows steady performance improvement among ‘regular communicators’ – that is, companies who have reported through CDP each year since 2011 (see figure 19).
{ The importance of moving beyond compliance: There has been a steady increase in the number of companies choosing to go beyond regulatory and annual CSR reporting of emissions data. This year, 356 participants elected to report their emissions purely through voluntary platforms, up from 182 in 2011. Such activity is linked to higher levels of performance, with 51% of such companies reporting emissions reductions, compared with just 30% who only report in line with regulatory requirements. Such voluntary reporting helps build credibility among stakeholders in terms of their climate change commitments, and provides an additional internal motivation to deliver reductions.
{ Third party assurance: CDP has long encouraged that companies seek third party assurance of their emissions reporting. By providing an external stamp, such assurance adds to the credibility of reporting, and can help companies identify oversights and, potentially, opportunities to enhance their emissions reduction efforts. The data also shows that companies which pursue third-party assurance report higher levels of reductions, monetary savings and investments (see figure 20). We believe third-party assurance helps companies identify environmental and cost savings, therefore triggering additional investment – a virtuous circle.
And there are brand and business advantages for suppliers from involvement in CDP’s supply chain program. “We are making sure we address the environmental impacts of our business. By disclosing this through our CDP response, we are letting our customers know that we are actively investing in the sustainability of our business and the energy efficiency of our products which gives us a strategic competitive advantage to win their business,” says Cavium Inc, a California-based semiconductor company.
20. Performance comparison of companies with and without third party assurance of emissions reductions
% of companies reporting emissions reductions
% of companies reporting monetary savings
% of companies reporting investments
53%
77% 75%
45%
57%
39%
{Companies with third party assurance done for at least one of Scope 1, Scope 2 or Scope 3
{Companies with no third party assurance for Scope 1, Scope 2 or Scope 3
N=262
19. Performance of regular communicators (CDP disclosers) from 2011 through 2013
% of companies that reported emissions reductions (Regular communicators since 2011)
% of companies that reported monetary savings (Regular communicators since 2011)
% of companies that invested (Regular communicators since 2011)
39% 39%
29%
44% 46% 45%50% 53% 50%
N=628
N=428
{2011{2012{2013
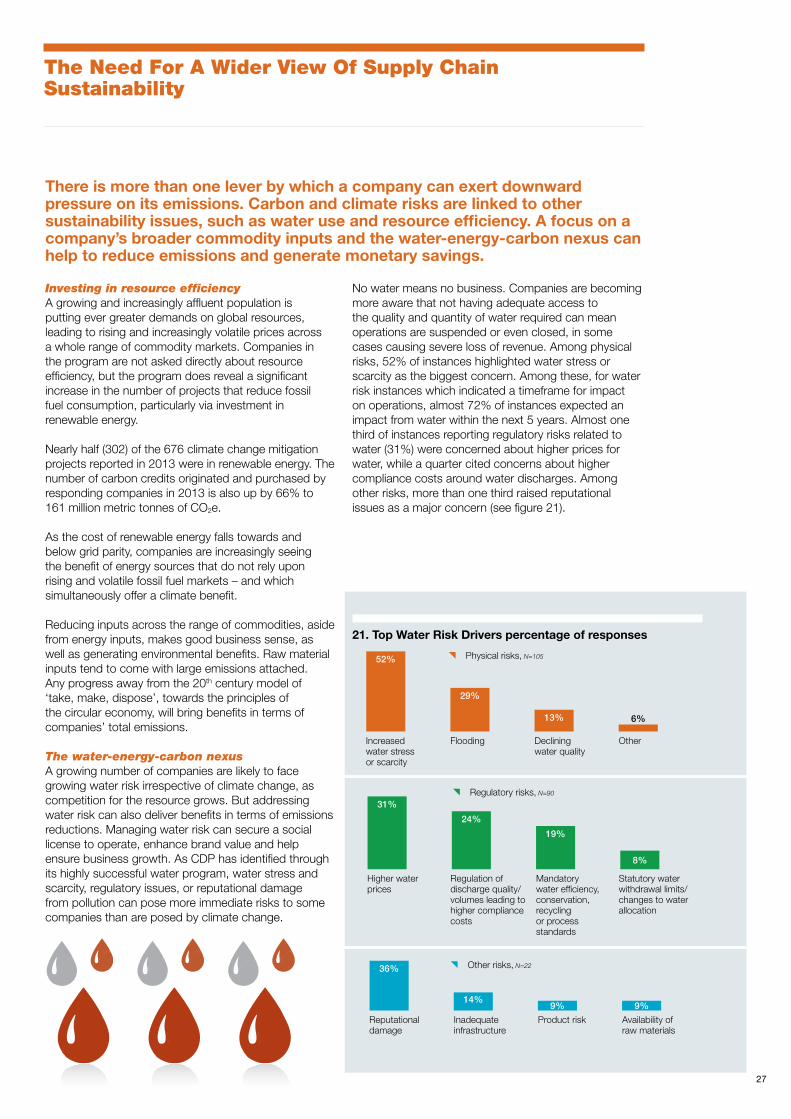
27
Investing in resource efficiency A growing and increasingly affluent population is putting ever greater demands on global resources, leading to rising and increasingly volatile prices across a whole range of commodity markets. Companies in the program are not asked directly about resource efficiency, but the program does reveal a significant increase in the number of projects that reduce fossil fuel consumption, particularly via investment in renewable energy.
Nearly half (302) of the 676 climate change mitigation projects reported in 2013 were in renewable energy. The number of carbon credits originated and purchased by responding companies in 2013 is also up by 66% to 161 million metric tonnes of CO2e.
As the cost of renewable energy falls towards and below grid parity, companies are increasingly seeing the benefit of energy sources that do not rely upon rising and volatile fossil fuel markets – and which simultaneously offer a climate benefit.
Reducing inputs across the range of commodities, aside from energy inputs, makes good business sense, as well as generating environmental benefits. Raw material inputs tend to come with large emissions attached. Any progress away from the 20th century model of ‘take, make, dispose’, towards the principles of the circular economy, will bring benefits in terms of companies’ total emissions.
The water-energy-carbon nexusA growing number of companies are likely to face growing water risk irrespective of climate change, as competition for the resource grows. But addressing water risk can also deliver benefits in terms of emissions reductions. Managing water risk can secure a social license to operate, enhance brand value and help ensure business growth. As CDP has identified through its highly successful water program, water stress and scarcity, regulatory issues, or reputational damage from pollution can pose more immediate risks to some companies than are posed by climate change.
The Need For A Wider View Of Supply Chain Sustainability
No water means no business. Companies are becoming more aware that not having adequate access to the quality and quantity of water required can mean operations are suspended or even closed, in some cases causing severe loss of revenue. Among physical risks, 52% of instances highlighted water stress or scarcity as the biggest concern. Among these, for water risk instances which indicated a timeframe for impact on operations, almost 72% of instances expected an impact from water within the next 5 years. Almost one third of instances reporting regulatory risks related to water (31%) were concerned about higher prices for water, while a quarter cited concerns about higher compliance costs around water discharges. Among other risks, more than one third raised reputational issues as a major concern (see figure 21).
There is more than one lever by which a company can exert downward pressure on its emissions. Carbon and climate risks are linked to other sustainability issues, such as water use and resource efficiency. A focus on a company’s broader commodity inputs and the water-energy-carbon nexus can help to reduce emissions and generate monetary savings.
21. Top Water Risk Drivers percentage of responses
Increased water stress or scarcity
Flooding Declining water quality
Other
52%
29%
13% 6%
{Physical risks, N=105
Higher water prices
Regulation of discharge quality/volumes leading to higher compliance costs
Mandatory water efficiency, conservation, recycling or process standards
Statutory water withdrawal limits/changes to water allocation
31%
24%
19%
8%
{Regulatory risks, N=90
Reputational damage
Inadequate infrastructure
Product risk Availability of raw materials
36%
14%9%
{Other risks, N=22
9%
28
These risks create an urgent need for companies to take action to address corporate water issues. In addition, 26% of participants also identified linkages between water and carbon emissions in their operations or supply chains. For example:
{ ITC Limited has increased levels of water recycling at its paper manufacturing unit, significantly reducing the amount of energy the Indian conglomerate hitherto used to pump freshwater from a river some miles away.
{ Through an innovative wastewater recycling program, Dow Chemical’s Terneuzen manufacturing facility accepts 10,000 cubic meters of municipal household wastewater each day from the city, has it purified by water company Evides, and uses it to generate steam and feed its manufacturing plants. The program has reduced Dow Terneuzen’s energy use by 95 percent, the equivalent of reducing CO2 emissions by 60,000 tonnes each year.
Supply chain collaboration is also crucial: for many companies, the majority of their water risk is to be found in their supply chains, from agricultural or other commodity inputs, for example. ITC Limited has identified the reduced availability of its agricultural raw materials as a key water risk. In response, it has undertaken a community-based watershed development program to address land degradation, extend irrigation and raise agricultural productivity.
Companies must also be mindful of the ideal scale at which to address water risks. Unlike carbon emissions, which have an identical climate impact wherever they are generated, water risks are highly localized. While two-thirds of pulp and paper companies identified water risk as most acute at the facility level, 69% of food products companies considered water risk to manifest itself at the regional or country level. These latter risks require collaboration with other regional or national stakeholders.
However, preparedness lags, even among companies acknowledging the risks that water can pose:
{ Only 53% companies disclosing information on water risks have water-related targets, highlighting the fact that companies are recognizing water risks but not enough companies are taking action to mitigate them;
{ Only 46% of companies report data on water recycling within their operations;
{ Only 35% of companies report having board-level responsibility for water conservation; and
{ Only 18% of companies require their key suppliers to report on their water use, risks and management.
We would recommend that for both suppliers and supply chain members to take the lead in water stewardship, they need to:
{ Identify where they are most exposed to water risk throughout their operations in order to prioritize action;
{ Recognize that water is a shared resource and therefore requires a shared response. Collaboration with key stakeholders at the local water shed level is key;
{ Look beyond their direct operations and take action across their value chain; and.
{ Set targets that include action not just on water conservation, but also on policy, community and supply chain engagement, and transparency.
53%companies disclosing information on water risks have water-related targets, highlighting the fact that companies are recognizing water risks but are not enough companies are taking action to mitigate them
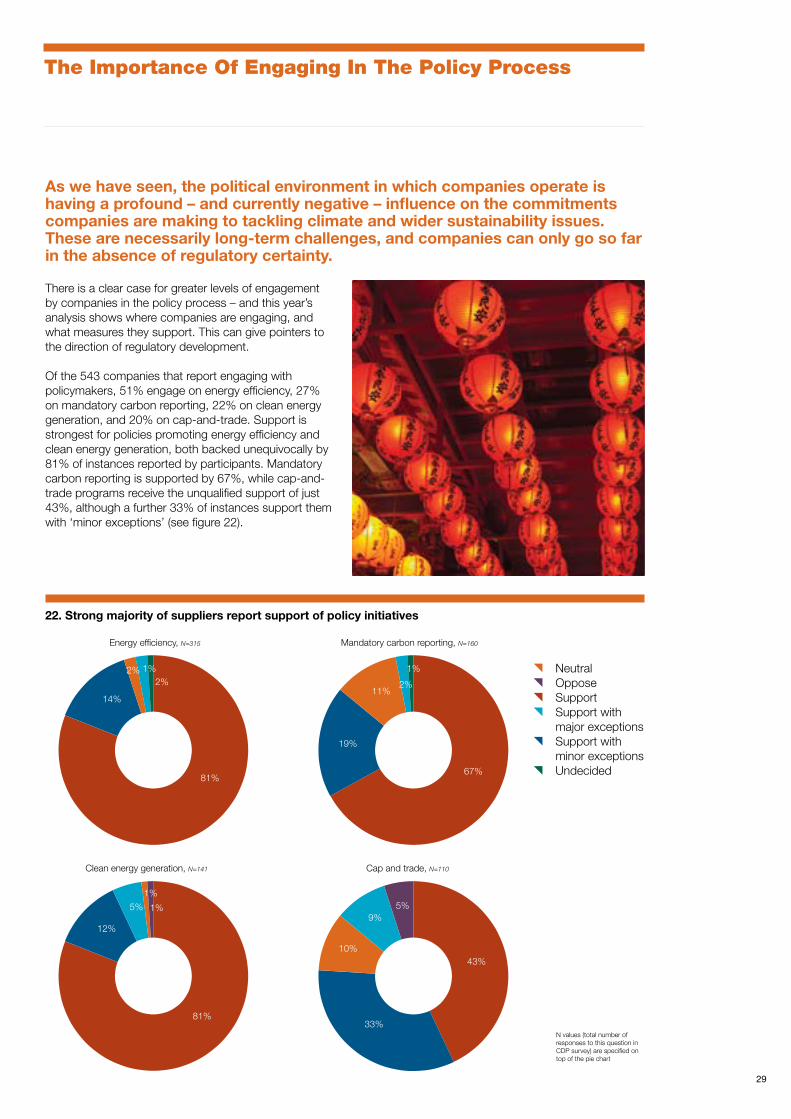
29
The Importance Of Engaging In The Policy Process
There is a clear case for greater levels of engagement by companies in the policy process – and this year’s analysis shows where companies are engaging, and what measures they support. This can give pointers to the direction of regulatory development.
Of the 543 companies that report engaging with policymakers, 51% engage on energy efficiency, 27% on mandatory carbon reporting, 22% on clean energy generation, and 20% on cap-and-trade. Support is strongest for policies promoting energy efficiency and clean energy generation, both backed unequivocally by 81% of instances reported by participants. Mandatory carbon reporting is supported by 67%, while cap-and-trade programs receive the unqualified support of just 43%, although a further 33% of instances support them with ‘minor exceptions’ (see figure 22).
As we have seen, the political environment in which companies operate is having a profound – and currently negative – influence on the commitments companies are making to tackling climate and wider sustainability issues. These are necessarily long-term challenges, and companies can only go so far in the absence of regulatory certainty.
81+14+2+2+1+t 67+19+11+2+1+t81+12+5+1+1+t 43+33+10+9+5+t
{Neutral{Oppose{Support{Support with
major exceptions{Support with
minor exceptions{Undecided
2%
2%
5%9%
14%
19%
12%
33%
1% 1%
1%
10%
2%11%
1% 5%
81%67%
81%
43%
22. Strong majority of suppliers report support of policy initiatives
Energy efficiency, N=315
Clean energy generation, N=141 Cap and trade, N=110
Mandatory carbon reporting, N=160
N values (total number of responses to this question in CDP survey) are specified on top of the pie chart
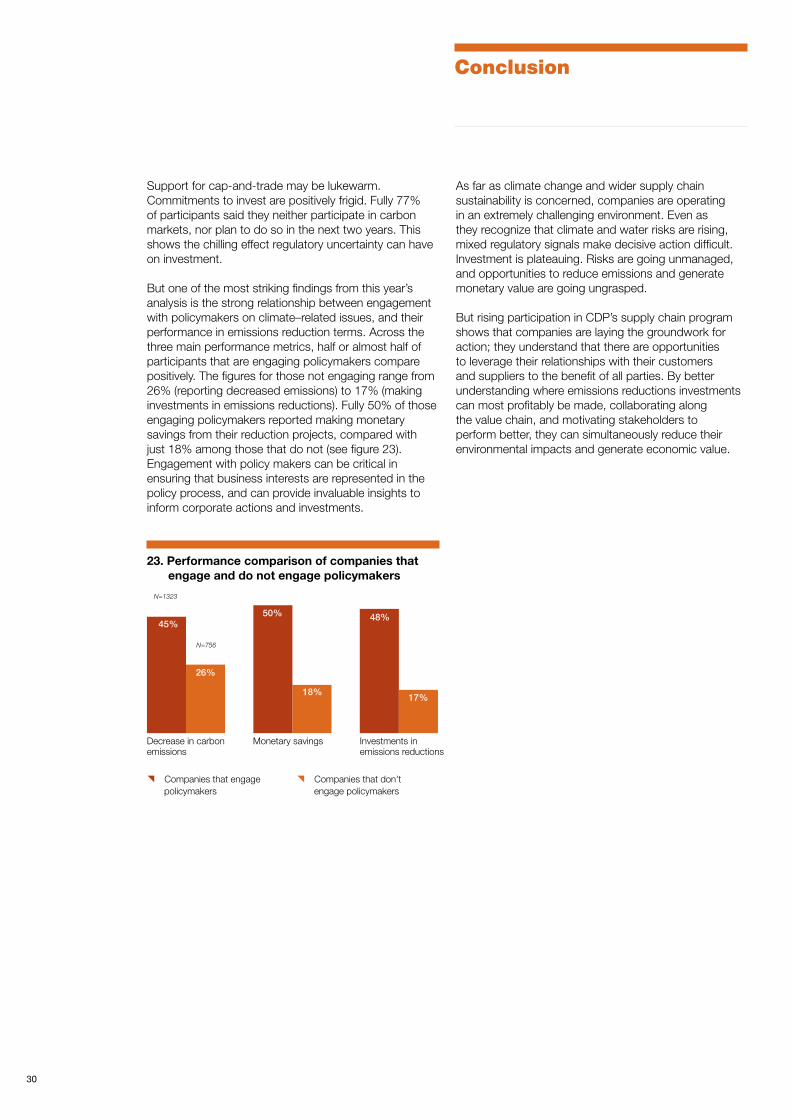
30
Support for cap-and-trade may be lukewarm. Commitments to invest are positively frigid. Fully 77% of participants said they neither participate in carbon markets, nor plan to do so in the next two years. This shows the chilling effect regulatory uncertainty can have on investment.
But one of the most striking findings from this year’s analysis is the strong relationship between engagement with policymakers on climate–related issues, and their performance in emissions reduction terms. Across the three main performance metrics, half or almost half of participants that are engaging policymakers compare positively. The figures for those not engaging range from 26% (reporting decreased emissions) to 17% (making investments in emissions reductions). Fully 50% of those engaging policymakers reported making monetary savings from their reduction projects, compared with just 18% among those that do not (see figure 23). Engagement with policy makers can be critical in ensuring that business interests are represented in the policy process, and can provide invaluable insights to inform corporate actions and investments.
Conclusion
As far as climate change and wider supply chain sustainability is concerned, companies are operating in an extremely challenging environment. Even as they recognize that climate and water risks are rising, mixed regulatory signals make decisive action difficult. Investment is plateauing. Risks are going unmanaged, and opportunities to reduce emissions and generate monetary value are going ungrasped. But rising participation in CDP’s supply chain program shows that companies are laying the groundwork for action; they understand that there are opportunities to leverage their relationships with their customers and suppliers to the benefit of all parties. By better understanding where emissions reductions investments can most profitably be made, collaborating along the value chain, and motivating stakeholders to perform better, they can simultaneously reduce their environmental impacts and generate economic value.
23. Performance comparison of companies that engage and do not engage policymakers
Decrease in carbon emissions
Monetary savings Investments in emissions reductions
45%
26%
50%
18%
48%
17%
{Companies that engage policymakers
{Companies that don’t engage policymakers
N=1323
N=756
31
SCPLI – Supplier Climate Performance Leadership Index
Each year, supplier responses to CDP’s climate change information request are analyzed and scored against two parallel scoring methodologies: disclosure and performance. This year, for the first time, we are publishing a list of the suppliers that are leading on performance.
The performance score assesses the level of action, as reported by the company on climate change mitigation, adaptation and transparency. Its intent is to highlight positive climate action as demonstrated by a company’s CDP response. A high performance score signals that a company is measuring, verifying and managing its carbon footprint, for example by setting and meeting carbon reduction targets and implementing programs to reduce emissions in both its direct operations and supply chain.
Many members use supplier scores in their assessments of suppliers. The CDP scoring methodology is the highest rated sustainability rating system.
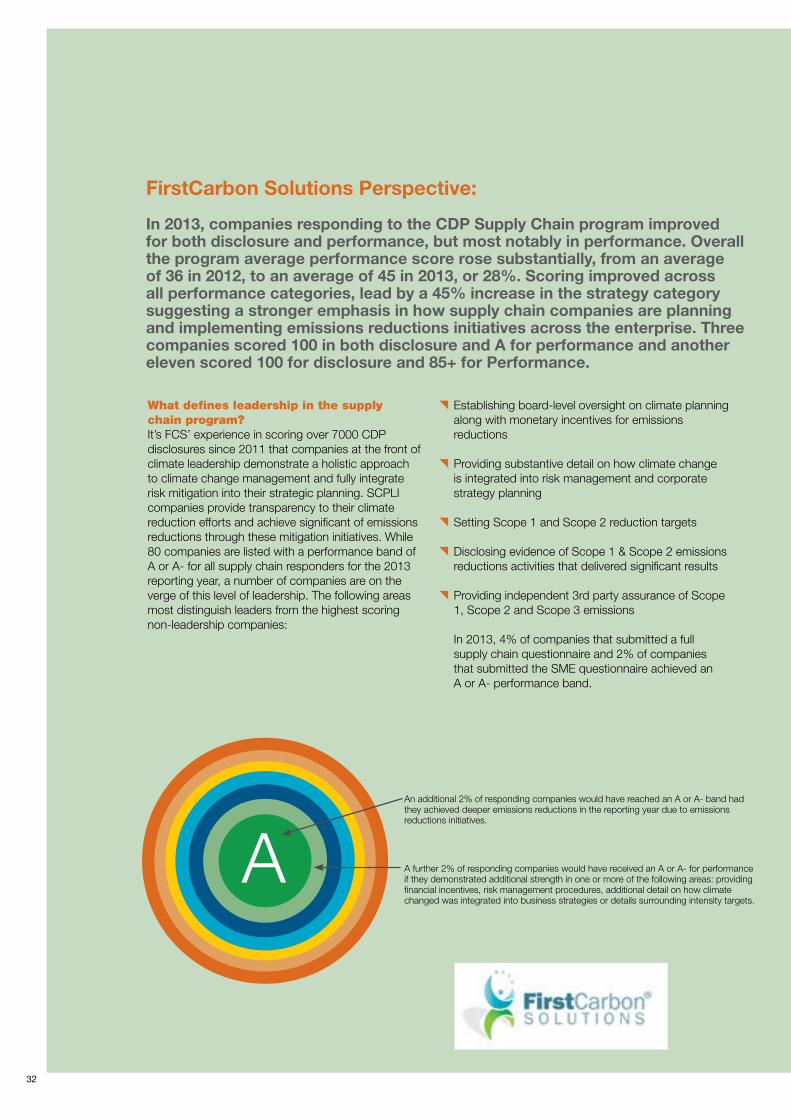
32
FirstCarbon Solutions Perspective:
In 2013, companies responding to the CDP Supply Chain program improved for both disclosure and performance, but most notably in performance. Overall the program average performance score rose substantially, from an average of 36 in 2012, to an average of 45 in 2013, or 28%. Scoring improved across all performance categories, lead by a 45% increase in the strategy category suggesting a stronger emphasis in how supply chain companies are planning and implementing emissions reductions initiatives across the enterprise. Three companies scored 100 in both disclosure and A for performance and another eleven scored 100 for disclosure and 85+ for Performance.
What defines leadership in the supply chain program?It’s FCS’ experience in scoring over 7000 CDP disclosures since 2011 that companies at the front of climate leadership demonstrate a holistic approach to climate change management and fully integrate risk mitigation into their strategic planning. SCPLI companies provide transparency to their climate reduction efforts and achieve significant of emissions reductions through these mitigation initiatives. While 80 companies are listed with a performance band of A or A- for all supply chain responders for the 2013 reporting year, a number of companies are on the verge of this level of leadership. The following areas most distinguish leaders from the highest scoring non-leadership companies:
An additional 2% of responding companies would have reached an A or A- band had they achieved deeper emissions reductions in the reporting year due to emissions reductions initiatives.
A further 2% of responding companies would have received an A or A- for performance if they demonstrated additional strength in one or more of the following areas: providing financial incentives, risk management procedures, additional detail on how climate changed was integrated into business strategies or details surrounding intensity targets.
A
{ Establishing board-level oversight on climate planning along with monetary incentives for emissions reductions
{ Providing substantive detail on how climate change is integrated into risk management and corporate strategy planning
{ Setting Scope 1 and Scope 2 reduction targets
{ Disclosing evidence of Scope 1 & Scope 2 emissions reductions activities that delivered significant results
{ Providing independent 3rd party assurance of Scope 1, Scope 2 and Scope 3 emissions
In 2013, 4% of companies that submitted a full supply chain questionnaire and 2% of companies that submitted the SME questionnaire achieved an A or A- performance band.
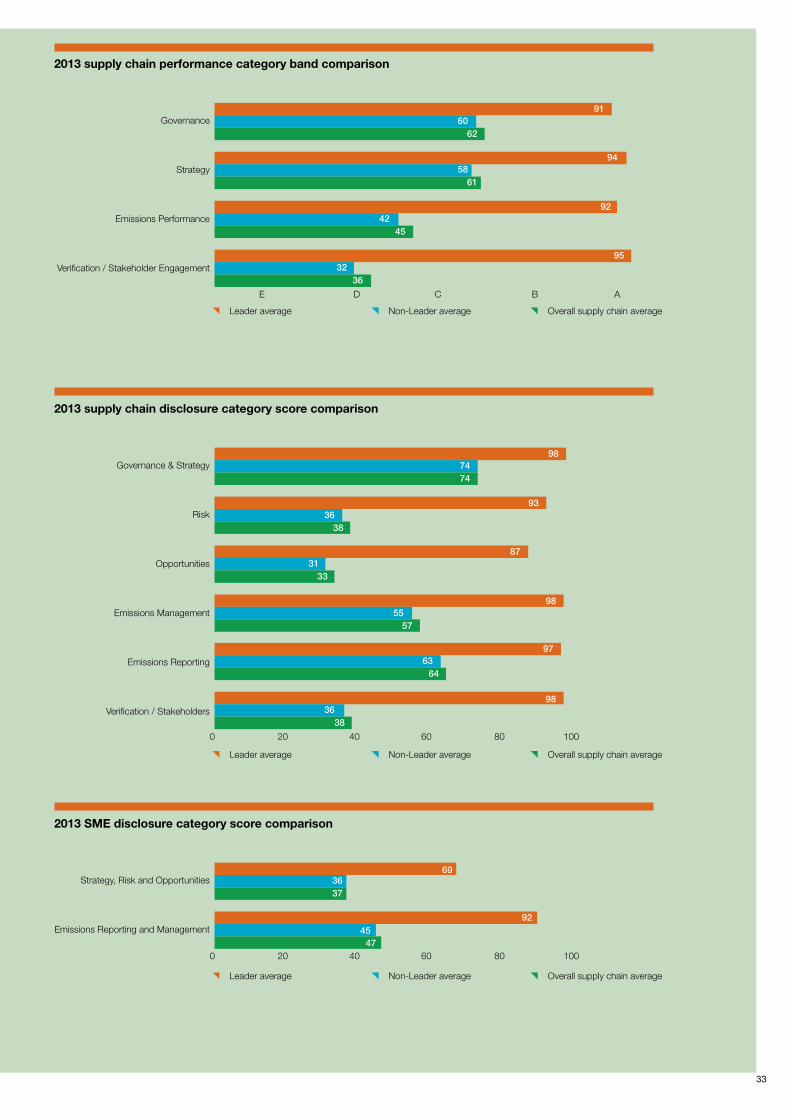
33
2013 supply chain performance category band comparison
2013 supply chain disclosure category score comparison
2013 SME disclosure category score comparison
Governance
Strategy
Emissions Performance
Verification / Stakeholder Engagement
Governance & Strategy
Risk
Opportunities
Emissions Management
Emissions Reporting
Verification / Stakeholders
Strategy, Risk and Opportunities
Emissions Reporting and Management
{Leader average {Non-Leader average {Overall supply chain average
{Leader average {Non-Leader average {Overall supply chain average
{Leader average {Non-Leader average {Overall supply chain average
E D C B A
0 20 40 60 80 100
0 20 40 60 80 100
693637
9245
47
91
94
92
95
60
58
42
32
62
61
45
36
98
93
87
98
97
98
74
36
31
55
63
36
74
38
33
57
64
38
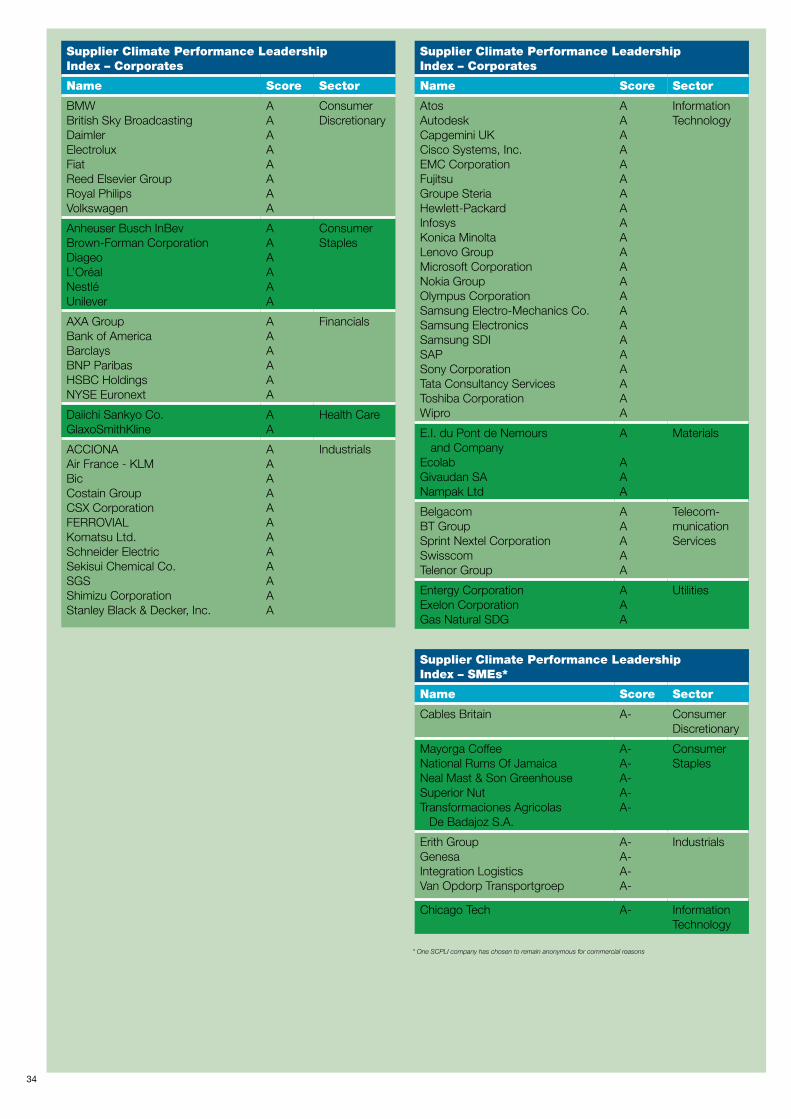
34
Supplier Climate Performance Leadership Index – Corporates
Name Score Sector
BMWBritish Sky BroadcastingDaimlerElectroluxFiatReed Elsevier GroupRoyal PhilipsVolkswagen
AAAAAAAA
Consumer Discretionary
Anheuser Busch InBevBrown-Forman CorporationDiageoL’OréalNestléUnilever
AAAAAA
Consumer Staples
AXA GroupBank of AmericaBarclaysBNP ParibasHSBC HoldingsNYSE Euronext
AAAAAA
Financials
Daiichi Sankyo Co.GlaxoSmithKline
AA
Health Care
ACCIONAAir France - KLMBicCostain GroupCSX CorporationFERROVIALKomatsu Ltd.Schneider ElectricSekisui Chemical Co.SGSShimizu CorporationStanley Black & Decker, Inc.
AAAAAAAAAAAA
Industrials
Supplier Climate Performance Leadership Index – Corporates
Name Score Sector
AtosAutodeskCapgemini UKCisco Systems, Inc.EMC CorporationFujitsuGroupe SteriaHewlett-PackardInfosysKonica MinoltaLenovo GroupMicrosoft CorporationNokia GroupOlympus CorporationSamsung Electro-Mechanics Co.Samsung ElectronicsSamsung SDISAPSony CorporationTata Consultancy ServicesToshiba CorporationWipro
AAAAAAAAAAAAAAAAAAAAAA
Information Technology
E.I. du Pont de Nemours and Company
EcolabGivaudan SANampak Ltd
A
AAA
Materials
BelgacomBT GroupSprint Nextel CorporationSwisscomTelenor Group
AAAAA
Telecom-munication Services
Entergy CorporationExelon CorporationGas Natural SDG
AAA
Utilities
Supplier Climate Performance Leadership Index – SMEs*
Name Score Sector
Cables Britain A- Consumer Discretionary
Mayorga CoffeeNational Rums Of JamaicaNeal Mast & Son GreenhouseSuperior NutTransformaciones Agricolas
De Badajoz S.A.
A-A-A-A-A-
Consumer Staples
Erith GroupGenesaIntegration LogisticsVan Opdorp Transportgroep
A-A-A-A-
Industrials
Chicago Tech A- Information Technology
* One SCPLI company has chosen to remain anonymous for commercial reasons
35
www.bicyclebutter.com
Typesetter Printing
CDP Supply Chain Lead Members 2013
CDP would like to thank the members and responding companies interviewed during the research for this report, The World Business Council for Sustainable Development (WBCSD), World Resources Institute (WRI), The World Bank, The Carbon Trust, The United Kingdom Foreign & Commonwealth Office, The Ministry of Finance of the Government of the People’s Republic of China, NorthStar Initiative for Sustainable Enterprise at the University of Minnesota and The Institute for Industrial Productivity.
This first phase of Action Exchange has been made possible by the generous support of ClimateWorks Foundation and Energy Foundation. Our sincere thanks are also extended to Tom Rivett-Carnac and the Accenture report writing team of Aditya Sharma, Paras Mehta, Pushkar Potdar and Avinash Kabilan. Accenture would like to thank Robert McNamara, Scott Egler, Mark Nicholls, Salil Sreen, Mrinal Pareek, Nikita Mathur and Joydeep Mukherjee for their valuable contributions towards developing this report.
Report Writer
Acknowledgements
Scoring Partner

CDP Contacts
Paul DickinsonExecutive Chairman
Paul SimpsonChief Executive Officer
Frances WayCo-Chief Operating Officer Dexter GalvinHead of CDP’s Supply Chain Program
Sonya Bhonsle Director, Supply Chain Program
Melanie WilnederSupply Chain Program, Europe
Laura StoneSupply Chain Program, Europe
Graham HamleySupply Chain Program, Europe
Chrystina Gastelum Supply Chain Program, North America
Betty CremminsSupply Chain Program, North America
Sarah MurphySupply Chain Program, North America
Andreia BanheSupply Chain Program, Latin America
Mari MugurajimaSupply Chain Program, Japan
Jasmine ZhangSupply Chain Program, China
CDP Board of Trustees
Chairman: Alan BrownSchroders
James CameronClimate Change Capital
Ben GoldsmithWHEB Group
Chris PageRockefeller Philanthropy Advisors
Dr. Christoph SchroederTVM Capital
Jeremy SmithBerkeley Energy
Takejiro Sueyoshi
Tessa TennantThe Ice Organisation
Martin WiseRelationship Capital Partners
CDP132 Crosby Street, 8th Floor New York, NY 10012Tel: +1 (212) 378 2086https://www.cdp.net
Report Writer Contacts
Accenture1345 Avenue of the AmericasNew York, NY 10105United States+1 (917) 452 4400
Bruno BerthonManaging Director, Accenture Global Sustainability [email protected]+33 1-53235694
Gary L. HanifanManaging Director, Accenture Global Sustainable Supply Chain [email protected]+1 (503) 819-0964
Justin KeebleManaging Director, Accenture Sustainability [email protected]+44 (0) 20-3335-0682
Ganesan RamachandranManaging Director, Global Sustainable Supply Chain [email protected]+91 9971144250
Aditya Sharma, MS, PEOperational Director, Accenture Global Sustainable Supply Chain [email protected]+1 (917) 856 9353
CDP40 Bowling Green LaneLondon, EC1R 0NEUnited KingdomTel: +44 (0) 20 7970 [email protected]
This document is intended for general informational purposes only and does not take into account the reader’s specific circumstances, and may not reflect the most current developments. Accenture & CDP disclaim, to the fullest extent permitted by applicable law, any and all liability for the accuracy and completeness of the information in this document and for any acts or omissions made based on such information. Accenture & CDP do not provide legal, regulatory, audit, or tax advice. Readers are responsible for obtaining such advice from their own legal counsel or other licensed professionals
CDP 2014This report and all of the public responses from corporations are available for download from www.cdp.net