Embed Size (px)
Citation preview
0 icfi.com/aviation |
BUSINESS AVIATION OUTLOOK
18 March 2014
Prepared for:
Revised: 11 March am
1 icfi.com/aviation |
Agenda
North American Business & General Aviation
Market Trends
Outlook for Recovery
Market Structure
Cyclical vs. Structural Factors
Independent Forecast
2 icfi.com/aviation |
Highlights
Revenue focus on North America 1 Trends were skewed by the fractional bubble 2
Performance is a tale of two markets 3 Fundamentals remain fundamental 4
Business investment is a key driver 5 The forecast is for recovery 6
3 icfi.com/aviation | 3
MARKET OVERVIEW
4 icfi.com/aviation |
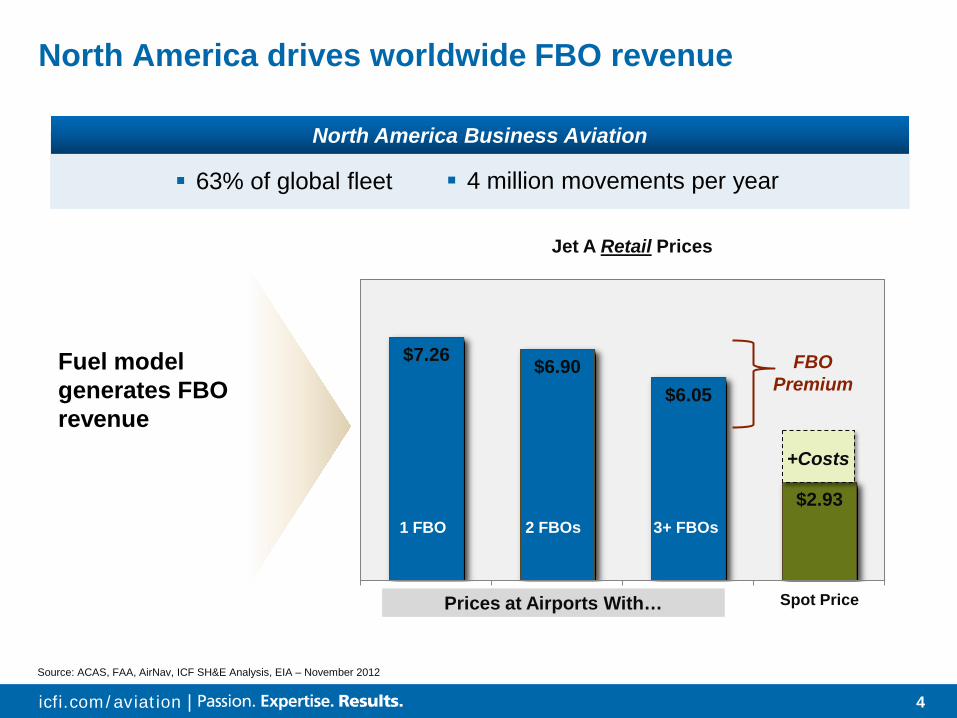
North America drives worldwide FBO revenue
Source: ACAS, FAA, AirNav, ICF SH&E Analysis, EIA – November 2012
$7.26 $6.90 $6.05
$2.93
1 FBO 2 FBOs 3+ FBOs Spot Price
Jet A Retail Prices
63% of global fleet
Prices at Airports With…
1 FBO 2 FBOs 3+ FBOs
FBO Premium
Fuel model generates FBO revenue
4 million movements per year
North America Business Aviation
+Costs
5 icfi.com/aviation |
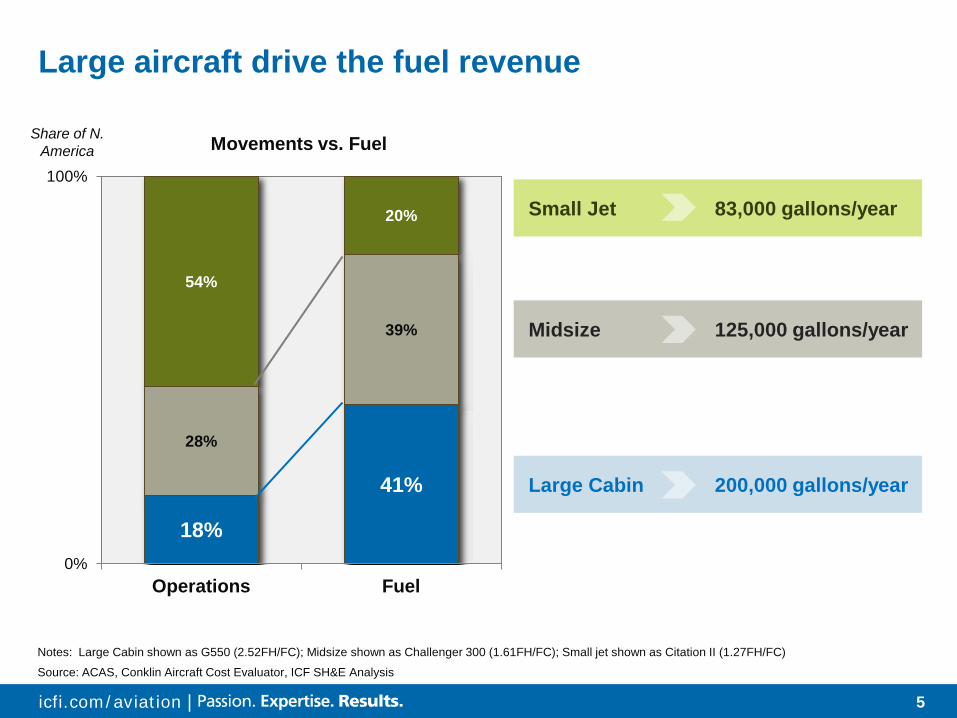
Large aircraft drive the fuel revenue
Movements vs. Fuel
18%
41%
28%
39%
54%
20%
0%
100%
Operations Fuel
Source: ACAS, Conklin Aircraft Cost Evaluator, ICF SH&E Analysis
Notes: Large Cabin shown as G550 (2.52FH/FC); Midsize shown as Challenger 300 (1.61FH/FC); Small jet shown as Citation II (1.27FH/FC)
Share of N. America
Large Cabin 200,000 gallons/year
Midsize 125,000 gallons/year
Small Jet 83,000 gallons/year
6 icfi.com/aviation |
$0
$5
$10
$15
$20
$25
0
250
500
750
1,000
1990 1995 2000 2005 2010
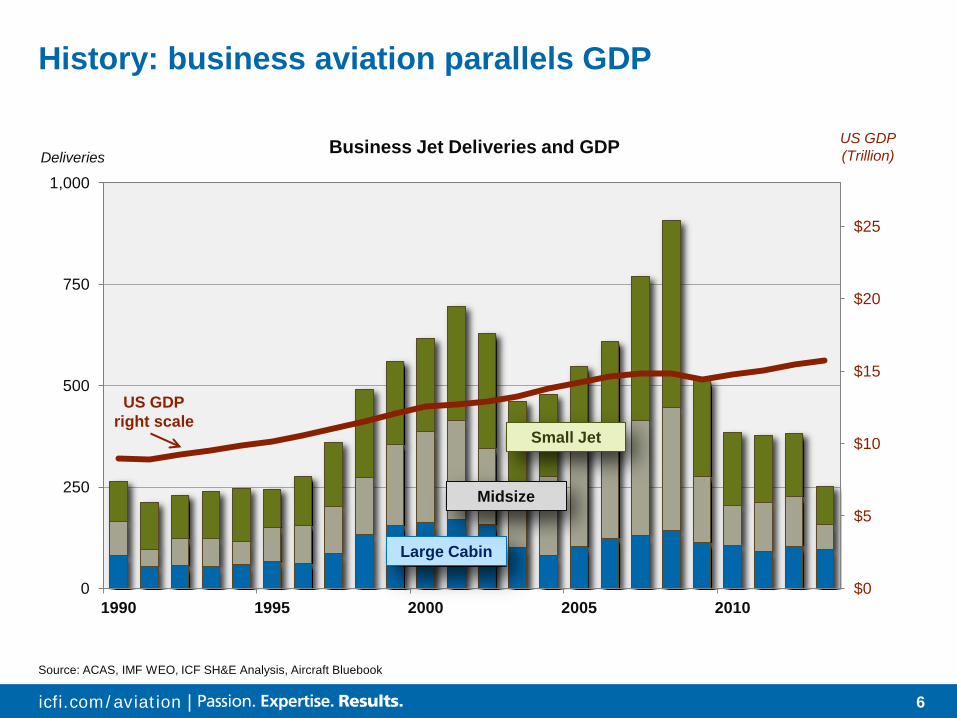
History: business aviation parallels GDP
US GDP (Trillion)
US GDP right scale
Large Cabin
Midsize
Small Jet
Source: ACAS, IMF WEO, ICF SH&E Analysis, Aircraft Bluebook
Business Jet Deliveries and GDP Deliveries
7 icfi.com/aviation |
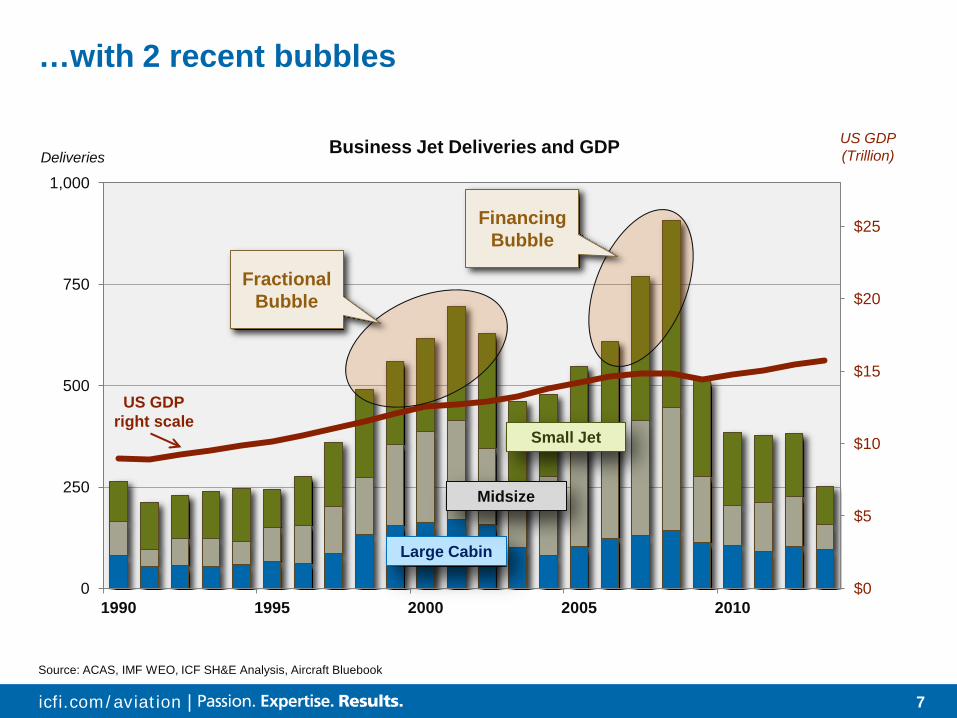
…with 2 recent bubbles
$0
$5
$10
$15
$20
$25
0
250
500
750
1,000
1990 1995 2000 2005 2010
US GDP (Trillion)
US GDP right scale
Large Cabin
Midsize
Small Jet
Source: ACAS, IMF WEO, ICF SH&E Analysis, Aircraft Bluebook
Business Jet Deliveries and GDP Deliveries
Fractional Bubble
FinancingBubble
8 icfi.com/aviation |
0
2,000
4,000
6,000
8,000
10,000
12,000
0
250
500
750
1,000
1990 1995 2000 2005 2010
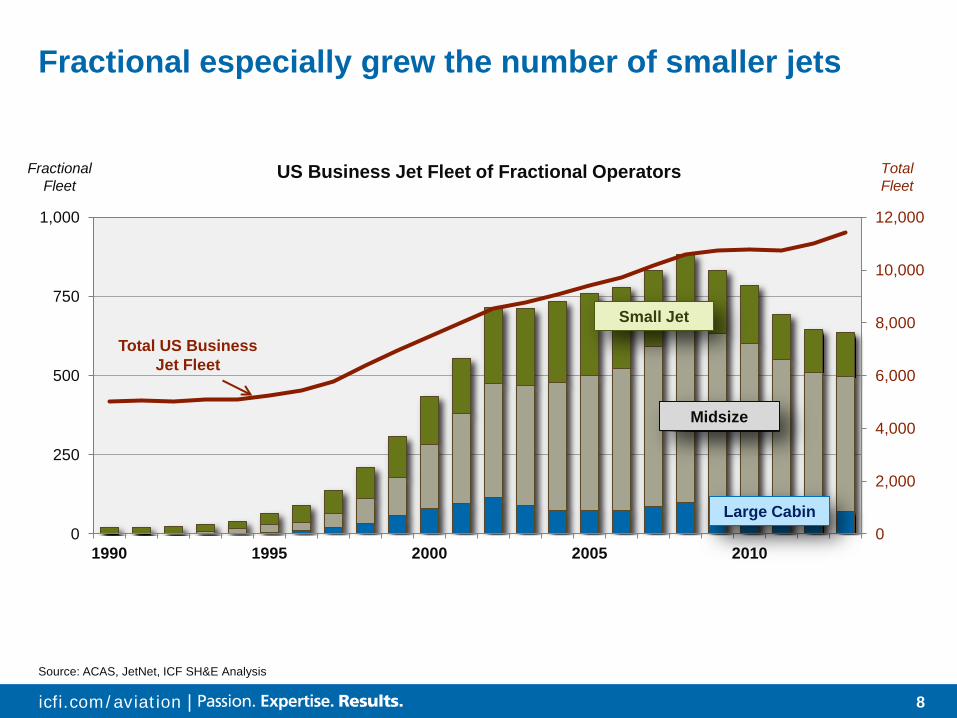
Fractional especially grew the number of smaller jets
Source: ACAS, JetNet, ICF SH&E Analysis
Fractional Fleet
US Business Jet Fleet of Fractional Operators
Large Cabin
Midsize
Small Jet
Total Fleet
Total US Business Jet Fleet
9 icfi.com/aviation |
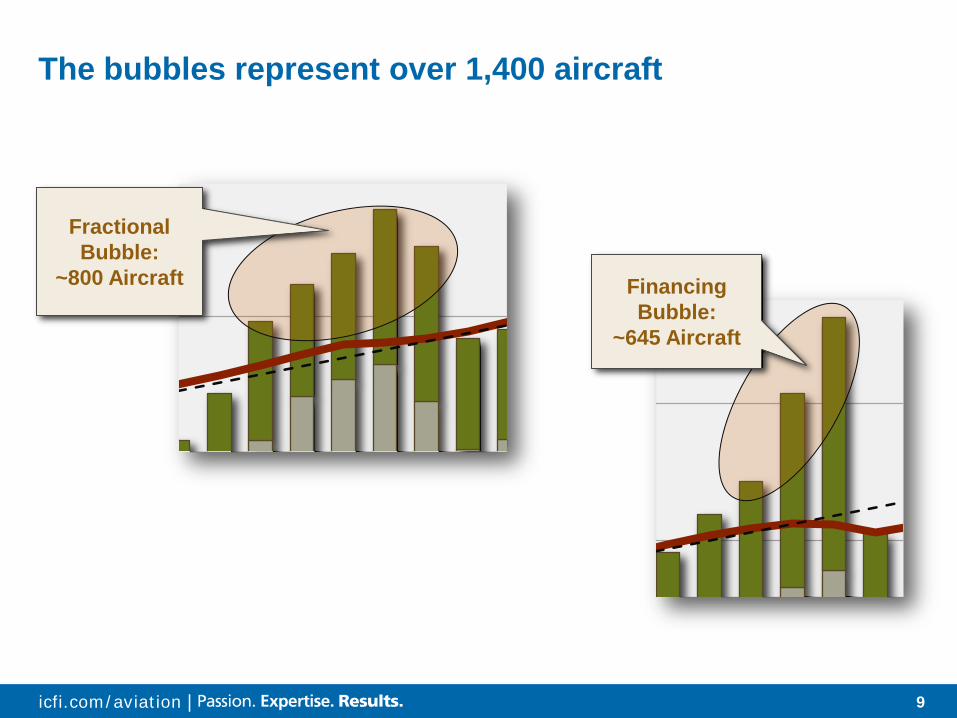
Fractional Bubble:
~800 Aircraft Financing Bubble:
~645 Aircraft
The bubbles represent over 1,400 aircraft

10 icfi.com/aviation |
The fractional model is evolving
Fractional disruption as OEMs question value and independents struggle
• Bombardier Flexjet sold to owner of Flight Options • Cessna (CitationShares) exits • Avantair exits
Underlying demand moves into other branded charter • Operated by the traditional fractionals • Or new ventures, such as VistaJet, XOJet
Weaker fractionals reduces operator concentration and reduces their pricing power
11 icfi.com/aviation |
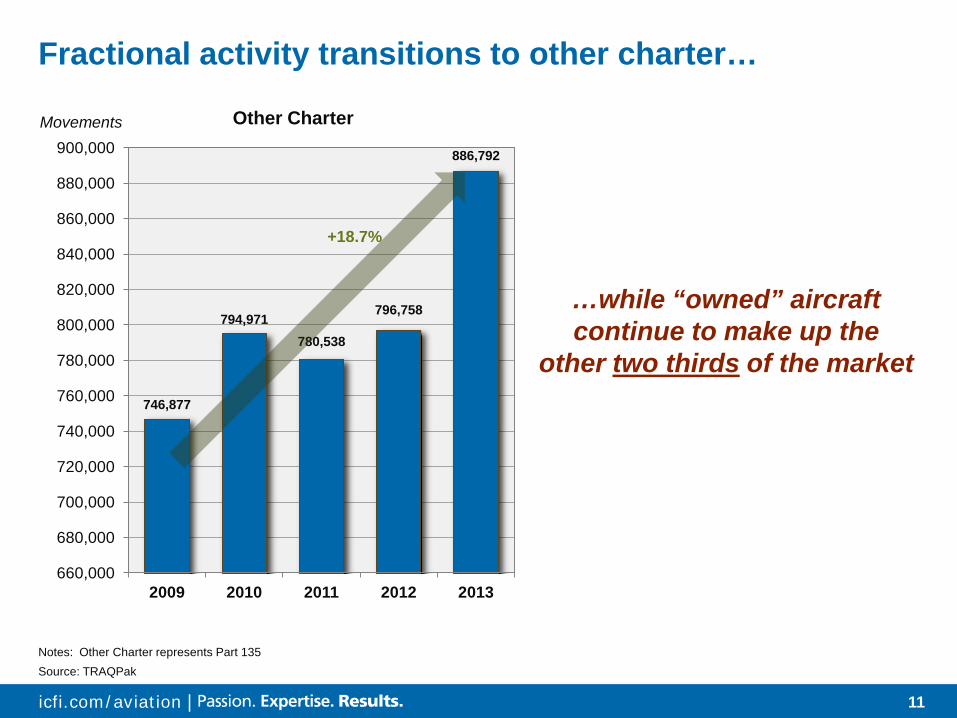
Fractional activity transitions to other charter…
746,877
794,971 780,538
796,758
886,792
660,000
680,000
700,000
720,000
740,000
760,000
780,000
800,000
820,000
840,000
860,000
880,000
900,000
2009 2010 2011 2012 2013
+18.7%
Other Charter
Source: TRAQPak Notes: Other Charter represents Part 135
…while “owned” aircraft continue to make up the
other two thirds of the market
Movements

12 icfi.com/aviation | 12
TRENDS
13 icfi.com/aviation |
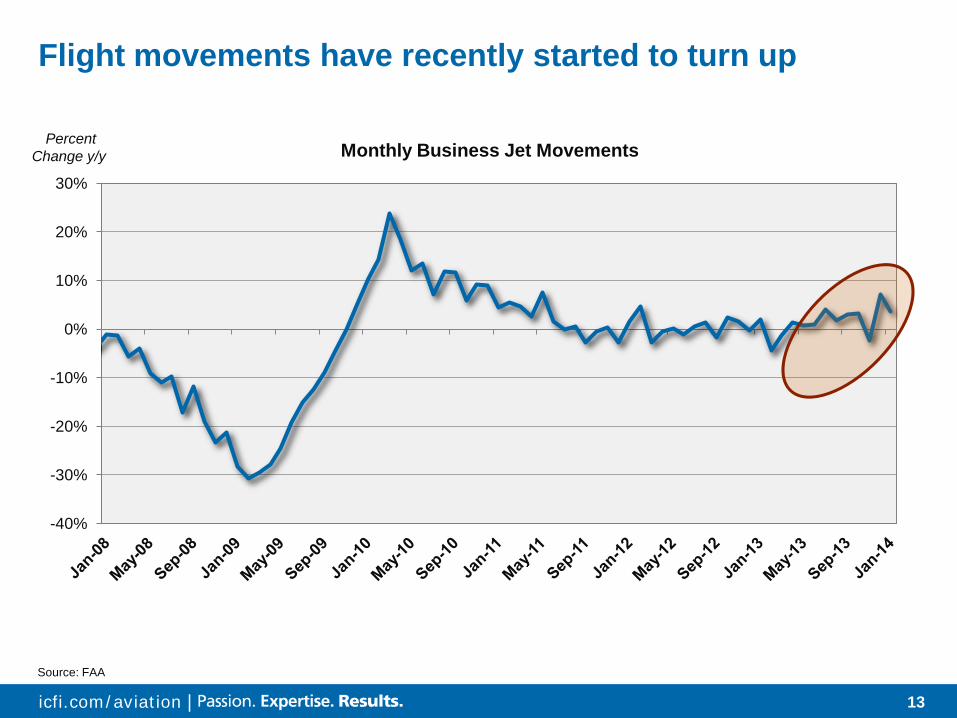
Flight movements have recently started to turn up
-40%
-30%
-20%
-10%
0%
10%
20%
30%
Monthly Business Jet Movements
Source: FAA
Percent Change y/y
14 icfi.com/aviation |
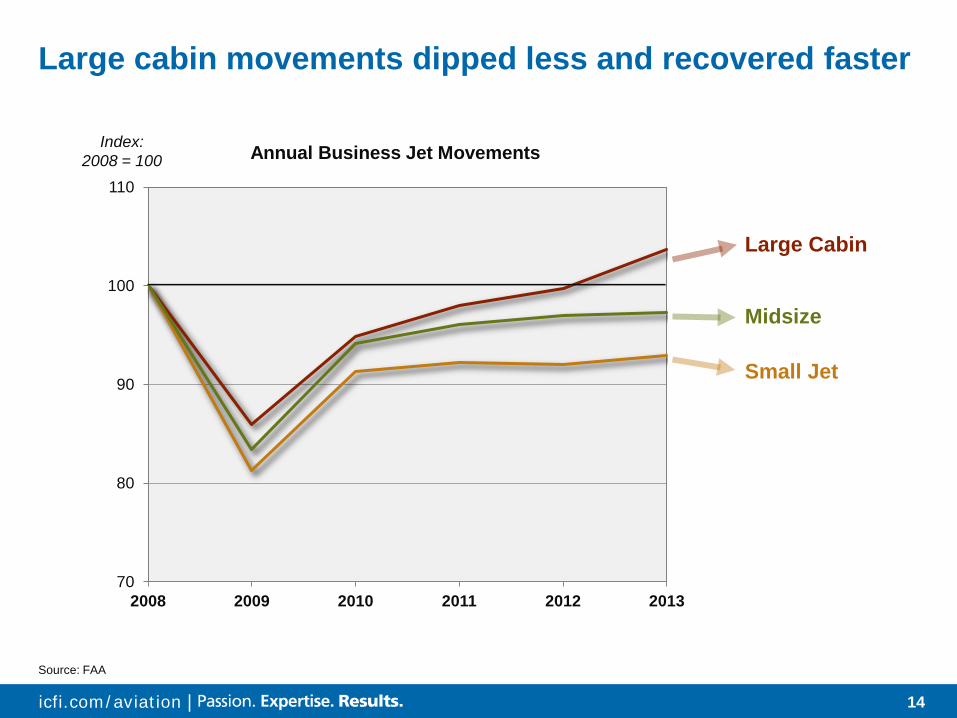
Large cabin movements dipped less and recovered faster
70
80
90
100
110
2008 2009 2010 2011 2012 2013
Large Cabin
Midsize
Source: FAA
Small Jet
Index: 2008 = 100 Annual Business Jet Movements
15 icfi.com/aviation |
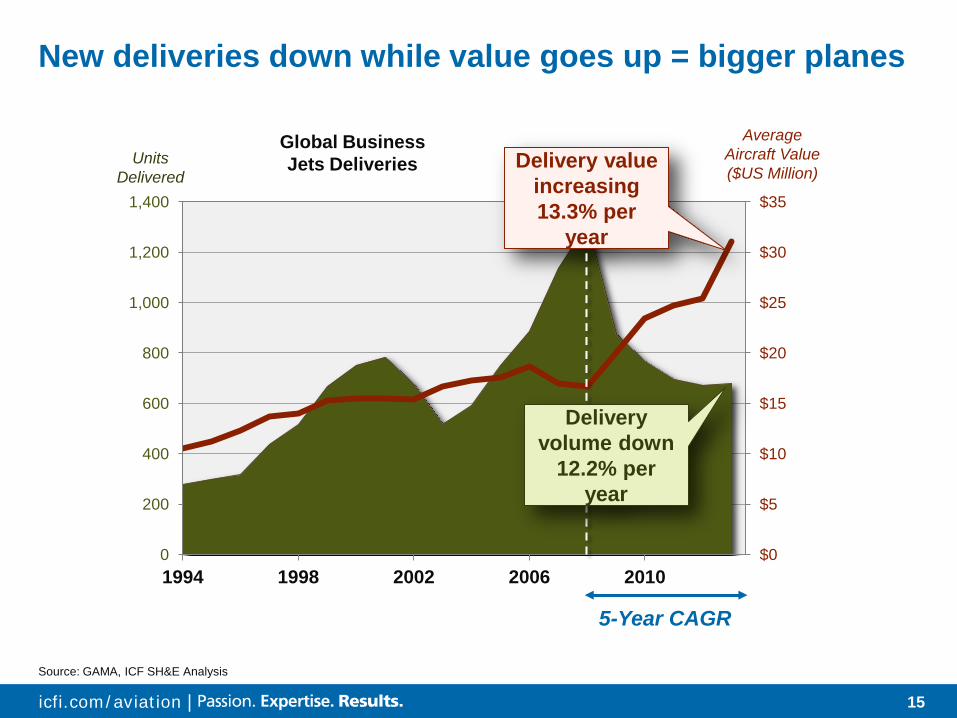
New deliveries down while value goes up = bigger planes
$0
$5
$10
$15
$20
$25
$30
$35
0
200
400
600
800
1,000
1,200
1,400
1994 1998 2002 2006 2010
Units Delivered
Average Aircraft Value ($US Million)
5-Year CAGR
Delivery value increasing 13.3% per
year
Delivery volume down
12.2% per year
Global Business Jets Deliveries
Source: GAMA, ICF SH&E Analysis

16 icfi.com/aviation | 16
OUTLOOK
17 icfi.com/aviation |
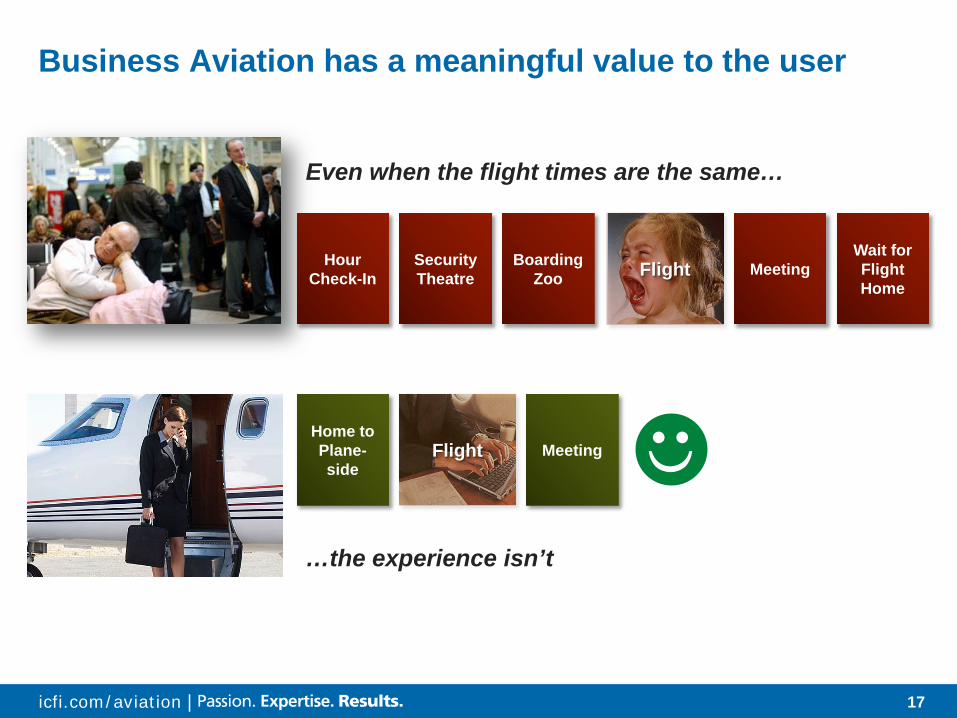
Flight
Business Aviation has a meaningful value to the user
Even when the flight times are the same…
Hour Check-In
Security Theatre
Boarding Zoo Flight
Home to Plane-side
Meeting
Meeting Wait for Flight Home
…the experience isn’t
18 icfi.com/aviation |
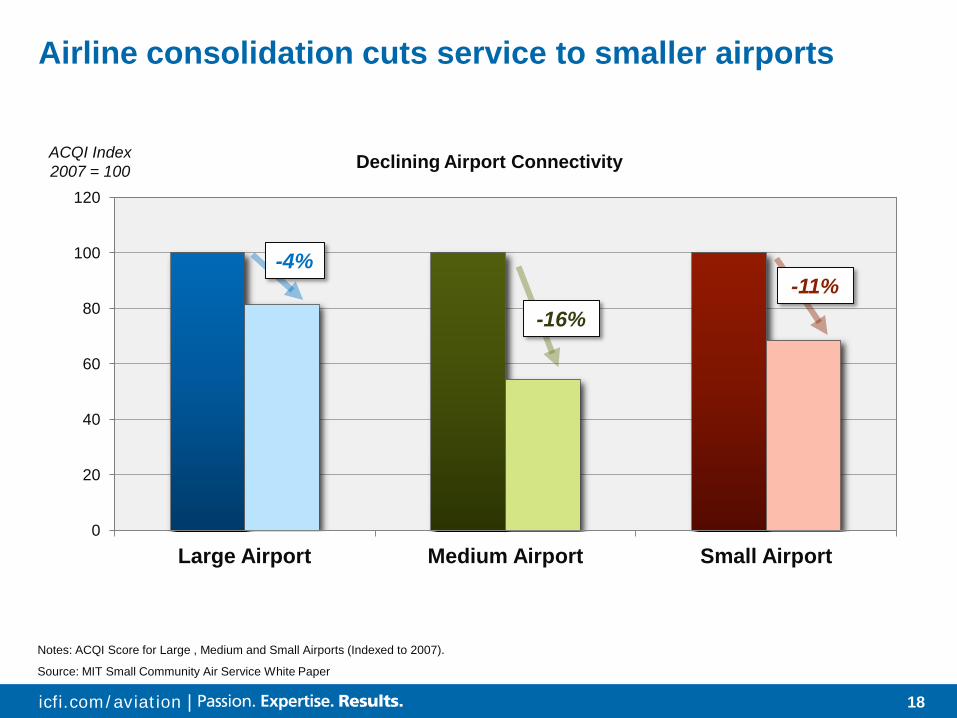
Airline consolidation cuts service to smaller airports
Source: MIT Small Community Air Service White Paper
0
20
40
60
80
100
120
Large Airport Medium Airport Small Airport
Declining Airport Connectivity
Notes: ACQI Score for Large , Medium and Small Airports (Indexed to 2007).
ACQI Index 2007 = 100
-4%
-16% -11%
19 icfi.com/aviation |
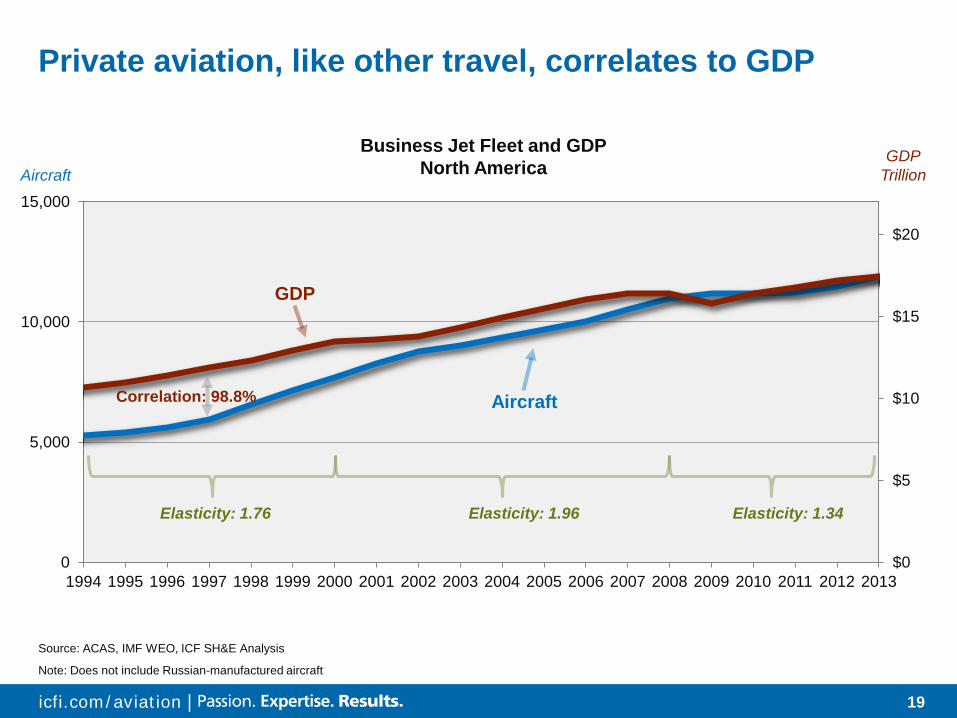
Private aviation, like other travel, correlates to GDP
$0
$5
$10
$15
$20
0
5,000
10,000
15,000
1994 1995 1996 1997 1998 1999 2000 2001 2002 2003 2004 2005 2006 2007 2008 2009 2010 2011 2012 2013
Aircraft GDP
Trillion
Note: Does not include Russian-manufactured aircraft
Source: ACAS, IMF WEO, ICF SH&E Analysis
Business Jet Fleet and GDP North America
Aircraft
GDP
Correlation: 98.8%
Elasticity: 1.96 Elasticity: 1.34 Elasticity: 1.76
20 icfi.com/aviation |
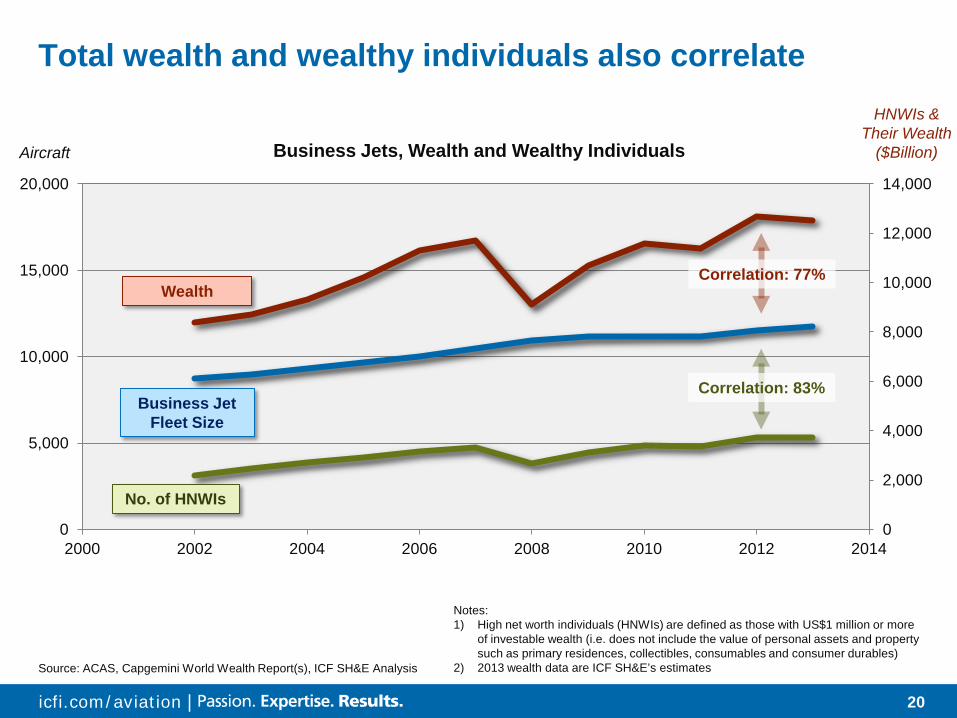
Total wealth and wealthy individuals also correlate
0
5,000
10,000
15,000
20,000
2000 2002 2004 2006 2008 2010 2012 2014 0
2,000
4,000
6,000
8,000
10,000
12,000
14,000
Aircraft
HNWIs & Their Wealth
($Billion)
Source: ACAS, Capgemini World Wealth Report(s), ICF SH&E Analysis
Wealth
Business Jet Fleet Size
No. of HNWIs
Notes: 1) High net worth individuals (HNWIs) are defined as those with US$1 million or more
of investable wealth (i.e. does not include the value of personal assets and property such as primary residences, collectibles, consumables and consumer durables)
2) 2013 wealth data are ICF SH&E’s estimates
Business Jets, Wealth and Wealthy Individuals
Correlation: 77%
Correlation: 83%
21 icfi.com/aviation |
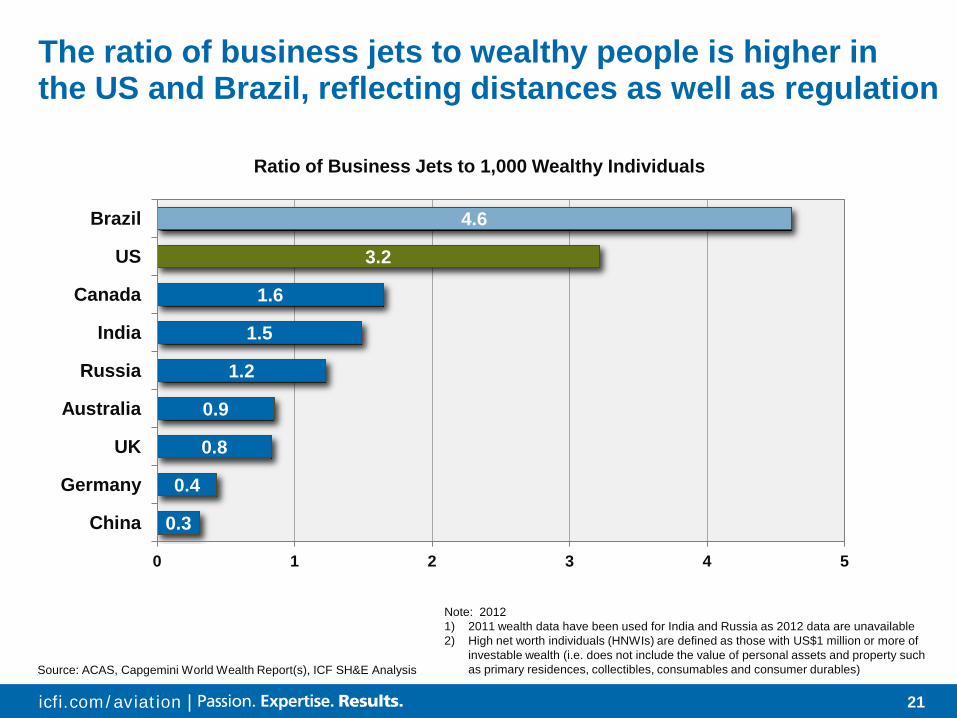
The ratio of business jets to wealthy people is higher in the US and Brazil, reflecting distances as well as regulation
0.3
0.4
0.8
0.9
1.2
1.5
1.6
3.2
4.6
0 1 2 3 4 5
China
Germany
UK
Australia
Russia
India
Canada
US
Brazil
Note: 2012 1) 2011 wealth data have been used for India and Russia as 2012 data are unavailable 2) High net worth individuals (HNWIs) are defined as those with US$1 million or more of
investable wealth (i.e. does not include the value of personal assets and property such as primary residences, collectibles, consumables and consumer durables) Source: ACAS, Capgemini World Wealth Report(s), ICF SH&E Analysis
Ratio of Business Jets to 1,000 Wealthy Individuals
22 icfi.com/aviation |
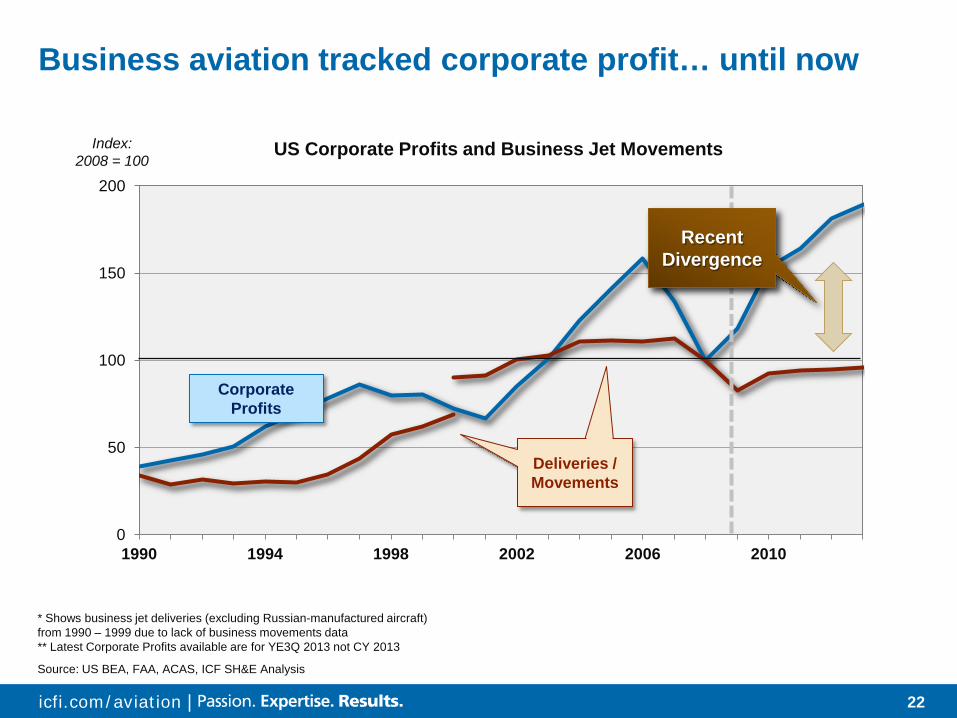
Business aviation tracked corporate profit… until now
Source: US BEA, FAA, ACAS, ICF SH&E Analysis
0
50
100
150
200
1990 1994 1998 2002 2006 2010
Index: 2008 = 100
Corporate Profits
US Corporate Profits and Business Jet Movements
Recent Divergence
* Shows business jet deliveries (excluding Russian-manufactured aircraft) from 1990 – 1999 due to lack of business movements data ** Latest Corporate Profits available are for YE3Q 2013 not CY 2013
Deliveries / Movements
23 icfi.com/aviation |
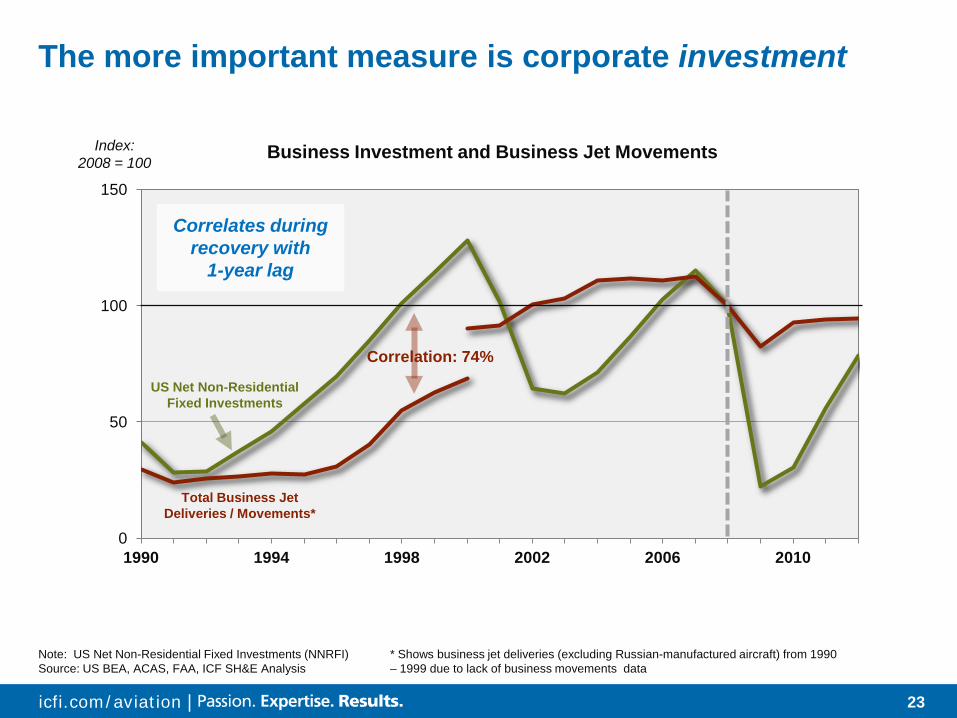
The more important measure is corporate investment
* Shows business jet deliveries (excluding Russian-manufactured aircraft) from 1990 – 1999 due to lack of business movements data
Note: US Net Non-Residential Fixed Investments (NNRFI) Source: US BEA, ACAS, FAA, ICF SH&E Analysis
0
50
100
150
1990 1994 1998 2002 2006 2010
Total Business Jet Deliveries / Movements*
US Net Non-Residential Fixed Investments
Index: 2008 = 100
Correlation: 74%
Business Investment and Business Jet Movements
Correlates during recovery with
1-year lag
24 icfi.com/aviation |
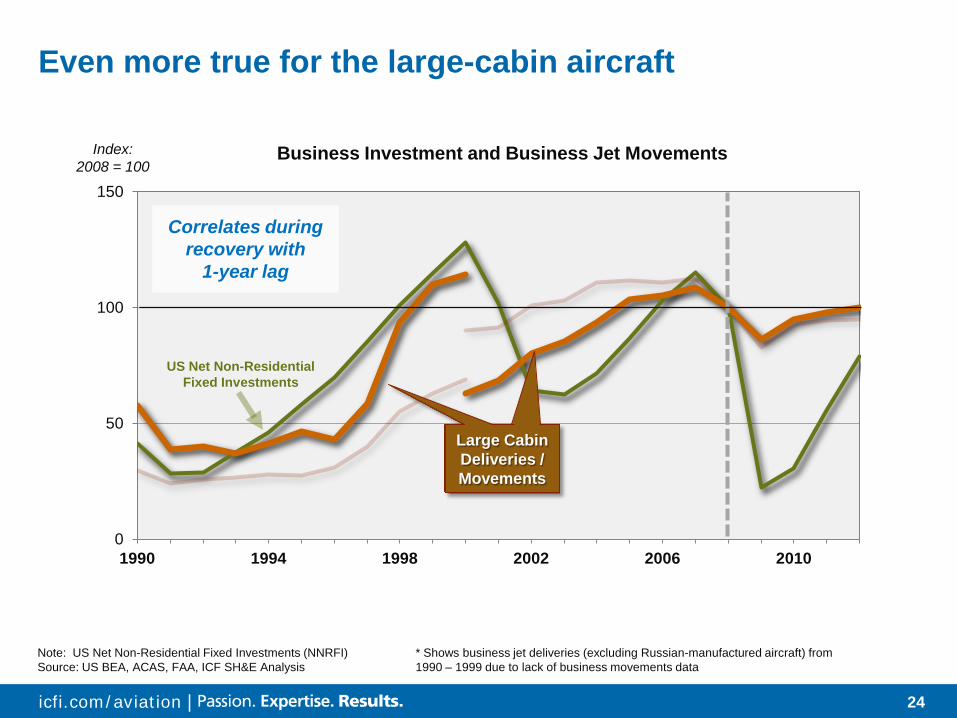
Even more true for the large-cabin aircraft
0
50
100
150
1990 1994 1998 2002 2006 2010
Index: 2008 = 100
Business Investment and Business Jet Movements
US Net Non-Residential Fixed Investments
Correlates during recovery with
1-year lag
* Shows business jet deliveries (excluding Russian-manufactured aircraft) from 1990 – 1999 due to lack of business movements data
Note: US Net Non-Residential Fixed Investments (NNRFI) Source: US BEA, ACAS, FAA, ICF SH&E Analysis
Large Cabin Deliveries / Movements
25 icfi.com/aviation |
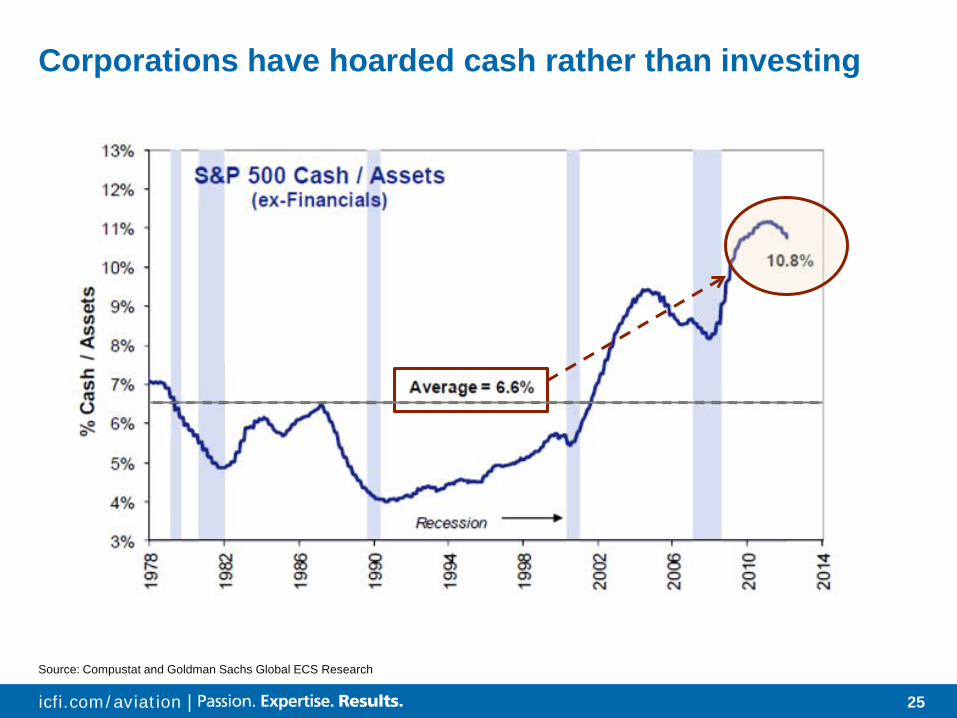
Corporations have hoarded cash rather than investing
Source: Compustat and Goldman Sachs Global ECS Research
26 icfi.com/aviation |
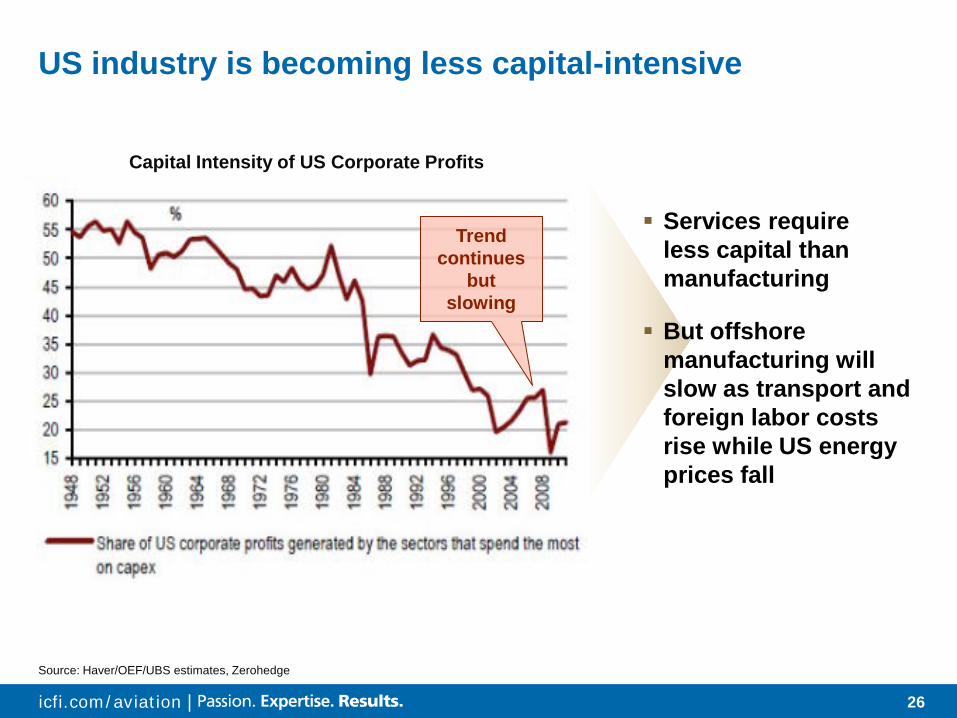
US industry is becoming less capital-intensive
Services require less capital than manufacturing
But offshore manufacturing will slow as transport and foreign labor costs rise while US energy prices fall
Trend continues
but slowing
Capital Intensity of US Corporate Profits
Source: Haver/OEF/UBS estimates, Zerohedge
27 icfi.com/aviation |
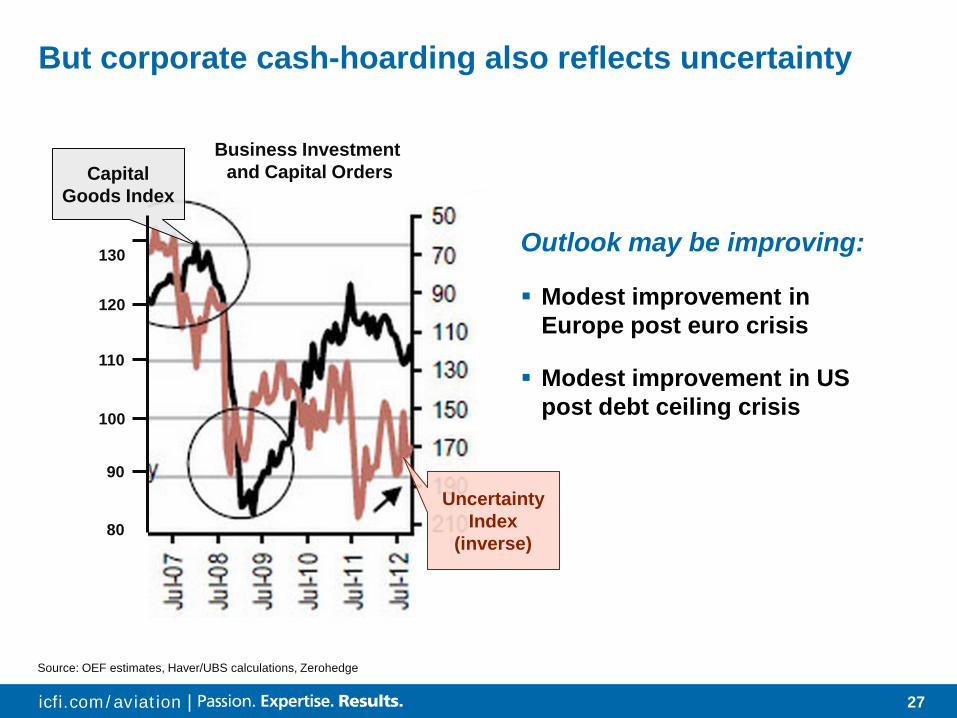
But corporate cash-hoarding also reflects uncertainty
Business Investment and Capital Orders Capital
Goods Index
Uncertainty Index
(inverse) 80
90
100
110
120
130 Outlook may be improving:
Modest improvement in Europe post euro crisis
Modest improvement in US post debt ceiling crisis
Source: OEF estimates, Haver/UBS calculations, Zerohedge

28 icfi.com/aviation | 28
FORECAST
29 icfi.com/aviation |
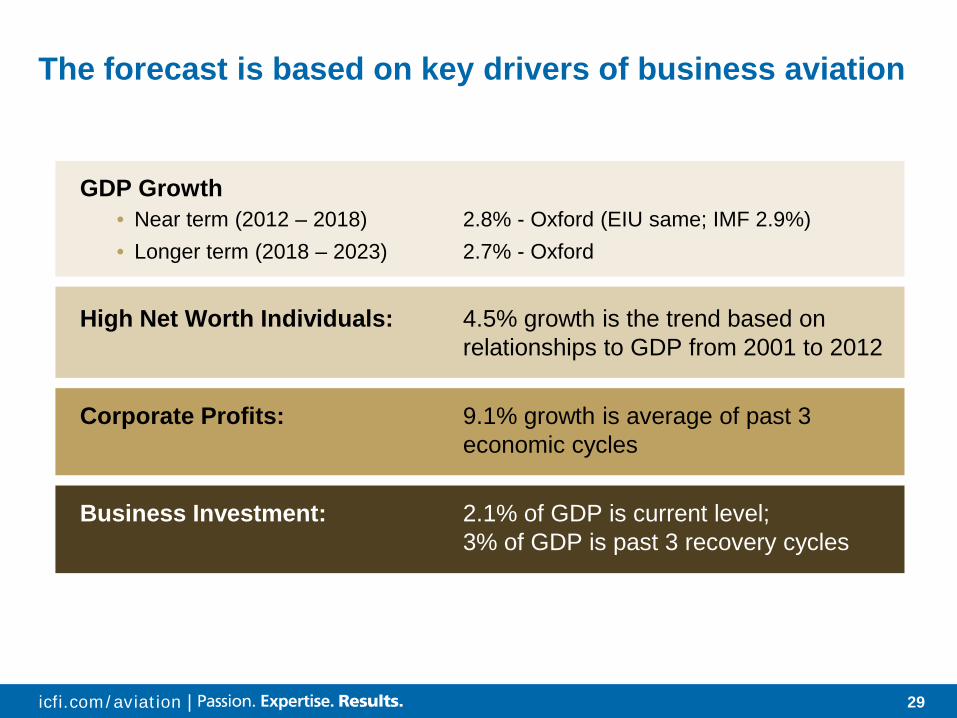
GDP Growth • Near term (2012 – 2018) 2.8% - Oxford (EIU same; IMF 2.9%) • Longer term (2018 – 2023) 2.7% - Oxford
High Net Worth Individuals: 4.5% growth is the trend based on relationships to GDP from 2001 to 2012
Corporate Profits: 9.1% growth is average of past 3 economic cycles
Business Investment: 2.1% of GDP is current level; 3% of GDP is past 3 recovery cycles
The forecast is based on key drivers of business aviation

30 icfi.com/aviation |
The base case assumes continuation of current trends
Scenario GDP HNWI Corp Profits Corp
Investment
2012-2018 2018-2023 2012-2023 2012-2023 2013-2023
Base 2.8% 2.7% 4.5% 9.1% 2.1% of GDP
31 icfi.com/aviation |
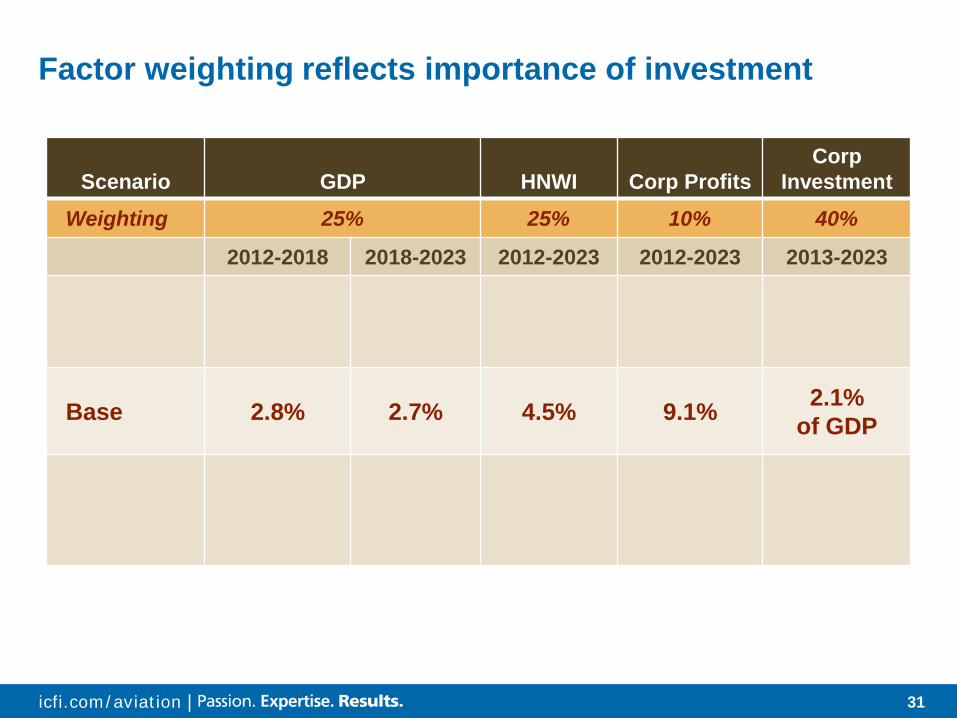
Factor weighting reflects importance of investment
Scenario GDP HNWI Corp Profits Corp
Investment
Weighting 25% 25% 10% 40%
2012-2018 2018-2023 2012-2023 2012-2023 2013-2023
Base 2.8% 2.7% 4.5% 9.1% 2.1% of GDP
32 icfi.com/aviation |
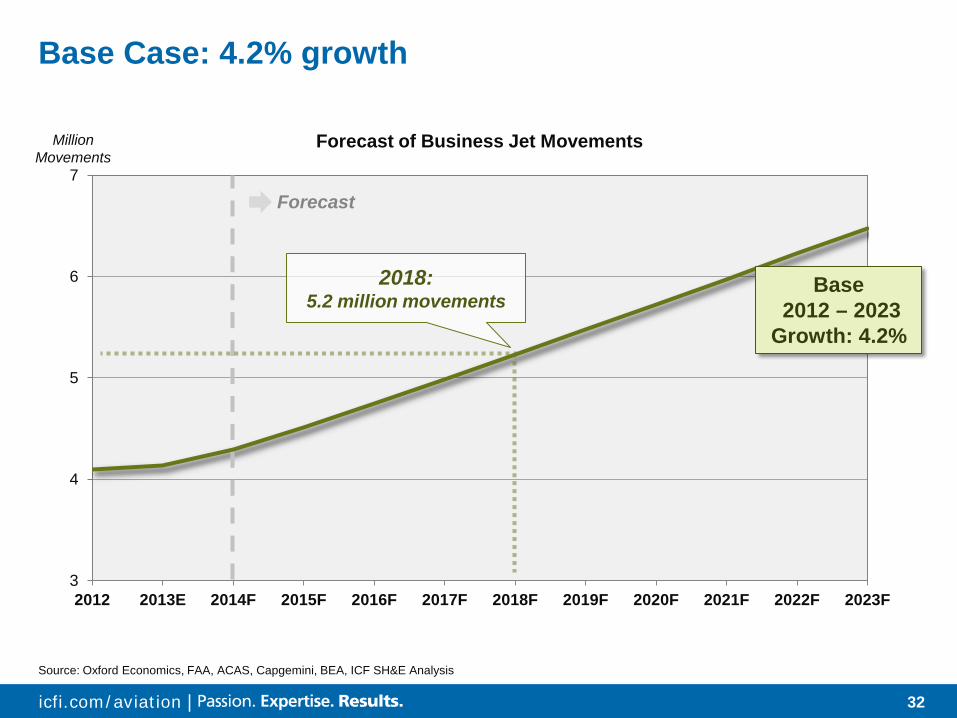
Base Case: 4.2% growth
Source: Oxford Economics, FAA, ACAS, Capgemini, BEA, ICF SH&E Analysis
3
4
5
6
7
2012 2013E 2014F 2015F 2016F 2017F 2018F 2019F 2020F 2021F 2022F 2023F
Million Movements
Forecast of Business Jet Movements
Forecast
Base 2012 – 2023 Growth: 4.2%
2018: 5.2 million movements
33 icfi.com/aviation |
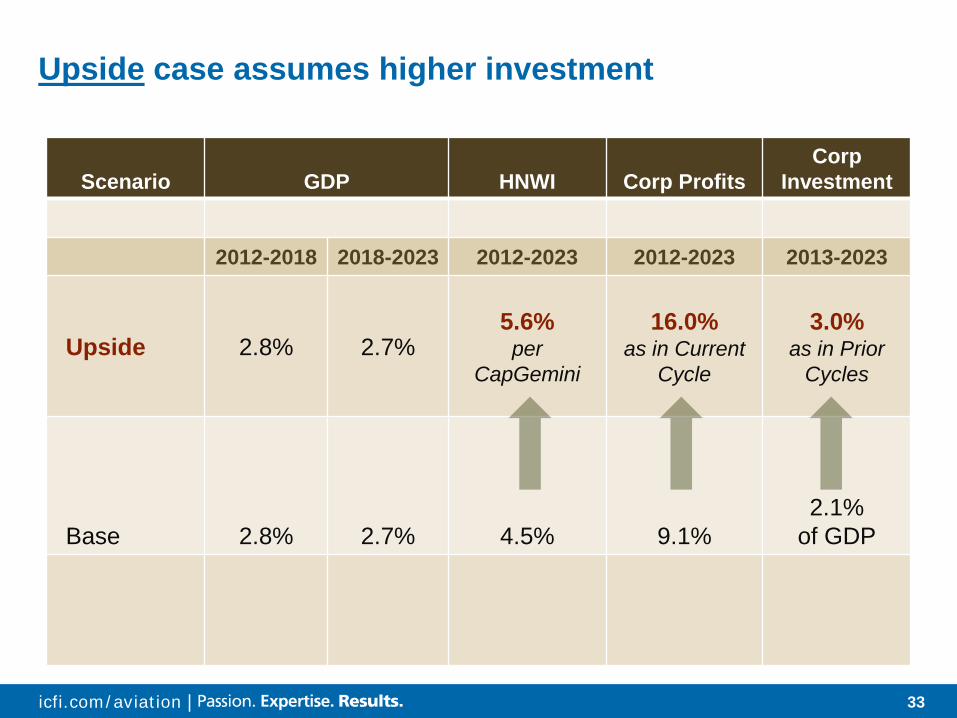
Upside case assumes higher investment
Scenario GDP HNWI Corp Profits Corp
Investment
2012-2018 2018-2023 2012-2023 2012-2023 2013-2023
Upside 2.8% 2.7% 5.6%
per CapGemini
16.0% as in Current
Cycle
3.0% as in Prior
Cycles
Base 2.8% 2.7% 4.5% 9.1% 2.1%
of GDP
34 icfi.com/aviation |
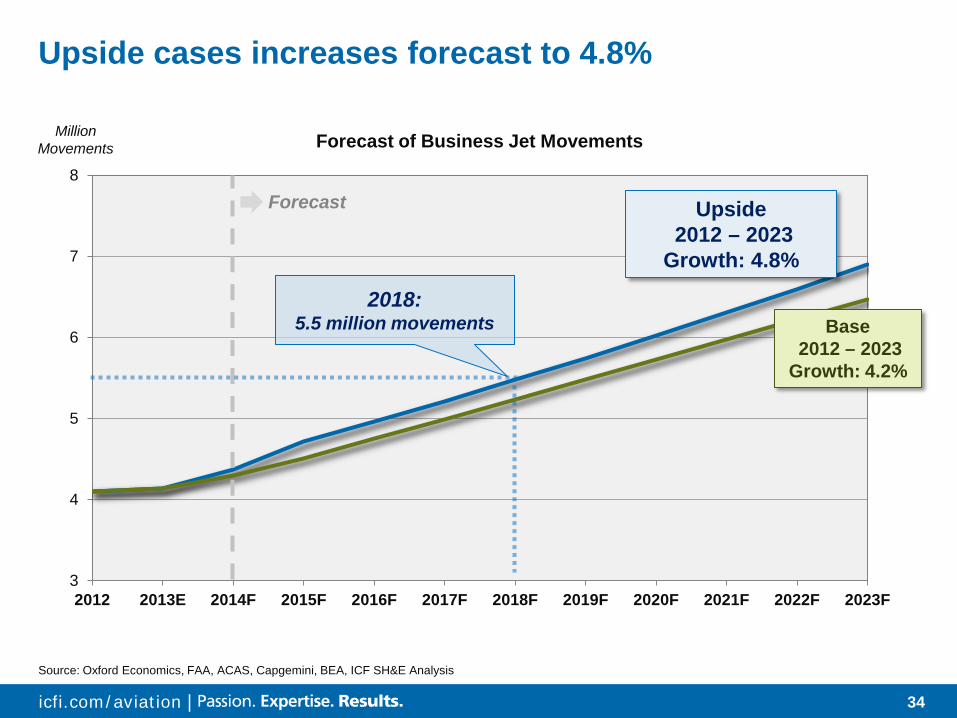
Upside cases increases forecast to 4.8%
Source: Oxford Economics, FAA, ACAS, Capgemini, BEA, ICF SH&E Analysis
3
4
5
6
7
8
2012 2013E 2014F 2015F 2016F 2017F 2018F 2019F 2020F 2021F 2022F 2023F
Million Movements Forecast of Business Jet Movements
Forecast Upside 2012 – 2023 Growth: 4.8%
Base 2012 – 2023 Growth: 4.2%
2018: 5.5 million movements
35 icfi.com/aviation |
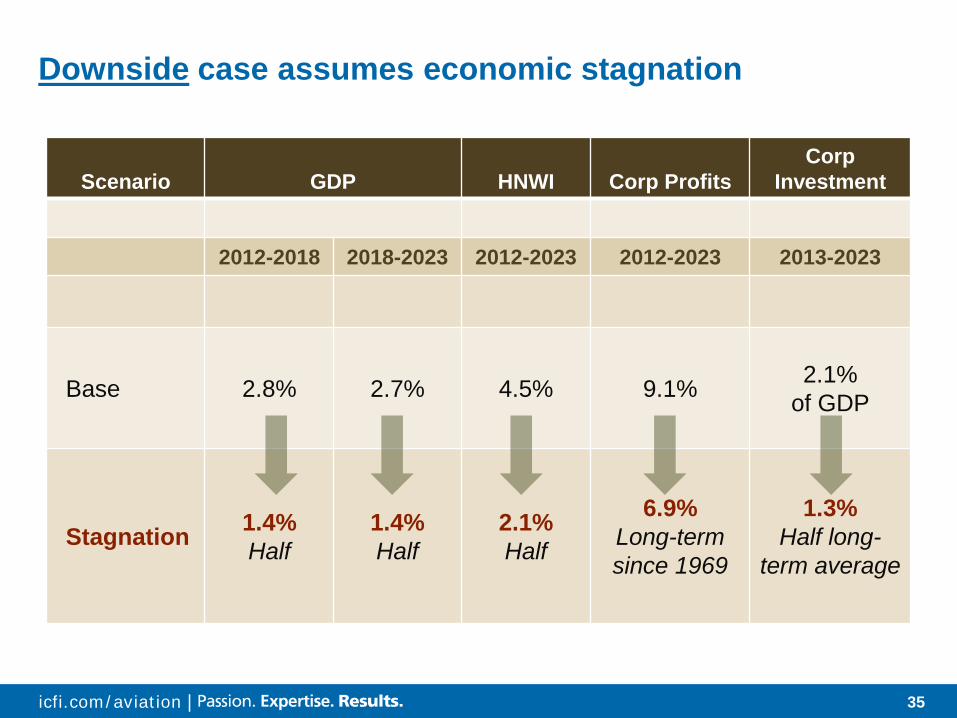
Downside case assumes economic stagnation
Scenario GDP HNWI Corp Profits Corp
Investment
2012-2018 2018-2023 2012-2023 2012-2023 2013-2023
Base 2.8% 2.7% 4.5% 9.1% 2.1% of GDP
Stagnation 1.4% Half
1.4% Half
2.1% Half
6.9% Long-term since 1969
1.3% Half long-
term average
36 icfi.com/aviation |
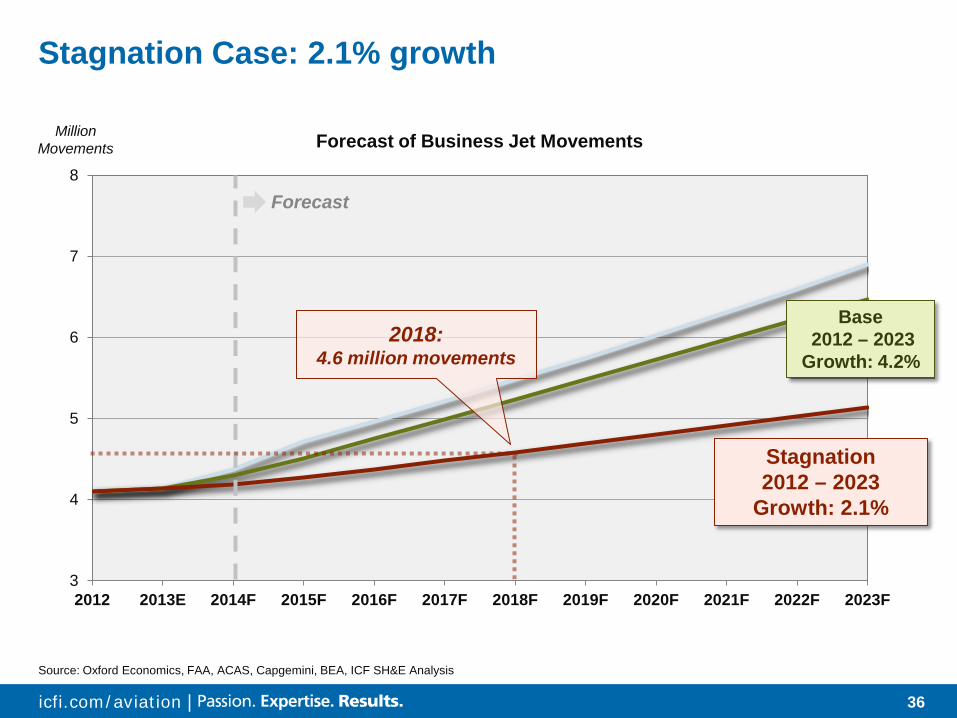
Stagnation Case: 2.1% growth
Source: Oxford Economics, FAA, ACAS, Capgemini, BEA, ICF SH&E Analysis
3
4
5
6
7
8
2012 2013E 2014F 2015F 2016F 2017F 2018F 2019F 2020F 2021F 2022F 2023F
Million Movements Forecast of Business Jet Movements
Forecast
Stagnation 2012 – 2023
Growth: 2.1%
Base 2012 – 2023 Growth: 4.2%
2018: 4.6 million movements
37 icfi.com/aviation |
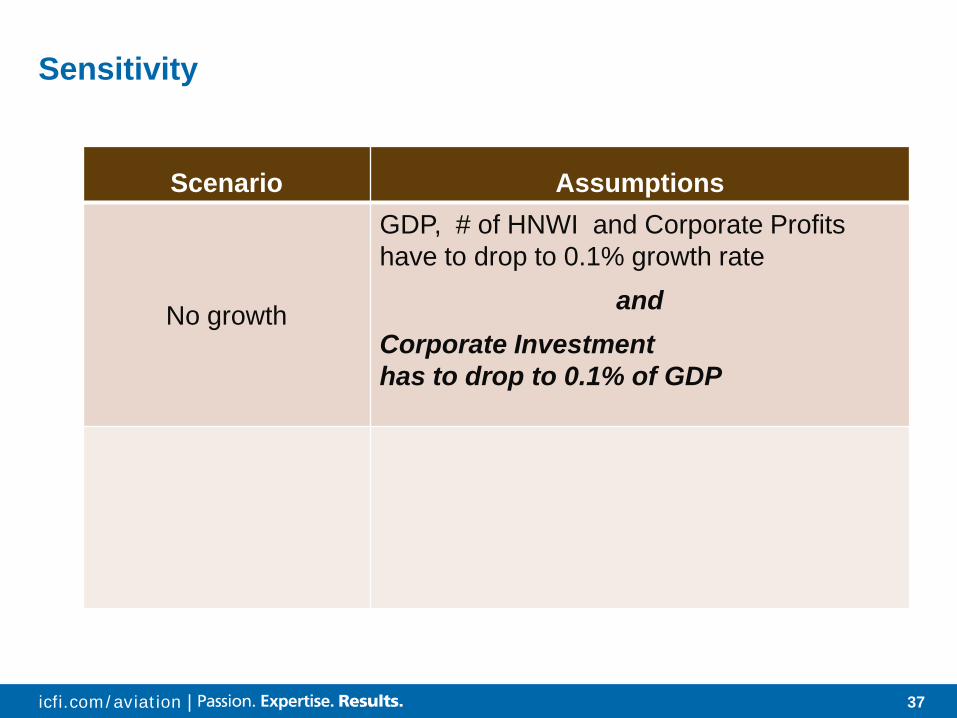
Sensitivity
Scenario Assumptions
No growth
GDP, # of HNWI and Corporate Profits have to drop to 0.1% growth rate
and Corporate Investment has to drop to 0.1% of GDP
38 icfi.com/aviation |
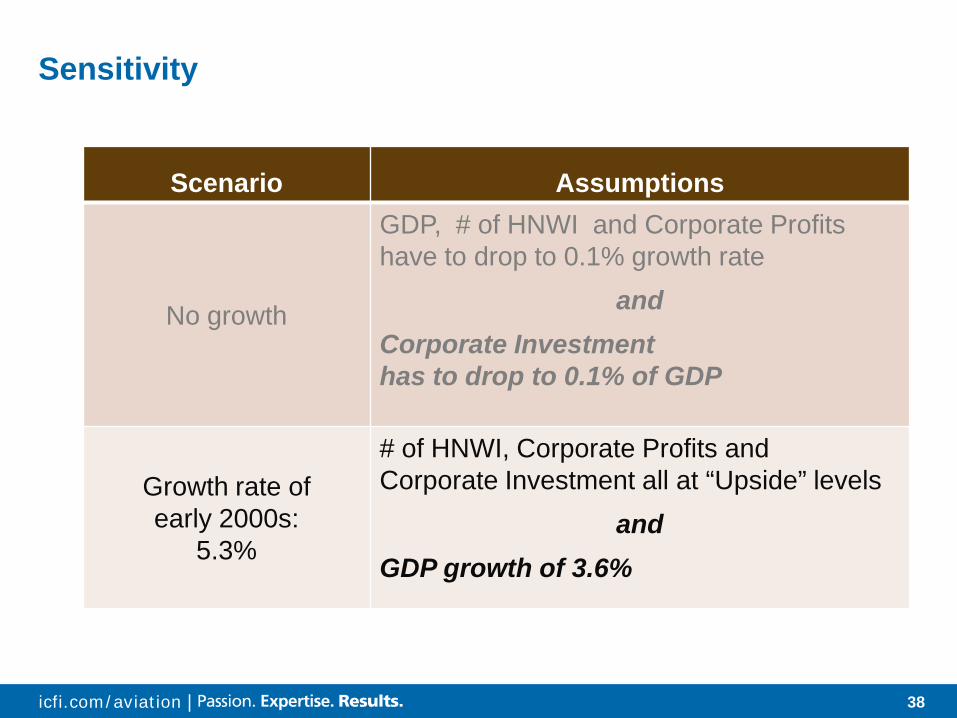
Sensitivity
Scenario Assumptions
No growth
GDP, # of HNWI and Corporate Profits have to drop to 0.1% growth rate
and Corporate Investment has to drop to 0.1% of GDP
Growth rate of early 2000s:
5.3%
# of HNWI, Corporate Profits and Corporate Investment all at “Upside” levels
and GDP growth of 3.6%
39 icfi.com/aviation |
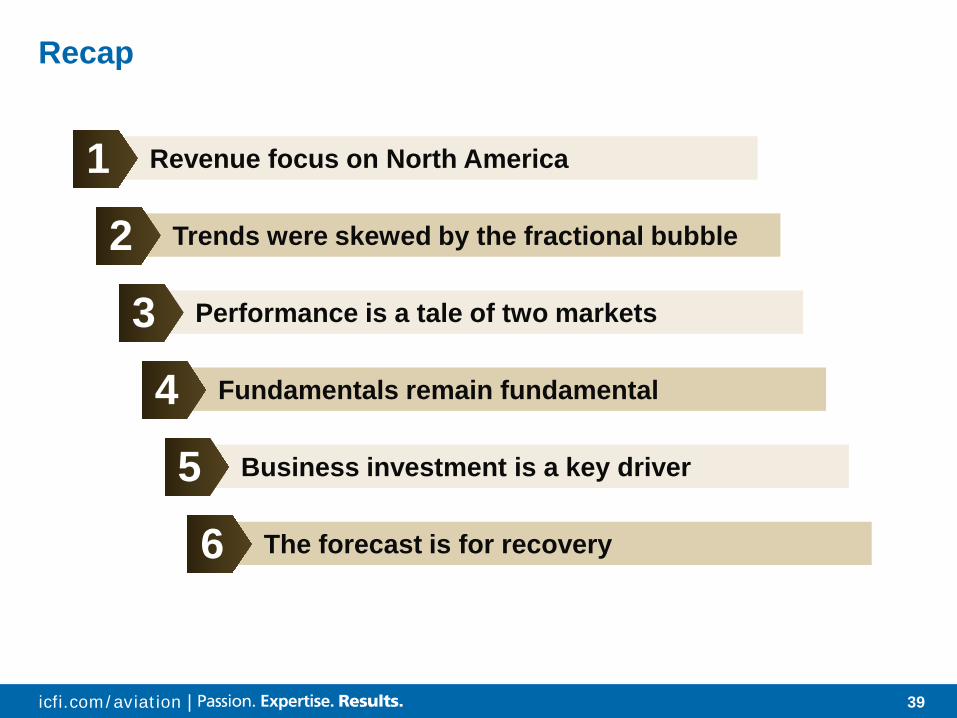
Recap
Revenue focus on North America 1 Trends were skewed by the fractional bubble 2
Performance is a tale of two markets 3 Fundamentals remain fundamental 4
Business investment is a key driver 5 The forecast is for recovery 6

40 icfi.com/aviation |