Embed Size (px)
Citation preview
Olaf AckerHans GeerdesFlorian GröneGermar Schröder
Research Report
Builders of the Digital EcosystemThe 2013 Booz & Company Global ICT 50 Study

Booz & Company
Contact Information
BeijingSara [email protected]
DubaiDavid TusaPartner+971-4-390-0583 [email protected]
Düsseldorf/StockholmRoman FriedrichPartner +49-211-3890-165 [email protected]
FrankfurtDr. Germar Schrö[email protected]
Frankfurt/DubaiOlaf [email protected]
HoustonHenning [email protected]
LondonRichard [email protected]
Los AngelesDan PriestSenior Executive [email protected]
MumbaiSuvojoy [email protected]
New YorkChristopher VollmerPartner +1-212-551-6794 [email protected]
Dr. Florian GrönePrincipal+1-212-551-6458 [email protected]
ParisPierre PéladeauPartner +33-1-44-34-3074 [email protected]
San FranciscoKenny [email protected]
São PauloIvan de SouzaSenior [email protected]
SydneySteven [email protected]
TokyoToshiya ImaiSenior Executive [email protected]
Also contributing to this Research Report were Booz & Company senior associate Raj Muppalla and associate Robert Kopka, and contributing writer Edward H. Baker.

1Booz & Company
EXECUTIVE SUMMARY
Businesses around the world are looking to gain an edge in the race to digitize—to seamlessly incorporate new computing, communications, and collaboration technologies; to streamline their operations; and to connect more closely with customers, suppliers, and partners. To do so, they must look to the continually evolving ecosystem of hardware, software, IT services, and telecom companies. These sectors provide the products and services that make digitization possible.
The goal of the second annual Booz & Company Global Information, Communications, and Technology 50 study is to analyze the top companies in the digitization ecosystem, to detect which ones are prospering and which are not, and to provide some guidance about why. As we did last year, we divided them into four sectors—hardware, software, IT services, and telecom—and then looked at them across four critical criteria: financial performance, portfolio strength, go-to-market footprint, and innovation and branding. The additional year of data gave us a closer look into how companies in each sector are trending, for better or worse.
This year, we added a new perspective on the strategic direction of these companies. Every company in every industry has its own market value proposition: a way to play that represents the way it chooses to create value in the market, ideally matched with its strongest capabilities. Companies’ ways to play can be grouped according to the basic foundational approach they take. By classifying each of the ICT 50 as one or more of these “puretones,” we were able to determine which value propositions seem most advantaged in the market—for now.
2 Booz & Company
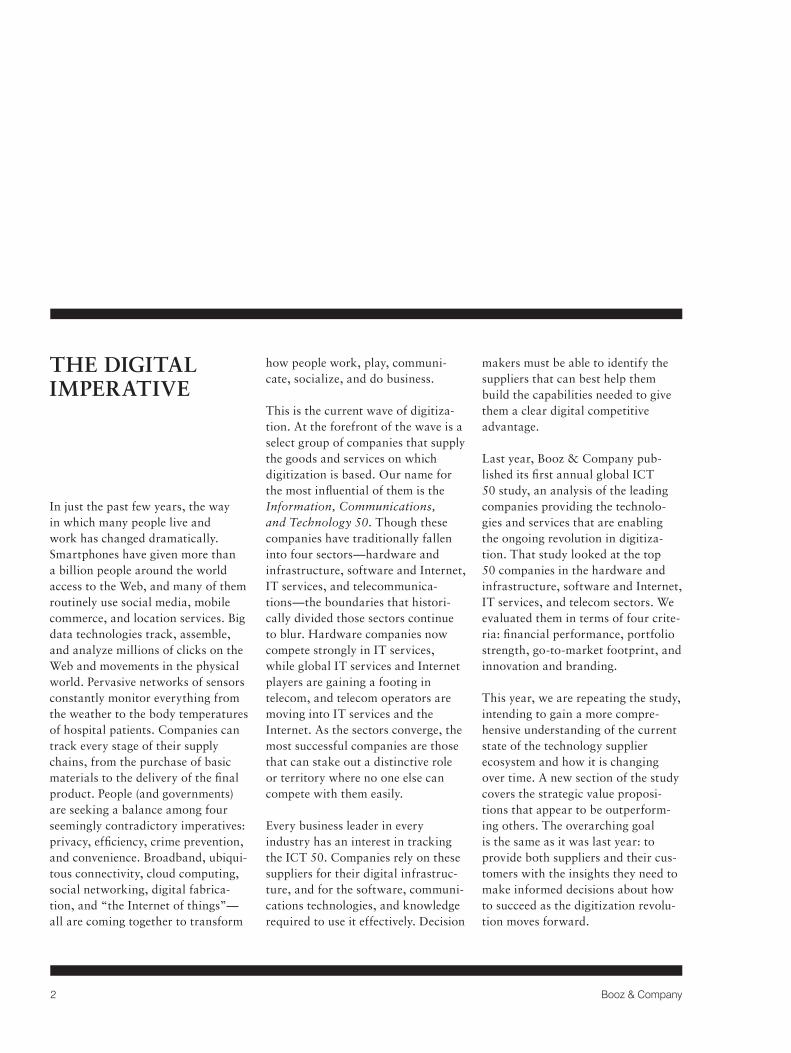
In just the past few years, the way in which many people live and work has changed dramatically. Smartphones have given more than a billion people around the world access to the Web, and many of them routinely use social media, mobile commerce, and location services. Big data technologies track, assemble, and analyze millions of clicks on the Web and movements in the physical world. Pervasive networks of sensors constantly monitor everything from the weather to the body temperatures of hospital patients. Companies can track every stage of their supply chains, from the purchase of basic materials to the delivery of the final product. People (and governments) are seeking a balance among four seemingly contradictory imperatives: privacy, efficiency, crime prevention, and convenience. Broadband, ubiqui-tous connectivity, cloud computing, social networking, digital fabrica-tion, and “the Internet of things”—all are coming together to transform
how people work, play, communi-cate, socialize, and do business. This is the current wave of digitiza-tion. At the forefront of the wave is a select group of companies that supply the goods and services on which digitization is based. Our name for the most influential of them is the Information, Communications, and Technology 50. Though these companies have traditionally fallen into four sectors—hardware and infrastructure, software and Internet, IT services, and telecommunica-tions—the boundaries that histori-cally divided those sectors continue to blur. Hardware companies now compete strongly in IT services, while global IT services and Internet players are gaining a footing in telecom, and telecom operators are moving into IT services and the Internet. As the sectors converge, the most successful companies are those that can stake out a distinctive role or territory where no one else can compete with them easily.
Every business leader in every industry has an interest in tracking the ICT 50. Companies rely on these suppliers for their digital infrastruc-ture, and for the software, communi-cations technologies, and knowledge required to use it effectively. Decision
makers must be able to identify the suppliers that can best help them build the capabilities needed to give them a clear digital competitive advantage.
Last year, Booz & Company pub-lished its first annual global ICT 50 study, an analysis of the leading companies providing the technolo-gies and services that are enabling the ongoing revolution in digitiza-tion. That study looked at the top 50 companies in the hardware and infrastructure, software and Internet, IT services, and telecom sectors. We evaluated them in terms of four crite-ria: financial performance, portfolio strength, go-to-market footprint, and innovation and branding.
This year, we are repeating the study, intending to gain a more compre-hensive understanding of the current state of the technology supplier ecosystem and how it is changing over time. A new section of the study covers the strategic value proposi-tions that appear to be outperform-ing others. The overarching goal is the same as it was last year: to provide both suppliers and their cus-tomers with the insights they need to make informed decisions about how to succeed as the digitization revolu-tion moves forward.
THE DIGITAL IMPERATIVE
3Booz & Company
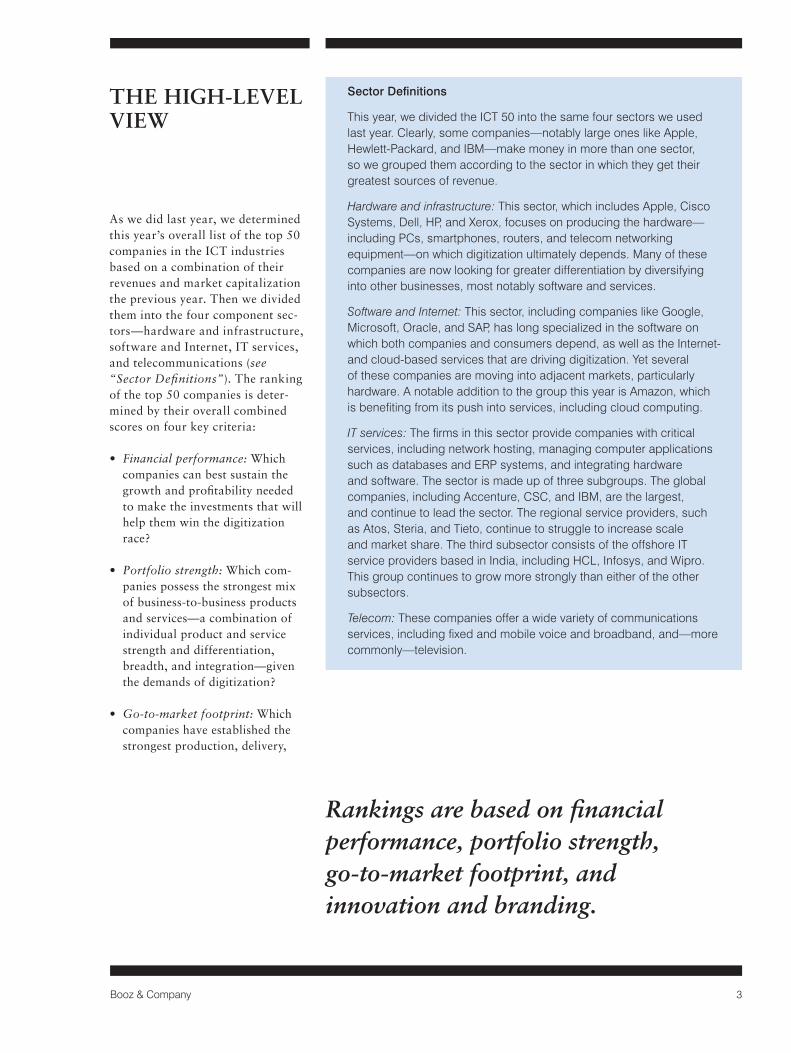
As we did last year, we determined this year’s overall list of the top 50 companies in the ICT industries based on a combination of their revenues and market capitalization the previous year. Then we divided them into the four component sec-tors—hardware and infrastructure, software and Internet, IT services, and telecommunications (see “Sector Definitions”). The ranking of the top 50 companies is deter-mined by their overall combined scores on four key criteria:
• Financial performance: Which companies can best sustain the growth and profitability needed to make the investments that will help them win the digitization race?
• Portfolio strength: Which com-panies possess the strongest mix of business-to-business products and services—a combination of individual product and service strength and differentiation, breadth, and integration—given the demands of digitization?
• Go-to-market footprint: Which companies have established the strongest production, delivery,
THE HIGH-LEVEL VIEW
Sector Definitions
This year, we divided the ICT 50 into the same four sectors we used last year. Clearly, some companies—notably large ones like Apple, Hewlett-Packard, and IBM—make money in more than one sector, so we grouped them according to the sector in which they get their greatest sources of revenue.
Hardware and infrastructure: This sector, which includes Apple, Cisco Systems, Dell, HP, and Xerox, focuses on producing the hardware—including PCs, smartphones, routers, and telecom networking equipment—on which digitization ultimately depends. Many of these companies are now looking for greater differentiation by diversifying into other businesses, most notably software and services.
Software and Internet: This sector, including companies like Google, Microsoft, Oracle, and SAP, has long specialized in the software on which both companies and consumers depend, as well as the Internet- and cloud-based services that are driving digitization. Yet several of these companies are moving into adjacent markets, particularly hardware. A notable addition to the group this year is Amazon, which is benefiting from its push into services, including cloud computing.
IT services: The firms in this sector provide companies with critical services, including network hosting, managing computer applications such as databases and ERP systems, and integrating hardware and software. The sector is made up of three subgroups. The global companies, including Accenture, CSC, and IBM, are the largest, and continue to lead the sector. The regional service providers, such as Atos, Steria, and Tieto, continue to struggle to increase scale and market share. The third subsector consists of the offshore IT service providers based in India, including HCL, Infosys, and Wipro. This group continues to grow more strongly than either of the other subsectors.
Telecom: These companies offer a wide variety of communications services, including fixed and mobile voice and broadband, and—more commonly—television.
Rankings are based on financial performance, portfolio strength, go-to-market footprint, and innovation and branding.

4 Booz & Company
Up-and-Comers
Three Chinese hardware manu-facturers—Huawei Technolo-gies, Lenovo, and ZTE—as well as Salesforce.com and a resur-gent Yahoo, just missed making the cut. These five companies are growing revenues rapidly, but their margins are not yet keeping pace. That’s because several of them are sacrificing profitability to invest heavily in market share growth. Yahoo, after its widely publicized shift in top leadership, is reevaluat-ing its growth options and may rebound as an ICT 50 player next year (see Exhibit A).
and sales presence in the top mar-kets for ICT, both developed and developing?
• Innovation and branding: Which companies have the two factors needed today for expansion in this industry: prowess in innova-tion, and the brand recognition required to attract new customers and talent?
Overall, the list has changed in sev-eral ways since last year (see Exhibit 1, page 5). Among the telecom oper-ators, for instance, China Mobile made the list for the first time—no surprise, given that this state-owned enterprise is already the largest tele-com operator in the world in terms of consumer connections, and that it is now directing its attention to boosting its B2B offerings, develop-ing, for instance, a cloud computing service for small and medium-sized businesses in partnership with SAP. The hardware and infrastructure group saw four new additions this
year, but the IT services group lost five. Notable additions to the list included Amazon, based primarily on a sharp increase in revenues from its cloud computing offerings, and two Japanese hardware companies, Ricoh and Toshiba, as they expand their portfolios into IT services.
The rankings of the top 20 compa-nies in the ICT industries have also changed considerably (see Exhibit 2, page 5). Amazon made its debut in the ICT 50 at 13th place, while Google rose from number 32 to number eight. Several hardware players, notably Samsung, moved into the top 20 this year too, as did many IT services companies. Indeed, two offshore players—TCS and Cognizant—entered the top 20 list for the first time. We’ve also included a “watch list” of companies we view as likely to enter (or reenter, in the case of Yahoo) the ICT 50 soon (see “Up-and-Comers”).
Exhibit A Five Companies Whose Growth Puts Them on the Verge of the Global ICT 50
Notable additions to the list this year are Amazon and two Japanese hardware companies, Ricoh and Toshiba.
Source: Booz & Company
• Huawei Technologies
• Lenovo
• Salesforce.com
• Yahoo
• ZTE

5Booz & Company
Note: Only publicly listed companies with significant share of ICT services revenues were selected based on revenue and market capitalization. Source: Booz & Company analysis
Exhibit 1 The 2013 Global ICT 50
11.0 million = Subheads or highlighted text in Subheads
Guidelines:
aölkdfölka = Plain text / Body copy in Content Bullet points as dashes with tab position
32.8% = numbers in Data (Black)
30.1% = just white text on 100 % color
TABLE HEADINGS
A4 format: - width for 3 columns: 169 mm = 6.654 in- width for 2 columns: 111 mm = 4.37 in
Letter format:- width for 3 columns: 167,64 mm = 6.6 in- width for 2 columns: 110,35 mm = 4.343 in
Lines: 0,5 ptLines for legend: 0,5 pt dotted, black
Note:Please always delete all unused colors, after creating the exhibit,otherwise InDesign will import the spot colors of this Illustrator file.These colors can’t be deleted in InDesign. Thanks.
Approved Colors, Tints and Patterns:
Line Weights:
0,5 pt
0,75 pt
1 pt
Arrows:
Line Textures:
solid
dashed
dotted
Text
Text New addition to the study
Removed from the study
Telecom
AT&T BT Deutsche Telekom France Télécom KDDI KPN NTT Telefónica Verizon Vodafone China Mobile
Hardware & Infrastructure
Alcatel-Lucent Apple Cisco Systems Dell Ericsson Fujitsu Hitachi Hewlett-Packard NEC Samsung Xerox BlackBerry EMC Ricoh Toshiba
Software & Internet
Adobe Convergys Google Intuit Microsoft Oracle SAP Amazon Amdocs Symantec
Yahoo
IT Services Accenture (global) Atos (regional) Capgemini (global) Cognizant (offshore) CSC (global) HCL (offshore) IBM (global) Indra (regional) Infosys (offshore) IT Holdings (regional) Steria (regional) TCS (offshore) Tieto (regional) Wipro (offshore) EDB ErgoGroup (regional) Nomura Research (regional) Capita CGIFirst Data Logica Unisys
Source: Booz & Company analysis
Exhibit 2 The Top 20 Global ICT Companies, 2012 vs. 2013
11.0 million = Subheads or highlighted text in Subheads
Guidelines:
aölkdfölka = Plain text / Body copy in Content Bullet points as dashes with tab position
32.8% = numbers in Data (Black)
30.1% = just white text on 100 % color
TABLE HEADINGS
A4 format: - width for 3 columns: 169 mm = 6.654 in- width for 2 columns: 111 mm = 4.37 in
Letter format:- width for 3 columns: 167,64 mm = 6.6 in- width for 2 columns: 110,35 mm = 4.343 in
Lines: 0,5 ptLines for legend: 0,5 pt dotted, black
Note:Please always delete all unused colors, after creating the exhibit,otherwise InDesign will import the spot colors of this Illustrator file.These colors can’t be deleted in InDesign. Thanks.
Approved Colors, Tints and Patterns:
Line Weights:
0,5 pt
0,75 pt
1 pt
Arrows:
Line Textures:
solid
dashed
dotted
Text
Text New addition to the study
Removed from the study
Telecom
AT&T BT Deutsche Telekom France Télécom KDDI KPN NTT Telefónica Verizon Vodafone China Telecom
Hardware & Infrastructure
Alcatel-Lucent Apple Cisco Systems Dell Ericsson Fujitsu Hitachi Hewlett-Packard NEC Samsung Xerox Blackberry EMC Ricoh Toshiba
Software & Internet
Adobe Convergys Google Intuit Microsoft Oracle SAP Amazon Amdocs Symantec
Yahoo
IT Service Accenture (global) Atos (regional) Capgemini (global) Cognizant (offshore) CSC (global) HCL (offshore) IBM (global) Indra (regional) Infosys (offshore) IT Holdings (regional) Steria (regional) TCS (offshore) Tieto (regional) Wipro (offshore) EDB ErgoGroup (regional) Nomura Research (regional) Capita CGIFirst Data Logica Unisys
Decline in ranking
No change
Advance in ranking
New Not in 2012 ICT 50
Company Ranking 2013 Ranking 2012 Change
IBM 1 3 Oracle 2 2 Microsoft 3 1 SAP 4 7 Cisco Systems 5 5 Apple 6 6 Hewlett-Packard 7 4 Google 8 32 Accenture 9 9 Samsung 10 36 TCS 11 24 Infosys 12 14 Amazon 13 New New Adobe 14 20 Atos 15 31 Ericsson 16 12 Fujitsu 17 26 HCL 18 13 Cognizant 19 28 Dell 20 15

6 Booz & Company
Revenues for this year’s global ICT 50 totaled US$2.07 trillion, a slight increase—3 percent—over last year’s total of $2.01 trillion, and total earn-ings, at $320 billion before interest and taxes, remained relatively stable at 15 percent of revenue. Exhibit 3 (see page 7) makes clear the situation: Revenues increased in almost every sector over the past five years, but improvements in margins did not keep up and in several cases declined.
A closer look at the individual sectors suggests what’s happening.
• Hardware and infrastructure was the only sector that continued to both increase revenues and improve profit margins this year, although its growth slowed somewhat. Overall, the sector is marked by extremes of success: The strongest companies, such as Apple, Cisco Systems, EMC, Samsung, and Xerox, have taken
advantage of convergence to expand into services plays, including cloud computing and “experience-based” products. But other members of the sector, including Alcatel-Lucent, Dell, Fujitsu, NEC, and Toshiba, have struggled to stay relevant as their portfolios have become increasingly commoditized and complex. Some of the most successful companies, like Apple and Samsung, have done particularly well by putting together digital ecosystems combining hard-ware and devices with a tightly inte-grated suite of associated services.
• Software and Internet companies grew revenues strongly again this year as they, too, moved into services and cloud computing. Because both businesses are less profitable, their margins, though still high, contin-ued to decline. Moreover, the sector overall continued to mature and its markets became increasingly saturated. Digital went mainstream, competition increased, and M&A activity—even though it is time-consuming and expensive—was on the rise.
• Growth among the IT services play-ers slowed, and margins were flat
or declining. But differences among the three subsectors remained. The offshore players remained in the strongest financial position, with the highest margins and strong revenue growth. Nonetheless, growth in Asia and the Middle East proved challenging for them, which is why they continued to push aggressively into Europe. The performance of the global firms was mixed; margins remained adequate, but revenue growth lagged—no big surprise, given how large most of them already were. And as in the previous year, the regional players remained in the weakest, most vulnerable posi-tion. (Five of them fell off this year’s list of the global ICT 50 altogether.) Profits of the sector as a whole reflected economies of scale and the ability to arbitrage labor costs, and it will remain difficult to change the sector’s economics in the next few years (see Exhibit 4, page 7).
• Telecom operators’ revenues have remained stagnant, but their margins have stabilized. To make up for the loss of revenue from fixed lines and voice services, they are pursuing new avenues of growth.
FINANCIAL PERFORMANCE

7Booz & Company
Note: Financial data not adjusted for M&A. Source: Bloomberg; Booz & Company analysis
Exhibit 3 Sector and Subsector Revenues and Margins
11.0 million = Subheads or highlighted text in Subheads
Guidelines:
aölkdfölka = Plain text / Body copy in Content Bullet points as dashes with tab position
32.8% = numbers in Data (Black)
30.1% = just white text on 100 % color
TABLE HEADINGS
A4 format: - width for 3 columns: 169 mm = 6.654 in- width for 2 columns: 111 mm = 4.37 in
Letter format:- width for 3 columns: 167,64 mm = 6.6 in- width for 2 columns: 110,35 mm = 4.343 in
Lines: 0,5 ptLines for legend: 0,5 pt dotted, black
Note:Please always delete all unused colors, after creating the exhibit,otherwise InDesign will import the spot colors of this Illustrator file.These colors can’t be deleted in InDesign. Thanks.
Approved Colors, Tints and Patterns:
Line Weights:
0,5 pt
0,75 pt
1 pt
Arrows:
Line Textures:
solid
dashed
dotted
Text
Text New addition to the study
Removed from the study
Telecom
AT&T BT Deutsche Telekom France Télécom KDDI KPN NTT Telefónica Verizon Vodafone China Telecom
Hardware & Infrastructure
Alcatel-Lucent Apple Cisco Systems Dell Ericsson Fujitsu Hitachi Hewlett-Packard NEC Samsung Xerox Blackberry EMC Ricoh Toshiba
Software & Internet
Adobe Convergys Google Intuit Microsoft Oracle SAP Amazon Amdocs Symantec
Yahoo
IT Service Accenture (global) Atos (regional) Capgemini (global) Cognizant (offshore) CSC (global) HCL (offshore) IBM (global) Indra (regional) Infosys (offshore) IT Holdings (regional) Steria (regional) TCS (offshore) Tieto (regional) Wipro (offshore) EDB ErgoGroup (regional) Nomura Research (regional) Capita CGIFirst Data Logica Unisys
Decline in ranking
No change
Advance in ranking
New Not in 2012 ICT 50
Company Ranking 2013 Ranking 2012 Change
IBM 1 3 Oracle 2 2 Microsoft 3 1 SAP 4 7 Cisco Systems 5 5 Apple 6 6 Hewlett-Packard 7 4 Google 8 32 Accenture 9 9 Samsung 10 36 TCS 11 24 Infosys 12 14 Amazon 13 New New Adobe 14 20 Atos 15 31 Ericsson 16 12 Fujitsu 17 26 HCL 18 13 Cognizant 19 28 Dell 20 15
1316
6
22
25
16
0
5
10
15
20
25
30
2008 2009 2010 2011 2012
EBITMargin (%)
4
Normalized Revenue (2008=US$100)
190
180
170
160
150
140
130
120
110
100
90 2012 2011 2010 2009 2008
5-Year CAGR
IT Services Offshore15%
Software & Internet14%
Hardware & Infrastructure6%
IT Services Global1%
Telecom1%
IT Services Regional5%
Watchlist17%
Watchlist
Telecom operators
Software and Internet companies
Offshore IT service providers
Regional IT service providers
Global IT service providers
Hardware and infrastructure companies
Note: In general, not adjusted for M&A. Exceptions: Atos CAGR represents organic revenue growth, excluding effect of SIS acquisition in 2011. Evry CAGR represents organic revenue growth, excluding effect of EDB ErgoGroup merger in 2011. Source: Bloomberg; Booz & Company analysis
Exhibit 4 Financial Performance of the IT Service Providers
11.0 million = Subheads or highlighted text in Subheads
Guidelines:
aölkdfölka = Plain text / Body copy in Content Bullet points as dashes with tab position
32.8% = numbers in Data (Black)
30.1% = just white text on 100 % color
TABLE HEADINGS
A4 format: - width for 3 columns: 169 mm = 6.654 in- width for 2 columns: 111 mm = 4.37 in
Letter format:- width for 3 columns: 167,64 mm = 6.6 in- width for 2 columns: 110,35 mm = 4.343 in
Lines: 0,5 ptLines for legend: 0,5 pt dotted, black
Note:Please always delete all unused colors, after creating the exhibit,otherwise InDesign will import the spot colors of this Illustrator file.These colors can’t be deleted in InDesign. Thanks.
Approved Colors, Tints and Patterns:
Line Weights:
0,5 pt
0,75 pt
1 pt
Arrows:
Line Textures:
solid
dashed
dotted
Text
Text New addition to the study
Removed from the study
Telecom
AT&T BT Deutsche Telekom France Télécom KDDI KPN NTT Telefónica Verizon Vodafone China Telecom
Hardware & Infrastructure
Alcatel-Lucent Apple Cisco Systems Dell Ericsson Fujitsu Hitachi Hewlett-Packard NEC Samsung Xerox Blackberry EMC Ricoh Toshiba
Software & Internet
Adobe Convergys Google Intuit Microsoft Oracle SAP Amazon Amdocs Symantec
Yahoo
IT Service Accenture (global) Atos (regional) Capgemini (global) Cognizant (offshore) CSC (global) HCL (offshore) IBM (global) Indra (regional) Infosys (offshore) IT Holdings (regional) Steria (regional) TCS (offshore) Tieto (regional) Wipro (offshore) EDB ErgoGroup (regional) Nomura Research (regional) Capita CGIFirst Data Logica Unisys
Decline in ranking
No change
Advance in ranking
New Not in 2012 ICT 50
Company Ranking 2013 Ranking 2012 Change
IBM 1 3 Oracle 2 2 Microsoft 3 1 SAP 4 7 Cisco Systems 5 5 Apple 6 6 Hewlett-Packard 7 4 Google 8 32 Accenture 9 9 Samsung 10 36 TCS 11 24 Infosys 12 14 Amazon 13 New New Adobe 14 20 Atos 15 31 Ericsson 16 12 Fujitsu 17 26 HCL 18 13 Cognizant 19 28 Dell 20 15
1316
6
22
25
16
0
5
10
15
20
25
30
2008 2009 2010 2011 2012
EBITMargin (%)
4
Normalized Revenue (2008=US$100)
190
180
170
160
150
140
130
120
110
100
90 2012 2011 2010 2009 2008
5-Year CAGR
IT Services Offshore15%
Software & Internet14%
Hardware & Infrastructure6%
IT Services Global1%
Telecom1%
IT Services Regional5%
Watchlist17%
Watchlist
Telecom operators
Software and Internet companies
Offshore IT service providers
Regional IT service providers
Global IT service providers
Hardware and infrastructure companies
REVENUE GROWTH VS. PROFITABILITY, 2010–12
0% 5% 10% 15% 20% 25% 30% 35% 40% 45%
35%
30%
25%
20%
15%
10%
5%
0
-5%
Infosys
Indra
IBM
HCL
CSC
Cognizant
Capgemini
Atos
Accenture
2010–12 Revenue CAGR
2012 EBIT
Evry
Nomura Research
Wipro
Tieto
TCS
Steria
IT Holdings
Many regional players under pressure, especially if limited to “classical” portfolio
Aggressive growth of offshore players with strong profitability
Global Regional Offshore
Global players with mixed performance: Focus on big outsourcing/service deals and innovation push
CORRELATION OF SCORES WITH FINANCIAL PERFORMANCE BY SECTOR AND SUBSECTOR
8 Booz & Company
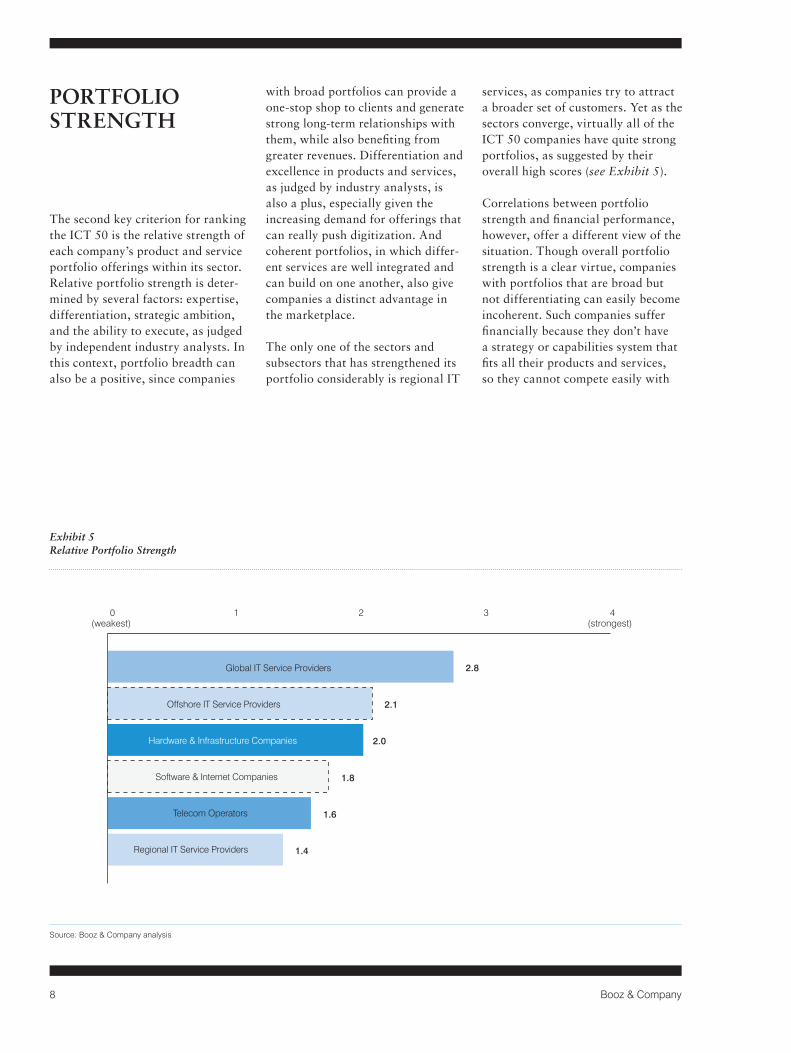
The second key criterion for ranking the ICT 50 is the relative strength of each company’s product and service portfolio offerings within its sector. Relative portfolio strength is deter-mined by several factors: expertise, differentiation, strategic ambition, and the ability to execute, as judged by independent industry analysts. In this context, portfolio breadth can also be a positive, since companies
with broad portfolios can provide a one-stop shop to clients and generate strong long-term relationships with them, while also benefiting from greater revenues. Differentiation and excellence in products and services, as judged by industry analysts, is also a plus, especially given the increasing demand for offerings that can really push digitization. And coherent portfolios, in which differ-ent services are well integrated and can build on one another, also give companies a distinct advantage in the marketplace.
The only one of the sectors and subsectors that has strengthened its portfolio considerably is regional IT
services, as companies try to attract a broader set of customers. Yet as the sectors converge, virtually all of the ICT 50 companies have quite strong portfolios, as suggested by their overall high scores (see Exhibit 5).
Correlations between portfolio strength and financial performance, however, offer a different view of the situation. Though overall portfolio strength is a clear virtue, companies with portfolios that are broad but not differentiating can easily become incoherent. Such companies suffer financially because they don’t have a strategy or capabilities system that fits all their products and services, so they cannot compete easily with
PORTFOLIO STRENGTH
Source: Booz & Company analysis
Exhibit 5 Relative Portfolio Strength
11.0 million = Subheads or highlighted text in Subheads
Guidelines:
aölkdfölka = Plain text / Body copy in Content Bullet points as dashes with tab position
32.8% = numbers in Data (Black)
30.1% = just white text on 100 % color
TABLE HEADINGS
A4 format: - width for 3 columns: 169 mm = 6.654 in- width for 2 columns: 111 mm = 4.37 in
Letter format:- width for 3 columns: 167,64 mm = 6.6 in- width for 2 columns: 110,35 mm = 4.343 in
Lines: 0,5 ptLines for legend: 0,5 pt dotted, black
Note:Please always delete all unused colors, after creating the exhibit,otherwise InDesign will import the spot colors of this Illustrator file.These colors can’t be deleted in InDesign. Thanks.
Approved Colors, Tints and Patterns:
Line Weights:
0,5 pt
0,75 pt
1 pt
Arrows:
Line Textures:
solid
dashed
dotted
Text
Text New addition to the study
Removed from the study
Telecom
AT&T BT Deutsche Telekom France Télécom KDDI KPN NTT Telefónica Verizon Vodafone China Telecom
Hardware & Infrastructure
Alcatel-Lucent Apple Cisco Systems Dell Ericsson Fujitsu Hitachi Hewlett-Packard NEC Samsung Xerox Blackberry EMC Ricoh Toshiba
Software & Internet
Adobe Convergys Google Intuit Microsoft Oracle SAP Amazon Amdocs Symantec
Yahoo
IT Service Accenture (global) Atos (regional) Capgemini (global) Cognizant (offshore) CSC (global) HCL (offshore) IBM (global) Indra (regional) Infosys (offshore) IT Holdings (regional) Steria (regional) TCS (offshore) Tieto (regional) Wipro (offshore) EDB ErgoGroup (regional) Nomura Research (regional) Capita CGIFirst Data Logica Unisys
Decline in ranking
No change
Advance in ranking
New Not in 2012 ICT 50
Company Ranking 2013 Ranking 2012 Change
IBM 1 3 Oracle 2 2 Microsoft 3 1 SAP 4 7 Cisco Systems 5 5 Apple 6 6 Hewlett-Packard 7 4 Google 8 32 Accenture 9 9 Samsung 10 36 TCS 11 24 Infosys 12 14 Amazon 13 New New Adobe 14 20 Atos 15 31 Ericsson 16 12 Fujitsu 17 26 HCL 18 13 Cognizant 19 28 Dell 20 15
1316
6
22
25
16
0
5
10
15
20
25
30
2008 2009 2010 2011 2012
EBITMargin (%)
4
Normalized Revenue (2008=US$100)
190
180
170
160
150
140
130
120
110
100
90 2012 2011 2010 2009 2008
5-Year CAGR
IT Services Offshore15%
Software & Internet14%
Hardware & Infrastructure6%
IT Services Global1%
Telecom1%
IT Services Regional5%
Watchlist17%
Watchlist
Telecom operators
Software and Internet companies
Offshore IT service providers
Regional IT service providers
Global IT service providers
Hardware and infrastructure companies
Revenue Growth vs. Profitability, 2010–12
0% 5% 10% 15% 20% 25% 30% 35% 40% 45%
35%
30%
25%
20%
15%
10%
5%
0
-5%
Infosys
Indra
IBM
HCL
CSC
Cognizant
Capgemini
Atos
Accenture
2010–12 Revenue CAGR
Evry
Nomura Research
Wipro
Tieto
TCS
Steria
IT Holdings
Many regional players under pressure, especially if limited to “classical” portfolio
Aggressive growth of offshore players with strong profitability
Global Regional Offshore
Global players with mixed performance: Focus on big outsourcing/service deals and innovation push
4(strongest)
3 2 1 0(weakest)
1.4
1.6
1.8
2.0
2.1
2.8
Regional IT Service Providers
Telecom Operators
Software & Internet Companies
Hardware & Infrastructure Companies
Offshore IT Service Providers
Global IT Service Providers 5-Year CAGR
IT Services Offshore15%
Software & Internet14%
Hardware & Infrastructure6%
IT Services Global1%
Telecom1%
IT Services Regional5%
Watchlist17%

9Booz & Company
more focused companies that do. We see some evidence of this among the ICT 50, where companies with relatively narrower portfolios have grown faster overall than those with broader ones, although the former don’t typically boast the total rev-enues of the latter.
We also looked at the relative finan-cial performance of companies with “conventional” portfolios—typically including standard products and services such as hosting, data center services, and managed applica-tions—and those with leading-edge “next-generation” portfolios. The
analysis shows that conventional portfolios allow companies in the hardware and infrastructure sectors and regional IT services subsector to increase revenues more than con-ventional portfolios do in any of the other sectors. Despite their over-all mediocre results, for example, increased portfolio strength among the regional IT services companies is positively correlated with improved revenue growth, though not with better margins. These companies can grow revenues by adding more offerings, and if they don’t, they risk being trapped in offerings that are essentially commodity services.
Increased profitability is correlated with strong conventional portfolios only among the software companies and the global IT services providers.
On the other hand, next-generation portfolios, which include the new products and services driving the move to digitization, are for the most part not yet strongly correlated with growth or profitability. The exceptions can be found among the hardware and software companies, many of which are succeeding by building more fully coherent ecosys-tems incorporating next-generation products and services (see Exhibit 6).
Note: Where trend lines are missing (telecom in upper right, IT services offshore in lower right), no correlation could be found. Source: Booz & Company analysis
Exhibit 6 Conventional and Next-Generation Portfolios Compared
11.0 million = Subheads or highlighted text in Subheads
Guidelines:
aölkdfölka = Plain text / Body copy in Content Bullet points as dashes with tab position
32.8% = numbers in Data (Black)
30.1% = just white text on 100 % color
TABLE HEADINGS
A4 format: - width for 3 columns: 169 mm = 6.654 in- width for 2 columns: 111 mm = 4.37 in
Letter format:- width for 3 columns: 167,64 mm = 6.6 in- width for 2 columns: 110,35 mm = 4.343 in
Lines: 0,5 ptLines for legend: 0,5 pt dotted, black
Note:Please always delete all unused colors, after creating the exhibit,otherwise InDesign will import the spot colors of this Illustrator file.These colors can’t be deleted in InDesign. Thanks.
Approved Colors, Tints and Patterns:
Line Weights:
0,5 pt
0,75 pt
1 pt
Arrows:
Line Textures:
solid
dashed
dotted
1316
6
22
25
16
0
5
10
15
20
25
30
2008 2009 2010 2011 2012
EBITMargin (%)
4
Normalized Revenue (2008=US$100)
190
180
170
160
150
140
130
120
110
100
90 2012 2011 2010 2009 2008
5-Year CAGR
IT Services Offshore15%
Software & Internet14%
Hardware & Infrastructure6%
IT Services Global1%
Telecom1%
IT Services Regional5%
Watchlist17%
Watchlist
Telecom operators
Software and Internet companies
Offshore IT service providers
Regional IT service providers
Global IT service providers
Hardware and infrastructure companies
Global Regional Offshore
Regional IT Service Providers
Telecom Operators
Software & Internet Companies
Hardware & Infrastructure Companies
Offshore IT Service Providers
Global IT Service Providers
2010
–12
Rev
enue
CA
GR
2010
–12
Rev
enue
CA
GR
Portfolio Strength
Conventional Portfolio Next-Generation Portfolio
Rev
enu
e G
row
thP
rofi
tab
ility
Telecom
Portfolio Strength
2012
EB
IT M
arg
in
Portfolio Strength
Portfolio completeness and growth are positively correlated for regional IT service providers and hardware players, but negatively correlated overall
Next-generation plays not successfully “grounded” for telecom operators and service providers. In general there is no large financial impact—yet
IT Services Regional
IT Services Global
Hardware & Infrastructure
Software & Internet
2012
EB
IT M
arg
in
Portfolio Strength
IT Services Regional
Software & Internet
IT Services Offshore
Telecom
IT Services Global
Hardware & Infrastructure
IT Services Offshore
Telecom
IT Services Regional
Hardware & Infrastructure
Software & Internet
Telecom
IT Services Regional
IT Services Global
Hardware & Infrastructure
Software & Internet Global service providers and software players can grow profitably through portfolio strength
CORRELATION OF SCORES WITH FINANCIAL PERFORMANCE BY SECTOR AND SUBSECTOR
IT Services Offshore
IT Services Global
IT Services Offshore
Telecom operators
Software and Internet companies
Offshore IT service providers
Regional IT service providers
Global IT service providers
Hardware and infrastructure companies

10 Booz & Company
The capacity of companies in the ICT industries to increase growth and profitability is typically constrained or boosted by how and where they oper-ate. New markets, most notably the BRIC countries—Brazil, Russia, India, and China—are beginning to reach critical mass thanks to their rapid GDP growth, yet the ability of many of the
players in some of the sectors to take advantage has been limited for a variety of reasons, some of them self-imposed (see Exhibit 7).
The dominant players in both the developed and BRIC markets remain the global IT services companies; the fact that they are the only group with a truly global production model, includ-ing both production and sales, has enabled them to succeed in their efforts throughout the world. The regional players continue to focus primarily on the developed markets, in part because their efforts to extend production into newer markets continue to lag. The
software players have extended their production efforts to new regions in search of engineering talent and lower labor costs, but their marketing efforts continue to focus on clients with large IT budgets in mature markets. More asset-driven businesses, like hardware, have moved a considerable amount of production to developing markets, and are beginning to increase their sales presence there as well, but their produc-tion models aren’t so closely linked to how and where they go to market. Finally, the telecom operators remain confined for the most part to their home markets by the nature and limitations of their network infrastructures.
GO-TO-MARKET FOOTPRINT
Source: Booz & Company analysis
Exhibit 7 Different Sectors Have Very Different Go-to-Market and Production Footprints
11.0 million = Subheads or highlighted text in Subheads
Guidelines:
aölkdfölka = Plain text / Body copy in Content Bullet points as dashes with tab position
32.8% = numbers in Data (Black)
30.1% = just white text on 100 % color
TABLE HEADINGS
A4 format: - width for 3 columns: 169 mm = 6.654 in- width for 2 columns: 111 mm = 4.37 in
Letter format:- width for 3 columns: 167,64 mm = 6.6 in- width for 2 columns: 110,35 mm = 4.343 in
Lines: 0,5 ptLines for legend: 0,5 pt dotted, black
Note:Please always delete all unused colors, after creating the exhibit,otherwise InDesign will import the spot colors of this Illustrator file.These colors can’t be deleted in InDesign. Thanks.
Approved Colors, Tints and Patterns:
Line Weights:
0,5 pt
0,75 pt
1 pt
Arrows:
Line Textures:
solid
dashed
dotted
1316
6
22
25
16
0
5
10
15
20
25
30
2008 2009 2010 2011 2012
EBITMargin (%)
4
Normalized Revenue (2008=US$100)
190
180
170
160
150
140
130
120
110
100
90 2012 2011 2010 2009 2008
5-Year CAGR
IT Services Offshore15%
Software & Internet14%
Hardware & Infrastructure6%
IT Services Global1%
Telecom1%
IT Services Regional5%
Watchlist17%
Watchlist
Telecom operators
Software and Internet companies
Offshore IT service providers
Regional IT service providers
Global IT service providers
Hardware and infrastructure companies
Global Regional Offshore
Regional IT Service Providers
Telecom Operators
Software & Internet Companies
Hardware & Infrastructure Companies
Offshore IT Service Providers
Global IT Service Providers
2010
–12
Rev
enue
CA
GR
2010
–12
Rev
enue
CA
GR
Portfolio Strength
Conventional Portfolio Next-Generation Portfolio
Rev
enu
e G
row
thP
rofi
tab
ility
Telecom
Portfolio Strength
2012
EB
IT M
arg
in
Portfolio Strength
Portfolio completeness and growth are positively correlated for regional IT service providers and hardware players, but negatively correlated overall
Next-generation plays not successfully “grounded” for telecom operators and service providers. In general there is no large financial impact—yet
IT Services Regional
IT Services Global
Hardware & Infrastructure.
Software & Internet
2012
EB
IT M
arg
in
Portfolio Strength
IT Services Regional
Software & Internet
IT Services Offshore
Telecom
IT Services Global
Hardware & Infrastructure
IT Services Offshore
Telecom
IT Services Regional
Hardware & Infrastructure
Software & Internet
Telecom
IT Services Regional
IT Services Global
Hardware & Infrastructure
Software & Internet Global service providers and software players can grow profitably through portfolio strength
CORRELATION OF SCORES WITH FINANCIAL PERFORMANCE BY SECTOR AND SUBSECTOR
IT Services Offshore
IT Services Global
IT Services Offshore
Telecom operators
Software and Internet companies
Offshore IT service providers
Regional IT service providers
Global IT service providers
Hardware and infrastructure companies
1.41.1
1.0
Global Production
Go-to-Market BRIC(Brazil, Russia, India, China)
Go-to-Market Top 5(U.S., U.K., Japan, Germany, France)
1.61.7
2.8
2.61.41.4
1.10.6
0.5
3.83.2
2.62.4
1.71.6
Telecom
IT Services Regional
Software & Internet
IT Services Offshore
Hardware & Infrastructure
IT Services Global
4(strongest)
3 2 1 0(weakest)

11Booz & Company
To sustain their growth, ICT companies must not only keep exploring additional attractive markets, but also keep innovating new products and services, and building out their brands globally. Innovation, of course, is key, and most companies in the ICT industries are (or have been) adept at it. It comes as no surprise that six of the companies that scored highest in this regard
also ranked among the top 10 most innovative companies in the 2012 Booz & Company Global Innovation 1000 study (see Exhibit 8). This group is dominated by software and Internet firms, which typically spend a very large percentage of their revenue on R&D. Four of these companies are listed among Interbrand’s list of the top 10 global brands in 2012, suggesting that a reputation for selling great products matters as much in a business-to-business context as it does in more consumer-oriented industries.
In innovation and branding, the IT services companies don’t fare as well as companies in the other sectors. The only services company that appeared on both our list of the top 10 most
innovative companies and the list of top brands was IBM; Accenture shows up at number 43 on the top brands list. The regional firms in particular have been struggling to maintain the growth and margins necessary to keep investing in R&D.
Finally, the telecom operators continued to spend very little money on next-generation innovation in 2012, with very little growth in their investments since 2011. This is also not a surprise, given the huge investments they are still making—and will have to keep making—to build out high-speed mobile and fiber networks in hopes of keeping up with the explosion of data traffic on their networks.
INNOVATION AND BRANDING
Source: Interbrand study of top global brands 2012; Booz & Company analysis
Exhibit 8 Several ICT 50 Companies Are among the Most Innovative Companies and Top Brands Globally
11.0 million = Subheads or highlighted text in Subheads
Guidelines:
aölkdfölka = Plain text / Body copy in Content Bullet points as dashes with tab position
32.8% = numbers in Data (Black)
30.1% = just white text on 100 % color
TABLE HEADINGS
A4 format: - width for 3 columns: 169 mm = 6.654 in- width for 2 columns: 111 mm = 4.37 in
Letter format:- width for 3 columns: 167,64 mm = 6.6 in- width for 2 columns: 110,35 mm = 4.343 in
Lines: 0,5 ptLines for legend: 0,5 pt dotted, black
Note:Please always delete all unused colors, after creating the exhibit,otherwise InDesign will import the spot colors of this Illustrator file.These colors can’t be deleted in InDesign. Thanks.
Approved Colors, Tints and Patterns:
Line Weights:
0,5 pt
0,75 pt
1 pt
Arrows:
Line Textures:
solid
dashed
dotted
1316
6
22
25
16
0
5
10
15
20
25
30
2008 2009 2010 2011 2012
EBITMargin (%)
4
Normalized Revenue (2008=US$100)
190
180
170
160
150
140
130
120
110
100
90 2012 2011 2010 2009 2008
Most Innovative Companies, 2012 Most Valuable Global Brands, 2012
IT Services Offshore15%
Software & Internet14%
Hardware & Infrastructure6%
IT Services Global1%
Telecom1%
IT Services Regional5%
Watchlist17%
Watchlist
Telecom operators
Software and Internet companies
Offshore IT service providers
Regional IT service providers
Global IT service providers
Hardware and infrastructure companies
Global Regional Offshore
Regional IT Service Providers
Telecom Operators
Software & Internet Companies
Hardware & Infrastructure Companies
Offshore IT Service Providers
Global IT Service Providers
2010
–12
Rev
enue
CA
GR
2010
–12
Rev
enue
CA
GR
Portfolio Strength
Conventional Portfolio Next-Generation Portfolio
Rev
enu
e G
row
thP
rofi
tab
ility
Telecom
Portfolio Strength
2012
EB
IT M
arg
in
Portfolio Strength
Portfolio completeness and growth are positively correlated for regional IT service providers and hardware players, but negatively correlated overall
Next-generation plays not successfully “grounded” for telecom operators and service providers. In general there is no large financial impact—yet
IT Services Regional
IT Services Global
Hardware & Infrastructure.
Software & Internet
2012
EB
IT M
arg
in
Portfolio Strength
IT Services Regional
Software & Internet
IT Services Offshore
Telecom
IT Services Global
Hardware & Infrastructure
IT Services Offshore
Telecom
IT Services Regional
Hardware & Infrastructure
Software & Internet
Telecom
IT Services Regional
IT Services Global
Hardware & Infrastructure
Software & Internet Global service providers and software players can grow profitably through portfolio strength
CORRELATION OF SCORES WITH FINANCIAL PERFORMANCE BY SECTOR AND SUBSECTOR
IT Services Offshore
IT Services Global
IT Services Offshore
Telecom operators
Software and Internet companies
Offshore IT service providers
Regional IT service providers
Global IT service providers
Hardware and infrastructure companies
1 Apple
2 Google
3 3M
4 Samsung
5 GE
6 Microsoft
7 Toyota
8 Procter & Gamble
9 IBM
10 Amazon
2 Apple
3 IBM
4 Google
5 Microsoft
14 Cisco Systems
15 Hewlett-Packard
18 Oracle
25 SAP
43 Accenture
49 Dell
59 Xerox
78 Adobe
97 Yahoo
Member of the Global ICT 50
Global Rank Company Global
Rank Company

12 Booz & Company
As every company in every sector of the ICT 50 tries to distinguish itself from its competitors, it is increasingly important to distinguish them not just by the sectors they occupy, but by the strategies they follow—especially given the degree to which the sectors are converging. A successful long-term strategy requires not just that companies follow a distinctive value proposition, or “way to play” in the market, but also that their way to play is in close alignment with their most important capabilities, the products and services they offer, and the markets in which they operate.
For most successful companies—and the ICT 50 companies are no exception—their way to play is closely tied to their identity, and thus is unique. Nonetheless, ways to play can be classified in broad groups that we call “puretones”—generic archetypes that describe how companies create value for their customers. ICT companies tend to fall into one of six of these value propositions, including network and infrastructure platform players, consolidators, innovators, next-generation digitization players, solutions providers, and global sourcing value players (see “Six ICT Puretone Ways to Play,” page 14).
Most of the ICT 50 companies operate in a way that involves more than one puretone. Microsoft, for example, is a network and infrastructure platform player—its
Windows and Office platforms are the basis of its profitability. But it is also a consolidator and a next-generation digitization player. It has always been a third-party consolidator, coordinating offerings from a variety of smaller firms and providing more value than they could do on their own. And in ventures like Skype and the Xbox, Microsoft is betting its future on its ability to innovate. This is a very diverse way to play, with a risk of incoherence, and it’s still not clear whether Microsoft can manage all this in the long run, even with its enormous platform advantage.
This year’s analysis also sug-gests that the six ways to play are performing differently in the market—at least for now. To better understand which strategies are thriving, we grouped together the top five players for each puretone
WAYS TO PLAY

13Booz & Company
archetype and then looked at their combined financial performance over the past five years. As Exhibit 9 shows, some puretone ways to play have been more successful than others: The top three, ranked on the basis of revenue growth, are the innovators, the global sourc-ing value players, and the next-generation digitization players. By and large, all three of these
strategic value propositions outper-form when judged on the basis of margins as well, though as a group, companies in the consolidator puretone also continue to achieve healthy margins. But only the inno-vators have continued to boost their margins over time.
Does this mean companies should change their way to play in hopes
of boosting performance? No. Any company can succeed if it has assembled the right mix of capa-bilities and a product and service portfolio that suits its chosen value proposition strategy. The key is to decide carefully, considering your existing capabilities and your chosen market, how best your com-pany can create value—and then fill in the gaps necessary to do so.
Note: Not adjusted for M&A. Source: Bloomberg; Booz & Company analysis
Exhibit 9 Revenues and Margins of the Top Companies in Each of the Six Puretone Ways to Play
11.0 million = Subheads or highlighted text in Subheads
Guidelines:
aölkdfölka = Plain text / Body copy in Content Bullet points as dashes with tab position
32.8% = numbers in Data (Black)
30.1% = just white text on 100 % color
TABLE HEADINGS
A4 format: - width for 3 columns: 169 mm = 6.654 in- width for 2 columns: 111 mm = 4.37 in
Letter format:- width for 3 columns: 167,64 mm = 6.6 in- width for 2 columns: 110,35 mm = 4.343 in
Lines: 0,5 ptLines for legend: 0,5 pt dotted, black
Note:Please always delete all unused colors, after creating the exhibit,otherwise InDesign will import the spot colors of this Illustrator file.These colors can’t be deleted in InDesign. Thanks.
Approved Colors, Tints and Patterns:
Line Weights:
0,5 pt
0,75 pt
1 pt
Arrows:
Line Textures:
solid
dashed
dotted
1316
6
22
25
16
0
5
10
15
20
25
30
2008 2009 2010 2011 2012
EBITMargin (%)
4
Normalized Revenue (2008=US$100)
190
180
170
160
150
140
130
120
110
100
90 2012 2011 2010 2009 2008
Most Innovative Companies, 2012 Most Valuable Global Brands, 2012
IT Services Offshore15%
Software & Internet14%
Hardware & Infrastructure6%
IT Services Global1%
Telecom1%
IT Services Regional5%
Watchlist17%
Watchlist
Telecom operators
Software and Internet companies
Offshore IT service providers
Regional IT service providers
Global IT service providers
Hardware and infrastructure companies
Global Regional Offshore
Regional IT Service Providers
Telecom Operators
Software & Internet Companies
Hardware & Infrastructure Companies
Offshore IT Service Providers
Global IT Service Providers
2010
–12
Rev
enue
CA
GR
2010
–12
Rev
enue
CA
GR
Portfolio Strength
Conventional Portfolio Next-Generation Portfolio
Rev
enu
e G
row
thP
rofi
tab
ility
Telecom
Portfolio Strength
2012
EB
IT M
arg
in
Portfolio Strength
Portfolio completeness and growth are positively correlated for regional IT service providers and hardware players, but negatively correlated overall
Next-generation plays not successfully “grounded” for telecom operators and service providers. In general there is no large financial impact—yet
IT Services Regional
IT Services Global
Hardware & Infrastructure.
Software & Internet
2012
EB
IT M
arg
in
Portfolio Strength
IT Services Regional
Software & Internet
IT Services Offshore
Telecom
IT Services Global
Hardware & Infrastructure
IT Services Offshore
Telecom
IT Services Regional
Hardware & Infrastructure
Software & Internet
Telecom
IT Services Regional
IT Services Global
Hardware & Infrastructure
Software & Internet Global service providers and software players can grow profitably through portfolio strength
CORRELATION OF SCORES WITH FINANCIAL PERFORMANCE BY SECTOR AND SUBSECTOR
IT Services Offshore
IT Services Global
IT Services Offshore
Telecom operators
Software and Internet companies
Offshore IT service providers
Regional IT service providers
Global IT service providers
Hardware and infrastructure companies
1 Apple
2 Google
3 3M
4 Samsung
5 GE
6 Microsoft
7 Toyota
8 Procter & Gamble
9 IBM
10 Amazon
2 Apple
3 IBM
4 Google
5 Microsoft
14 Cisco Systems
15 Hewlett-Packard
18 Oracle
25 SAP
43 Accenture
49 Dell
59 Xerox
78 Adobe
97 Yahoo
Member of the Global ICT 50
Global Rank Company Global
Rank Company
EBITMargin (%)
28
26
24
22
20
18
16
14
12
10 2012 2011 2010 2009 2008
205
135
130
125
120
115
Normalized Revenue(2008=US$100)
110
105
100
952012 2011 2010 2009 2008
Global Sourcing Value Player
Global Sourcing Value Player
Solutions ProviderSolutions Provider
Next-GenerationDigitization Player
Next-GenerationDigitization Player
Innovator
Innovator
Consolidator
Consolidator
Network and InfrastructurePlatform Player
Network and InfrastructurePlatform Player
FINANCIAL PERFORMANCE OF 5 PLAYERS MOST CLOSELY ALIGNED WITH EACH PURETONE(REVENUE-WEIGHTED AVERAGE)
14 Booz & Company
Six ICT Puretone Ways to Play
Network and infrastructure platform player: These companies make their revenues from developing, maintaining, and managing a stable shared resource, through which other parties can connect their wares to customer needs. This group includes vendors like Alcatel-Lucent that provide the “plumbing” for the computing age, as well as telecom operators like France Télécom, hardware companies like Toshiba that offer enterprise computing solutions, and software companies that manage operating systems. France Télécom is an example of a company that is trying to diverge from this way to play: It plans to acquire Dailymotion, a video sharing portal, and to develop a secure end-to-end platform cloud gateway. The top three players in this group took in US$158 billion in revenues in 2013.
Consolidator: These companies try to dominate one or several categories in their industry through acquisitions, with the goal of providing either value to consumers or access to a platform with products and services they would not otherwise be able to provide. And most of them boast a global sales and delivery footprint, giving the top three companies in the group combined revenues of $231 billion in 2013. Cisco Systems, for instance, uses this puretone to establish itself as a one-stop shop for networking solutions. Since 1993, it has acquired more than 120 companies of varying sizes and driven further consolidation through strategic partnerships with the likes of IBM and Symantec, while working to develop industry standards. Other companies in the group include Oracle, Microsoft, and Hewlett-Packard.
Innovator: These companies rely on their expertise in pursuing innovation and developing their global brands to generate highly targeted portfolios of products and services, rather than trying to be

15Booz & Company
all things to all customers. The innovators group comprises a variety of top consumer-oriented companies, including Apple, Google, and Amazon; these three companies together reached $268 billion in 2013 revenues.
Next-generation digitization player: This group includes traditional enterprise application software providers like SAP, Microsoft, and Cognizant that are moving quickly to provide customers with the most up-to-date products and services. Both SAP and Microsoft now offer cloud computing platforms that are forming the basis of their efforts to reposition themselves in a fast-digitizing world. The three strongest of these companies made $102 billion in revenues in 2013.
Solutions provider: These companies, many of them global IT services players, have the implementation capabilities necessary to provide business services to their customers, carefully integrating and adapting their offerings depending on the needs of their clients, in any industry. Both Accenture and IBM, for example, develop IT solutions that remain relevant to their enterprise customers through a dual strategy of consolidating their wide industry expertise within “innovation centers” and their delivery capability within “delivery centers.” Hitachi and Fujitsu also participate in this puretone, whose top three companies boasted $165 billion in combined 2013 revenues.
Global sourcing value player: These companies, primarily offshore IT services firms, leverage their low-cost workforces, sourced around the world, to sell high-quality business services in the largest global markets. Infosys, one of the most successful exponents of this puretone, gets 85 percent of its revenue from North America and Europe. Other examples include HCL and Wipro. The top three had combined revenues of $19 billion in 2013.

16 Booz & Company
The companies we analyzed in this study continue to move ahead in developing the products and services every business will need to succeed in the coming years. Companies in each sector continue to provide a relatively distinct set of offerings, yet they are all beginning to come together as the hardware, software, IT services, and telecom sectors converge.
We expect that the hardware and soft-ware sectors will continue to evolve into a “battle of the ecosystems,” with players from both sides trying to build a suite of products and services grounded in an anchor platform they can control and monetize. This strat-egy is taking two forms: Companies like Apple, Google, and Samsung (with Microsoft playing catch-up) are combining mobile devices with cloud services focused on the end-user, while others, including Amazon, Microsoft, Oracle, Salesforce.com, and SAP, are building their own cloud services play
focused on solutions and infrastruc-ture for the enterprise. This will likely leave the remaining pure-play hard-ware providers to pursue a commod-itization strategy with little room for differentiation—success will depend on scale, operational excellence, and a relentless focus on costs.
As to the IT service providers, the offshore players will need to expand their go-to-market and delivery footprint in mature markets, which will continue to account for more than 80 percent of global ICT spend for quite some time. That means they will have to use a greater share of high-cost labor in their production mix, and include more complex—and less profitable—outsourcing deals in their client portfolio. And because labor costs in their home markets are likely to rise as the middle class becomes more affluent, their cost advantage will begin to erode, and their growth rates and margins will converge with those of the global IT services firms. Still, if offshore players can maintain a long-term advan-tage based on their low-cost, lean, and standardized production model heritage as they expand, they should be able to keep their margins higher than those of their global services rivals. Meanwhile, the regional IT
services subsector will see further consolidation, either within the sector or through acquisitions by offshore players looking for beachheads in new markets. But even the deal that created Atos/SBS is not big enough to propel the combined company into the IBM/Accenture league. And integrating what are essentially people businesses after a merger tends to be lengthy and messy.
The telecom operators will continue to stagnate, bogged down by the huge costs of their perpetual reinvestment in next-generation networks and the constraints of their geographies. Furthermore, they face considerable cultural challenges in their efforts to move into sales of ICT solutions and to boost innovation. So they will likely continue to resell some IT services and partner with players with more advanced ICT offerings, but they are unlikely to develop the momentum to move into these sectors on their own anytime soon.
Ultimately, companies that do not develop the range of products and services that businesses increasingly demand will struggle to remain com-petitive. Those that do so will benefit as digitization continues to transform every industry.
THE ICT ECOSYSTEM
Companies in each sector continue to provide a relatively distinct set of offerings, yet they are beginning to come together as the sectors converge.

17Booz & Company
About the Authors
Olaf Acker is a partner with Booz & Company based in the firm’s Frankfurt and Dubai offices. He focuses on busi-ness technology strategy and operating model transforma-tion programs for global com-panies in the telecommunica-tions, media, and high-tech industries.
Hans Geerdes is a senior associate with Booz & Company based in Berlin. He specializes in IT strategy and large-scale trans-formation, with a focus on the communications industry.
Florian Gröne is a principal with Booz & Company based in New York. He works with communications, consumer, and media companies to reimagine digital customer experiences, products, and services, and to develop “digital first” organizational capabilities.
Germar Schröder is a prin-cipal with Booz & Company based in Frankfurt. He focuses on communications clients and ICT service providers, and has led several initiatives for product development, go-to-market, and operating model design, specifically for the cloud.

Booz & Company is a leading global management consulting firm focused on serving and shaping the senior agenda of the world’s leading institutions. Our founder, Edwin Booz, launched the profession when he established the first management consulting firm in Chicago in 1914. Today, we operate globally with more than 3,000 people in 58 offices around the world.
We believe passionately that essential advantage lies within and that a few differentiating capabilities drive any organization’s identity and success. We work with our clients to discover and build those capabilities that give them the right to win in their chosen markets.
We are a firm of practical strategists known for our functional expertise, industry foresight, and “sleeves rolled up” approach to working with our clients. To learn more about Booz & Company or to access its thought leadership, visit booz.com. Our award-winning management magazine, strategy+business, is available at strategy-business.com.
The most recentlist of our officesand affiliates, withaddresses andtelephone numbers,can be found onour website,booz.com.
Worldwide Offices
AsiaBeijingDelhiHong KongMumbaiSeoulShanghaiTaipeiTokyo
Australia,New Zealand & Southeast AsiaBangkokBrisbane
CanberraJakartaKuala LumpurMelbourneSydney
EuropeAmsterdamBerlinCopenhagenDüsseldorfFrankfurtHelsinkiIstanbul
LondonMadridMilanMoscowMunichParisRomeStockholmStuttgartViennaWarsawZurich
Middle EastAbu DhabiBeirutCairoDohaDubaiRiyadh
North AmericaAtlantaBostonChicagoClevelandDallasDC
DetroitFlorham ParkHoustonLos AngelesMexico CityNew York CityParsippanySan Francisco
South AmericaBuenos AiresRio de JaneiroSantiagoSão Paulo
©2013 Booz & Company Inc.