Embed Size (px)
Citation preview
Vietnam outlook Update Q2 2016
Long Tran Head of research
Please feel free to contact me at
P +84 4 39352722 (118)
M +84 906 959 034
S rongbeo
BSC
Content List
• Economy backdrop 03
• Global factors 05
• Domestic factors 08
• Stock market outlook 13
• Performance 15
• Liquidities and market cap rise 17
• About us 20
Economy backdropChallenging 30 years since “Doi Moi”
3
Key take away points
• Main customers: USA lead the growth, EU trouble with Brexit, Japan remain weak growth with Abenomics,
• China growth and policy are a source of region volatility,
• 30 years since “Doi moi”, Communist Party and Congress new 5 years term
• Vietnam GDP will rise fast compare to peers and more depending on FDI & FTA, Interest rate stable with high credit grow,
• Biggest challenging are State own enterprise restructuring, Banking system and fiscal policy,
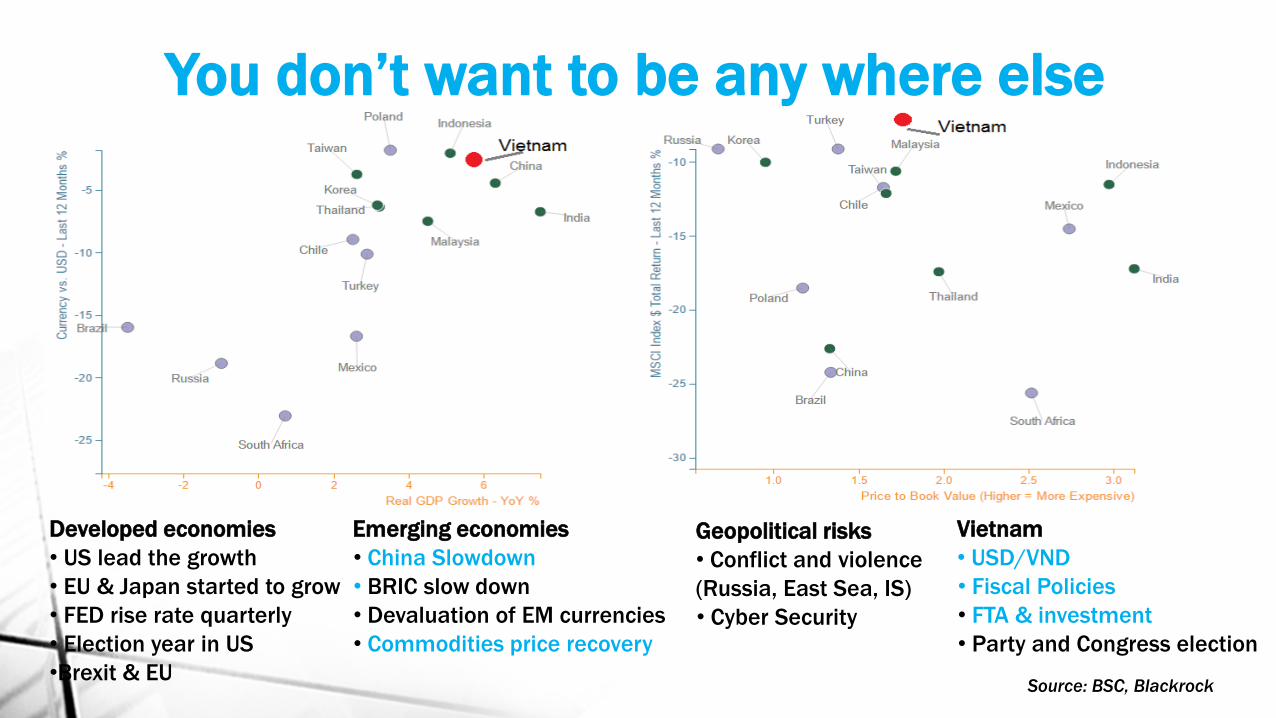
You don’t want to be any where else
Source: BSC, Blackrock
Emerging economies
• China Slowdown
• BRIC slow down
• Devaluation of EM currencies
• Commodities price recovery
Developed economies
• US lead the growth
• EU & Japan started to grow
• FED rise rate quarterly
• Election year in US
•Brexit & EU
Geopolitical risks
• Conflict and violence
(Russia, East Sea, IS)
• Cyber Security
Vietnam
• USD/VND
• Fiscal Policies
• FTA & investment
• Party and Congress election
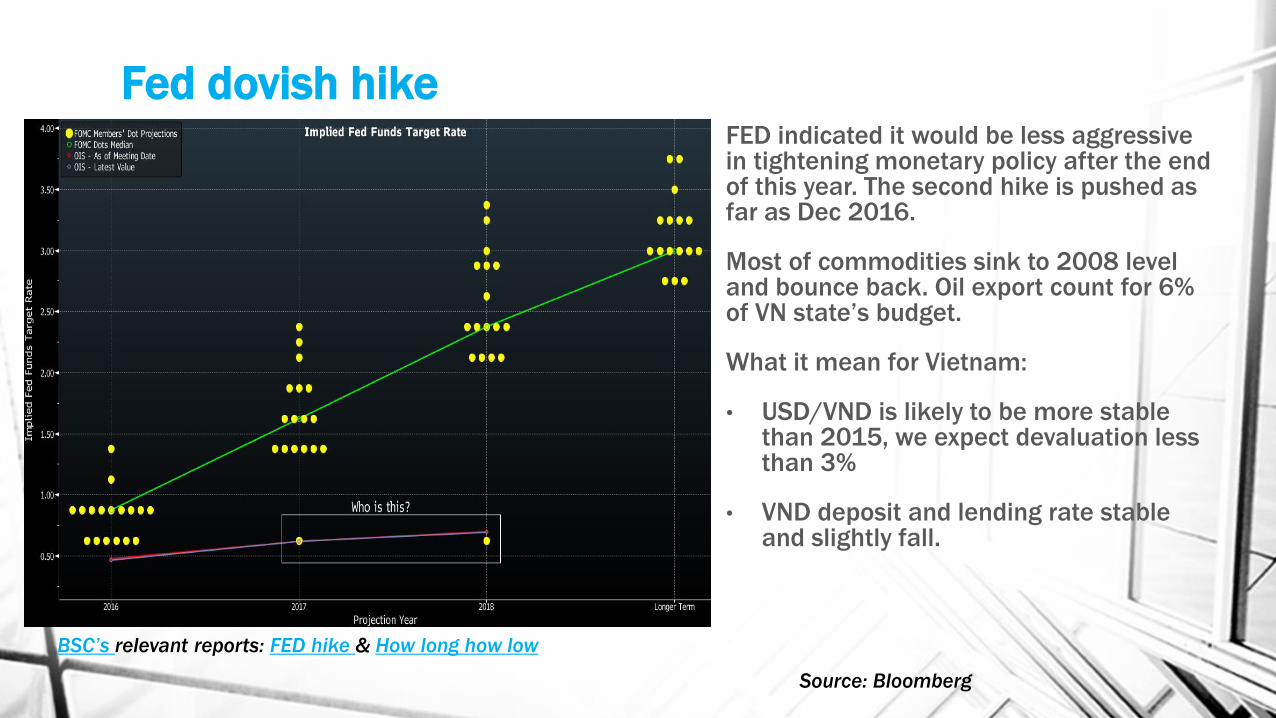
Fed dovish hikeFED indicated it would be less aggressive in tightening monetary policy after the end of this year. The second hike is pushed as far as Dec 2016.
Most of commodities sink to 2008 level and bounce back. Oil export count for 6% of VN state’s budget.
What it mean for Vietnam:
• USD/VND is likely to be more stable than 2015, we expect devaluation less than 3%
• VND deposit and lending rate stable and slightly fall.
Source: Bloomberg
BSC’s relevant reports: FED hike & How long how low
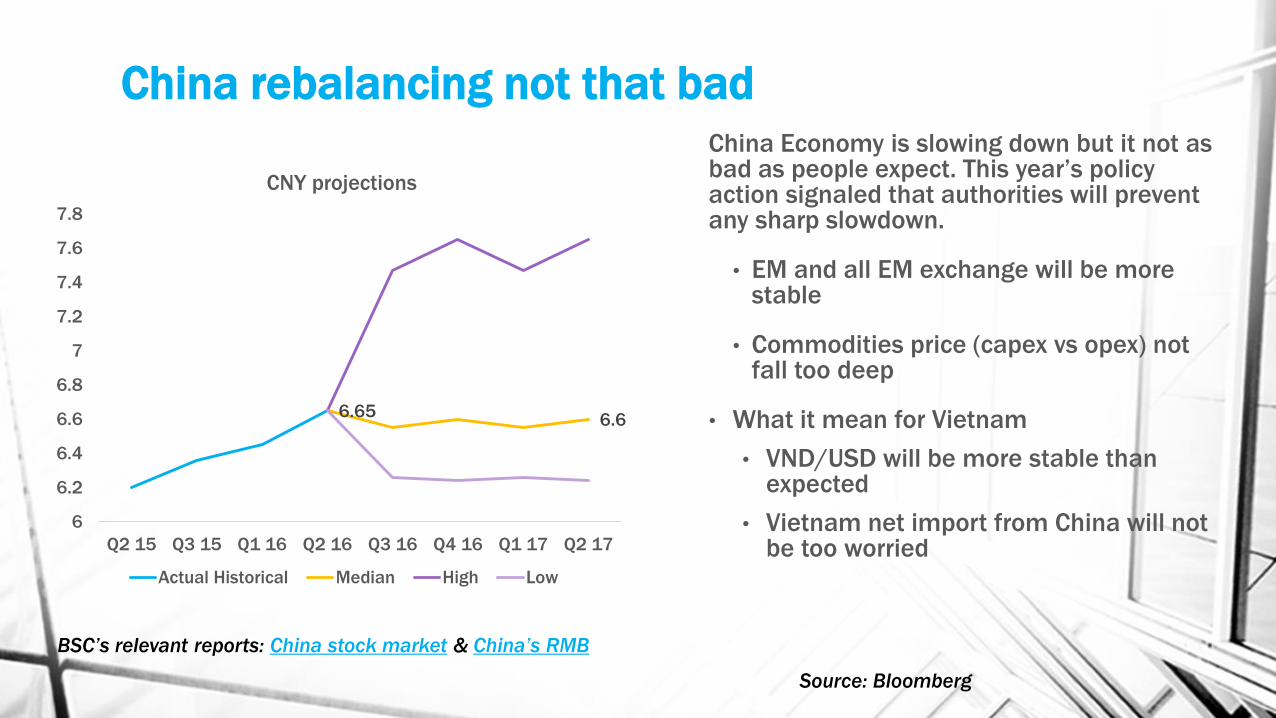
China rebalancing not that badChina Economy is slowing down but it not as bad as people expect. This year’s policy action signaled that authorities will prevent any sharp slowdown.
• EM and all EM exchange will be more stable
• Commodities price (capex vs opex) not fall too deep
• What it mean for Vietnam
• VND/USD will be more stable than expected
• Vietnam net import from China will not be too worried
Source: Bloomberg
BSC’s relevant reports: China stock market & China’s RMB
6.66.65
6
6.2
6.4
6.6
6.8
7
7.2
7.4
7.6
7.8
Q2 15 Q3 15 Q1 16 Q2 16 Q3 16 Q4 16 Q1 17 Q2 17
CNY projections
Actual Historical Median High Low
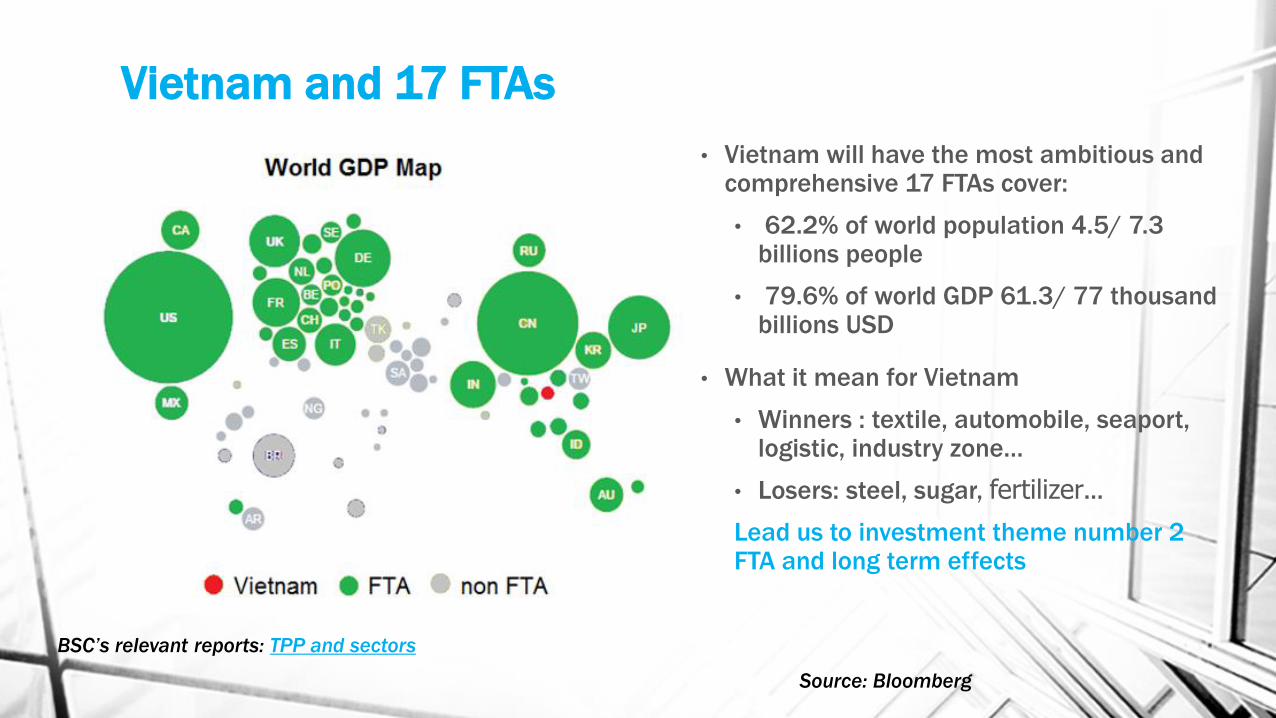
Vietnam and 17 FTAs
• Vietnam will have the most ambitious and comprehensive 17 FTAs cover:
• 62.2% of world population 4.5/ 7.3 billions people
• 79.6% of world GDP 61.3/ 77 thousand billions USD
• What it mean for Vietnam
• Winners : textile, automobile, seaport, logistic, industry zone…
• Losers: steel, sugar, fertilizer…
Lead us to investment theme number 2 FTA and long term effects
Source: Bloomberg
BSC’s relevant reports: TPP and sectors
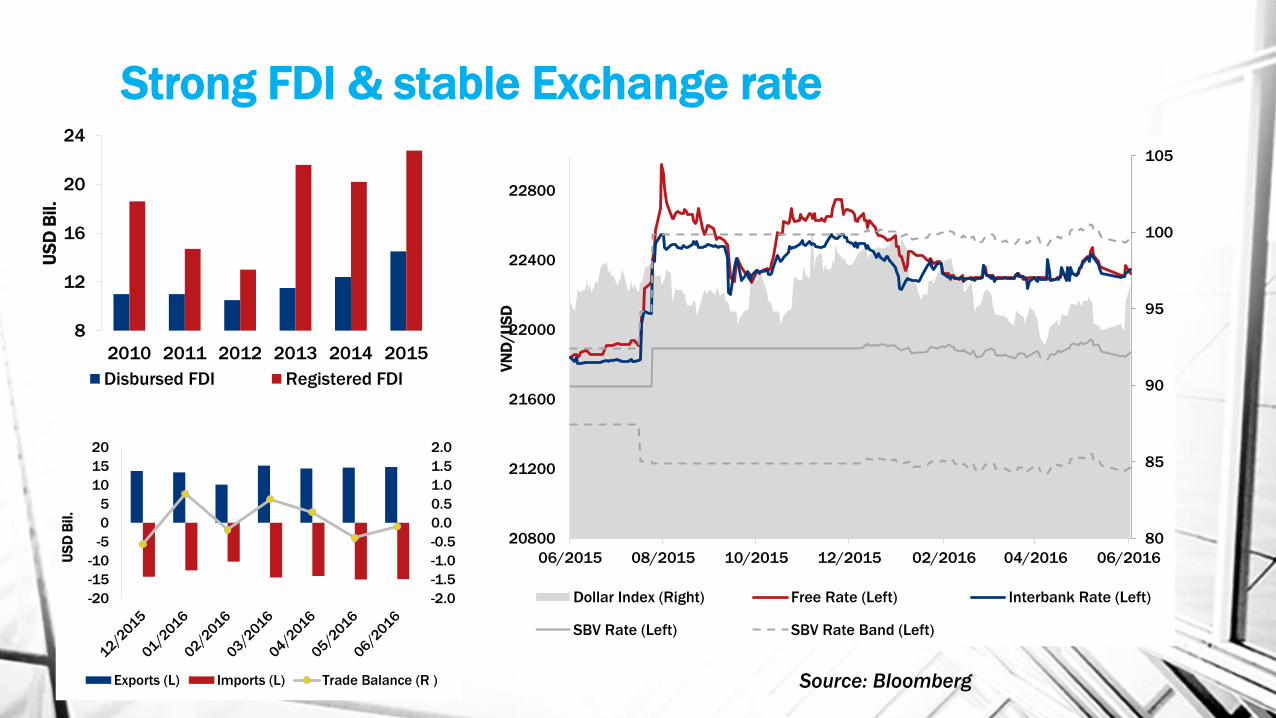
Strong FDI & stable Exchange rate
Source: Bloomberg
8
12
16
20
24
2010 2011 2012 2013 2014 2015
US
D B
il.
Disbursed FDI Registered FDI
80
85
90
95
100
105
20800
21200
21600
22000
22400
22800
06/2015 08/2015 10/2015 12/2015 02/2016 04/2016 06/2016
VN
D/U
SD
Dollar Index (Right) Free Rate (Left) Interbank Rate (Left)
SBV Rate (Left) SBV Rate Band (Left)
-2.0
-1.5
-1.0
-0.5
0.0
0.5
1.0
1.5
2.0
-20
-15
-10
-5
0
5
10
15
20
US
D B
il.
Exports (L) Imports (L) Trade Balance (R )
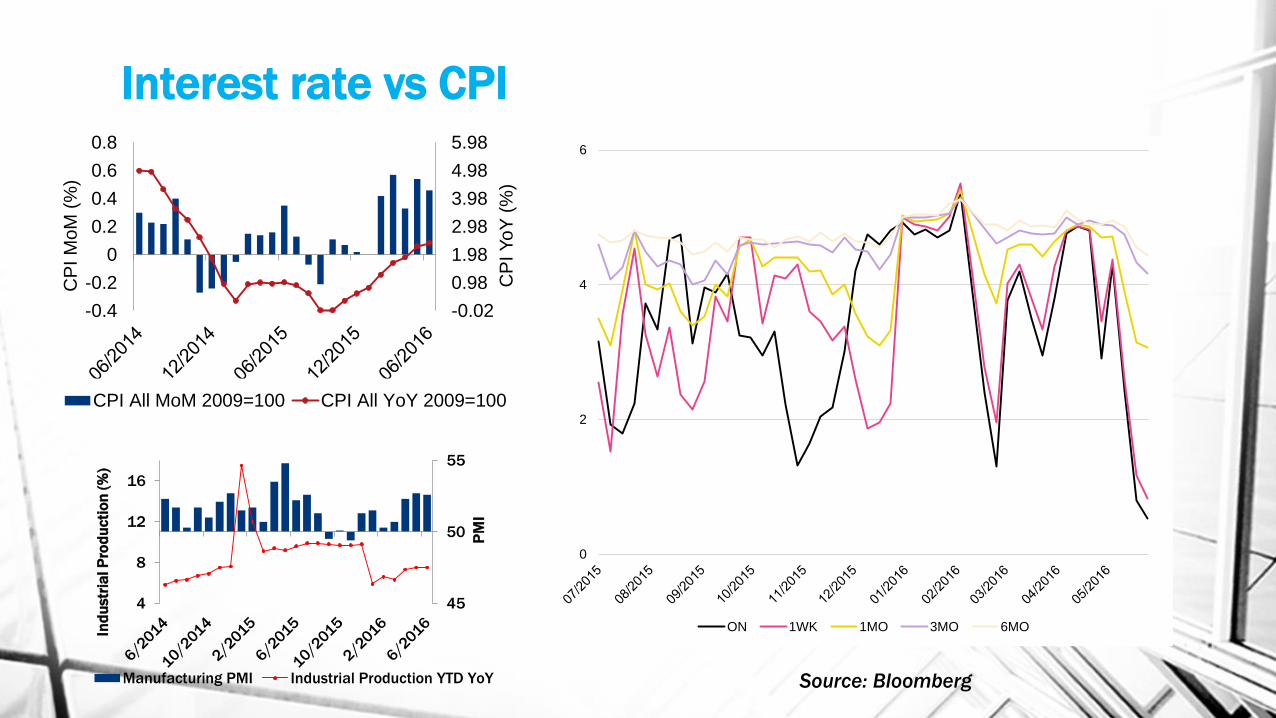
Interest rate vs CPI
Source: Bloomberg
-0.02
0.98
1.98
2.98
3.98
4.98
5.98
-0.4
-0.2
0
0.2
0.4
0.6
0.8
CP
I Y
oY
(%
)
CP
I M
oM
(%
)
CPI All MoM 2009=100 CPI All YoY 2009=100
4
8
12
16
45
50
55
Ind
ustr
ial P
rod
ucti
on
(%
)
PM
I
Manufacturing PMI Industrial Production YTD YoY
0
2
4
6
ON 1WK 1MO 3MO 6MO
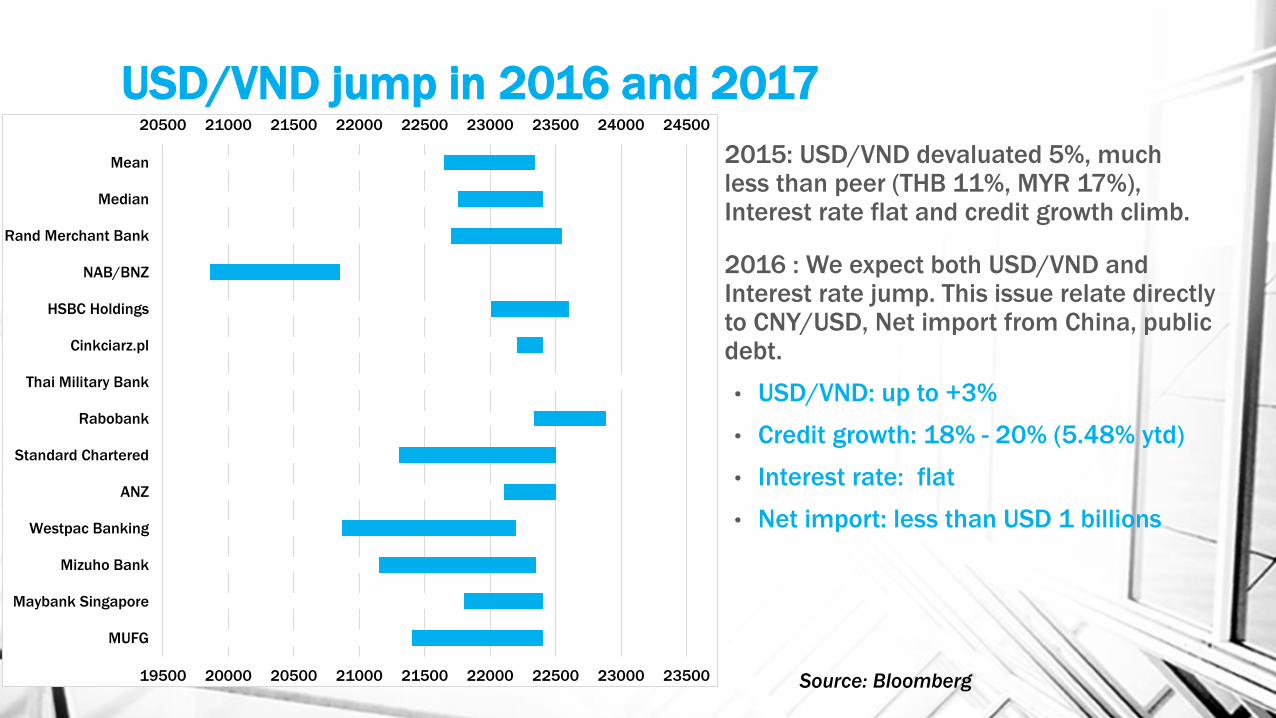
USD/VND jump in 2016 and 2017
• 2015: USD/VND devaluated 5%, much less than peer (THB 11%, MYR 17%), Interest rate flat and credit growth climb.
• 2016 : We expect both USD/VND and Interest rate jump. This issue relate directly to CNY/USD, Net import from China, public debt.
• USD/VND: up to +3%
• Credit growth: 18% - 20% (5.48% ytd)
• Interest rate: flat
• Net import: less than USD 1 billions
Source: Bloomberg
20500 21000 21500 22000 22500 23000 23500 24000 24500
19500 20000 20500 21000 21500 22000 22500 23000 23500
MUFG
Maybank Singapore
Mizuho Bank
Westpac Banking
ANZ
Standard Chartered
Rabobank
Thai Military Bank
Cinkciarz.pl
HSBC Holdings
NAB/BNZ
Rand Merchant Bank
Median
Mean
6.686.78
6.36.5
3
4
5
6
7
8
9
2007 2008 2009 2010 2011 2012 2013 2014 2015 2016 2017
Actual Historical Median Forward High Low
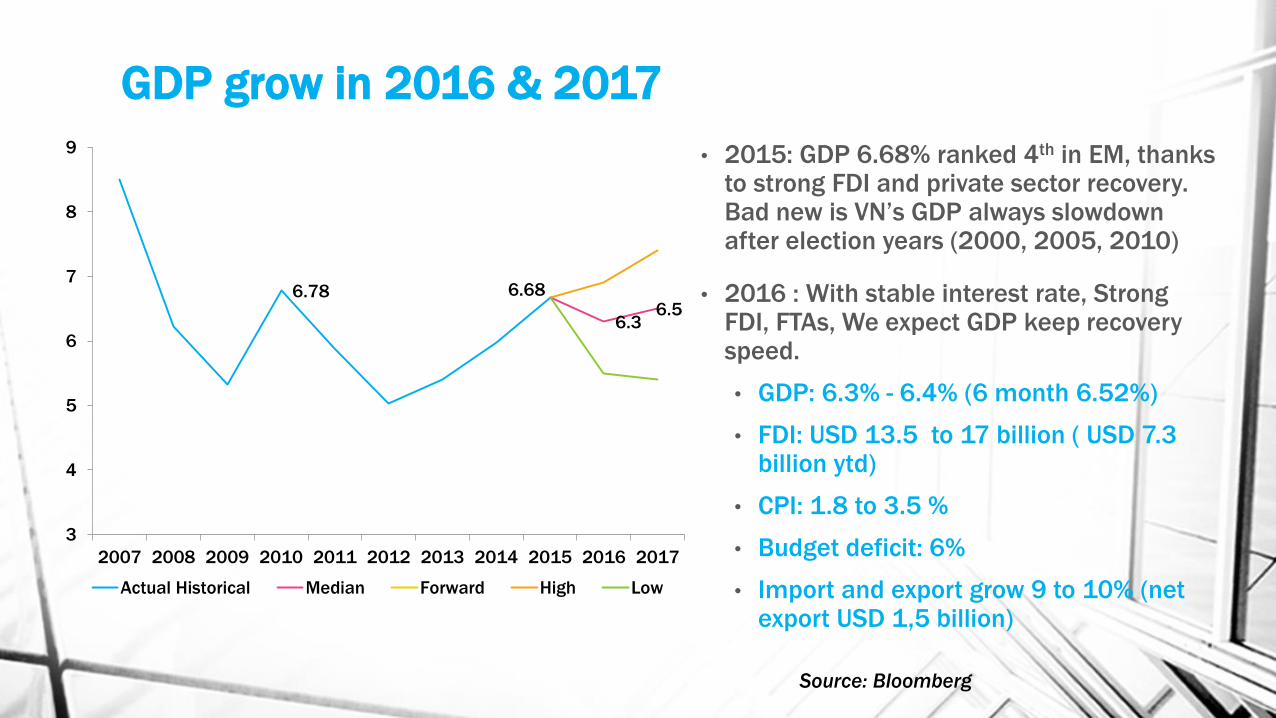
GDP grow in 2016 & 2017
• 2015: GDP 6.68% ranked 4th in EM, thanks to strong FDI and private sector recovery. Bad new is VN’s GDP always slowdown after election years (2000, 2005, 2010)
• 2016 : With stable interest rate, Strong FDI, FTAs, We expect GDP keep recovery speed.
• GDP: 6.3% - 6.4% (6 month 6.52%)
• FDI: USD 13.5 to 17 billion ( USD 7.3 billion ytd)
• CPI: 1.8 to 3.5 %
• Budget deficit: 6%
• Import and export grow 9 to 10% (net export USD 1,5 billion)
Source: Bloomberg
Stock market OutlookAlpha seeking rather than Beta
13
Key take away points
• 2016 is not so exciting for global stock market, but Vietnam will be benefit from FTA and strong state own enterprise restructuring
• Valuation multiples is attractive compare to Asian peers.
• Market depend on earning which is expect to pick up around 10%
• Stock market liquidity rise due to (1) stable USD/VND and interest rate; (2) Privatization process is pushed, listed market cap will rise
VN-Index, 8.3%
MXEF, 1.4%
MXFM, -3.7%
MXWO, -3.8%
(15.0)
(10.0)
(5.0)
-
5.0
10.0
15.0
12/31/15 1/31/16 2/29/16 3/31/16 4/30/16 5/31/16
MXWO Index MXFM Index MXEF Index VNINDEX
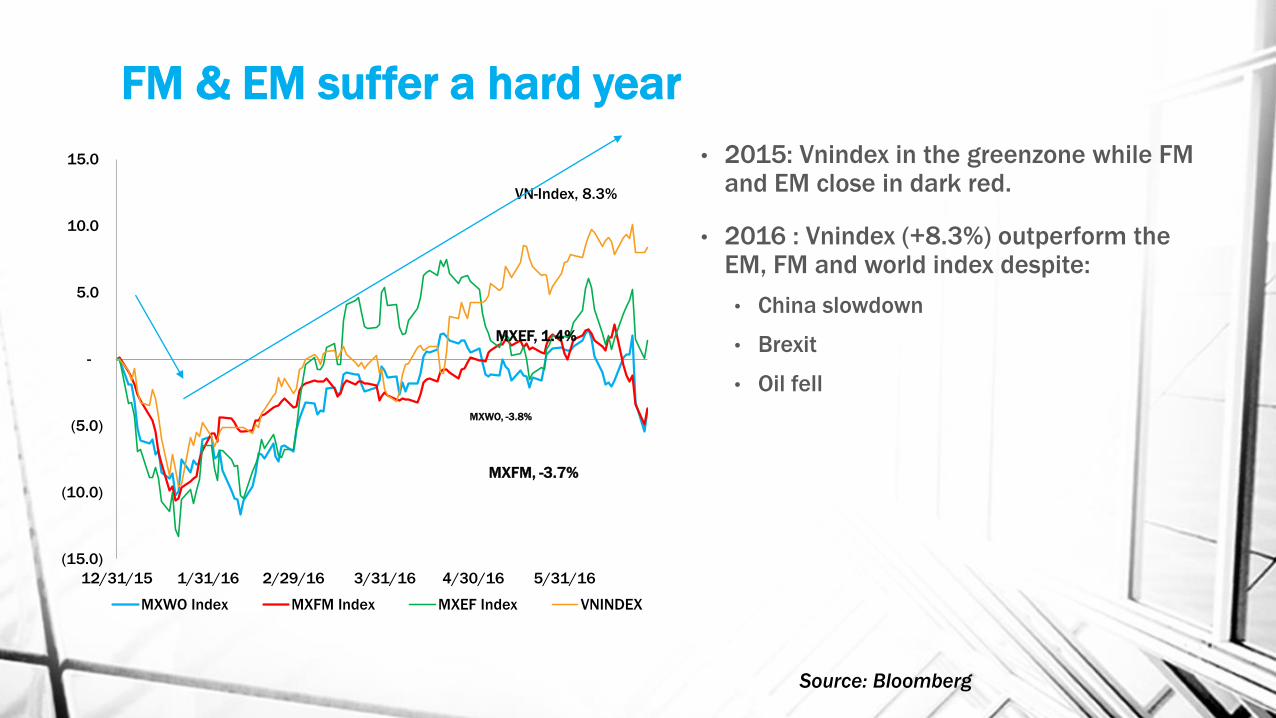
FM & EM suffer a hard year
• 2015: Vnindex in the greenzone while FM and EM close in dark red.
• 2016 : Vnindex (+8.3%) outperform the EM, FM and world index despite:
• China slowdown
• Brexit
• Oil fell
Source: Bloomberg
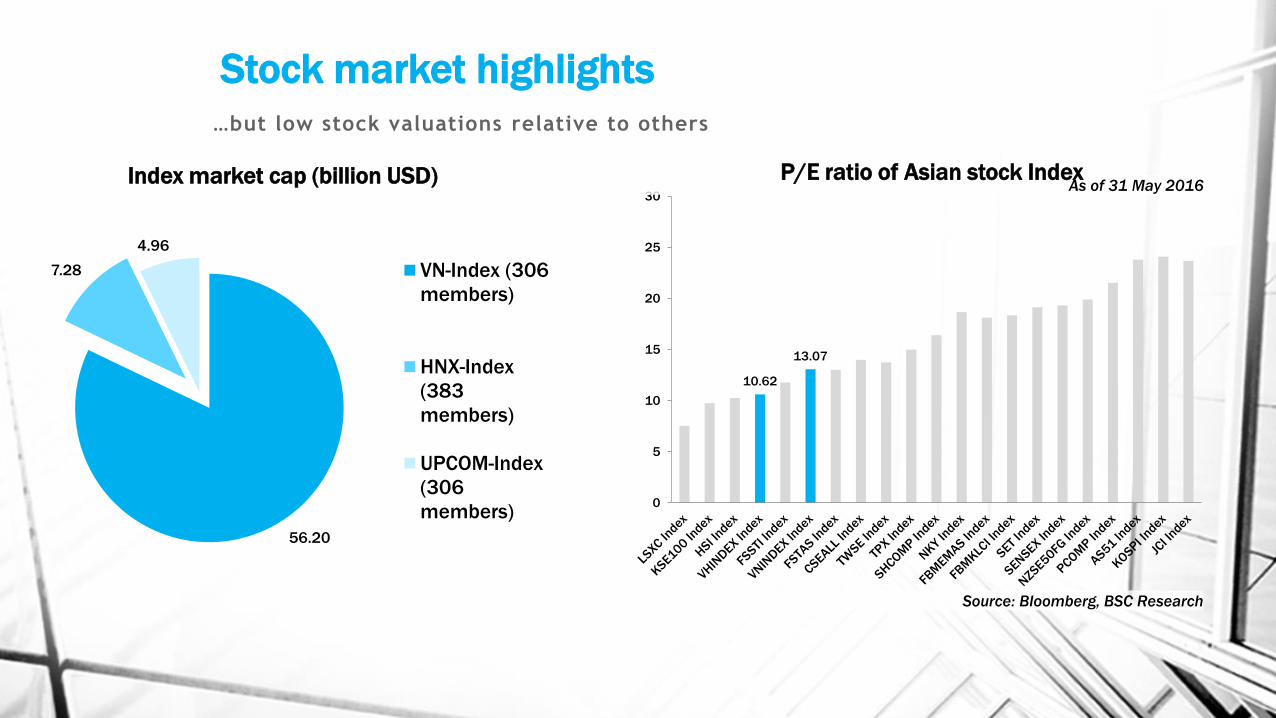
Stock market highlights
…but low stock valuations relative to others
10.62
13.07
0
5
10
15
20
25
30
Source: Bloomberg, BSC Research
As of 31 May 2016
56.20
7.28
4.96
Index market cap (billion USD)
VN-Index (306
members)
HNX-Index
(383
members)
UPCOM-Index
(306
members)
P/E ratio of Asian stock Index
3,072
-
500
1,000
1,500
2,000
2,500
3,000
3,500
06/15 08/15 10/15 12/15 02/16 04/16 06/16
Average Turnover 3 per.Mov.Avg
Bil.VND
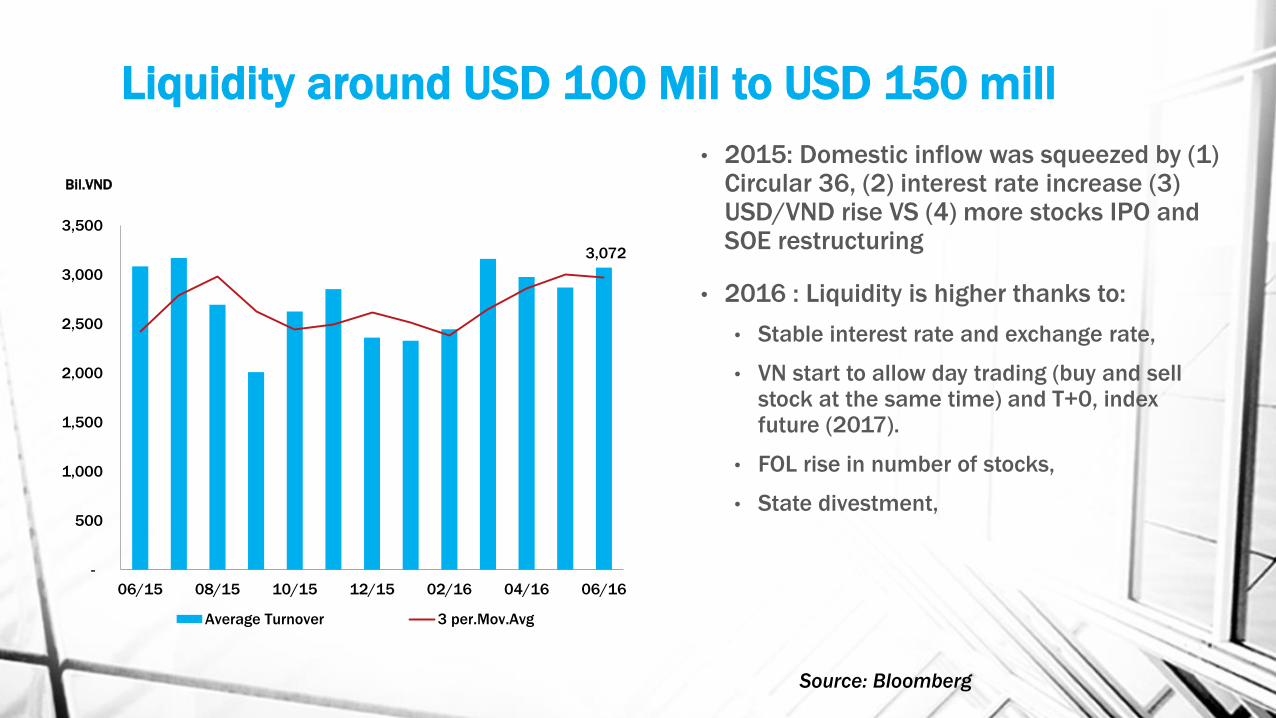
Liquidity around USD 100 Mil to USD 150 mill
• 2015: Domestic inflow was squeezed by (1) Circular 36, (2) interest rate increase (3) USD/VND rise VS (4) more stocks IPO and SOE restructuring
• 2016 : Liquidity is higher thanks to:
• Stable interest rate and exchange rate,
• VN start to allow day trading (buy and sell stock at the same time) and T+0, index future (2017).
• FOL rise in number of stocks,
• State divestment,
Source: Bloomberg
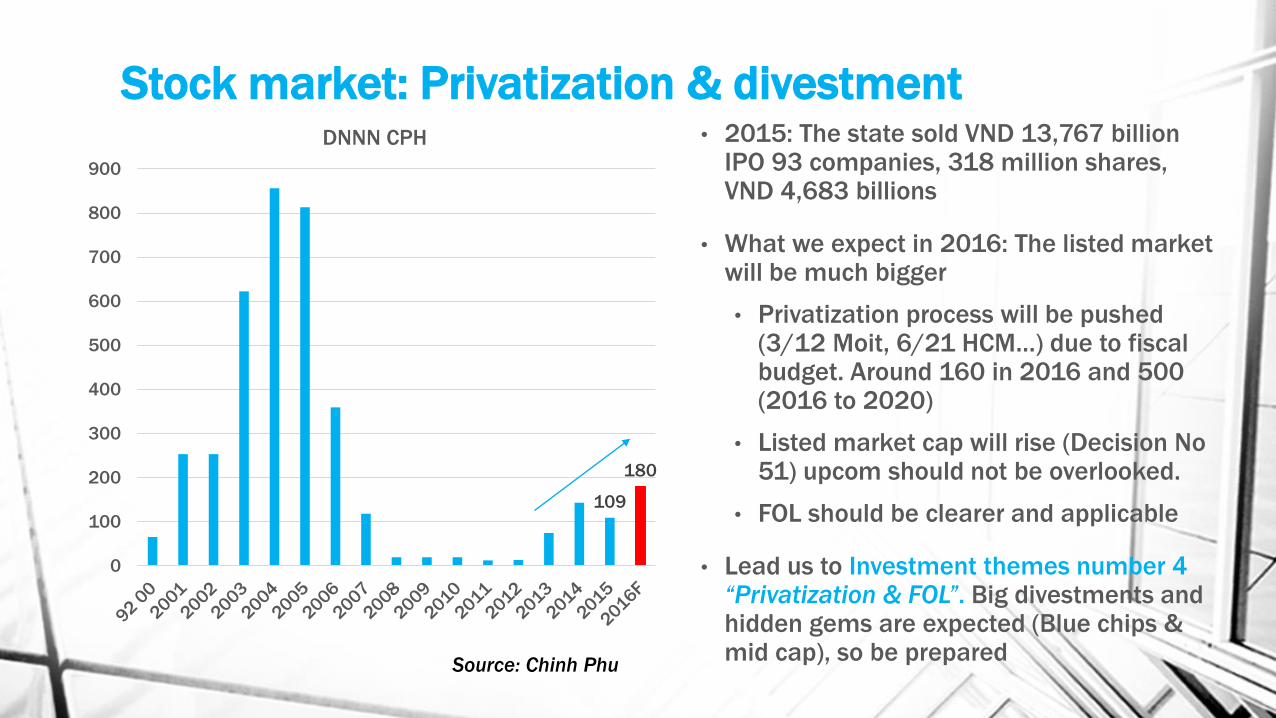
Stock market: Privatization & divestment• 2015: The state sold VND 13,767 billion
IPO 93 companies, 318 million shares, VND 4,683 billions
• What we expect in 2016: The listed market will be much bigger
• Privatization process will be pushed (3/12 Moit, 6/21 HCM…) due to fiscal budget. Around 160 in 2016 and 500 (2016 to 2020)
• Listed market cap will rise (Decision No 51) upcom should not be overlooked.
• FOL should be clearer and applicable
• Lead us to Investment themes number 4 “Privatization & FOL”. Big divestments and hidden gems are expected (Blue chips & mid cap), so be prepared
Source: Chinh Phu
109
180
0
100
200
300
400
500
600
700
800
900
DNNN CPH
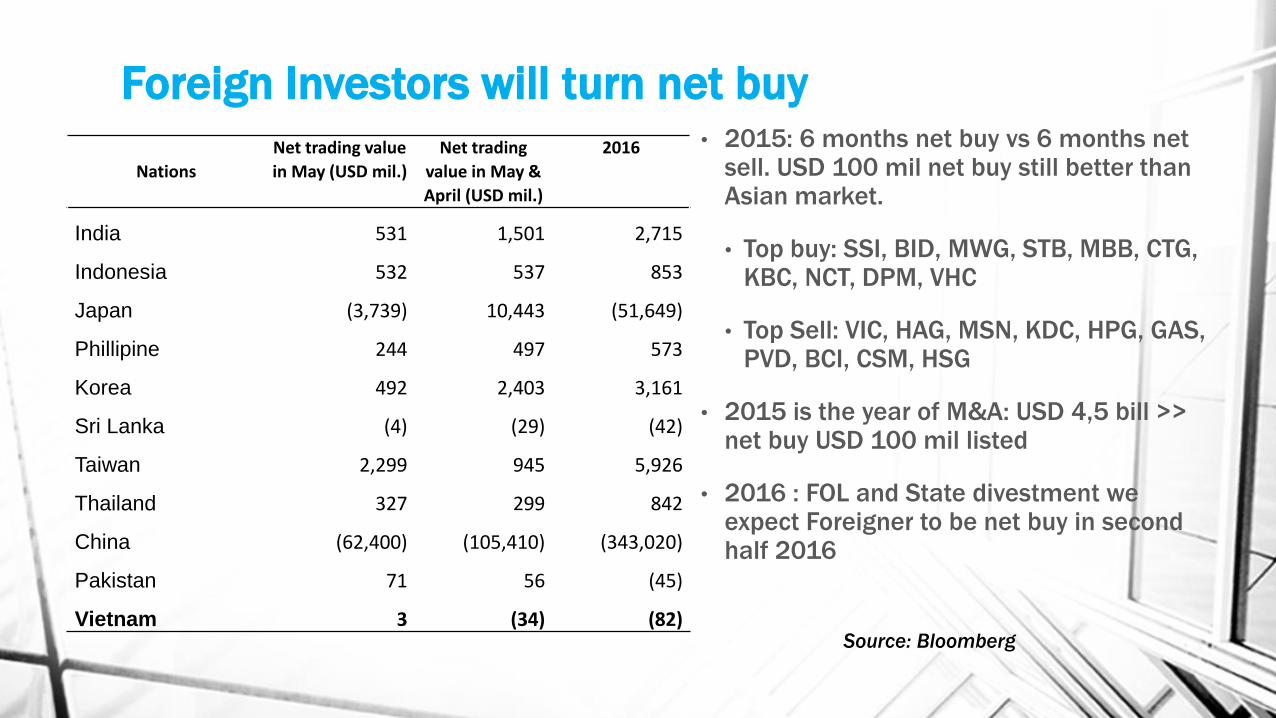
Foreign Investors will turn net buy• 2015: 6 months net buy vs 6 months net
sell. USD 100 mil net buy still better than Asian market.
• Top buy: SSI, BID, MWG, STB, MBB, CTG, KBC, NCT, DPM, VHC
• Top Sell: VIC, HAG, MSN, KDC, HPG, GAS, PVD, BCI, CSM, HSG
• 2015 is the year of M&A: USD 4,5 bill >> net buy USD 100 mil listed
• 2016 : FOL and State divestment we expect Foreigner to be net buy in second half 2016
Source: Bloomberg
Nations
Net trading value
in May (USD mil.)
Net trading
value in May &
April (USD mil.)
2016
India 531 1,501 2,715
Indonesia 532 537 853
Japan (3,739) 10,443 (51,649)
Phillipine 244 497 573
Korea 492 2,403 3,161
Sri Lanka (4) (29) (42)
Taiwan 2,299 945 5,926
Thailand 327 299 842
China (62,400) (105,410) (343,020)
Pakistan 71 56 (45)
Vietnam 3 (34) (82)
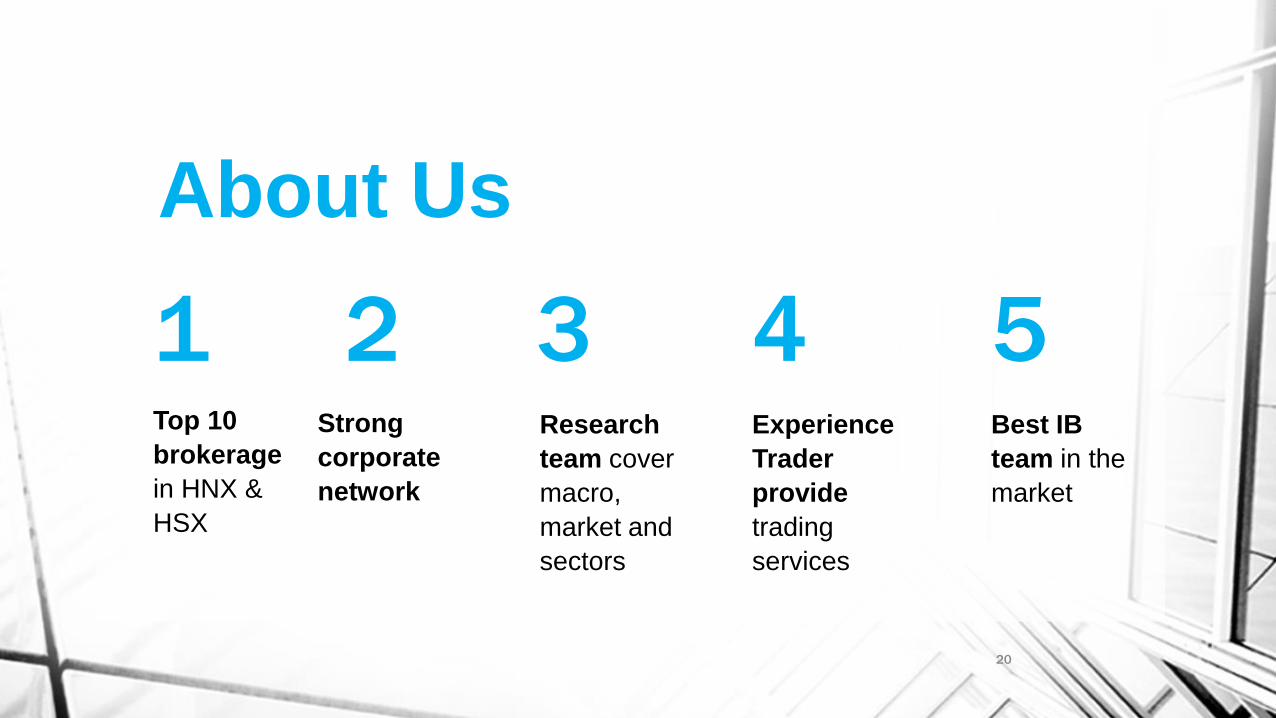
About Us
20
Top 10
brokerage
in HNX &
HSX
Strong
corporate
network
Research
team cover
macro,
market and
sectors
Experience
Trader
provide
trading
services
Best IB
team in the
market
1 2 3 4 5
Thanks for your supports and confidence in us
Long Tran Head of research
Please feel free to contact me at
P +84 4 39352722 (118)
M +84 906 959 034
S rongbeo
BSC