Embed Size (px)
Citation preview

Presented by Naomi Nicholson
We will cover: What goes into Cash Flow Statement Operating cost forecasts Completing a draft Cash Flow
Understanding Cash Flow
Need to know how many employees you will need
Need to make promotional decisions
Need to plan what will be needed to make it happen◦ Ie; amount of product to make, equipment needed,
etc.
Why?
Know everything you can about them
Focus on customers that will bring you the MOST money (80/20Rule)
Understand their demographics, income levels, buying habits, hobbies and interests, age group, education and employment categories, etc.
Not everybody is your target customer!
It All Starts With Your Customer
How does your product assist in solving your customers’ problems or needs?
When does your customer decide they want your product?
When does your customer order/pay for their product? How?
Customer and Your Product
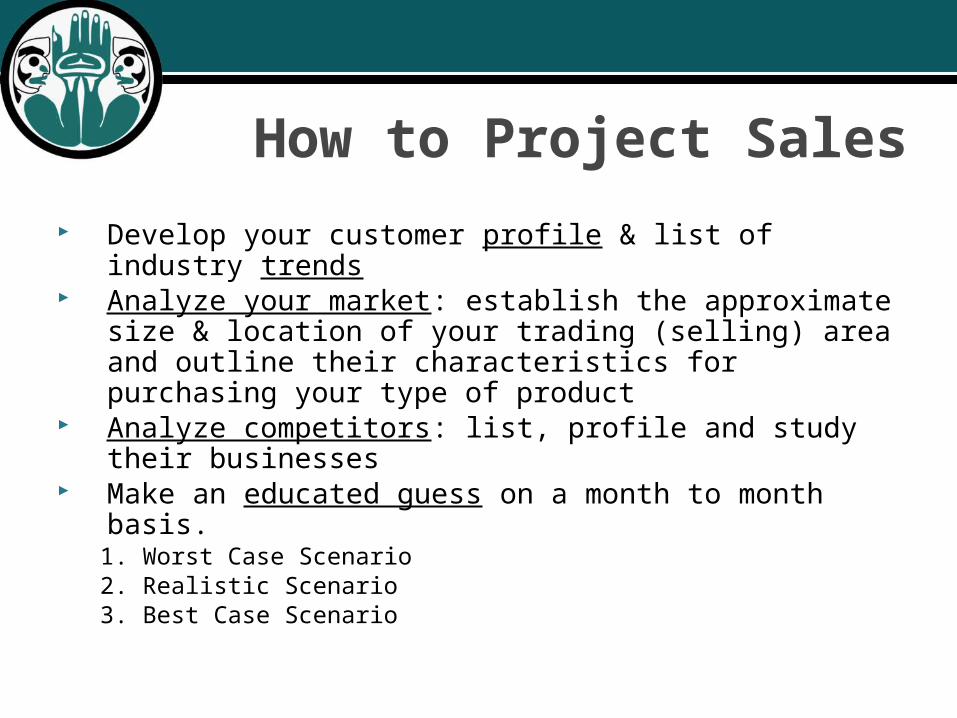
Develop your customer profile & list of industry trends
Analyze your market: establish the approximate size & location of your trading (selling) area and outline their characteristics for purchasing your type of product
Analyze competitors: list, profile and study their businesses
Make an educated guess on a month to month basis.1. Worst Case Scenario2. Realistic Scenario3. Best Case Scenario
How to Project Sales
How much will we sell in the future?
Organize & analyze information to estimate what your sales will be
Prepare a separate sales forecast for each service or product group and them compile them into one.
Sales Forecasting
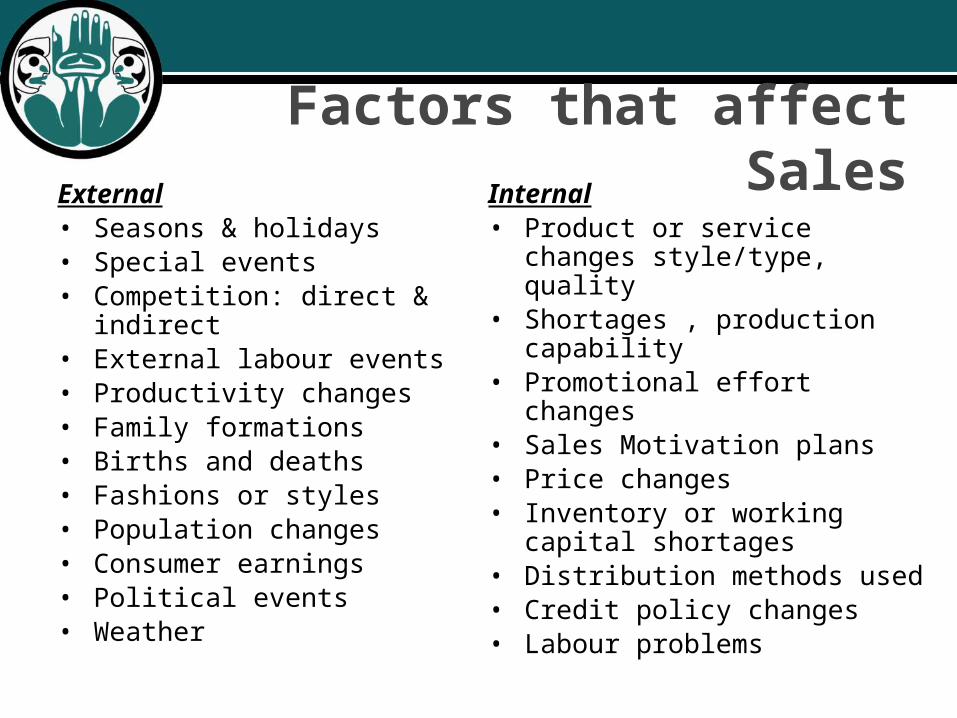
Factors that affect SalesExternal• Seasons & holidays• Special events• Competition: direct &
indirect• External labour events• Productivity changes• Family formations• Births and deaths• Fashions or styles• Population changes• Consumer earnings• Political events• Weather
Internal• Product or service changes
style/type, quality• Shortages , production
capability• Promotional effort changes• Sales Motivation plans• Price changes• Inventory or working capital
shortages• Distribution methods used• Credit policy changes• Labour problems
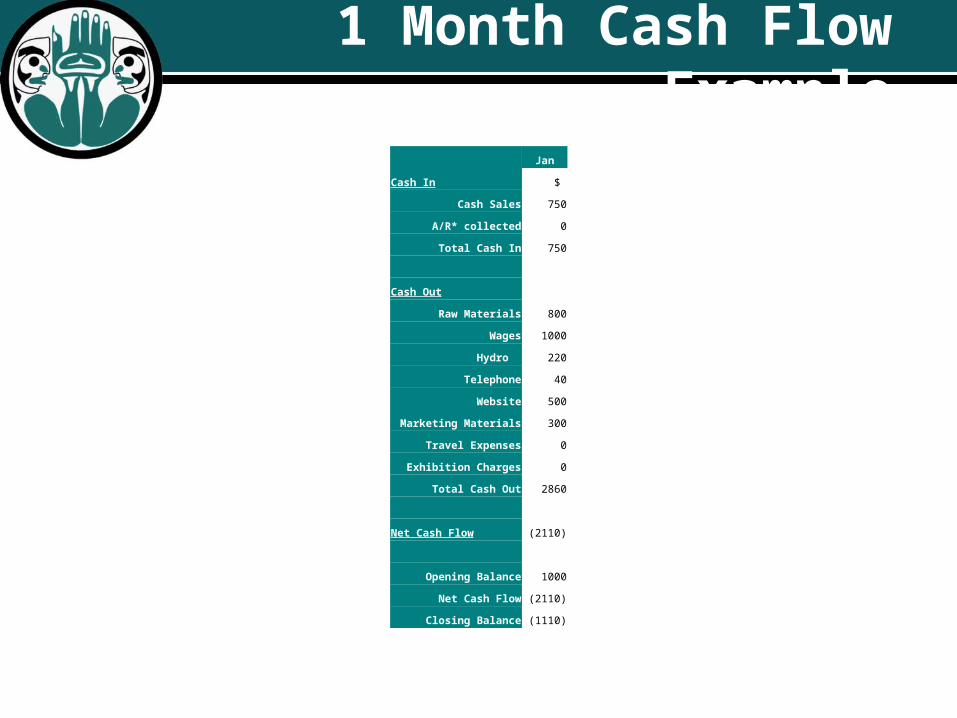
1 Month Cash Flow Example
Jan
Cash In $
Cash Sales 750
A/R* collected 0
Total Cash In 750
Cash Out
Raw Materials 800
Wages 1000
Hydro 220
Telephone 40
Website 500
Marketing Materials 300
Travel Expenses 0
Exhibition Charges 0
Total Cash Out 2860
Net Cash Flow (2110)
Opening Balance 1000
Net Cash Flow (2110)
Closing Balance (1110)
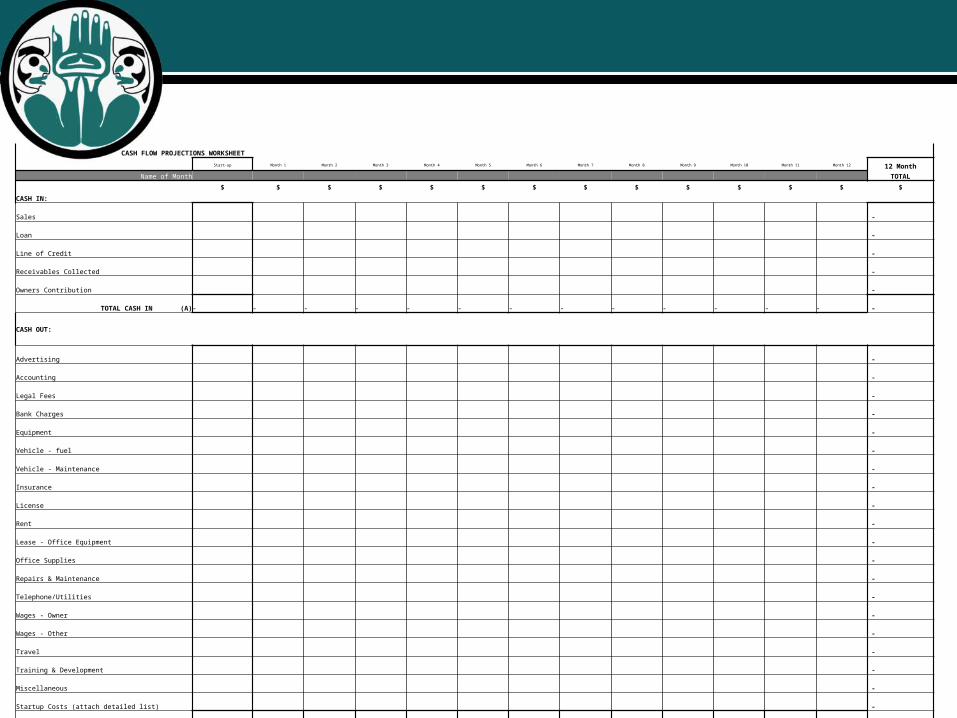
CASH FLOW PROJECTIONS WORKSHEET
Start-up Month 1 Month 2 Month 3 Month 4 Month 5 Month 6 Month 7 Month 8 Month 9 Month 10 Month 11 Month 12 12 Month
Name of Month TOTAL
$ $ $ $ $ $ $ $ $ $ $ $ $ $
CASH IN:
Sales -
Loan -
Line of Credit -
Receivables Collected -
Owners Contribution -
TOTAL CASH IN (A) - - - - - - - - - - - - - -
CASH OUT:
Advertising -
Accounting -
Legal Fees -
Bank Charges -
Equipment -
Vehicle - fuel -
Vehicle - Maintenance -
Insurance -
License -
Rent -
Lease - Office Equipment -
Office Supplies -
Repairs & Maintenance -
Telephone/Utilities -
Wages - Owner -
Wages - Other -
Travel -
Training & Development -
Miscellaneous -
Startup Costs (attach detailed list) -
TOTAL CASH OUT (B) - - - - - - - - - - - - - -
NET CASH (C=(A-B) ) - - - - - - - - - - - - - -
Term Debt: ( loan payments)
Loan 1 (NEDC) -
Loan 2 (Line of Credit) -
TOTAL TERM DEBT (D) - - - - - - - - - - - - -
+ Incr./ - Decr. in Cash (E=(C-D) ) - - - - - - - - - - - - -
Cash - Beginning of Month (F) - - - - - - - - - - - -
Cash - End of Month (G=(E+F) ) - - - - - - - - - - - - -
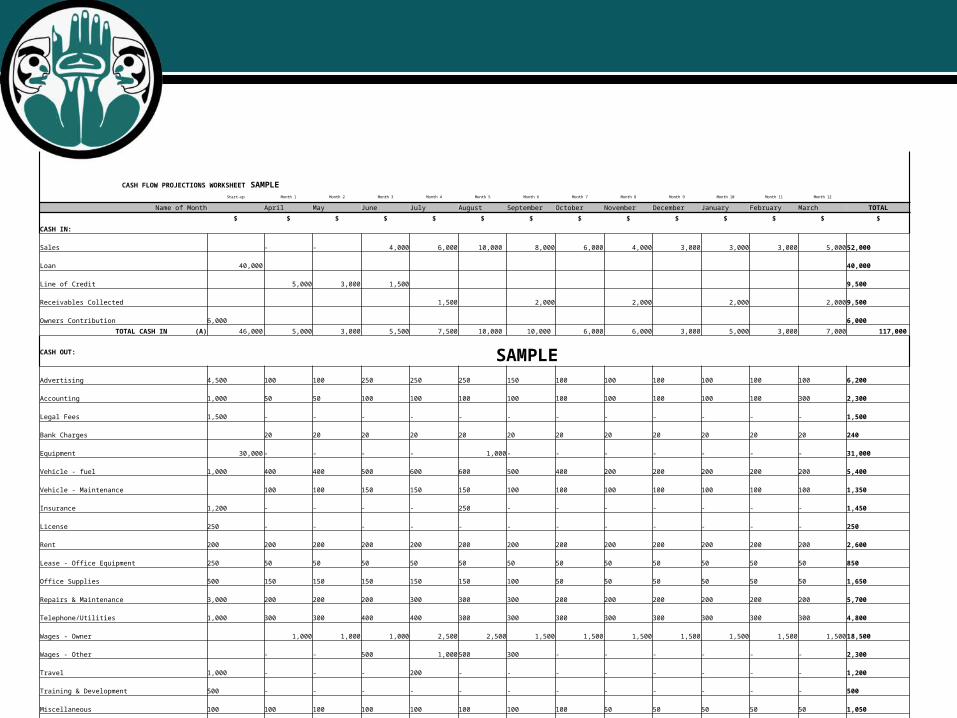
CASH FLOW PROJECTIONS WORKSHEET SAMPLE
Start-up Month 1 Month 2 Month 3 Month 4 Month 5 Month 6 Month 7 Month 8 Month 9 Month 10 Month 11 Month 12
Name of Month April May June July August September October November December January February March TOTAL
$ $ $ $ $ $ $ $ $ $ $ $ $ $
CASH IN:
Sales - - 4,000 6,000 10,000 8,000 6,000 4,000 3,000 3,000 3,000 5,000 52,000
Loan 40,000 40,000
Line of Credit 5,000 3,000 1,500 9,500
Receivables Collected 1,500 2,000 2,000 2,000 2,000 9,500
Owners Contribution 6,000 6,000
TOTAL CASH IN (A) 46,000 5,000 3,000 5,500 7,500 10,000 10,000 6,000 6,000 3,000 5,000 3,000 7,000 117,000
SAMPLE
CASH OUT:
Advertising 4,500 100 100 250 250 250 150 100 100 100 100 100 100 6,200
Accounting 1,000 50 50 100 100 100 100 100 100 100 100 100 300 2,300
Legal Fees 1,500 - - - - - - - - - - - - 1,500
Bank Charges 20 20 20 20 20 20 20 20 20 20 20 20 240
Equipment 30,000 - - - - 1,000 - - - - - - - 31,000
Vehicle - fuel 1,000 400 400 500 600 600 500 400 200 200 200 200 200 5,400
Vehicle - Maintenance 100 100 150 150 150 100 100 100 100 100 100 100 1,350
Insurance 1,200 - - - - 250 - - - - - - - 1,450
License 250 - - - - - - - - - - - - 250
Rent 200 200 200 200 200 200 200 200 200 200 200 200 200 2,600
Lease - Office Equipment 250 50 50 50 50 50 50 50 50 50 50 50 50 850 Office Supplies 500 150 150 150 150 150 100 50 50 50 50 50 50 1,650
Repairs & Maintenance 3,000 200 200 200 300 300 300 200 200 200 200 200 200 5,700
Telephone/Utilities 1,000 300 300 400 400 300 300 300 300 300 300 300 300 4,800
Wages - Owner 1,000 1,000 1,000 2,500 2,500 1,500 1,500 1,500 1,500 1,500 1,500 1,500 18,500
Wages - Other - - 500 1,000 500 300 - - - - - - 2,300
Travel 1,000 - - - 200 - - - - - - - - 1,200
Training & Development 500 - - - - - - - - - - - - 500
Miscellaneous 100 100 100 100 100 100 100 100 50 50 50 50 50 1,050
TOTAL CASH OUT (B) 46,000 2,670 2,670 3,620 6,020 6,470 3,720 3,120 2,870 2,870 2,870 2,870 3,070 88,840
NET CASH (C=(A-B) ) - 2,330 330 1,880 1,480 3,530 6,280 2,880 3,130 130 2,130 130 3,930 28,160
Term Debt: ( loan payments)
Loan 1 (NEDC) 890 890 890 890 890 890 890 890 890 890 890 890 10,680
Loan 2 (Line of Credit) 500 800 900 2,000 4,000 2,100 10,300
TOTAL TERM DEBT (D) - 890 1,390 1,690 1,790 2,890 4,890 2,990 890 890 890 890 890 20,980
+ Incr./ - Decr. in Cash (E=(C-D) ) - 1,440 (1,060) 190 (310) 640 1,390 (110) 2,240 (760) 1,240 (760) 3,040 7,180
Cash - Beginning of Month (F) - - 1,440 380 570 260 900 2,290 2,180 4,420 3,660 4,900 4,140
Cash - End of Month (G=(E+F) ) - 1,440 380 570 260 900 2,290 2,180 4,420 3,660 4,900 4,140 7,180
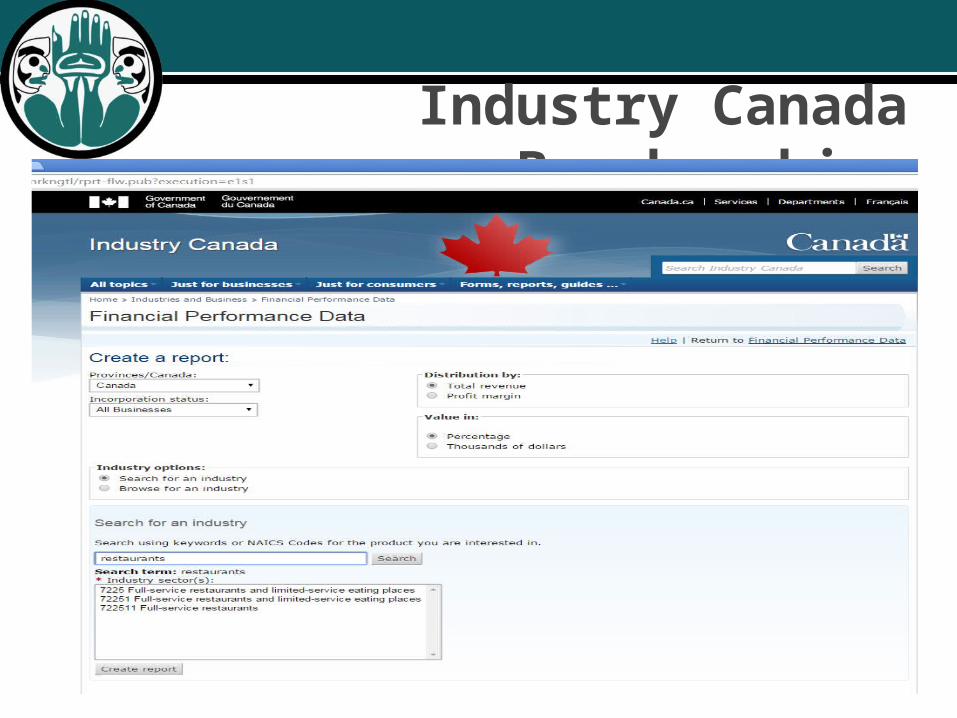
Industry Canada Benchmarking
Based on your business idea what down as many things you can think of ?
Remember to add realistic bank fees/debit or credit fees as these are per item charges
What Needs to go in Your Cashflow?
Sales doesn’t mean cash in all businesses
If you make a sale you may sell on credit although you have to record when the sale was made◦ Contractors; take deposits and partial payments◦ Gift Cards◦ Personal Equity deposits◦ Lines of Credit◦ Credit Cards
Sources of Cash
What is Outgoing or Cash Expenditures
Payment of cash or cash equivalent for goods or services, charge against
available funds in settlement of an obligation as evidenced by an invoice, receipt, voucher, or other such document.
http://www.businessdictionary.com/definition/expenditure.html#ixzz3gT099lmf
Cash
Research buying or leasing-either isn’t always better
Check around for pricing and don’t be scared to tell them that you are shopping around for best price
Know your costs-research and print items
How to Reduce Costs
Income Statement will show the same insurance expense every month although you paid it all at once
Cash flow will show the lump sum amount paid
Income Statement vs Cash Flow
To drag a number in a cell across the whole row grab the bottom left of the cell and drag
Linking cells: on the empty row hit ‘=‘ and go the information you want to link and click enter
Writing formulas: always start with ‘=‘
When adding cells you can either 1) highlight the column or row and hit autosum or 2) in the cell write a formula by typing =sum and clicking on cell
ie. =sum(A2+B36+C17+T2) or =(2*A1)+A4-A61
Can rename pages by left clicking on tab
Excel Tricks
Keep it easy to follow
Loan Officers will not have you there to explain them so you will have to make sure you answer questions in your documents.
Be able to answer how you came up with that number
Show your calculations.◦ Don’t leave the readers guessing how you came up with
your figures!
Finally..