Embed Size (px)
Citation preview
RAINWATER ET CITYSMART SMART IRRIGATION FOR THE FUTURE
Karen Cheng Eddy Fong Paras Gandhi Julia Pashin
Genesis | 1
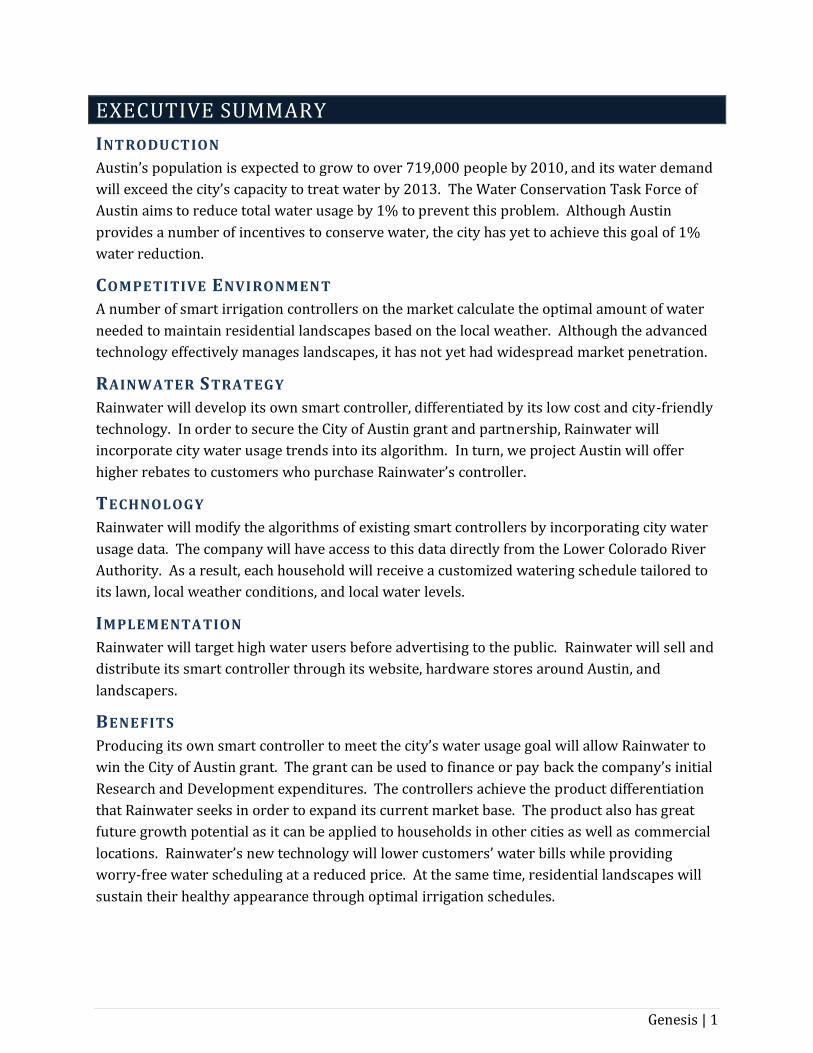
EXECUTIVE SUMMARY INTRODUCTION Austin’s population is expected to grow to over 719,000 people by 2010, and its water demand will exceed the city’s capacity to treat water by 2013. The Water Conservation Task Force of Austin aims to reduce total water usage by 1% to prevent this problem. Although Austin provides a number of incentives to conserve water, the city has yet to achieve this goal of 1% water reduction.
COMPETITIVE ENVIRONMENT A number of smart irrigation controllers on the market calculate the optimal amount of water needed to maintain residential landscapes based on the local weather. Although the advanced technology effectively manages landscapes, it has not yet had widespread market penetration.
RAINWATER STRATEGY Rainwater will develop its own smart controller, differentiated by its low cost and city‐friendly technology. In order to secure the City of Austin grant and partnership, Rainwater will incorporate city water usage trends into its algorithm. In turn, we project Austin will offer higher rebates to customers who purchase Rainwater’s controller. TECHNOLOGY Rainwater will modify the algorithms of existing smart controllers by incorporating city water usage data. The company will have access to this data directly from the Lower Colorado River Authority. As a result, each household will receive a customized watering schedule tailored to its lawn, local weather conditions, and local water levels.
IMPLEMENTATION Rainwater will target high water users before advertising to the public. Rainwater will sell and distribute its smart controller through its website, hardware stores around Austin, and landscapers.
BENEFITS Producing its own smart controller to meet the city’s water usage goal will allow Rainwater to win the City of Austin grant. The grant can be used to finance or pay back the company’s initial Research and Development expenditures. The controllers achieve the product differentiation that Rainwater seeks in order to expand its current market base. The product also has great future growth potential as it can be applied to households in other cities as well as commercial locations. Rainwater’s new technology will lower customers’ water bills while providing worry‐free water scheduling at a reduced price. At the same time, residential landscapes will sustain their healthy appearance through optimal irrigation schedules.
Genesis | 2
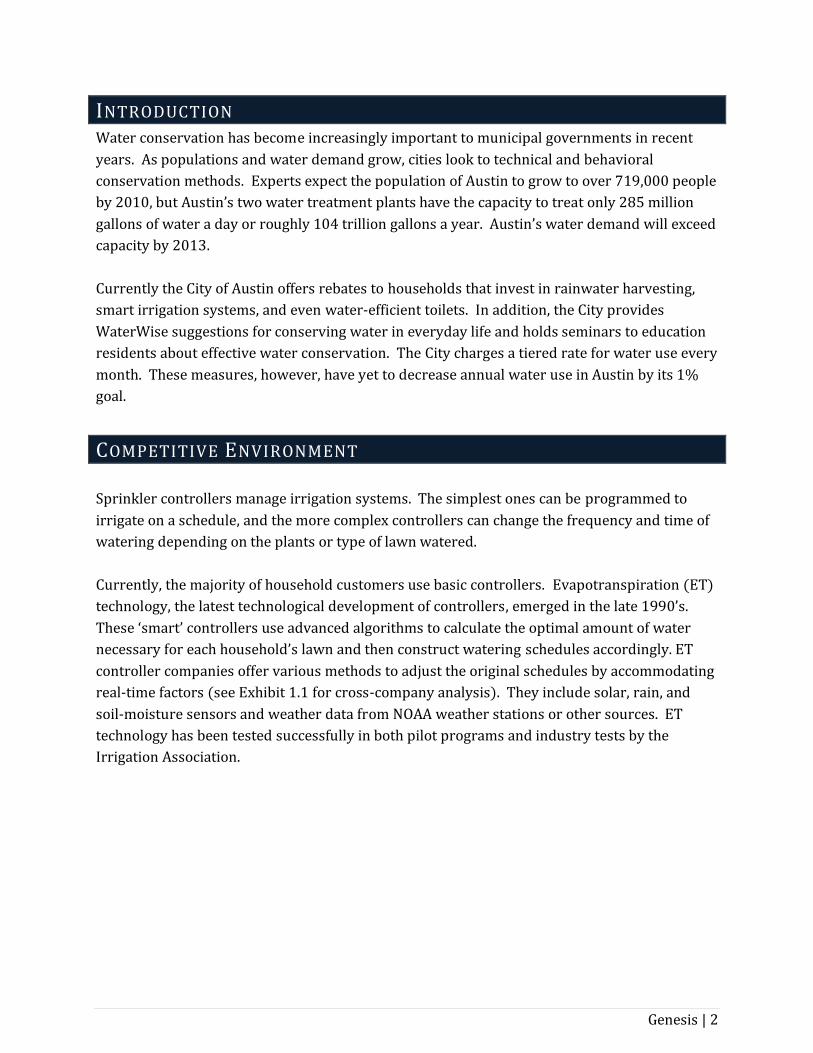
INTRODUCTION Water conservation has become increasingly important to municipal governments in recent years. As populations and water demand grow, cities look to technical and behavioral conservation methods. Experts expect the population of Austin to grow to over 719,000 people by 2010, but Austin’s two water treatment plants have the capacity to treat only 285 million gallons of water a day or roughly 104 trillion gallons a year. Austin’s water demand will exceed capacity by 2013. Currently the City of Austin offers rebates to households that invest in rainwater harvesting, smart irrigation systems, and even water‐efficient toilets. In addition, the City provides WaterWise suggestions for conserving water in everyday life and holds seminars to education residents about effective water conservation. The City charges a tiered rate for water use every month. These measures, however, have yet to decrease annual water use in Austin by its 1% goal.
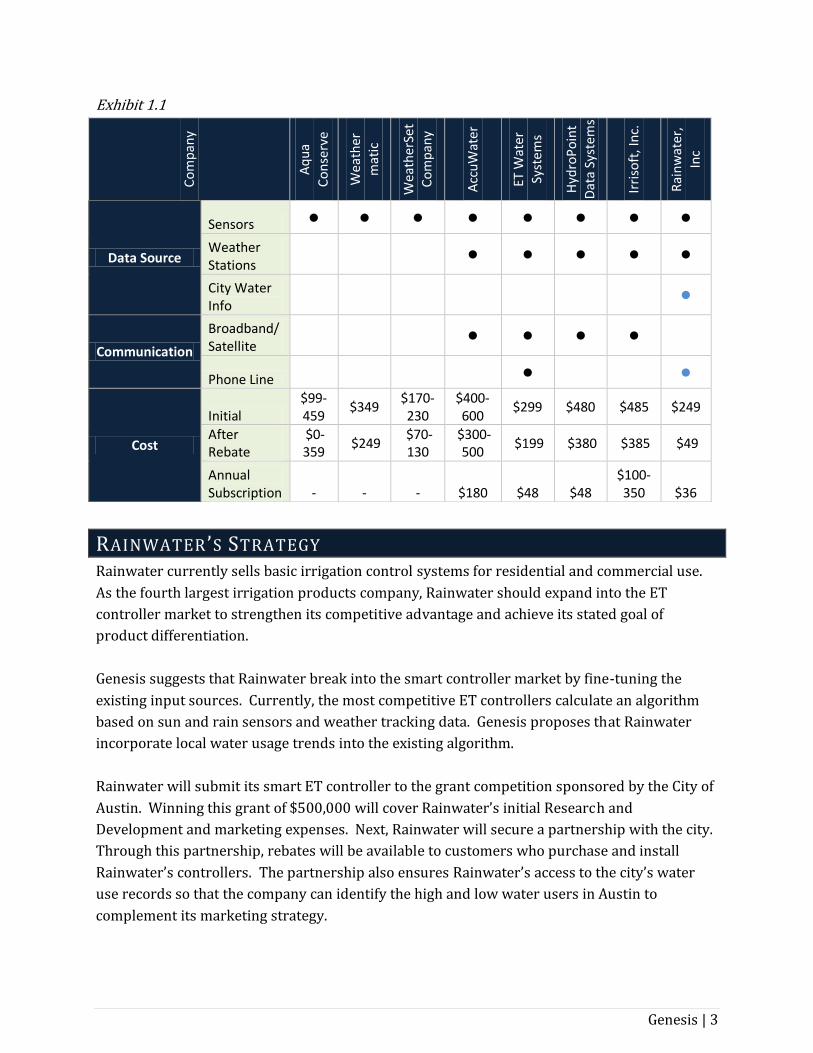
COMPETITIVE ENVIRONMENT Sprinkler controllers manage irrigation systems. The simplest ones can be programmed to irrigate on a schedule, and the more complex controllers can change the frequency and time of watering depending on the plants or type of lawn watered. Currently, the majority of household customers use basic controllers. Evapotranspiration (ET) technology, the latest technological development of controllers, emerged in the late 1990’s. These ‘smart’ controllers use advanced algorithms to calculate the optimal amount of water necessary for each household’s lawn and then construct watering schedules accordingly. ET controller companies offer various methods to adjust the original schedules by accommodating real‐time factors (see Exhibit 1.1 for cross‐company analysis). They include solar, rain, and soil‐moisture sensors and weather data from NOAA weather stations or other sources. ET technology has been tested successfully in both pilot programs and industry tests by the Irrigation Association.
Genesis | 3
Exhibit 1.1
RAINWATER ’S STRATEGY Rainwater currently sells basic irrigation control systems for residential and commercial use. As the fourth largest irrigation products company, Rainwater should expand into the ET controller market to strengthen its competitive advantage and achieve its stated goal of product differentiation. Genesis suggests that Rainwater break into the smart controller market by fine‐tuning the existing input sources. Currently, the most competitive ET controllers calculate an algorithm based on sun and rain sensors and weather tracking data. Genesis proposes that Rainwater incorporate local water usage trends into the existing algorithm. Rainwater will submit its smart ET controller to the grant competition sponsored by the City of Austin. Winning this grant of $500,000 will cover Rainwater’s initial Research and Development and marketing expenses. Next, Rainwater will secure a partnership with the city. Through this partnership, rebates will be available to customers who purchase and install Rainwater’s controllers. The partnership also ensures Rainwater’s access to the city’s water use records so that the company can identify the high and low water users in Austin to complement its marketing strategy.
Company
Aqu
a Co
nserve
Weather
matic
WeatherSet
Company
AccuW
ater
ET W
ater
System
s
HydroPo
int
Data System
s
Irrisoft, Inc.
Rainwater,
Inc
Data Source
Sensors • • • • • • • • Weather Stations • • • • • City Water Info •
Communication
Broadband/ Satellite • • • •
Phone Line • •
Cost
Initial $99‐459
$349 $170‐230
$400‐600
$299 $480 $485 $249
After Rebate
$0‐359
$249 $70‐130
$300‐500
$199 $380 $385 $49
Annual Subscription ‐ ‐ ‐ $180 $48 $48
$100‐350 $36
Genesis | 4
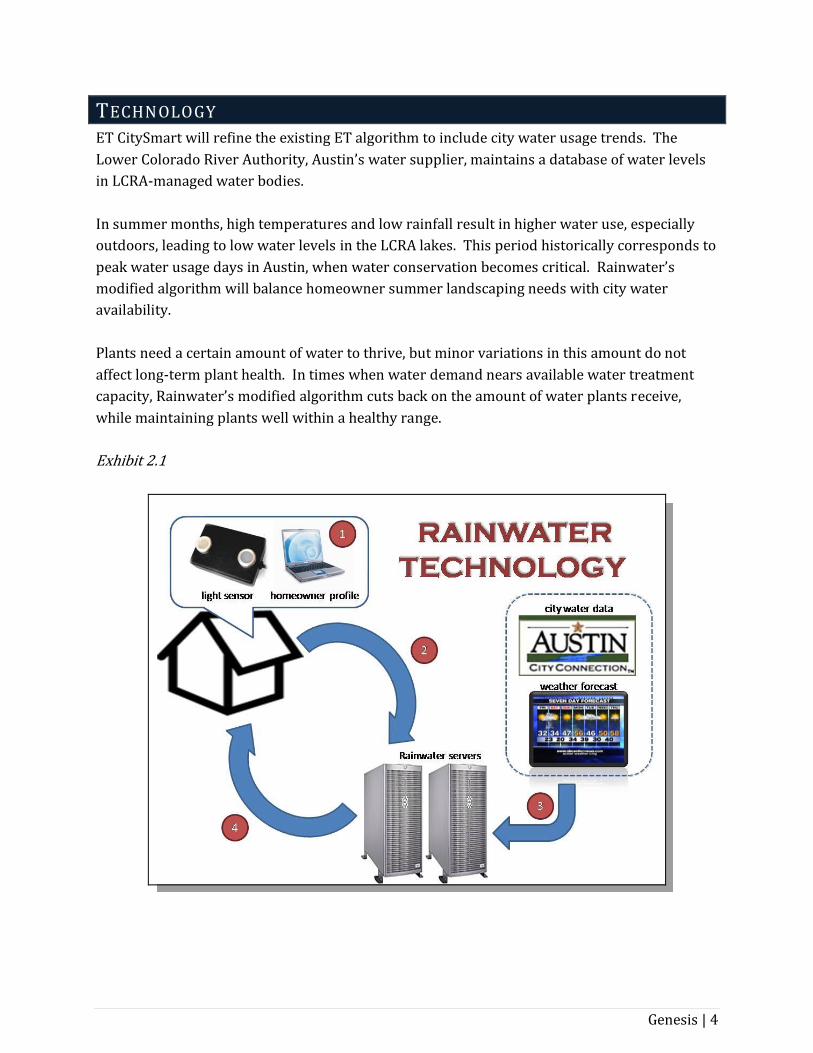
TECHNOLOGY ET CitySmart will refine the existing ET algorithm to include city water usage trends. The Lower Colorado River Authority, Austin’s water supplier, maintains a database of water levels in LCRA‐managed water bodies. In summer months, high temperatures and low rainfall result in higher water use, especially outdoors, leading to low water levels in the LCRA lakes. This period historically corresponds to peak water usage days in Austin, when water conservation becomes critical. Rainwater’s modified algorithm will balance homeowner summer landscaping needs with city water availability. Plants need a certain amount of water to thrive, but minor variations in this amount do not affect long‐term plant health. In times when water demand nears available water treatment capacity, Rainwater’s modified algorithm cuts back on the amount of water plants receive, while maintaining plants well within a healthy range. Exhibit 2.1
Genesis | 5
1. DATA IS COLLECTED AT HOME After installing the ET CitySmart Controller, the homeowner creates a landscape profile with the following information for each watering zone: sprinkler type, plant and soil type, land slope (to reduce runoff) and amount of shade per day. A light sensor keeps track of real‐time weather conditions, measuring the amount of moisture that the system needs to replenish in the landscape.
2. ET CITYSMART SENDS DATA TO RAINWATER SERVERS When the controller is activated, the homeowner’s profile is uploaded to Rainwater’s server. Every day, the real time weather conditions collected by the light sensor are sent to Rainwater servers by phone line.
3. RAINWATER UPDATES INFORMATION ON SERVERS HOURLY Rainwater servers collect data from two sources. It uses local forecast data from public weather sources (such as The Weather Channel) and local city water usage trends. By combining this information with the real‐time conditions collected by the household’s sensor, Rainwater creates a customized water schedule for each household.
4. RAINWATER SENDS CUSTOMIZED WATER SCHEDULE TO HOUSEHOLD Every day, the servers send a customized water schedule to each household by phone line.
IMPLEMENTATION MARKETING STRATEGY The marketing strategy is based on dividing all Austin households into two market segments: the high water users and the low water users. High water use households consume over 25,000 gallons a month. Rainwater will target the high water users from the second half of Year 1 through the end of Year 2. This will effectively concentrate its marketing resources on the market segment with the highest likelihood of purchasing its smart irrigation technology. At the end of Year 2, Rainwater would begin advertising to the low water users.
PARTNERSHIP WITH THE CITY OF AUSTIN
Rainwater would partner with the City of Austin directly after winning the grant. As part of this deal, the city would offer rebates of $200 to customers who purchase and install Rainwater technology. The city would also advertise the rebates on its website and in mailings, which would apply to all Austin households in an ongoing program. Finally, the city would allow Rainwater access to its water consumption database so that the company may identify the high and low water users. The partnership serves the interests of both parties. Rainwater sells its smart irrigation controllers to the city’s households and earns a profit, and the city sees a reduction in water
Genesis | 6
consumption by at least 1% a year and an improved capability to meet water demands on peak days.
TARGETING THE HIGH WATER USERS
At Month 7, Rainwater would advertise in neighborhood newsletters through appropriate homeowners associations. Given that most high water users live in high‐end housing developments, Rainwater could market the technology directly to the members of the homeowners associations in certain developments. In addition, Rainwater would print brochures detailing the system and its benefits to the high water users.
GENERAL ADVERTISING
By the end of Year 2 Rainwater would penetrate the initial target market of high water users. At this time, the company would begin its widespread advertising to low water users. Rainwater would advertise directly in utility bills by informing households how they can achieve optimal water usage and save money with its product.
DISTRIBUTION Rainwater will sell and distribute its smart controller through its website, hardware stores around Austin, and landscapers. As Rainwater already sells it sprinklers through hardware stores, Genesis recommends that Rainwater maintain these contracts and augment them to include sales of its new controller. Landscaping companies would then purchase the controllers from the hardware stores or from Rainwater to install in new housing developments or in existing systems. Making this option available meets the needs of customers who may request their landscaper to install the controllers.
BENEFITS BENEFITS TO RAINWATER, INC.
EARNING THE GRANT
Rainwater fulfills the requirements for the City of Austin grant by achieving the city’s goal of an annual 1% reduction in water use through an innovative product. Moreover, the Rainwater ET CitySmart controller is a product that can be expanded to a broader portion of Austin and other cities. The controller combines elements of ET technology with city water level data to help households reduce overall water use by 1.11% by 2011. The amount of water saved will increase every year as market penetration increases. At the same time, it will enable the city to manage peak day use.
Genesis | 7
ACHIEVING PRODUCT DIFFERENTIATION
ET CitySmart will allow Rainwater to enter the smart controller market. Rainwater’s controller has two differentiators: the inclusion of city water analysis in its algorithm and its low cost. No other controller on the market incorporates water levels. As the only controller that specifically addresses the city’s needs, ET CitySmart will stimulate support from the city in the form of consumer rebates. Communicating through phone lines permits Rainwater manufacturing costs to be lower than those of competitors. These low manufacturing costs, combined with rebates from the city, result in a great deal for consumers, who would otherwise have to pay at least $200‐400 for an ET controller. The low $49 price will attract households already interested in smart controllers as well as those who had not considered the technology due to its high price. Overall, producing a smart controller is the natural next step in Rainwater’s growth as ET technology is the wave of the future.
IMMEDIATE FINANCIAL BENEFIT
Utilizing the Genesis proposal, Rainwater will initially invest $305,000 in 2007 for product development purposes, which is expected to be no more than eight months. The following immediate four months will then bring in a net income of $326,000, already surpassing the initial investment. The first year will have an expected ROI of 107%. Then, in the next two years Rainwater will experience a cumulative income of $774,000 and overall ROI of 254%.
FUTURE GROWTH POTENTIAL
Initially, Rainwater will target the high water users in Austin, and achieve 3% market share. After the first two years of production, Rainwater will expand its market to 9.8% of Austin households. One major advantage of the Rainwater controller is its design for city use. This enables it to be approved by and applied to any city.
BENEFITS TO THE CUSTOMER
EASE OF USE
The web application to create homeowner‐specific profiles is easy to use and update by the client. When landscape profile data changes (ie. change grass type, plant new vegetation), the customer simply has to adjust the online profile. This information will be automatically re‐calculated by Rainwater’s server.
MONETARY SAVINGS
Based on industry averages, Genesis projects Rainwater’s ET CitySmart to save each household an average of 12%. These savings correspond to water bill payback in 12 and 19 months for high and general customers, respectively.
Genesis | 8
HEALTHIER PLANTS
ET technology promotes beautiful, healthy landscapes by ensuring that plants never get over‐watered. Rainwater’s algorithm will determine the optimal water needs for each individual consumer.
BENEFITS TO CITY OF AUSTIN
ACHIEVES CONSERVATION GOAL Genesis’ proposal proves Rainwater can lower Austin’s projected water use by its first year of sales. This percentage increases annually and reaches the requested threshold of 1% by 2011.
DELAYS INVESTMENT TO INCREASE SUPPLY CAPACITY Austin is currently planning to build a third water treatment plant in anticipation of projected water supply shortage by 2013. The estimated cost for this large capital investment is $300 million, and construction must begin soon unless a solution to substantially lower demand is found. Genesis has demonstrated that Rainwater can delay the building of this plant until 2017, saving $14.3 million per year.
RISK ANALYSIS Our projected risks, in descending probability, are as follows:
No direct partnership with City of Austin No direct link to LCRA Competition can price‐match
NO CITY PARTNERSHIP A lack of partnership with Austin poses the largest hazard in this proposal. It is the largest hazard not because of actual risk of failure, but rather the high return being based on the relatively low risk. However, because Rainwater will enable Austin to save a significant amount of water and money through its specialized controllers, the City of Austin will very likely partner with Rainwater to ensure the success of both. The partnership will include a combined marketing plan as well as rebates. In the unlikely event the partnership falls through, Genesis provides a contingency plan: The incorporation of water supply and demand was to take the City of Austin’s needs into account, therefore justifying their participation and rebates. After the higher $200 rebates, the price of a controller is only $50, far below that of any competitor. Without the higher rebate, a generic rebate already available for homeowners would only reduce the price to $150. The higher price to the consumer decreases Rainwater’s market coverage. Nonetheless, Rainwater will still be profitable with a 107% ROI in 2007 and 249% in 2008.
Genesis | 9
NO LCRA PARTNERSHIP Because LCRA water availability is also a major component of the Genesis proposal, it is the second greatest risk in this project. However, it is of minimal risk because LCRA water statistics are publicly provided and are updated continuously online. While a direct link would optimize Rainwater’s retrieval of information, Rainwater would still be able to access the information without it.
COMPETITION PRICE MATCH Although the Genesis proposal outlines a very low retail price ($49 after higher rebate) for the smart controller as its competitive edge, Genesis realizes the possibility that rival firms may proactively drop prices to compete. But when factoring in the high probability of a city partnership, Rainwater will be able to drop prices far below the price‐matching ability of any other manufacturer. This reduction will be from the higher rebate, specific to Rainwater due to incorporation of water usage information. Should the partnership fall through, the retail price without the exclusive rebate ($150) is still below the cost of many other firms. This ensures that in any situation, Rainwater will have one of the lowest prices.
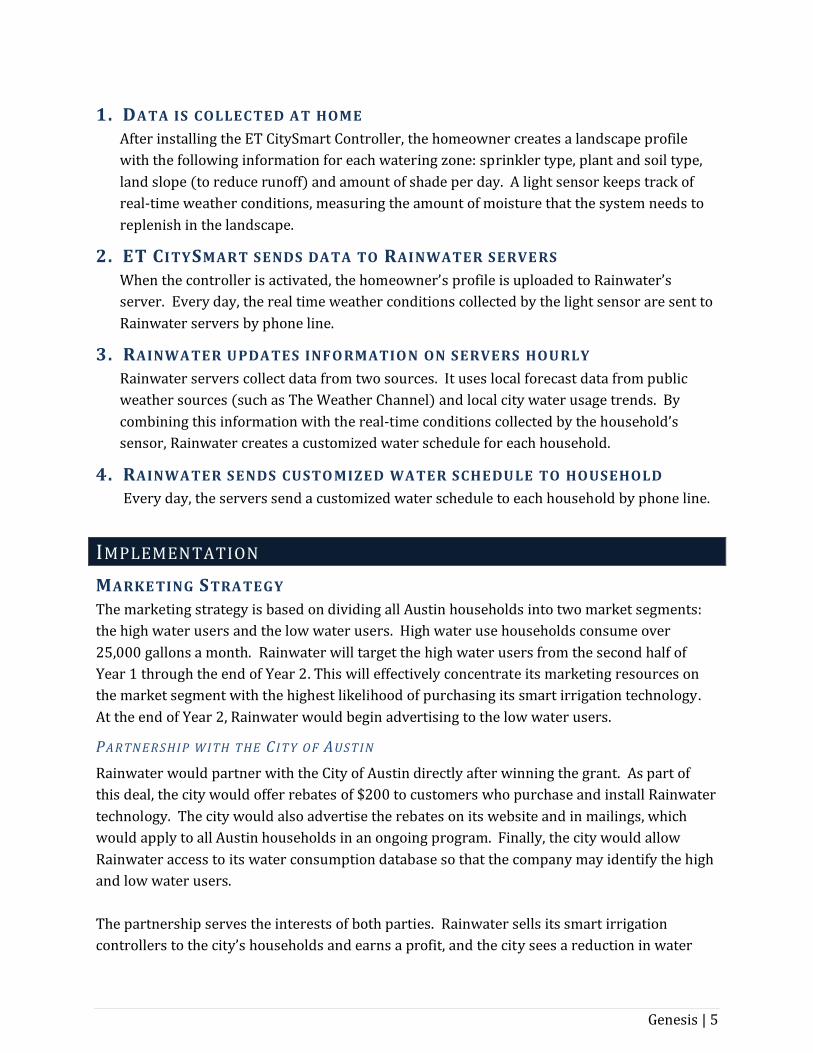
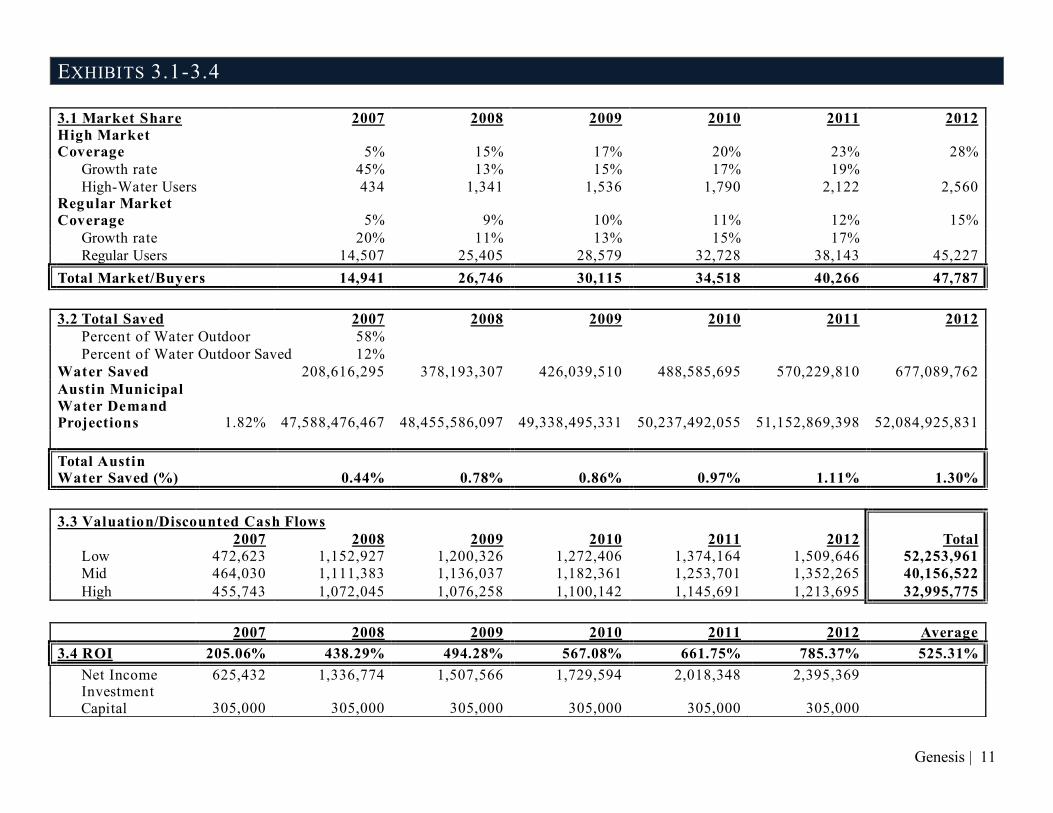
FINANCIAL ANALYSIS EXHIBITS 3.13.4 Exhibits 3.1‐3.4 reveal the bottom line numbers regarding Rainwater’s top three clients. In Exhibit 3.1 Genesis establishes its market coverage and market growth. The coverage is based on market analysis and input from industry experts. Market growth was determined similarly. It is key to note that growth is higher in high usage households than regular usage households due to larger cost savings.. In Exhibit 3.2, the percent of total water saved for all of Austin is derived from Genesis’ market projections. For conservative accuracy, Genesis used base numbers to calculate water saved. For example, the high usage market was determined using Austin’s threshold – using more 25,000 gallons month. Then, even though 25,000 was the baseline for qualifications, Genesis used that number as the average to calculate high usage numbers. This allows for extra “shoulder” room. In the first fourth months of operation, Rainwater will decrease Austin’s water usage by 0.44%. Within three more years, this number grows to 0.97% and quickly afterward supersedes the 1.0% goal. Exhibit 3.3 and 3.4 are the bottom line for Rainwater and its investors. To provide a better model of actual reality and future uncertainty, Genesis has created three scenarios using a low, medium, and high discount rate (8%, 10%, 12%) to calculate valuation. In the least optimistic situation, Genesis has determined a worth of $33,000,000 for this project. For ROI, a
Genesis | 10
conservative high discount rate was used to calculate income and determine an average ROI of 205.06%. Numbers for Exhibits 3.3 and 3.4 were based of Exhibit 3.1.
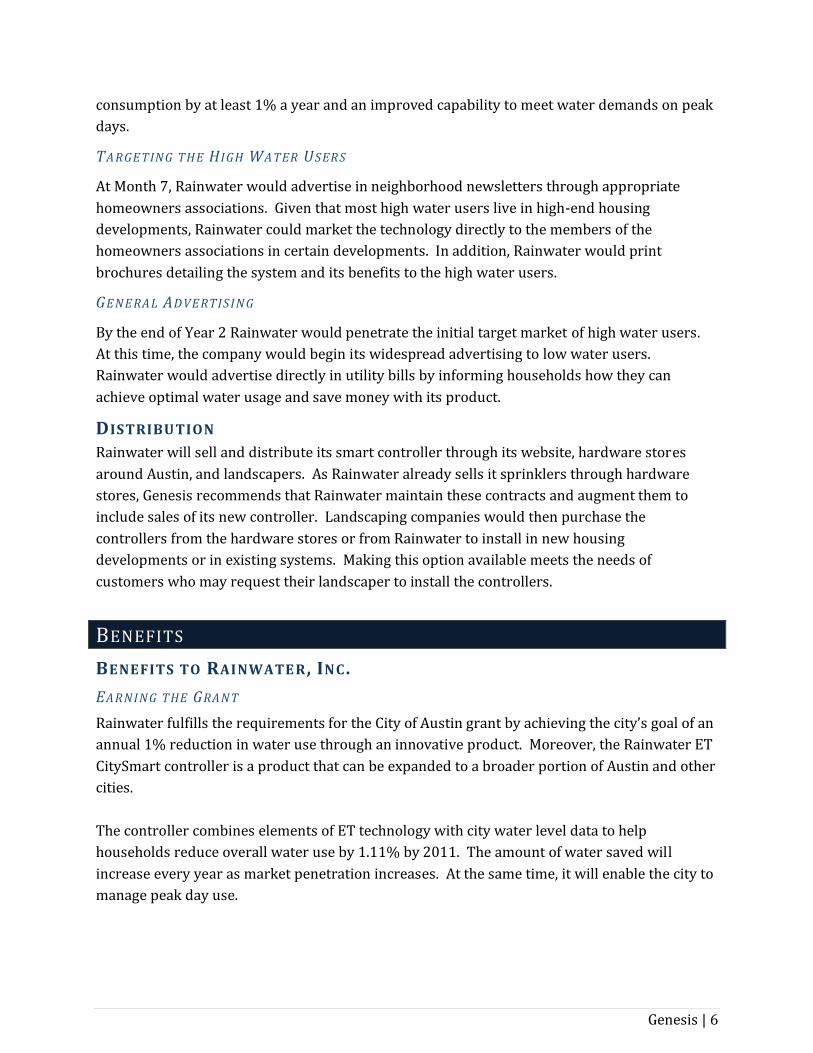
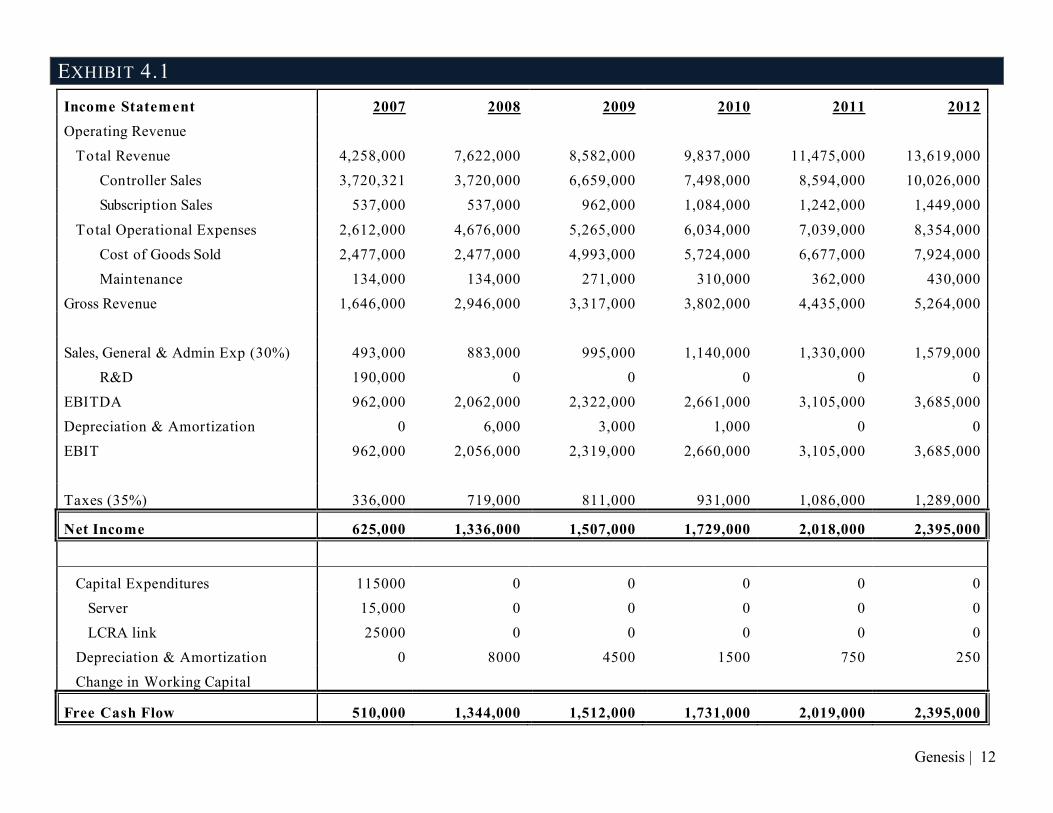
EXHIBIT 4.1 Exhibit 4.1 is a pro forma income statement with an addendum to calculate free cash flows. The pro forma income statement establishes this project’s two streams of revenue: controller sales and annual subscriptions. With each individual unit priced at $249 (Exhibit 5.1) and manufactured at $165 (Exhibit 5.1), Rainwater will not only break even in the first year, but also generate almost two million in net income, with 99% of the net income as free cash flow.
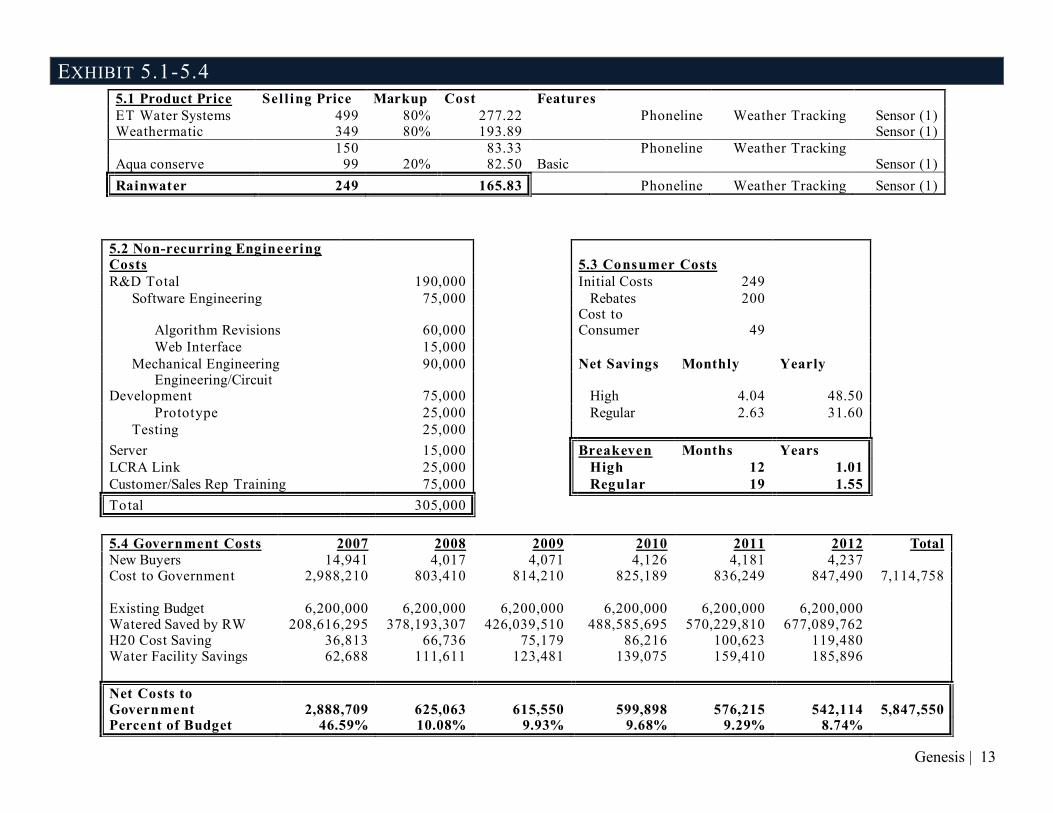
EXHIBIT 5.154 Exhibit 5.1 demonstrates how Genesis derived the cost of manufacturing as well as the sales price. With industry markup set at 20‐80%, Genesis used traditional markup application methods and reverse engineered the 80% to higher priced models and 20% to lower to determine base costs. Then, through subtraction and addition of features and prices, Genesis established an estimated price for a product nearly identical to Rainwater’s ET CitySmart. Exhibit 5.2 identifies the non‐recurring engineering costs to Rainwater. The initial costs include research and development (including software, hardware, and testing), necessary equipment (i.e., servers), and the link to the LCRA database. Exhibit 5.3 demonstrates the bottom line and costs to residential consumers. Currently, the City of Austin offers a $100 rebate on irrigation controllers. Due to the partnership, Genesis expects the rebate to be increased to $200 and most likely exclusive to Rainwater. This lowers the price to consumers to $49. Based on the individual market sector savings, Genesis has in turn determined break‐even time for residential customers: slightly over one year for high usage households and slightly over one and a half year for regular usage households. Exhibit 5.4 determines the costs of the rebate to the City of Austin and the savings. Assuming stated market coverage is reached with the $200 rebate, the first year cost will be significantly higher at 2.9 million, but then fall to $625,000 the second year and eventually less than $550,000. These rebates will account for approximately 46% of the City of Austin water budget the first year, but then drop to less than 10% for the remainder of the project life.
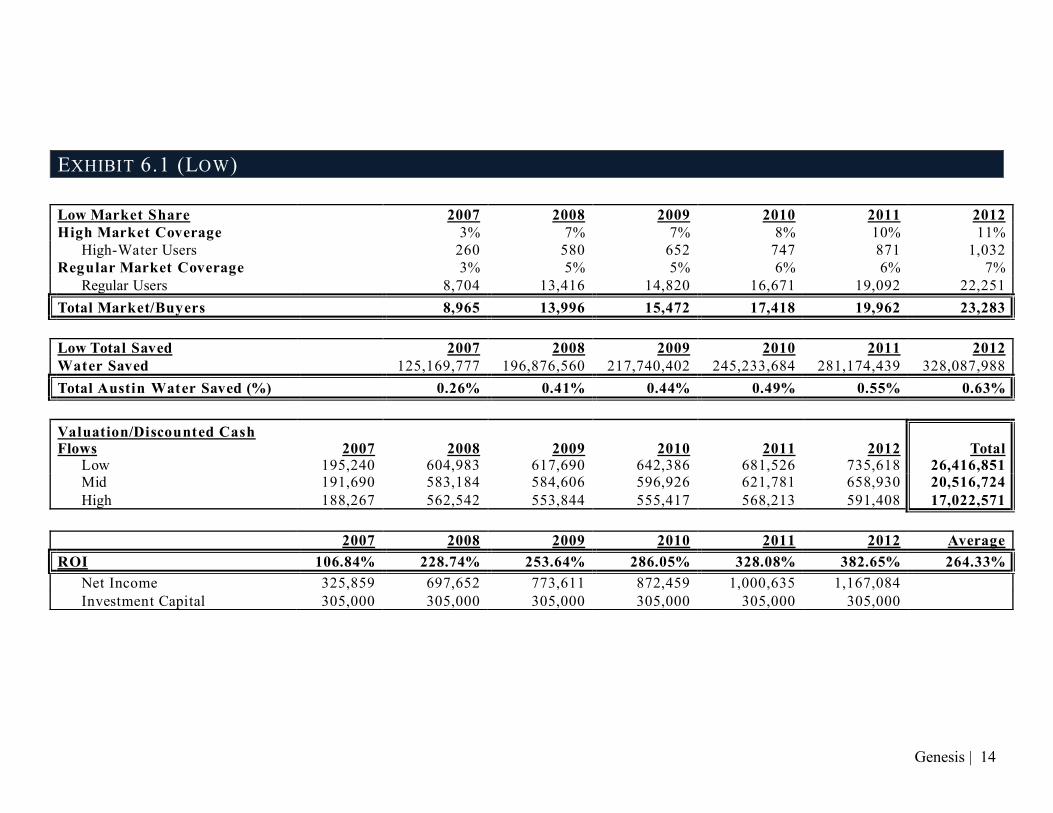
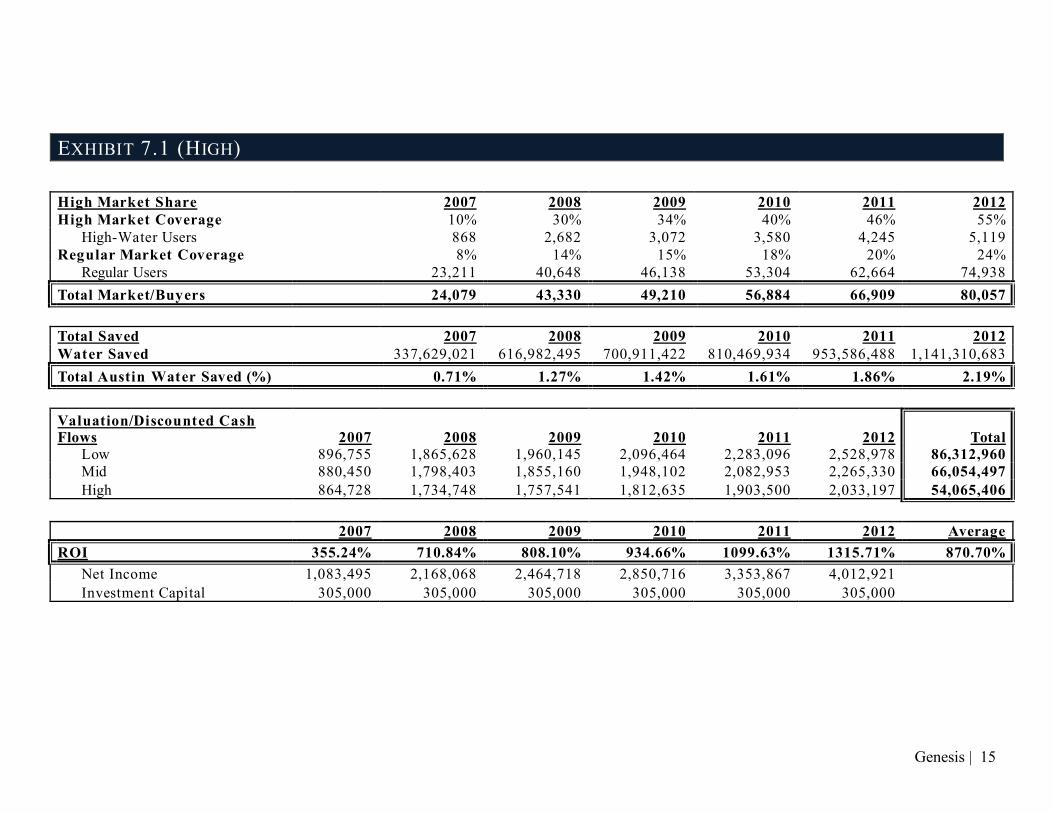
EXHIBIT 6.17.1 To further simulate reality, Genesis has generated two further iterations of the three key bottom line figures. These two iterations differ in the scope of market coverage; Exhibit 6.1 details lower market coverage supplemented with lower growth, simulating a worst‐case scenario. Exhibit 7.1 is the opposite, a possible best‐case scenario. It combines higher market coverage with explosive growth. In both Exhibits, only minimal calculations are shown, but both worst and best cases deliver positive ROIs: 106.84% and 355.24% respectively.
Genesis | 11
EXHIBITS 3.1-3.4
3.1 Market Share 2007 2008 2009 2010 2011 2012
High Market Coverage 5% 15% 17% 20% 23% 28%
Growth rate 45% 13% 15% 17% 19%
High-Water Users 434 1,341 1,536 1,790 2,122 2,560
Regular Market
Coverage 5% 9% 10% 11% 12% 15%
Growth rate 20% 11% 13% 15% 17%
Regular Users 14,507 25,405 28,579 32,728 38,143 45,227
Total Market/Buyers 14,941 26,746 30,115 34,518 40,266 47,787
3.2 Total Saved 2007 2008 2009 2010 2011 2012
Percent of Water Outdoor 58%
Percent of Water Outdoor Saved 12%
Water Saved 208,616,295 378,193,307 426,039,510 488,585,695 570,229,810 677,089,762
Austin Municipal
Water Demand Projections 1.82% 47,588,476,467 48,455,586,097 49,338,495,331 50,237,492,055 51,152,869,398 52,084,925,831
Total Austin Water Saved (%) 0.44% 0.78% 0.86% 0.97% 1.11% 1.30%
3.3 Valuation/Discounted Cash Flows
2007 2008 2009 2010 2011 2012 Total
Low 472,623 1,152,927 1,200,326 1,272,406 1,374,164 1,509,646 52,253,961
Mid 464,030 1,111,383 1,136,037 1,182,361 1,253,701 1,352,265 40,156,522
High 455,743 1,072,045 1,076,258 1,100,142 1,145,691 1,213,695 32,995,775
2007 2008 2009 2010 2011 2012 Average
3.4 ROI 205.06% 438.29% 494.28% 567.08% 661.75% 785.37% 525.31%
Net Income 625,432 1,336,774 1,507,566 1,729,594 2,018,348 2,395,369 Investment Capital 305,000 305,000 305,000 305,000 305,000 305,000
Genesis | 12
EXHIBIT 4.1
Income Statement 2007 2008 2009 2010 2011 2012
Operating Revenue
Total Revenue 4,258,000 7,622,000 8,582,000 9,837,000 11,475,000 13,619,000
Controller Sales 3,720,321 3,720,000 6,659,000 7,498,000 8,594,000 10,026,000
Subscription Sales 537,000 537,000 962,000 1,084,000 1,242,000 1,449,000
Total Operational Expenses 2,612,000 4,676,000 5,265,000 6,034,000 7,039,000 8,354,000
Cost of Goods Sold 2,477,000 2,477,000 4,993,000 5,724,000 6,677,000 7,924,000
Maintenance 134,000 134,000 271,000 310,000 362,000 430,000
Gross Revenue 1,646,000 2,946,000 3,317,000 3,802,000 4,435,000 5,264,000
Sales, General & Admin Exp (30%) 493,000 883,000 995,000 1,140,000 1,330,000 1,579,000
R&D 190,000 0 0 0 0 0
EBITDA 962,000 2,062,000 2,322,000 2,661,000 3,105,000 3,685,000
Depreciation & Amortization 0 6,000 3,000 1,000 0 0
EBIT 962,000 2,056,000 2,319,000 2,660,000 3,105,000 3,685,000
Taxes (35%) 336,000 719,000 811,000 931,000 1,086,000 1,289,000
Net Income 625,000 1,336,000 1,507,000 1,729,000 2,018,000 2,395,000
Capital Expenditures 115000 0 0 0 0 0
Server 15,000 0 0 0 0 0
LCRA link 25000 0 0 0 0 0
Depreciation & Amortization 0 8000 4500 1500 750 250
Change in Working Capital
Free Cash Flow 510,000 1,344,000 1,512,000 1,731,000 2,019,000 2,395,000
Genesis | 13
EXHIBIT 5.1-5.4
5.1 Product Price Sell ing Price Markup Cost Features
ET Water Systems 499 80% 277.22 Phoneline Weather Tracking Sensor (1) Weathermatic 349 80% 193.89 Sensor (1)
150 83.33 Phoneline Weather Tracking Aqua conserve 99 20% 82.50 Basic Sensor (1)
Rainwater 249 165.83 Phoneline Weather Tracking Sensor (1)
5.2 Non-recurring Engineering Costs 5.3 Consumer Costs
R&D Total 190,000 Initial Costs 249
Software Engineering 75,000 Rebates 200
Algorithm Revisions 60,000 Cost to Consumer 49
Web Interface 15,000
Mechanical Engineering 90,000 Net Savings Monthly Yearly
Engineering/Circuit Development 75,000 High 4.04 48.50
Prototype 25,000 Regular 2.63 31.60
Testing 25,000
Server 15,000 Breakeven Months Years
LCRA Link 25,000 High 12 1.01
Customer/Sales Rep Training 75,000 Regular 19 1.55
Total 305,000
5.4 Government Costs 2007 2008 2009 2010 2011 2012 Total
New Buyers 14,941 4,017 4,071 4,126 4,181 4,237 Cost to Government 2,988,210 803,410 814,210 825,189 836,249 847,490 7,114,758
Existing Budget 6,200,000 6,200,000 6,200,000 6,200,000 6,200,000 6,200,000 Watered Saved by RW 208,616,295 378,193,307 426,039,510 488,585,695 570,229,810 677,089,762 H20 Cost Saving 36,813 66,736 75,179 86,216 100,623 119,480 Water Facility Savings 62,688 111,611 123,481 139,075 159,410 185,896
Net Costs to Government 2,888,709 625,063 615,550 599,898 576,215 542,114 5,847,550 Percent of Budget 46.59% 10.08% 9.93% 9.68% 9.29% 8.74%
Genesis | 14
EXHIBIT 6.1 (LOW)
Low Market Share 2007 2008 2009 2010 2011 2012
High Market Coverage 3% 7% 7% 8% 10% 11%
High-Water Users 260 580 652 747 871 1,032
Regular Market Coverage 3% 5% 5% 6% 6% 7%
Regular Users 8,704 13,416 14,820 16,671 19,092 22,251
Total Market/Buyers 8,965 13,996 15,472 17,418 19,962 23,283
Low Total Saved 2007 2008 2009 2010 2011 2012
Water Saved 125,169,777 196,876,560 217,740,402 245,233,684 281,174,439 328,087,988
Total Austin Water Saved (%) 0.26% 0.41% 0.44% 0.49% 0.55% 0.63%
Valuation/Discounted Cash Flows 2007 2008 2009 2010 2011 2012 Total
Low 195,240 604,983 617,690 642,386 681,526 735,618 26,416,851
Mid 191,690 583,184 584,606 596,926 621,781 658,930 20,516,724
High 188,267 562,542 553,844 555,417 568,213 591,408 17,022,571
2007 2008 2009 2010 2011 2012 Average
ROI 106.84% 228.74% 253.64% 286.05% 328.08% 382.65% 264.33%
Net Income 325,859 697,652 773,611 872,459 1,000,635 1,167,084
Investment Capital 305,000 305,000 305,000 305,000 305,000 305,000
Genesis | 15
EXHIBIT 7.1 (HIGH)
High Market Share 2007 2008 2009 2010 2011 2012
High Market Coverage 10% 30% 34% 40% 46% 55%
High-Water Users 868 2,682 3,072 3,580 4,245 5,119
Regular Market Coverage 8% 14% 15% 18% 20% 24%
Regular Users 23,211 40,648 46,138 53,304 62,664 74,938
Total Market/Buyers 24,079 43,330 49,210 56,884 66,909 80,057
Total Saved 2007 2008 2009 2010 2011 2012
Water Saved 337,629,021 616,982,495 700,911,422 810,469,934 953,586,488 1,141,310,683
Total Austin Water Saved (%) 0.71% 1.27% 1.42% 1.61% 1.86% 2.19%
Valuation/Discounted Cash Flows 2007 2008 2009 2010 2011 2012 Total
Low 896,755 1,865,628 1,960,145 2,096,464 2,283,096 2,528,978 86,312,960
Mid 880,450 1,798,403 1,855,160 1,948,102 2,082,953 2,265,330 66,054,497
High 864,728 1,734,748 1,757,541 1,812,635 1,903,500 2,033,197 54,065,406
2007 2008 2009 2010 2011 2012 Average
ROI 355.24% 710.84% 808.10% 934.66% 1099.63% 1315.71% 870.70%
Net Income 1,083,495 2,168,068 2,464,718 2,850,716 3,353,867 4,012,921
Investment Capital 305,000 305,000 305,000 305,000 305,000 305,000