Embed Size (px)
Citation preview
AJM – Global Iron Ore & Steel Forecast Mike Young – CEO BC Iron
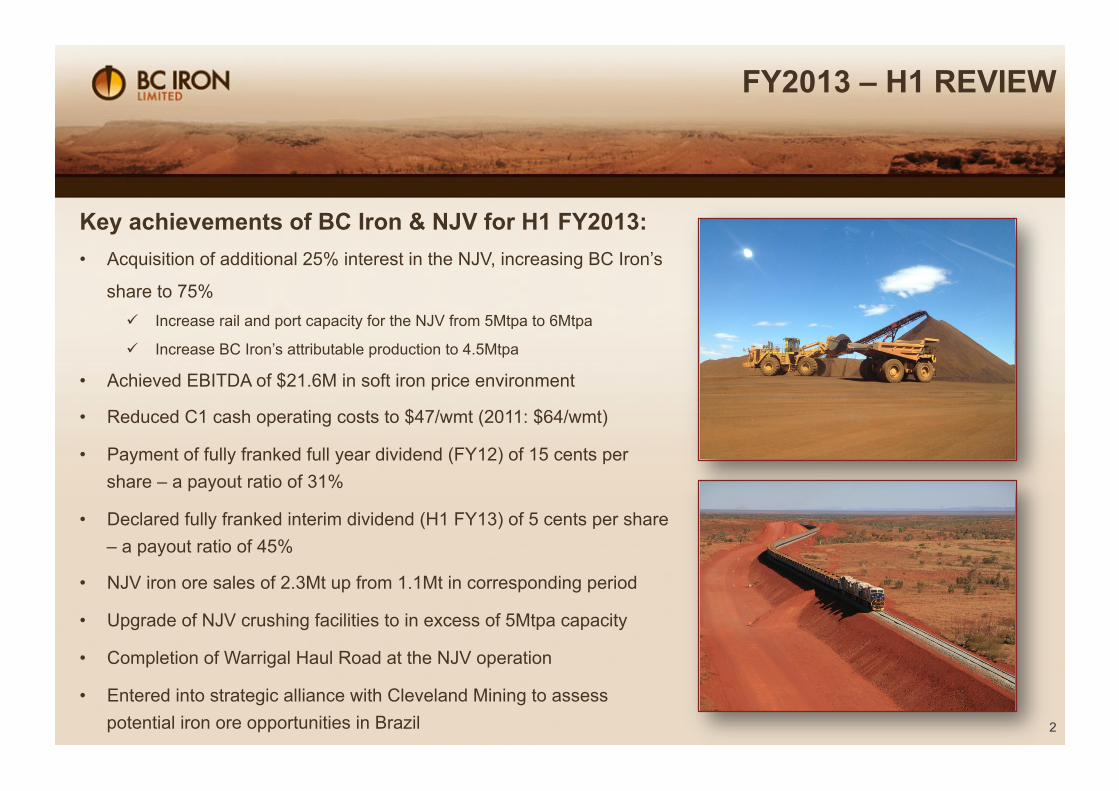
Key achievements of BC Iron & NJV for H1 FY2013: • Acquisition of additional 25% interest in the NJV, increasing BC Iron’s
share to 75%
Increase rail and port capacity for the NJV from 5Mtpa to 6Mtpa
Increase BC Iron’s attributable production to 4.5Mtpa
• Achieved EBITDA of $21.6M in soft iron price environment
• Reduced C1 cash operating costs to $47/wmt (2011: $64/wmt)
• Payment of fully franked full year dividend (FY12) of 15 cents per share – a payout ratio of 31%
• Declared fully franked interim dividend (H1 FY13) of 5 cents per share – a payout ratio of 45%
• NJV iron ore sales of 2.3Mt up from 1.1Mt in corresponding period
• Upgrade of NJV crushing facilities to in excess of 5Mtpa capacity
• Completion of Warrigal Haul Road at the NJV operation
• Entered into strategic alliance with Cleveland Mining to assess potential iron ore opportunities in Brazil 2
FY2013 – H1 REVIEW
3
JOINT VENTURE DEAL WITH FORTESCUE
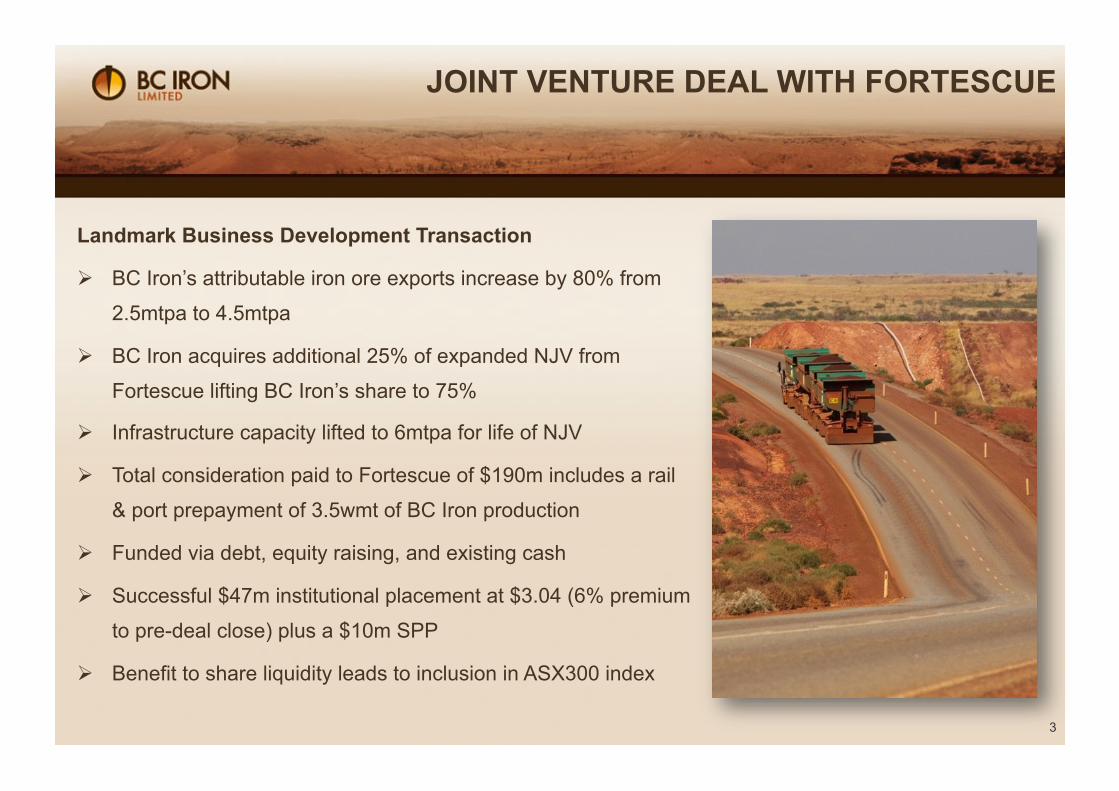
Landmark Business Development Transaction
BC Iron’s attributable iron ore exports increase by 80% from
2.5mtpa to 4.5mtpa
BC Iron acquires additional 25% of expanded NJV from
Fortescue lifting BC Iron’s share to 75%
Infrastructure capacity lifted to 6mtpa for life of NJV
Total consideration paid to Fortescue of $190m includes a rail
& port prepayment of 3.5wmt of BC Iron production
Funded via debt, equity raising, and existing cash
Successful $47m institutional placement at $3.04 (6% premium
to pre-deal close) plus a $10m SPP
Benefit to share liquidity leads to inclusion in ASX300 index
4
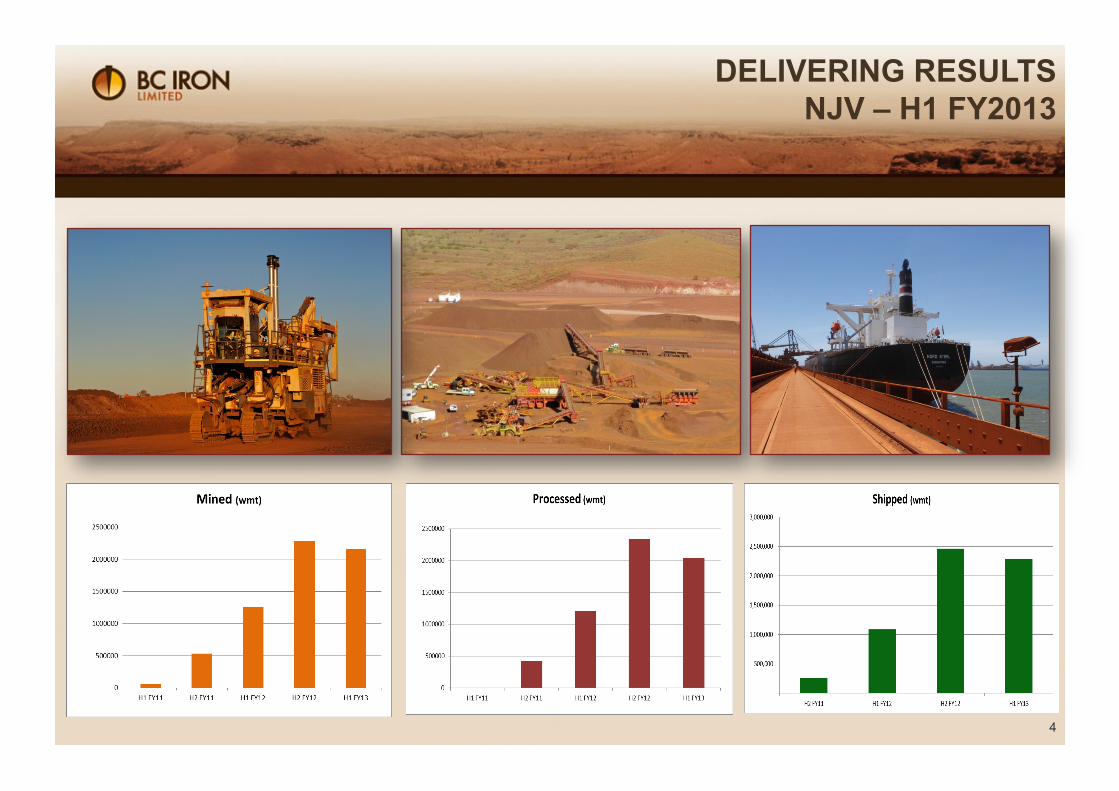
DELIVERING RESULTS NJV – H1 FY2013
5
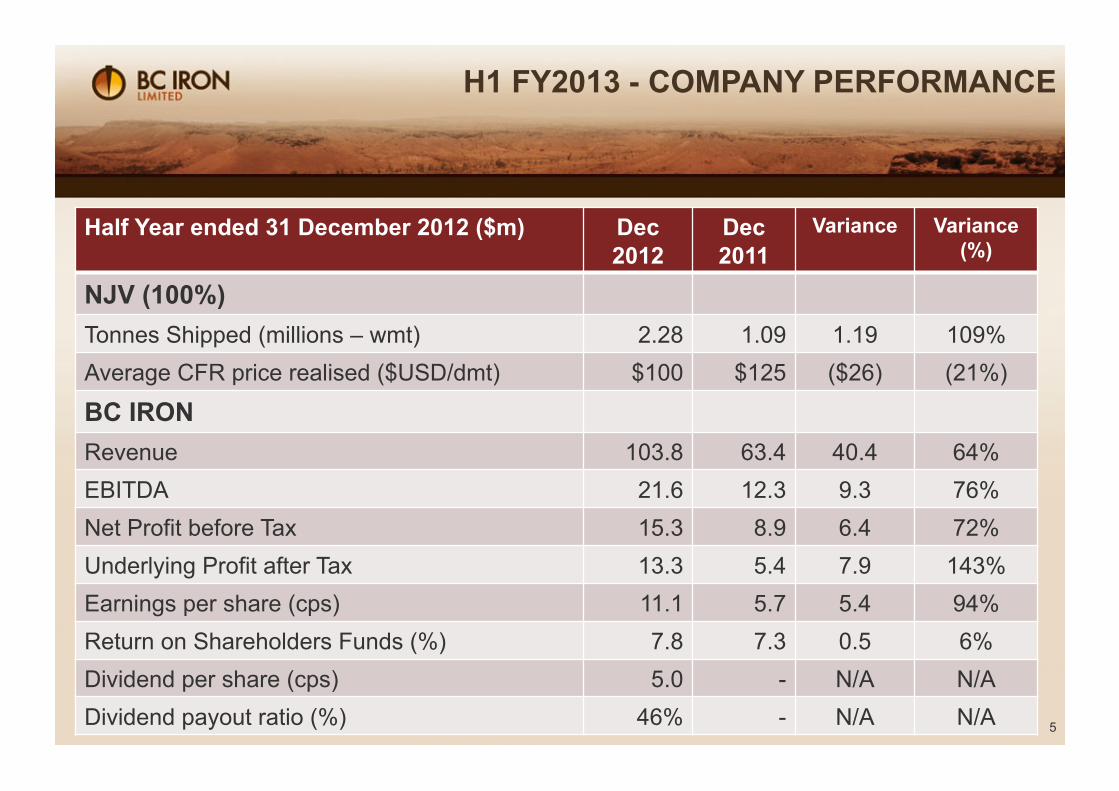
H1 FY2013 - COMPANY PERFORMANCE
Half Year ended 31 December 2012 ($m) Dec 2012
Dec 2011
Variance Variance (%)
NJV (100%) Tonnes Shipped (millions – wmt) 2.28 1.09 1.19 109% Average CFR price realised ($USD/dmt) $100 $125 ($26) (21%)
BC IRON Revenue 103.8 63.4 40.4 64% EBITDA 21.6 12.3 9.3 76% Net Profit before Tax 15.3 8.9 6.4 72% Underlying Profit after Tax 13.3 5.4 7.9 143% Earnings per share (cps) 11.1 5.7 5.4 94% Return on Shareholders Funds (%) 7.8 7.3 0.5 6% Dividend per share (cps) 5.0 - N/A N/A Dividend payout ratio (%) 46% - N/A N/A
6
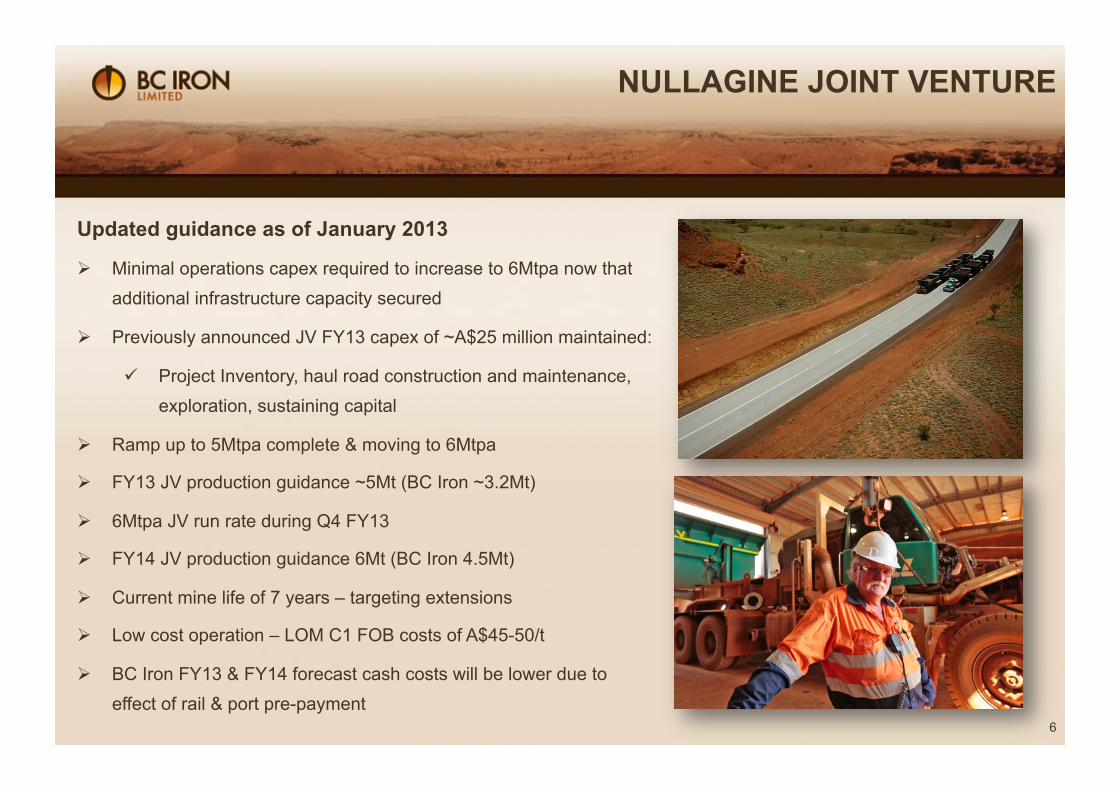
NULLAGINE JOINT VENTURE
Updated guidance as of January 2013
Minimal operations capex required to increase to 6Mtpa now that additional infrastructure capacity secured
Previously announced JV FY13 capex of ~A$25 million maintained:
Project Inventory, haul road construction and maintenance, exploration, sustaining capital
Ramp up to 5Mtpa complete & moving to 6Mtpa
FY13 JV production guidance ~5Mt (BC Iron ~3.2Mt)
6Mtpa JV run rate during Q4 FY13
FY14 JV production guidance 6Mt (BC Iron 4.5Mt)
Current mine life of 7 years – targeting extensions
Low cost operation – LOM C1 FOB costs of A$45-50/t
BC Iron FY13 & FY14 forecast cash costs will be lower due to effect of rail & port pre-payment
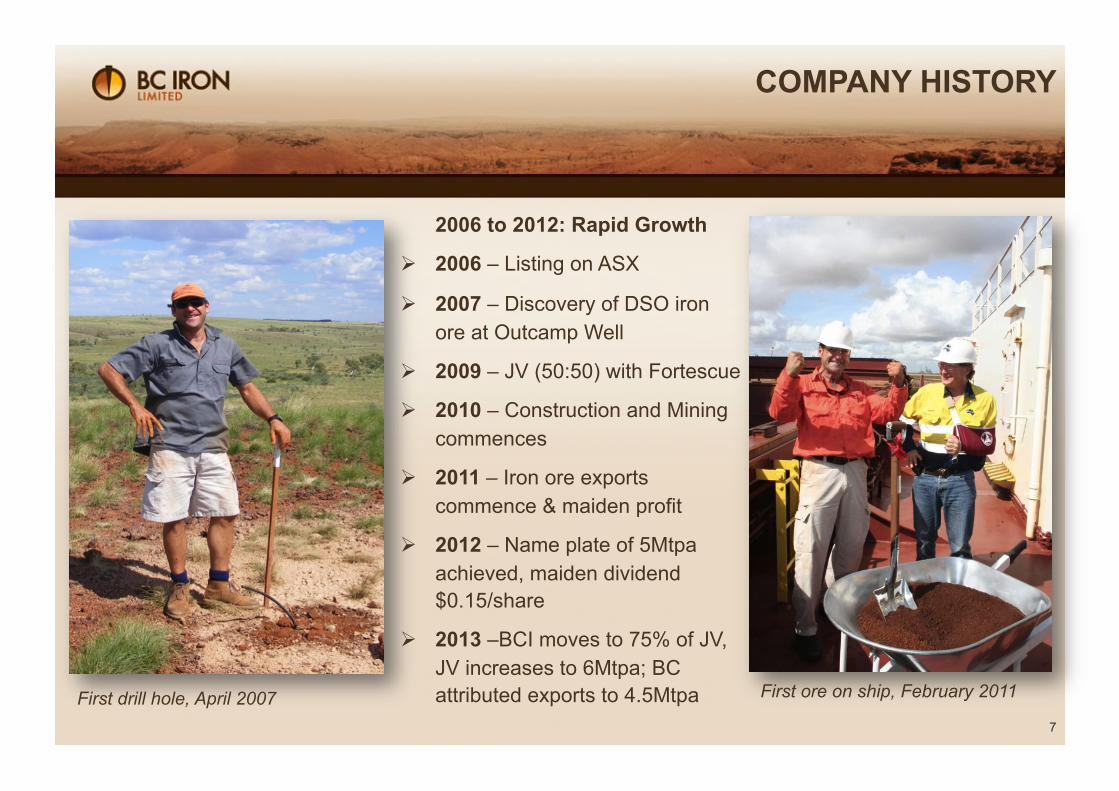
2006 to 2012: Rapid Growth
2006 – Listing on ASX
2007 – Discovery of DSO iron ore at Outcamp Well
2009 – JV (50:50) with Fortescue
2010 – Construction and Mining commences
2011 – Iron ore exports commence & maiden profit
2012 – Name plate of 5Mtpa achieved, maiden dividend $0.15/share
2013 –BCI moves to 75% of JV, JV increases to 6Mtpa; BC attributed exports to 4.5Mtpa
7
COMPANY HISTORY
First drill hole, April 2007 First ore on ship, February 2011
8
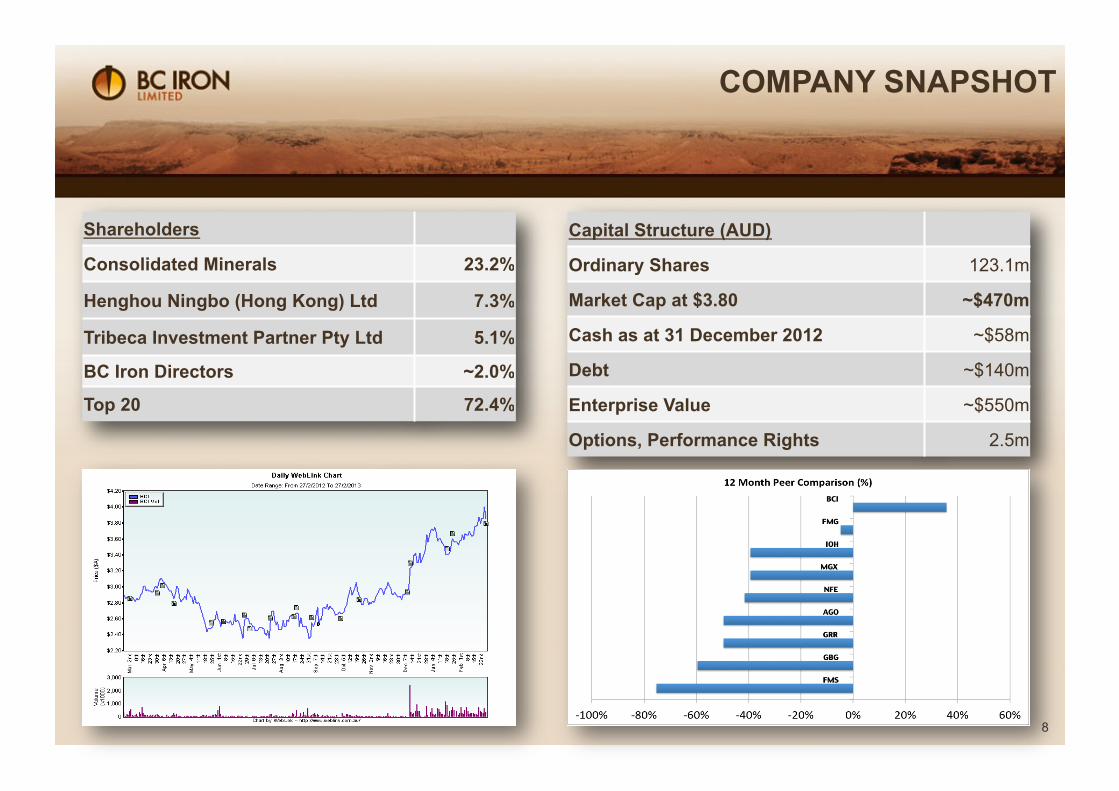
COMPANY SNAPSHOT
Shareholders
Consolidated Minerals 23.2%
Henghou Ningbo (Hong Kong) Ltd 7.3%
Tribeca Investment Partner Pty Ltd 5.1%
BC Iron Directors ~2.0%
Top 20 72.4%
Capital Structure (AUD)
Ordinary Shares 123.1m
Market Cap at $3.80 ~$470m
Cash as at 31 December 2012 ~$58m
Debt ~$140m
Enterprise Value ~$550m
Options, Performance Rights 2.5m
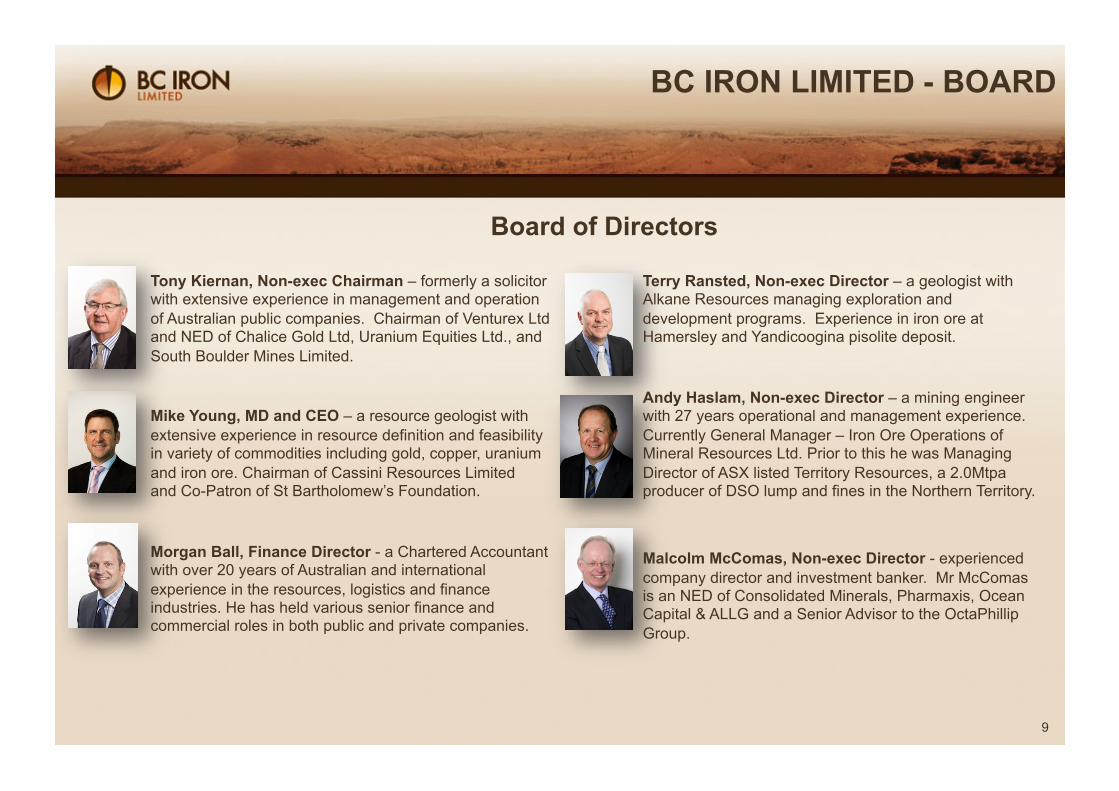
Tony Kiernan, Non-exec Chairman – formerly a solicitor with extensive experience in management and operation of Australian public companies. Chairman of Venturex Ltd and NED of Chalice Gold Ltd, Uranium Equities Ltd., and South Boulder Mines Limited.
Mike Young, MD and CEO – a resource geologist with extensive experience in resource definition and feasibility in variety of commodities including gold, copper, uranium and iron ore. Chairman of Cassini Resources Limited and Co-Patron of St Bartholomew’s Foundation.
Morgan Ball, Finance Director - a Chartered Accountant with over 20 years of Australian and international experience in the resources, logistics and finance industries. He has held various senior finance and commercial roles in both public and private companies.
9
BC IRON LIMITED - BOARD
Board of Directors
Terry Ransted, Non-exec Director – a geologist with Alkane Resources managing exploration and development programs. Experience in iron ore at Hamersley and Yandicoogina pisolite deposit.
Andy Haslam, Non-exec Director – a mining engineer with 27 years operational and management experience. Currently General Manager – Iron Ore Operations of Mineral Resources Ltd. Prior to this he was Managing Director of ASX listed Territory Resources, a 2.0Mtpa producer of DSO lump and fines in the Northern Territory.
Malcolm McComas, Non-exec Director - experienced company director and investment banker. Mr McComas is an NED of Consolidated Minerals, Pharmaxis, Ocean Capital & ALLG and a Senior Advisor to the OctaPhillip Group.
10
BC IRON LIMITED
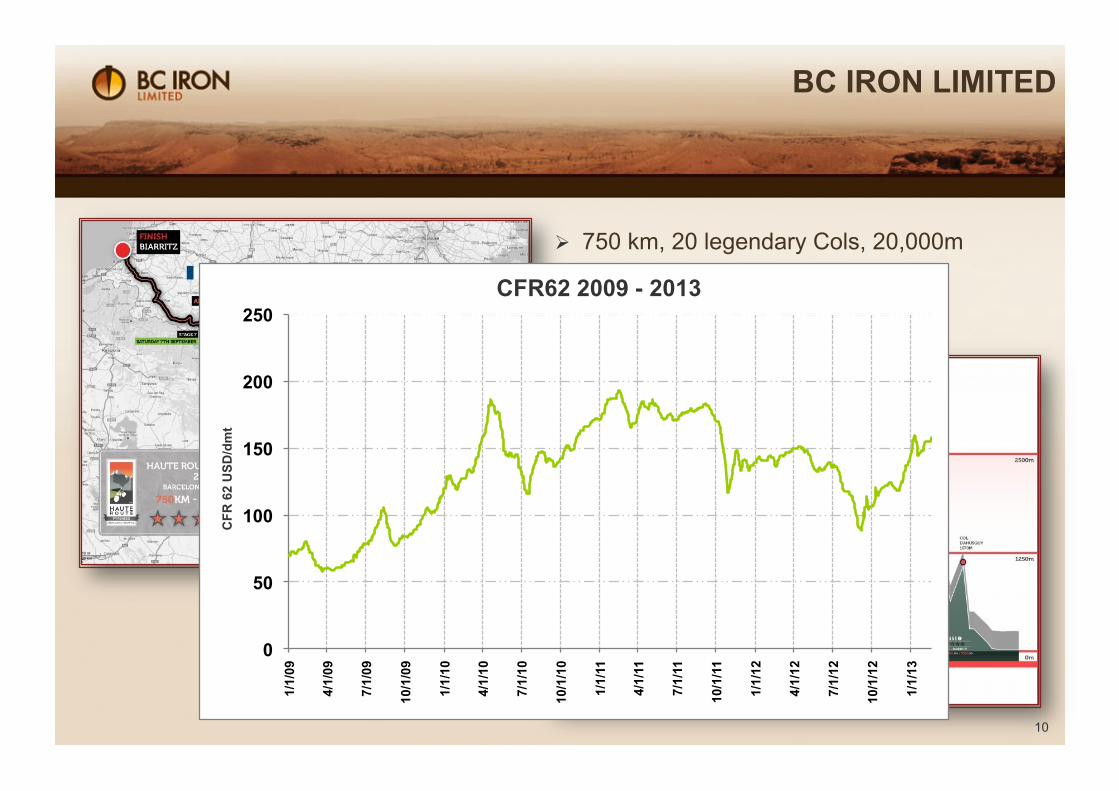
What next? 750 km, 20 legendary Cols, 20,000m climbing
7 days, 600 cyclists & 1 best mate
0
50
100
150
200
250 1/
1/09
4/1/
09
7/1/
09
10/1
/09
1/1/
10
4/1/
10
7/1/
10
10/1
/10
1/1/
11
4/1/
11
7/1/
11
10/1
/11
1/1/
12
4/1/
12
7/1/
12
10/1
/12
1/1/
13
CFR
62
USD
/dm
t
CFR62 2009 - 2013
11
NULLAGINE JOINT VENTURE
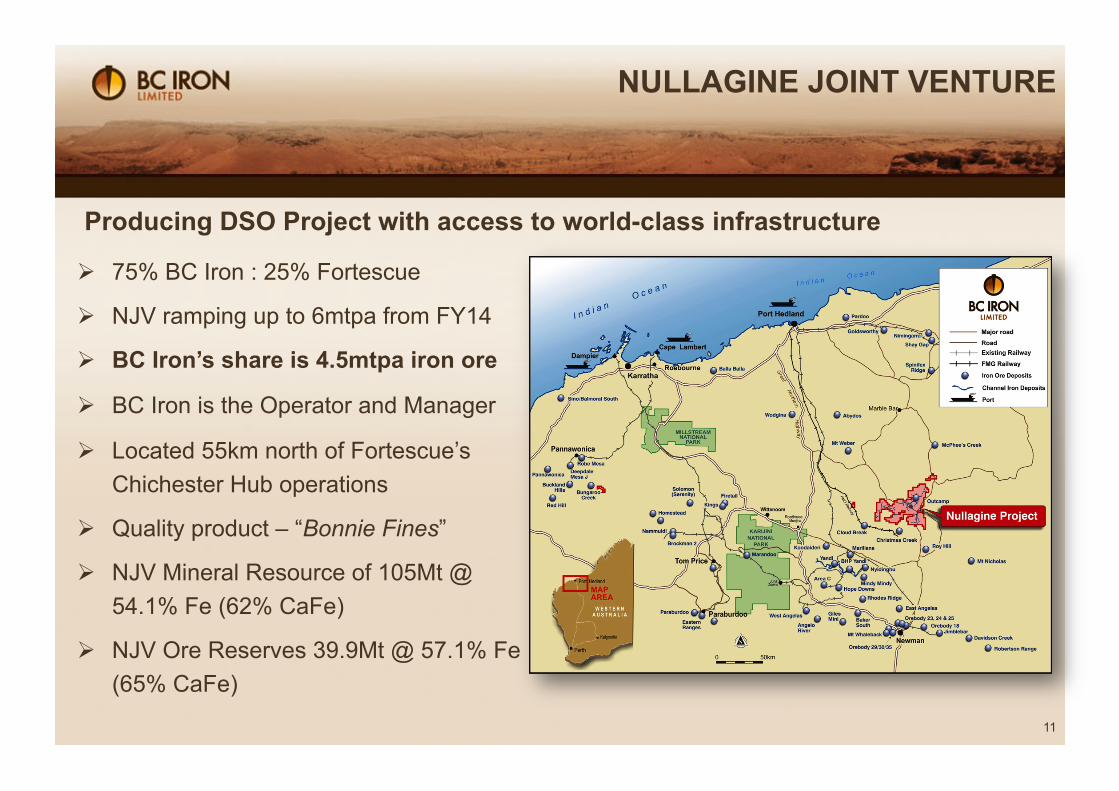
75% BC Iron : 25% Fortescue
NJV ramping up to 6mtpa from FY14
BC Iron’s share is 4.5mtpa iron ore
BC Iron is the Operator and Manager
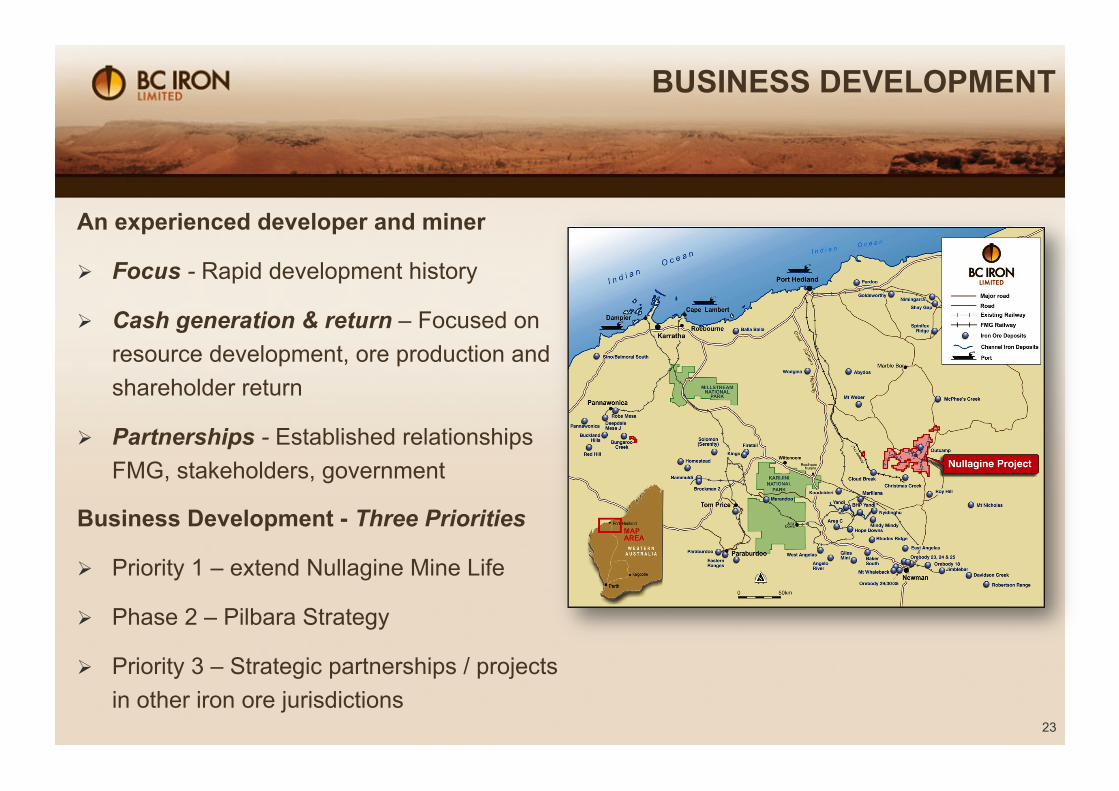
Located 55km north of Fortescue’s Chichester Hub operations
Quality product – “Bonnie Fines”
NJV Mineral Resource of 105Mt @ 54.1% Fe (62% CaFe)
NJV Ore Reserves 39.9Mt @ 57.1% Fe (65% CaFe)
Producing DSO Project with access to world-class infrastructure
12
NULLAGINE JOINT VENTURE
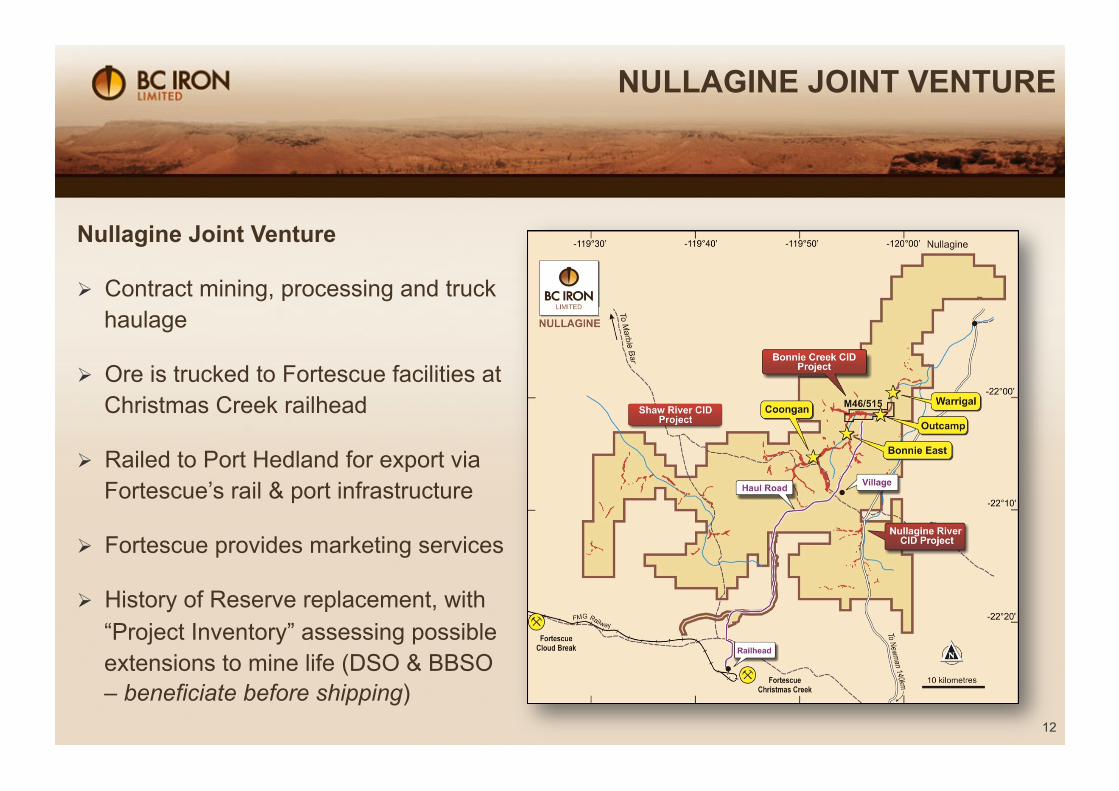
Nullagine Joint Venture
Contract mining, processing and truck haulage
Ore is trucked to Fortescue facilities at Christmas Creek railhead
Railed to Port Hedland for export via Fortescue’s rail & port infrastructure
Fortescue provides marketing services
History of Reserve replacement, with “Project Inventory” assessing possible extensions to mine life (DSO & BBSO – beneficiate before shipping)
13
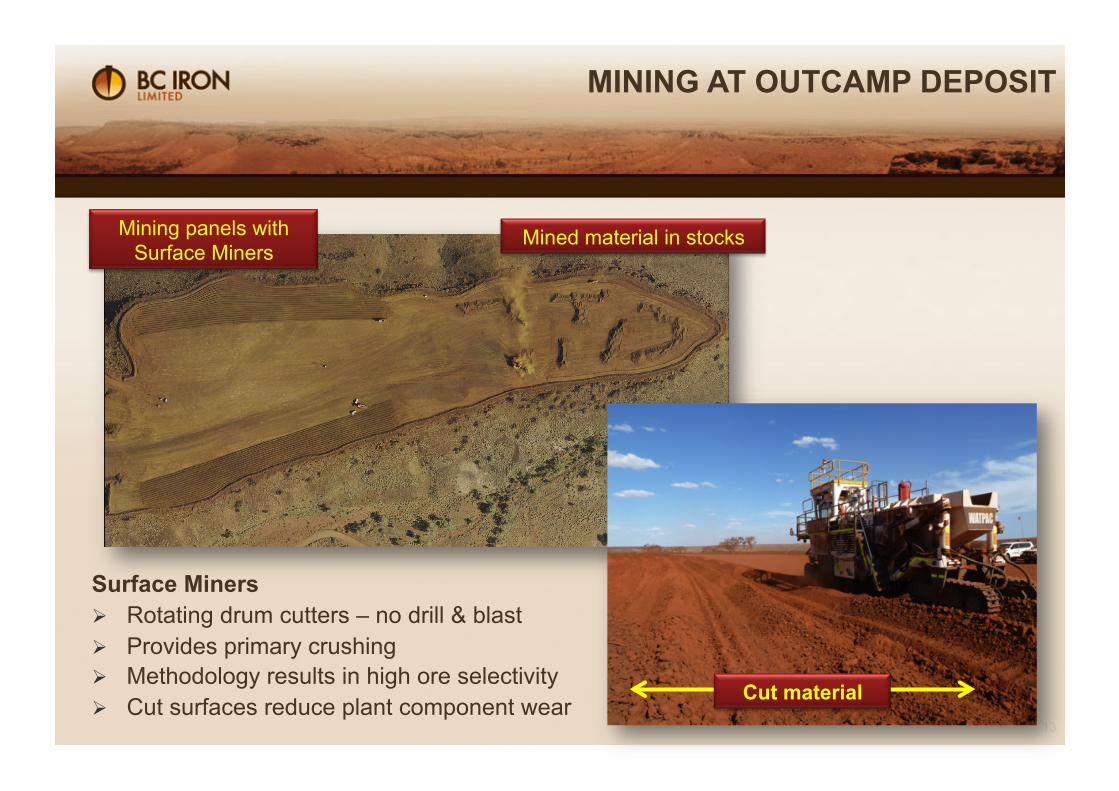
Mined material in stocks Mining panels with Surface Miners
Surface Miners Rotating drum cutters – no drill & blast Provides primary crushing Methodology results in high ore selectivity Cut surfaces reduce plant component wear
Cut material
MINING AT OUTCAMP DEPOSIT
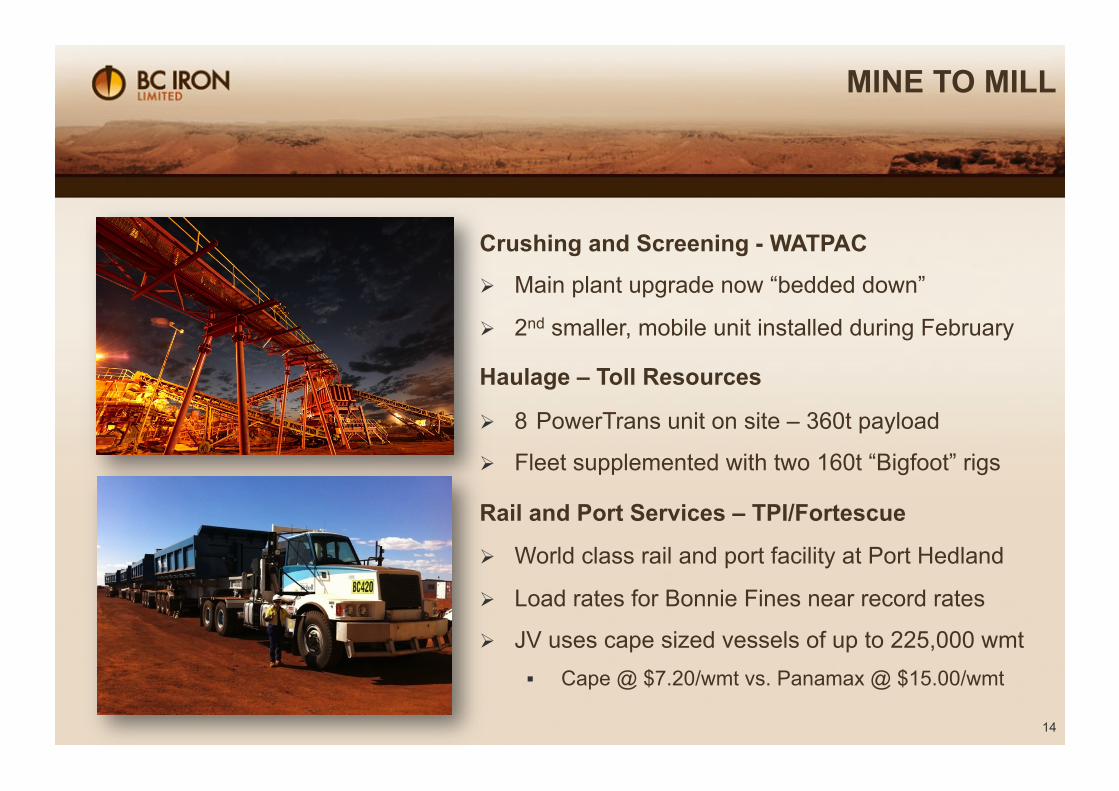
MINE TO MILL
14
Crushing and Screening - WATPAC
Main plant upgrade now “bedded down”
2nd smaller, mobile unit installed during February
Haulage – Toll Resources
8 PowerTrans unit on site – 360t payload
Fleet supplemented with two 160t “Bigfoot” rigs
Rail and Port Services – TPI/Fortescue
World class rail and port facility at Port Hedland
Load rates for Bonnie Fines near record rates
JV uses cape sized vessels of up to 225,000 wmt Cape @ $7.20/wmt vs. Panamax @ $15.00/wmt
15
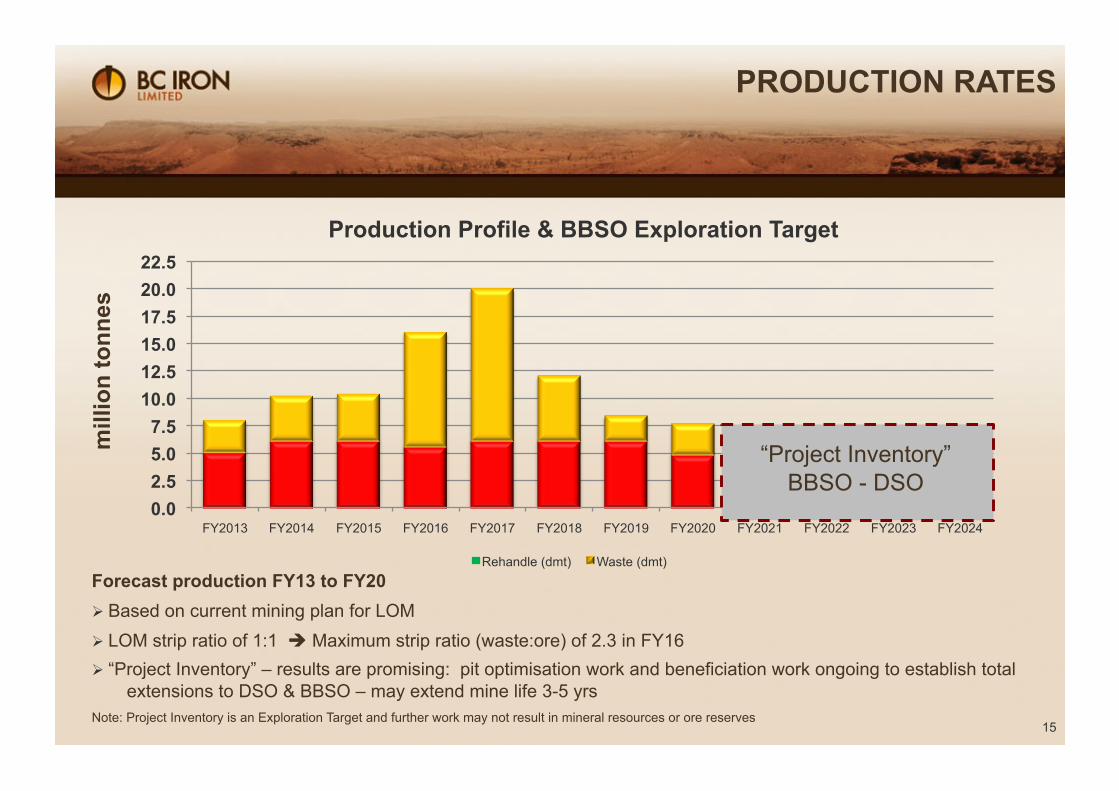
Forecast production FY13 to FY20 Based on current mining plan for LOM LOM strip ratio of 1:1 Maximum strip ratio (waste:ore) of 2.3 in FY16 “Project Inventory” – results are promising: pit optimisation work and beneficiation work ongoing to establish total
extensions to DSO & BBSO – may extend mine life 3-5 yrs
Note: Project Inventory is an Exploration Target and further work may not result in mineral resources or ore reserves
PRODUCTION RATES m
illio
n to
nnes
0.0 2.5 5.0 7.5
10.0 12.5 15.0 17.5 20.0 22.5
FY2013 FY2014 FY2015 FY2016 FY2017 FY2018 FY2019 FY2020 FY2021 FY2022 FY2023 FY2024
Production Profile & BBSO Exploration Target
Rehandle (dmt) Waste (dmt)
“Project Inventory” BBSO - DSO
16
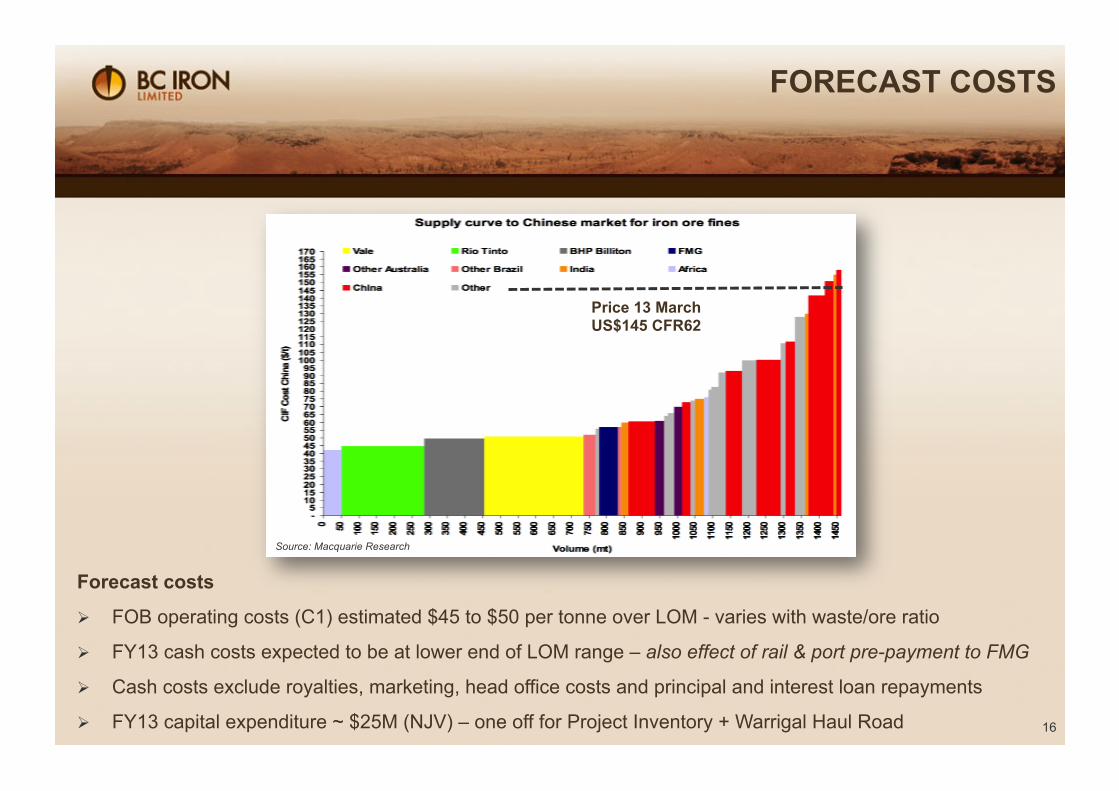
Forecast costs
FOB operating costs (C1) estimated $45 to $50 per tonne over LOM - varies with waste/ore ratio
FY13 cash costs expected to be at lower end of LOM range – also effect of rail & port pre-payment to FMG
Cash costs exclude royalties, marketing, head office costs and principal and interest loan repayments
FY13 capital expenditure ~ $25M (NJV) – one off for Project Inventory + Warrigal Haul Road
FORECAST COSTS
Source: Macquarie Research
Price 13 March US$145 CFR62
17
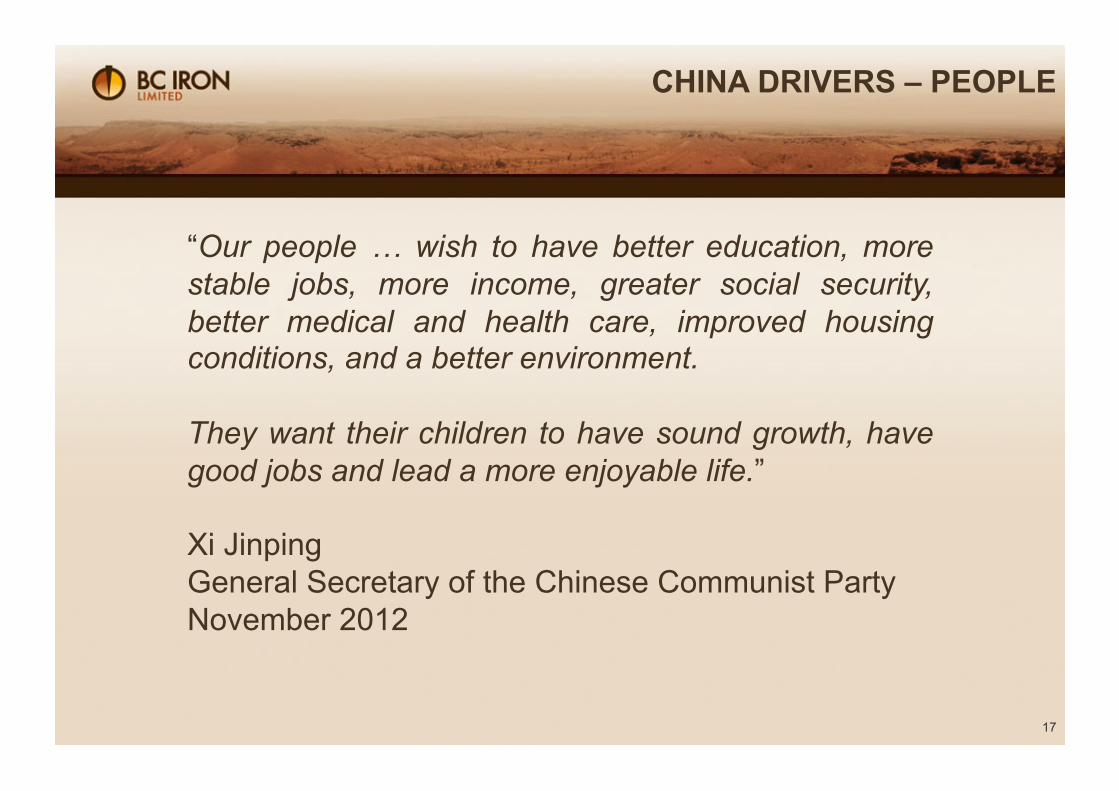
CHINA DRIVERS – PEOPLE
“Our people … wish to have better education, more stable jobs, more income, greater social security, better medical and health care, improved housing conditions, and a better environment.
They want their children to have sound growth, have good jobs and lead a more enjoyable life.”
Xi Jinping General Secretary of the Chinese Communist Party November 2012
18
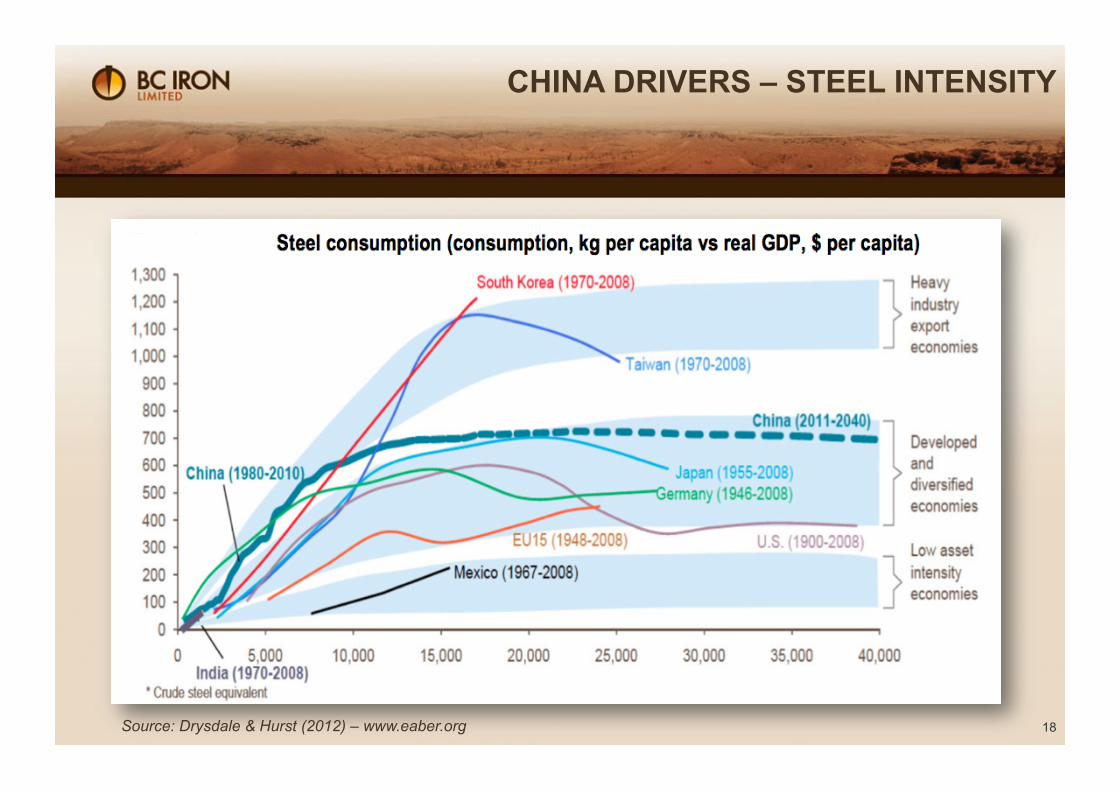
CHINA DRIVERS – STEEL INTENSITY
Source: Drysdale & Hurst (2012) – www.eaber.org
19
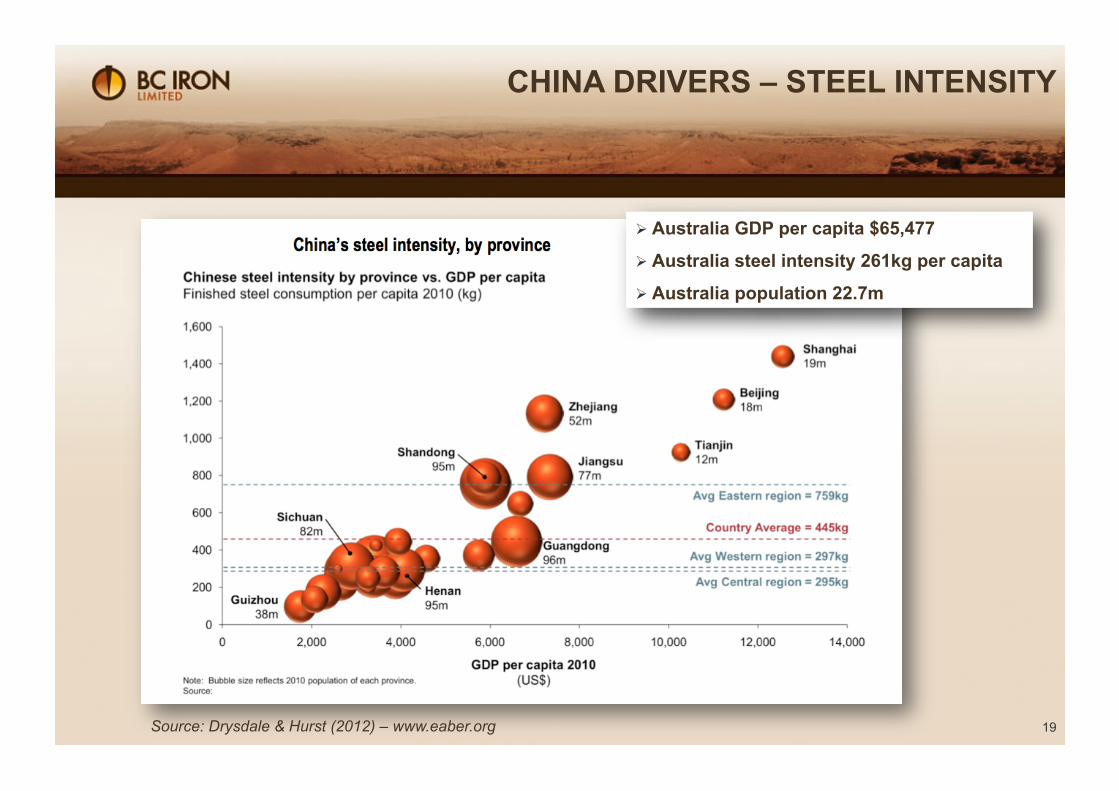
CHINA DRIVERS – STEEL INTENSITY
Australia GDP per capita $65,477
Australia steel intensity 261kg per capita
Australia population 22.7m
Source: Drysdale & Hurst (2012) – www.eaber.org
20
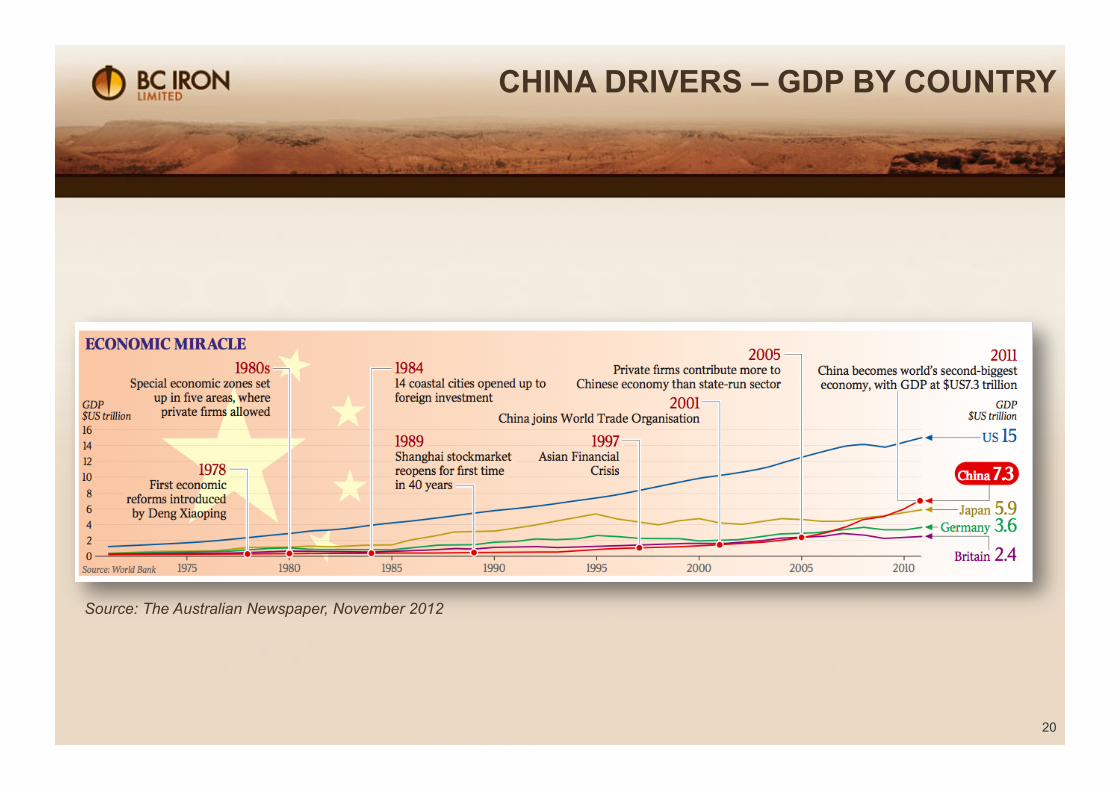
CHINA DRIVERS – GDP BY COUNTRY
Source: The Australian Newspaper, November 2012
100
110
120
130
140
150
160
Feb
2012
Mar
201
2
Apr
201
2
May
201
2
Jun
2012
Jul 2
012
Aug
201
2
Sep
2012
Oct
201
2
Nov
201
2
Dec
201
2
Jan
2013
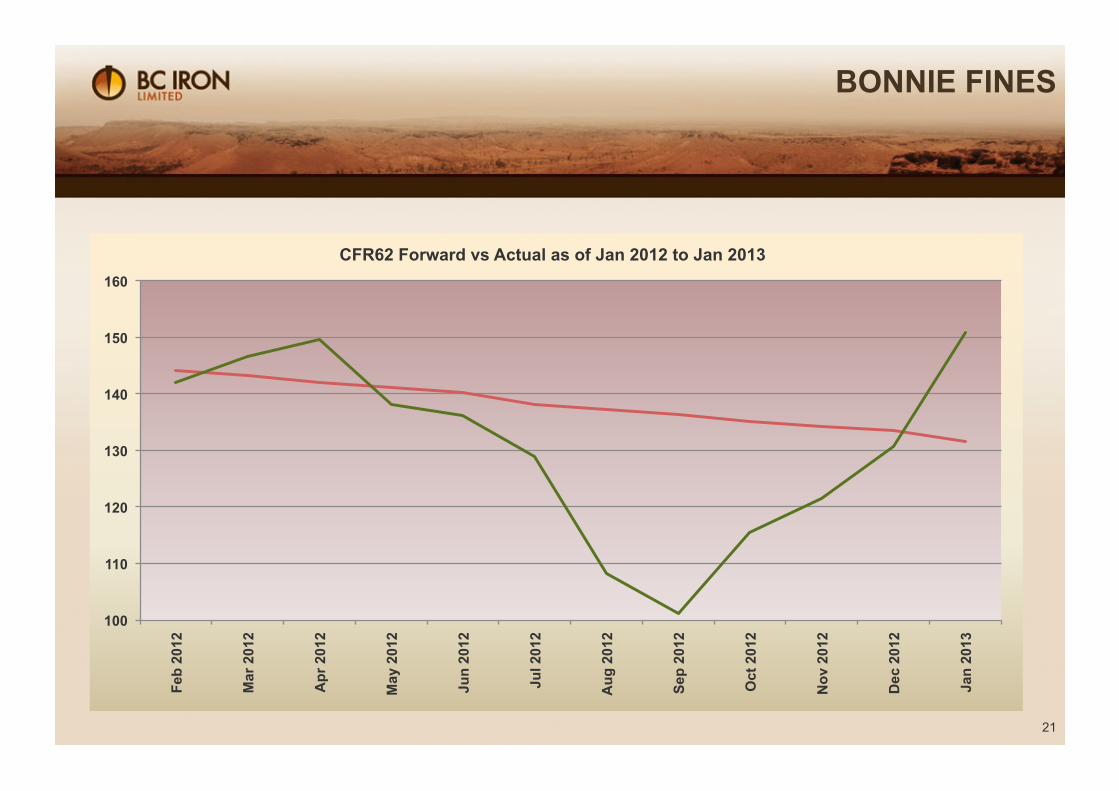
CFR62 Forward as of Jan 2012 to Jan 2013
21
BONNIE FINES
100
110
120
130
140
150
160
Feb
2012
Mar
201
2
Apr
201
2
May
201
2
Jun
2012
Jul 2
012
Aug
201
2
Sep
2012
Oct
201
2
Nov
201
2
Dec
201
2
Jan
2013
CFR62 Forward vs Actual as of Jan 2012 to Jan 2013
22
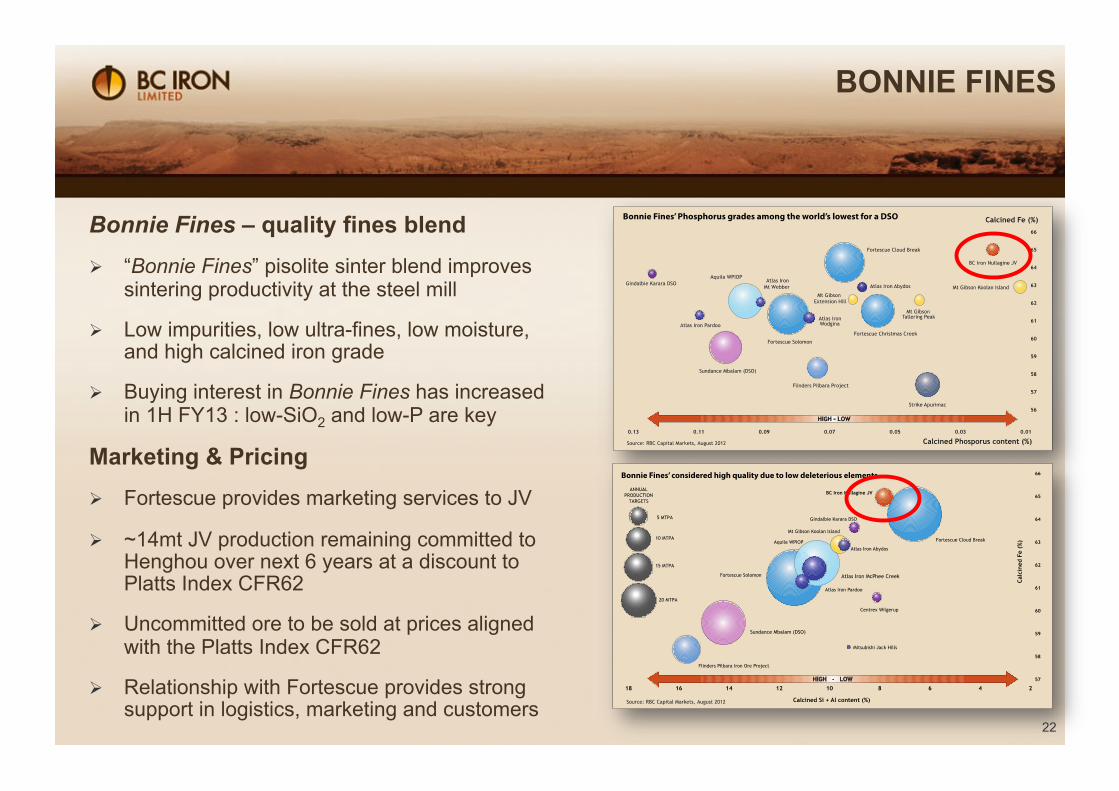
Bonnie Fines – quality fines blend
“Bonnie Fines” pisolite sinter blend improves sintering productivity at the steel mill
Low impurities, low ultra-fines, low moisture, and high calcined iron grade
Buying interest in Bonnie Fines has increased in 1H FY13 : low-SiO2 and low-P are key
Marketing & Pricing
Fortescue provides marketing services to JV
~14mt JV production remaining committed to Henghou over next 6 years at a discount to Platts Index CFR62
Uncommitted ore to be sold at prices aligned with the Platts Index CFR62
Relationship with Fortescue provides strong support in logistics, marketing and customers
BONNIE FINES
23
BUSINESS DEVELOPMENT
An experienced developer and miner
Focus - Rapid development history
Cash generation & return – Focused on resource development, ore production and shareholder return
Partnerships - Established relationships FMG, stakeholders, government
Business Development - Three Priorities
Priority 1 – extend Nullagine Mine Life
Phase 2 – Pilbara Strategy
Priority 3 – Strategic partnerships / projects in other iron ore jurisdictions
24
BUSINESS DEVELOPMENT
Business Development - Three Priorities
Priority 1 – extend Nullagine Mine Life
• Project Inventory underway
• Beneficiation, optimisation at DSO(56)
Phase 2 – Pilbara Strategy
• Access to rail and port for life of JV
• Investigate smaller deposits in Pilbara
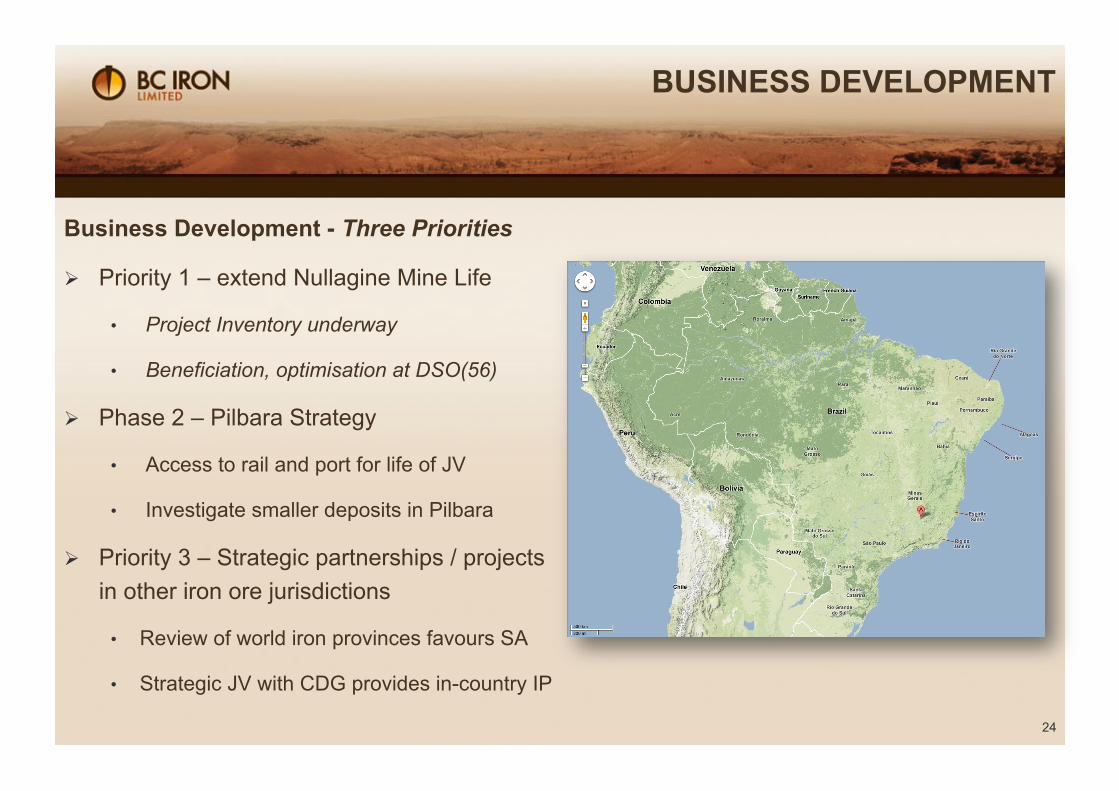
Priority 3 – Strategic partnerships / projects in other iron ore jurisdictions
• Review of world iron provinces favours SA
• Strategic JV with CDG provides in-country IP
25
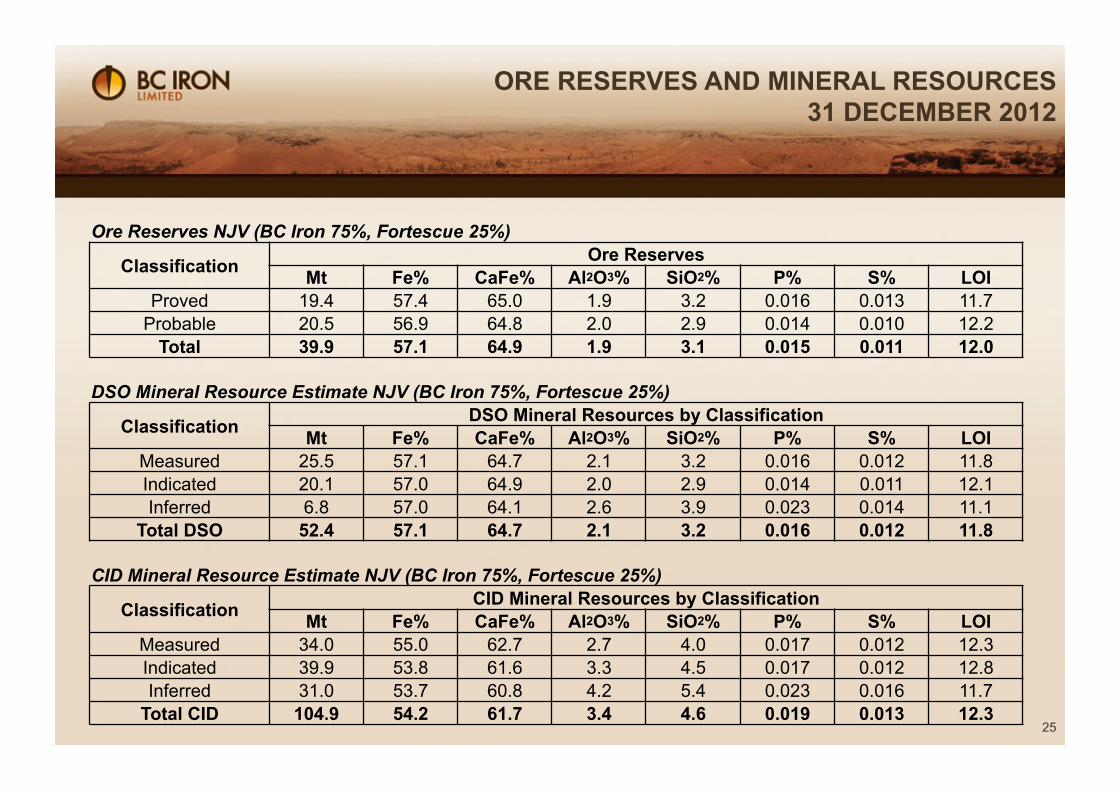
ORE RESERVES AND MINERAL RESOURCES 31 DECEMBER 2012
Ore Reserves NJV (BC Iron 75%, Fortescue 25%)
Classification Ore Reserves Mt Fe% CaFe% Al2O3% SiO2% P% S% LOI
Proved 19.4 57.4 65.0 1.9 3.2 0.016 0.013 11.7 Probable 20.5 56.9 64.8 2.0 2.9 0.014 0.010 12.2
Total 39.9 57.1 64.9 1.9 3.1 0.015 0.011 12.0
DSO Mineral Resource Estimate NJV (BC Iron 75%, Fortescue 25%)
Classification DSO Mineral Resources by Classification Mt Fe% CaFe% Al2O3% SiO2% P% S% LOI
Measured 25.5 57.1 64.7 2.1 3.2 0.016 0.012 11.8 Indicated 20.1 57.0 64.9 2.0 2.9 0.014 0.011 12.1 Inferred 6.8 57.0 64.1 2.6 3.9 0.023 0.014 11.1
Total DSO 52.4 57.1 64.7 2.1 3.2 0.016 0.012 11.8
CID Mineral Resource Estimate NJV (BC Iron 75%, Fortescue 25%)
Classification CID Mineral Resources by Classification Mt Fe% CaFe% Al2O3% SiO2% P% S% LOI
Measured 34.0 55.0 62.7 2.7 4.0 0.017 0.012 12.3 Indicated 39.9 53.8 61.6 3.3 4.5 0.017 0.012 12.8 Inferred 31.0 53.7 60.8 4.2 5.4 0.023 0.016 11.7
Total CID 104.9 54.2 61.7 3.4 4.6 0.019 0.013 12.3
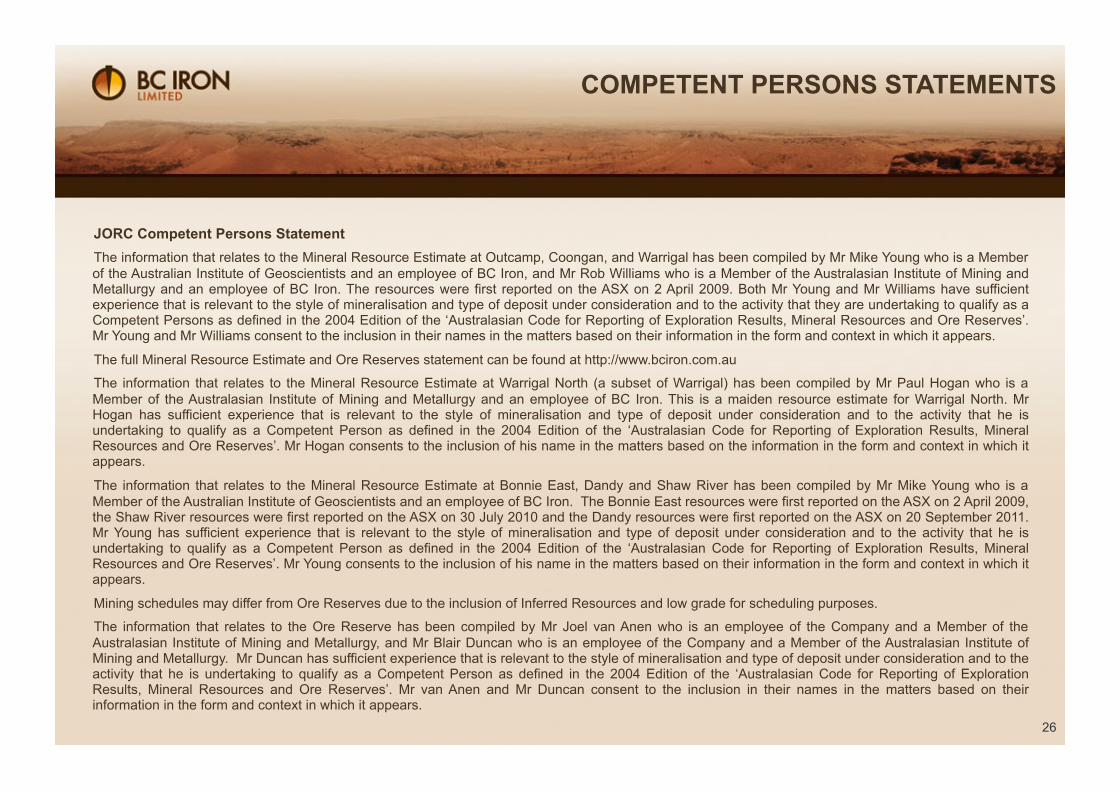
COMPETENT PERSONS STATEMENTS
26
JORC Competent Persons Statement The information that relates to the Mineral Resource Estimate at Outcamp, Coongan, and Warrigal has been compiled by Mr Mike Young who is a Member of the Australian Institute of Geoscientists and an employee of BC Iron, and Mr Rob Williams who is a Member of the Australasian Institute of Mining and Metallurgy and an employee of BC Iron. The resources were first reported on the ASX on 2 April 2009. Both Mr Young and Mr Williams have sufficient experience that is relevant to the style of mineralisation and type of deposit under consideration and to the activity that they are undertaking to qualify as a Competent Persons as defined in the 2004 Edition of the ‘Australasian Code for Reporting of Exploration Results, Mineral Resources and Ore Reserves’. Mr Young and Mr Williams consent to the inclusion in their names in the matters based on their information in the form and context in which it appears.
The full Mineral Resource Estimate and Ore Reserves statement can be found at http://www.bciron.com.au
The information that relates to the Mineral Resource Estimate at Warrigal North (a subset of Warrigal) has been compiled by Mr Paul Hogan who is a Member of the Australasian Institute of Mining and Metallurgy and an employee of BC Iron. This is a maiden resource estimate for Warrigal North. Mr Hogan has sufficient experience that is relevant to the style of mineralisation and type of deposit under consideration and to the activity that he is undertaking to qualify as a Competent Person as defined in the 2004 Edition of the ‘Australasian Code for Reporting of Exploration Results, Mineral Resources and Ore Reserves’. Mr Hogan consents to the inclusion of his name in the matters based on the information in the form and context in which it appears.
The information that relates to the Mineral Resource Estimate at Bonnie East, Dandy and Shaw River has been compiled by Mr Mike Young who is a Member of the Australian Institute of Geoscientists and an employee of BC Iron. The Bonnie East resources were first reported on the ASX on 2 April 2009, the Shaw River resources were first reported on the ASX on 30 July 2010 and the Dandy resources were first reported on the ASX on 20 September 2011. Mr Young has sufficient experience that is relevant to the style of mineralisation and type of deposit under consideration and to the activity that he is undertaking to qualify as a Competent Person as defined in the 2004 Edition of the ‘Australasian Code for Reporting of Exploration Results, Mineral Resources and Ore Reserves’. Mr Young consents to the inclusion of his name in the matters based on their information in the form and context in which it appears.
Mining schedules may differ from Ore Reserves due to the inclusion of Inferred Resources and low grade for scheduling purposes.
The information that relates to the Ore Reserve has been compiled by Mr Joel van Anen who is an employee of the Company and a Member of the Australasian Institute of Mining and Metallurgy, and Mr Blair Duncan who is an employee of the Company and a Member of the Australasian Institute of Mining and Metallurgy. Mr Duncan has sufficient experience that is relevant to the style of mineralisation and type of deposit under consideration and to the activity that he is undertaking to qualify as a Competent Person as defined in the 2004 Edition of the ‘Australasian Code for Reporting of Exploration Results, Mineral Resources and Ore Reserves’. Mr van Anen and Mr Duncan consent to the inclusion in their names in the matters based on their information in the form and context in which it appears.
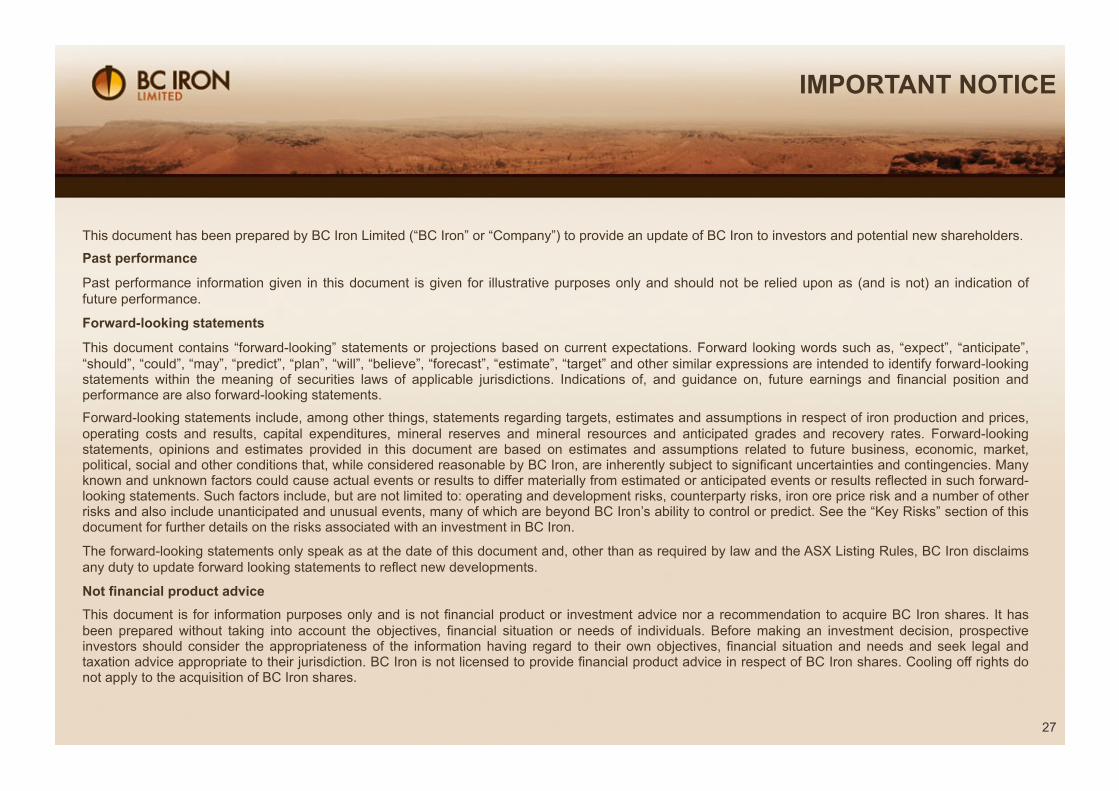
IMPORTANT NOTICE
27
This document has been prepared by BC Iron Limited (“BC Iron” or “Company”) to provide an update of BC Iron to investors and potential new shareholders.
Past performance
Past performance information given in this document is given for illustrative purposes only and should not be relied upon as (and is not) an indication of future performance.
Forward-looking statements
This document contains “forward-looking” statements or projections based on current expectations. Forward looking words such as, “expect”, “anticipate”, “should”, “could”, “may”, “predict”, “plan”, “will”, “believe”, “forecast”, “estimate”, “target” and other similar expressions are intended to identify forward-looking statements within the meaning of securities laws of applicable jurisdictions. Indications of, and guidance on, future earnings and financial position and performance are also forward-looking statements.
Forward-looking statements include, among other things, statements regarding targets, estimates and assumptions in respect of iron production and prices, operating costs and results, capital expenditures, mineral reserves and mineral resources and anticipated grades and recovery rates. Forward-looking statements, opinions and estimates provided in this document are based on estimates and assumptions related to future business, economic, market, political, social and other conditions that, while considered reasonable by BC Iron, are inherently subject to significant uncertainties and contingencies. Many known and unknown factors could cause actual events or results to differ materially from estimated or anticipated events or results reflected in such forward-looking statements. Such factors include, but are not limited to: operating and development risks, counterparty risks, iron ore price risk and a number of other risks and also include unanticipated and unusual events, many of which are beyond BC Iron’s ability to control or predict. See the “Key Risks” section of this document for further details on the risks associated with an investment in BC Iron.
The forward-looking statements only speak as at the date of this document and, other than as required by law and the ASX Listing Rules, BC Iron disclaims any duty to update forward looking statements to reflect new developments.
Not financial product advice This document is for information purposes only and is not financial product or investment advice nor a recommendation to acquire BC Iron shares. It has been prepared without taking into account the objectives, financial situation or needs of individuals. Before making an investment decision, prospective investors should consider the appropriateness of the information having regard to their own objectives, financial situation and needs and seek legal and taxation advice appropriate to their jurisdiction. BC Iron is not licensed to provide financial product advice in respect of BC Iron shares. Cooling off rights do not apply to the acquisition of BC Iron shares.
BC IRON LIMITED
Level 1, 15 Rheola Street West Perth, WA, Australia Phone : +61 8 6311 3400 email : [email protected] www.bciron.com.au