Embed Size (px)
Citation preview

Barnes GroupInvestor Overview
July 2017
THIS PRESENTATION CONTAINS FORWARD-LOOKING STATEMENTS
• Forward-looking statements are made based upon management's good faith expectations and beliefs concerning future developments and their potential effect upon the Company.
• These forward-looking statements are subject to risks and uncertainties that may cause actual results to differ materially from those expressed in the forward-looking statements, including the risks and uncertainties set forth under our full disclosure located at the end of this presentation and included in our SEC filings.
• The Company assumes no obligation to update our forward-looking statements.
References to adjusted financial results are non-GAAP measures. You will find GAAP reconciliation tables at the end of this presentation.
Safe Harbor Statement
-2-
Americas56%
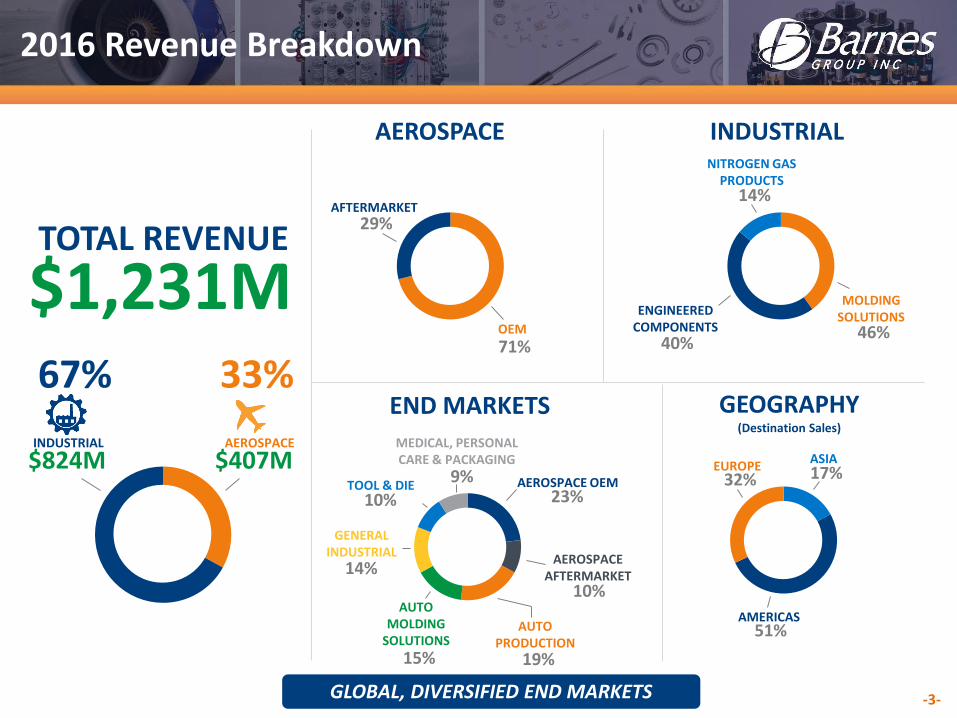
2016 Revenue Breakdown
Aero %AEROSPACEINDUSTRIAL
$407M$824M
33%67%
TOTAL REVENUE
$1,231M
AEROSPACE INDUSTRIAL
END MARKETS GEOGRAPHY(Destination Sales)
OEM
71%
AFTERMARKET29%
46%
NITROGEN GAS PRODUCTS
14%
ENGINEERED COMPONENTS
40%
MOLDINGSOLUTIONS
AEROSPACE OEM23%
AEROSPACE AFTERMARKET
10%
AUTOPRODUCTION
19%
AUTOMOLDING
SOLUTIONS
15%
GENERAL INDUSTRIAL
14%
TOOL & DIE10%
MEDICAL, PERSONAL CARE & PACKAGING
9%EUROPE
32%ASIA17%
AMERICAS51%
GLOBAL, DIVERSIFIED END MARKETS -3-
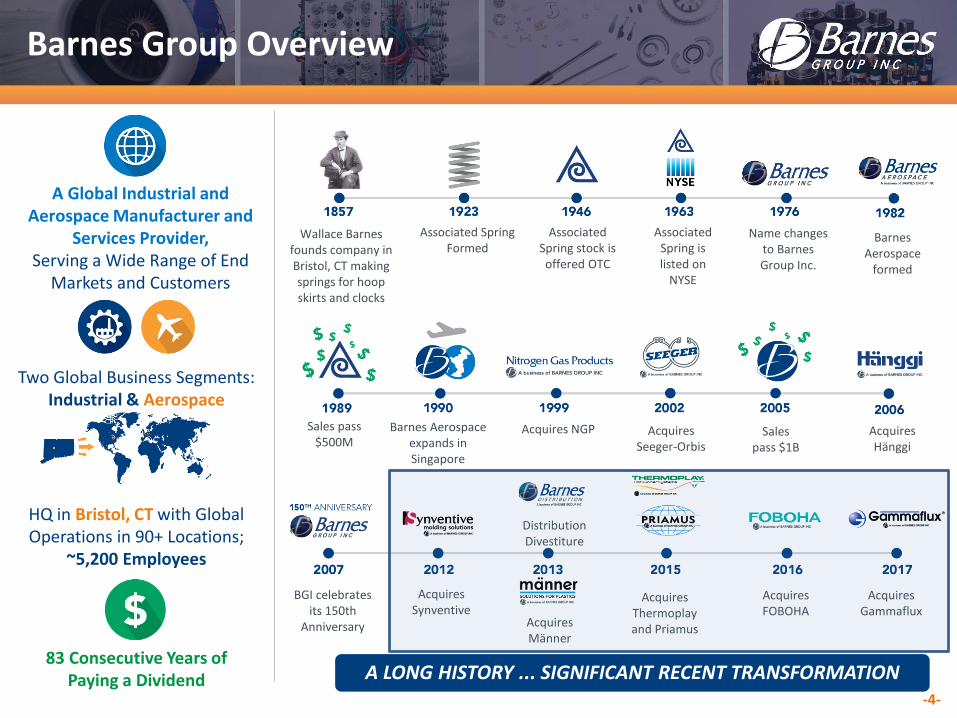
A LONG HISTORY ... SIGNIFICANT RECENT TRANSFORMATION
Wallace Barnes founds company in Bristol, CT making springs for hoop skirts and clocks
Associated Spring Formed
Associated Spring stock is offered OTC
Associated Spring is listed on
NYSE
Name changes to Barnes Group Inc.
Barnes Aerospace
formed
Sales pass $500M
Barnes Aerospace expands in Singapore
Acquires NGP Acquires Seeger-Orbis
Sales pass $1B
AcquiresHänggi
BGI celebrates its 150th
Anniversary
AcquiresSynventive
AcquiresMänner
DistributionDivestiture
Acquires Thermoplay and Priamus
Acquires FOBOHA
A Global Industrial and Aerospace Manufacturer and
Services Provider, Serving a Wide Range of End
Markets and Customers
Two Global Business Segments: Industrial & Aerospace
HQ in Bristol, CT with Global Operations in 90+ Locations;
~5,200 Employees
83 Consecutive Years of Paying a Dividend
Barnes Group Overview
-4-
Acquires Gammaflux
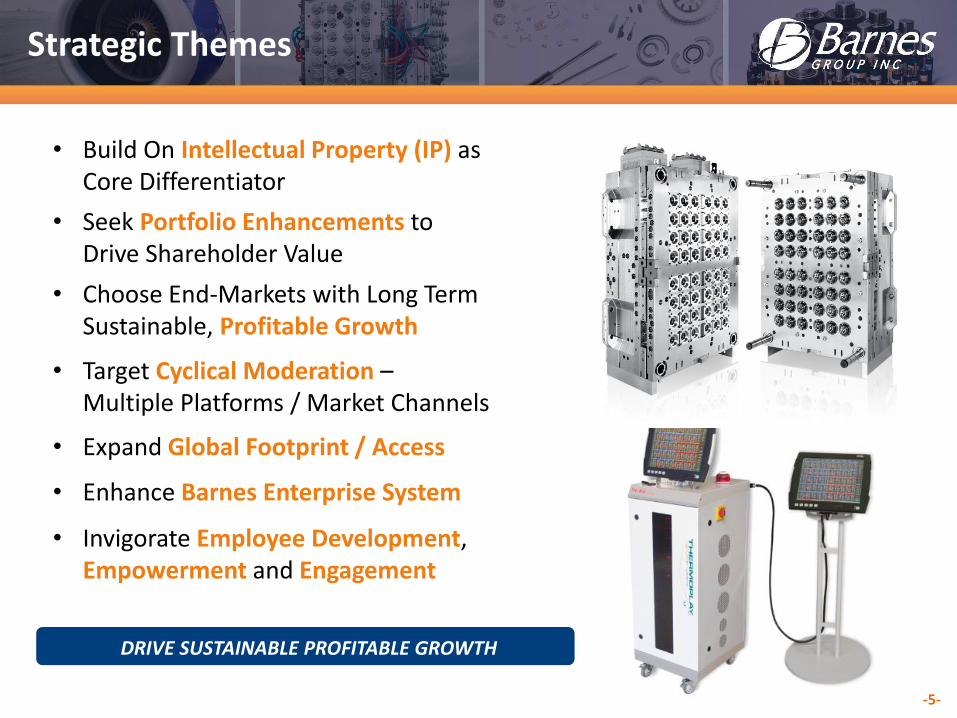
Strategic Themes
• Build On Intellectual Property (IP) as Core Differentiator
• Seek Portfolio Enhancements to Drive Shareholder Value
• Choose End-Markets with Long Term Sustainable, Profitable Growth
• Target Cyclical Moderation –Multiple Platforms / Market Channels
• Expand Global Footprint / Access
• Enhance Barnes Enterprise System
• Invigorate Employee Development, Empowerment and Engagement
DRIVE SUSTAINABLE PROFITABLE GROWTH
-5-
$105$300
$160
$110
$38
$9
$75
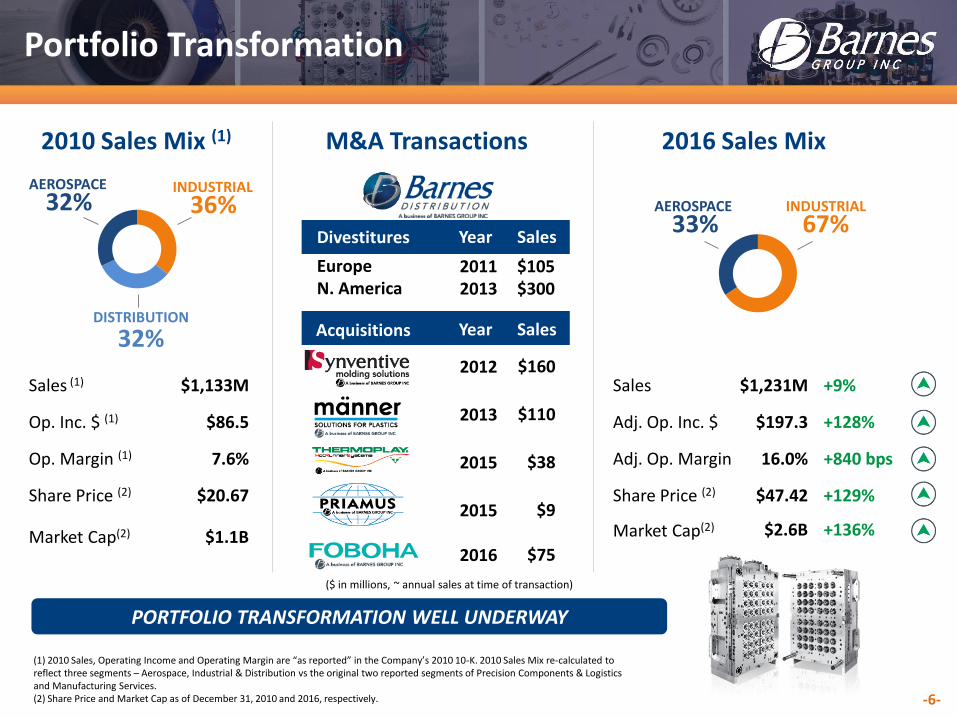
Portfolio Transformation
2010 Sales Mix (1) M&A Transactions 2016 Sales Mix
32% 36%
32%
INDUSTRIALAEROSPACE
DISTRIBUTION
Divestitures
EuropeN. America
Year Sales
Acquisitions Year Sales
20112013
2012
2013
2015
2015
2016
($ in millions, ~ annual sales at time of transaction)
Sales (1)
Op. Inc. $ (1)
Op. Margin (1)
Share Price (2)
Market Cap(2)
$1,133M
$86.5
7.6%
$20.67
$1.1B
Sales
Adj. Op. Inc. $
Adj. Op. Margin
Share Price (2)
Market Cap(2)
$1,231M
$197.3
16.0%
$47.42
$2.6B
+9%
+128%
+840 bps
+129%
+136%
67%33%AEROSPACE INDUSTRIAL
(1) 2010 Sales, Operating Income and Operating Margin are “as reported” in the Company’s 2010 10-K. 2010 Sales Mix re-calculated to reflect three segments – Aerospace, Industrial & Distribution vs the original two reported segments of Precision Components & Logistics and Manufacturing Services. (2) Share Price and Market Cap as of December 31, 2010 and 2016, respectively.
PORTFOLIO TRANSFORMATION WELL UNDERWAY
-6-
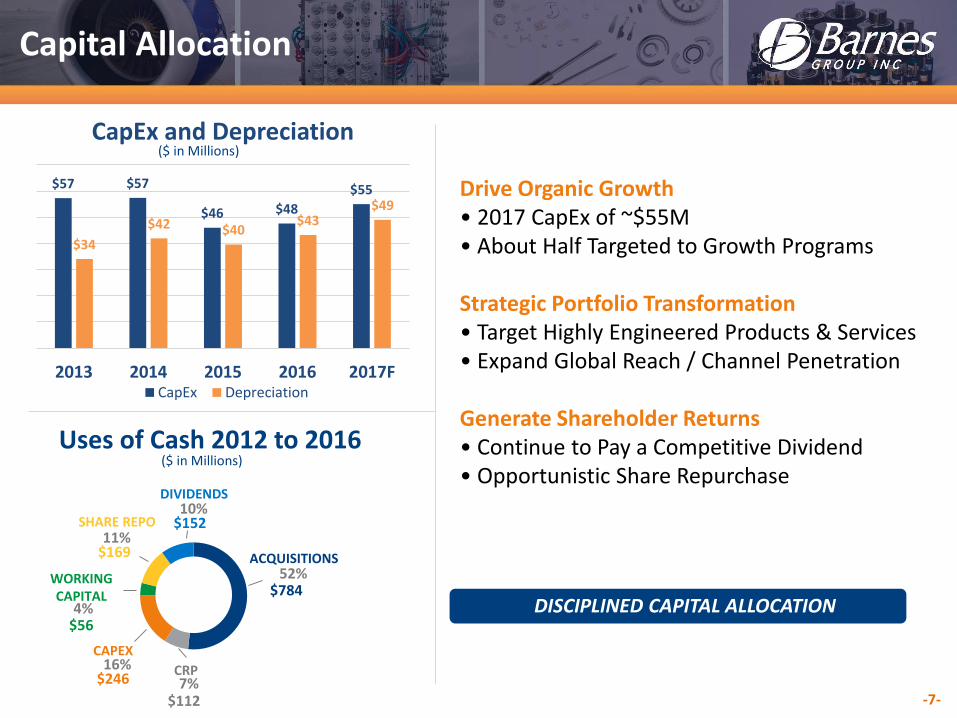
$57 $57
$46 $48
$55
$34
$42 $40$43
$49
2013 2014 2015 2016 2017F
CapEx and Depreciation
CapEx Depreciation
Capital Allocation
Uses of Cash 2012 to 2016($ in Millions)
($ in Millions)
Drive Organic Growth• 2017 CapEx of ~$55M • About Half Targeted to Growth Programs
Strategic Portfolio Transformation• Target Highly Engineered Products & Services • Expand Global Reach / Channel Penetration
Generate Shareholder Returns• Continue to Pay a Competitive Dividend• Opportunistic Share Repurchase
ACQUISITIONS52%
CRP7%
CAPEX16%
WORKING CAPITAL
4%
SHARE REPO11%
$784
$112
$246
$56
$169
DIVIDENDS10%
$152
DISCIPLINED CAPITAL ALLOCATION
-7-
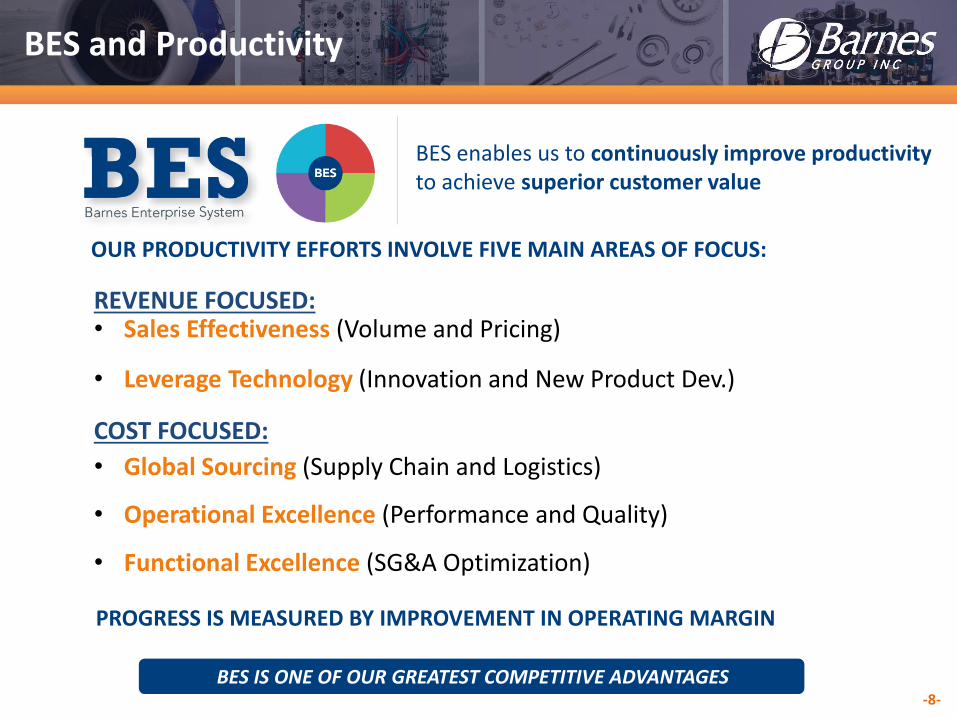
BES and Productivity
BES enables us to continuously improve productivity to achieve superior customer value
OUR PRODUCTIVITY EFFORTS INVOLVE FIVE MAIN AREAS OF FOCUS:
PROGRESS IS MEASURED BY IMPROVEMENT IN OPERATING MARGIN
• Sales Effectiveness (Volume and Pricing)
• Leverage Technology (Innovation and New Product Dev.)
• Global Sourcing (Supply Chain and Logistics)
• Operational Excellence (Performance and Quality)
• Functional Excellence (SG&A Optimization)
BES IS ONE OF OUR GREATEST COMPETITIVE ADVANTAGES-8-
REVENUE FOCUSED:
COST FOCUSED:
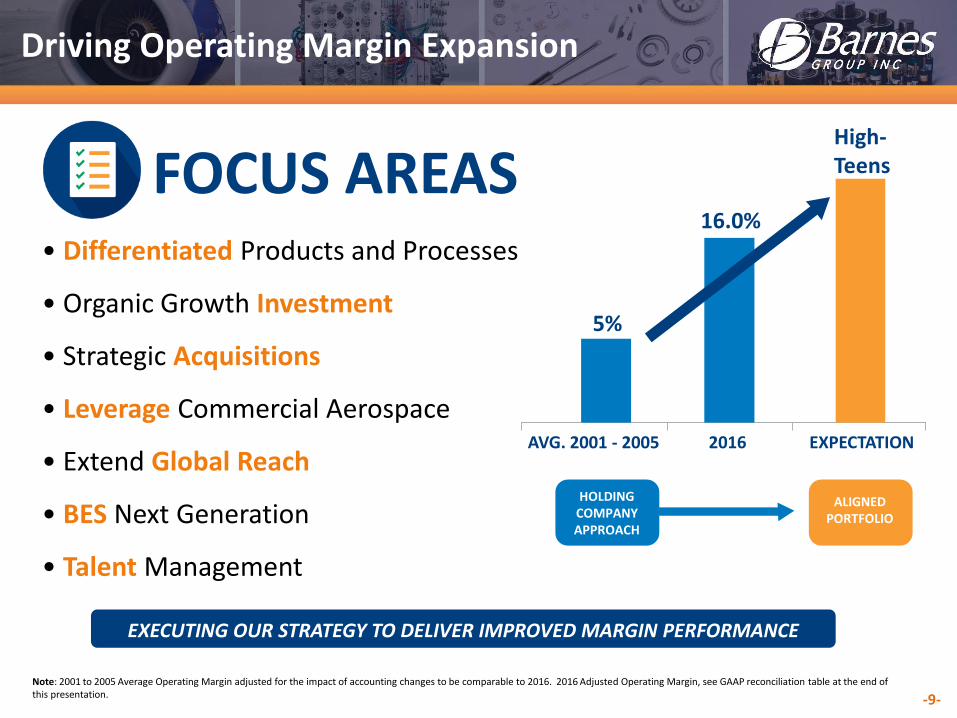
Note: 2001 to 2005 Average Operating Margin adjusted for the impact of accounting changes to be comparable to 2016. 2016 Adjusted Operating Margin, see GAAP reconciliation table at the end of this presentation.
Driving Operating Margin Expansion
• Differentiated Products and Processes
• Organic Growth Investment
• Strategic Acquisitions
• Leverage Commercial Aerospace
• Extend Global Reach
• BES Next Generation
• Talent Management
5%
16.0%
High-Teens
AVG. 2001 - 2005 2016 EXPECTATION
HOLDING COMPANY APPROACH
ALIGNEDPORTFOLIO
EXECUTING OUR STRATEGY TO DELIVER IMPROVED MARGIN PERFORMANCE
FOCUS AREAS
-9-
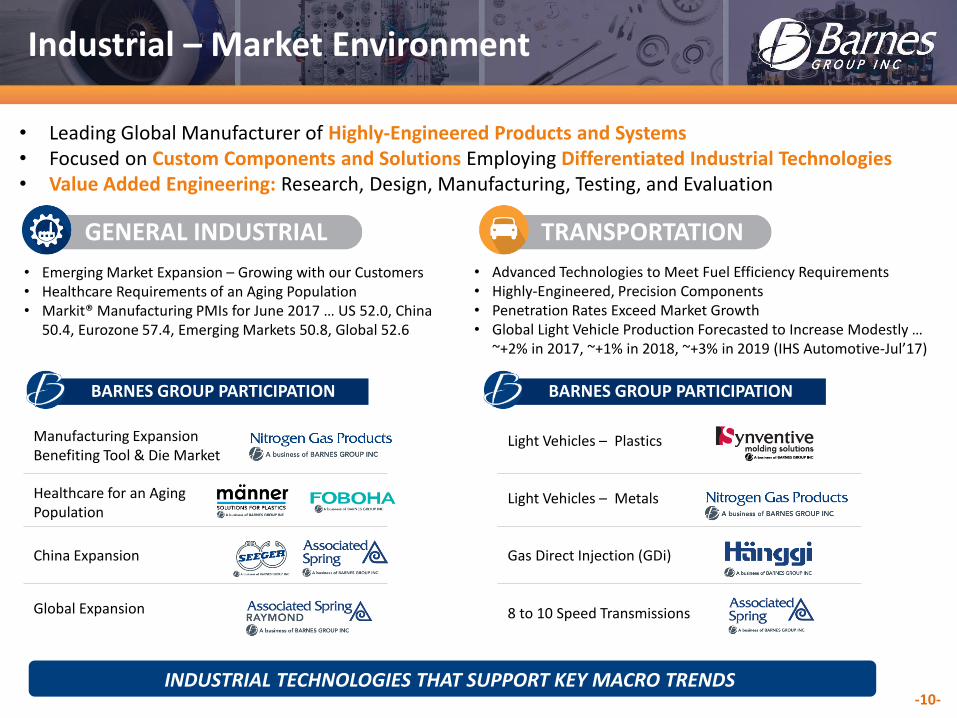
Industrial – Market Environment
• Leading Global Manufacturer of Highly-Engineered Products and Systems • Focused on Custom Components and Solutions Employing Differentiated Industrial Technologies• Value Added Engineering: Research, Design, Manufacturing, Testing, and Evaluation
GENERAL INDUSTRIAL TRANSPORTATION
• Emerging Market Expansion – Growing with our Customers• Healthcare Requirements of an Aging Population • Markit® Manufacturing PMIs for June 2017 … US 52.0, China
50.4, Eurozone 57.4, Emerging Markets 50.8, Global 52.6
• Advanced Technologies to Meet Fuel Efficiency Requirements• Highly-Engineered, Precision Components• Penetration Rates Exceed Market Growth• Global Light Vehicle Production Forecasted to Increase Modestly …
~+2% in 2017, ~+1% in 2018, ~+3% in 2019 (IHS Automotive-Jul’17)
BARNES GROUP PARTICIPATION BARNES GROUP PARTICIPATION
Manufacturing Expansion Benefiting Tool & Die Market
Healthcare for an Aging Population
China Expansion
Global Expansion
Light Vehicles – Plastics
Light Vehicles – Metals
Gas Direct Injection (GDi)
8 to 10 Speed Transmissions
INDUSTRIAL TECHNOLOGIES THAT SUPPORT KEY MACRO TRENDS-10-
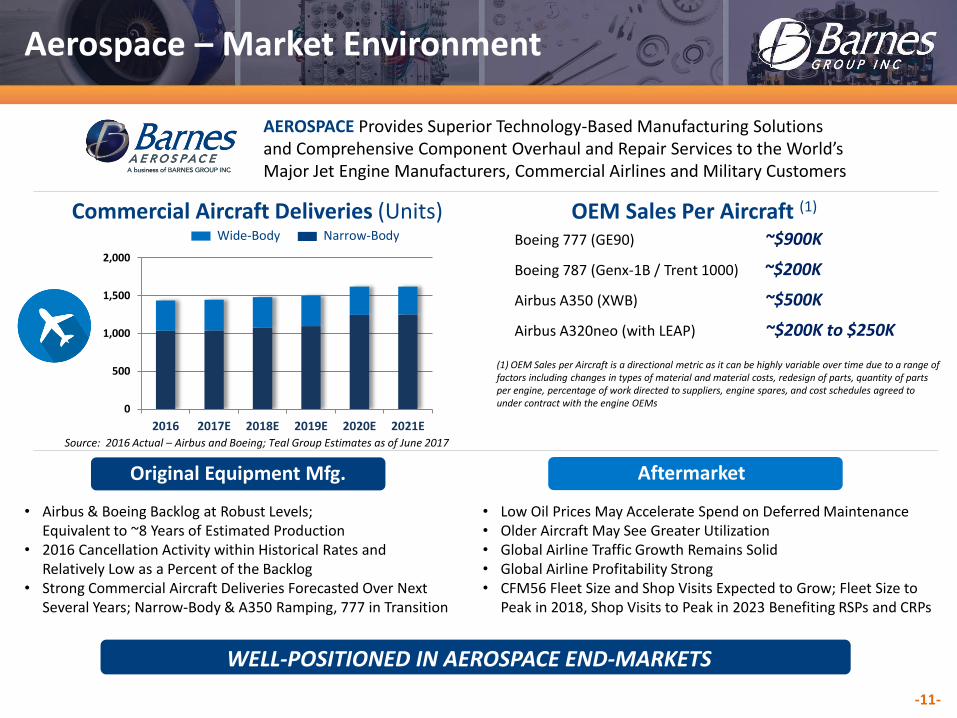
Aerospace – Market Environment
Source: 2016 Actual – Airbus and Boeing; Teal Group Estimates as of June 2017
AEROSPACE Provides Superior Technology-Based Manufacturing Solutions and Comprehensive Component Overhaul and Repair Services to the World’s Major Jet Engine Manufacturers, Commercial Airlines and Military Customers
Commercial Aircraft Deliveries (Units)
Aftermarket
Wide-Body Narrow-Body
Original Equipment Mfg. Aftermarket
• Airbus & Boeing Backlog at Robust Levels; Equivalent to ~8 Years of Estimated Production
• 2016 Cancellation Activity within Historical Rates and Relatively Low as a Percent of the Backlog
• Strong Commercial Aircraft Deliveries Forecasted Over Next Several Years; Narrow-Body & A350 Ramping, 777 in Transition
• Low Oil Prices May Accelerate Spend on Deferred Maintenance • Older Aircraft May See Greater Utilization • Global Airline Traffic Growth Remains Solid • Global Airline Profitability Strong• CFM56 Fleet Size and Shop Visits Expected to Grow; Fleet Size to
Peak in 2018, Shop Visits to Peak in 2023 Benefiting RSPs and CRPs
WELL-POSITIONED IN AEROSPACE END-MARKETS
Boeing 777 (GE90) ~$900K
Boeing 787 (Genx-1B / Trent 1000) ~$200K
Airbus A350 (XWB) ~$500K
Airbus A320neo (with LEAP) ~$200K to $250K
(1) OEM Sales per Aircraft is a directional metric as it can be highly variable over time due to a range of factors including changes in types of material and material costs, redesign of parts, quantity of parts per engine, percentage of work directed to suppliers, engine spares, and cost schedules agreed to under contract with the engine OEMs
OEM Sales Per Aircraft (1)
0
500
1,000
1,500
2,000
2016 2017E 2018E 2019E 2020E 2021E
-11-
Barnes Aftermarket RSPs and CRPs
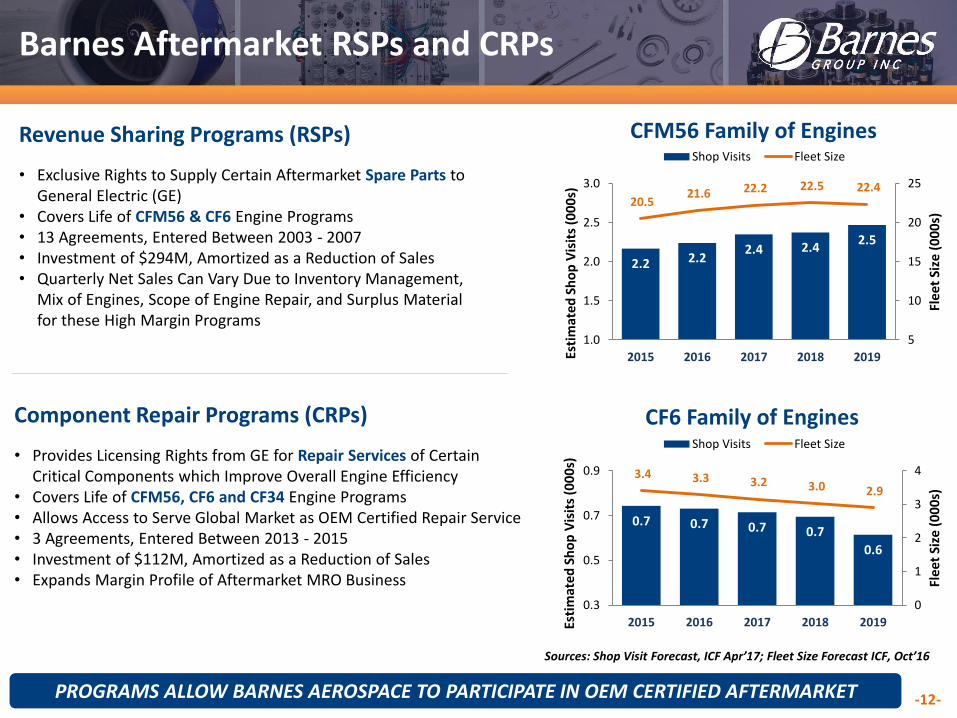
Sources: Shop Visit Forecast, ICF Apr’17; Fleet Size Forecast ICF, Oct’16
Revenue Sharing Programs (RSPs)
• Exclusive Rights to Supply Certain Aftermarket Spare Parts to General Electric (GE)
• Covers Life of CFM56 & CF6 Engine Programs• 13 Agreements, Entered Between 2003 - 2007• Investment of $294M, Amortized as a Reduction of Sales• Quarterly Net Sales Can Vary Due to Inventory Management,
Mix of Engines, Scope of Engine Repair, and Surplus Material for these High Margin Programs
Component Repair Programs (CRPs)
• Provides Licensing Rights from GE for Repair Services of Certain Critical Components which Improve Overall Engine Efficiency
• Covers Life of CFM56, CF6 and CF34 Engine Programs• Allows Access to Serve Global Market as OEM Certified Repair Service• 3 Agreements, Entered Between 2013 - 2015• Investment of $112M, Amortized as a Reduction of Sales• Expands Margin Profile of Aftermarket MRO Business
PROGRAMS ALLOW BARNES AEROSPACE TO PARTICIPATE IN OEM CERTIFIED AFTERMARKET
2.2 2.22.4 2.4
2.5
20.5 21.6 22.2 22.5 22.4
5
10
15
20
25
1.0
1.5
2.0
2.5
3.0
2015 2016 2017 2018 2019
Fle
et S
ize
(0
00
s)
Esti
mat
ed S
ho
p V
isit
s (0
00
s)
CFM56 Family of EnginesShop Visits Fleet Size
0.7 0.7 0.7 0.7
0.6
3.4 3.3 3.2 3.0 2.9
0
1
2
3
4
0.3
0.5
0.7
0.9
2015 2016 2017 2018 2019
Fle
et S
ize
(00
0s)
Esti
mat
ed S
ho
p V
isit
s (0
00
s)
CF6 Family of EnginesShop Visits Fleet Size
-12-
INDUSTRIALSEGMENT
AEROSPACESEGMENT
OTHER
Actual% of 2016
Sales
2017 Total Sales Growth
Outlook* End Market Highlights / Comments
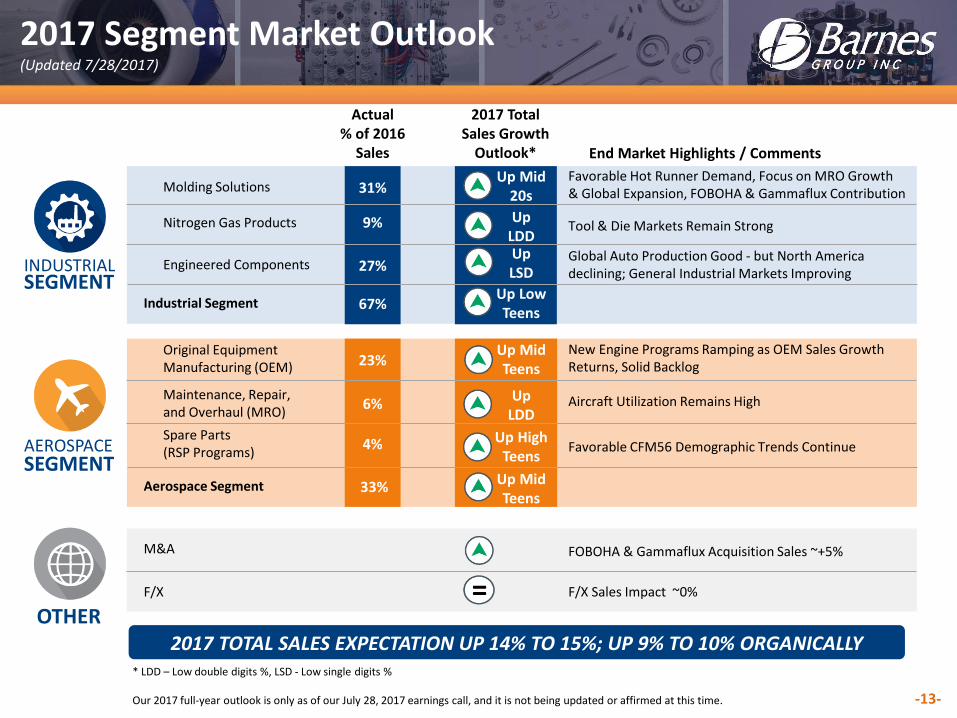
Molding Solutions 31%
9%Nitrogen Gas Products
Original Equipment Manufacturing (OEM)
Maintenance, Repair,and Overhaul (MRO)
Spare Parts (RSP Programs)
23%
Up Mid 20s
6%
4%
M&A
F/X
Favorable Hot Runner Demand, Focus on MRO Growth & Global Expansion, FOBOHA & Gammaflux Contribution
Tool & Die Markets Remain Strong
New Engine Programs Ramping as OEM Sales Growth Returns, Solid Backlog
Aircraft Utilization Remains High
Favorable CFM56 Demographic Trends Continue
FOBOHA & Gammaflux Acquisition Sales ~+5%
F/X Sales Impact ~0%
2017 TOTAL SALES EXPECTATION UP 14% TO 15%; UP 9% TO 10% ORGANICALLY* LDD – Low double digits %, LSD - Low single digits %
Our 2017 full-year outlook is only as of our July 28, 2017 earnings call, and it is not being updated or affirmed at this time.
UpLDD
Industrial Segment 67%Up LowTeens
Aerospace Segment 33%
-13-
27%Engineered ComponentsGlobal Auto Production Good - but North America declining; General Industrial Markets Improving
Up MidTeens
UpLSD
Up LDD
Up High Teens
Up MidTeens
=
2017 Segment Market Outlook(Updated 7/28/2017)
-14-
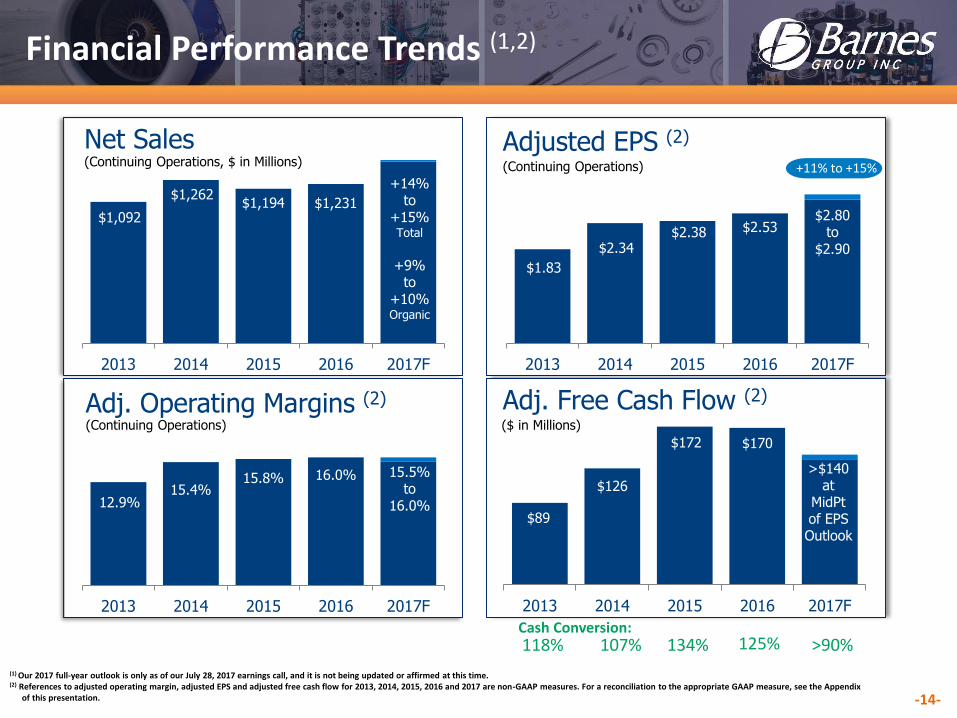
(1) Our 2017 full-year outlook is only as of our July 28, 2017 earnings call, and it is not being updated or affirmed at this time.(2) References to adjusted operating margin, adjusted EPS and adjusted free cash flow for 2013, 2014, 2015, 2016 and 2017 are non-GAAP measures. For a reconciliation to the appropriate GAAP measure, see the Appendix
of this presentation.
Financial Performance Trends (1,2)
118% 107% 134% >90%Cash Conversion:
$1,092
$1,262$1,194 $1,231
+14%to
+15%Total
+9%to
+10%Organic
2013 2014 2015 2016 2017F
Net Sales(Continuing Operations, $ in Millions)
$1.83
$2.34$2.38 $2.53
$2.80to
$2.90
2013 2014 2015 2016 2017F
Adjusted EPS (2)
(Continuing Operations)
12.9%15.4%
15.8% 16.0% 15.5%to
16.0%
2013 2014 2015 2016 2017F
Adj. Operating Margins (2)
(Continuing Operations)
$89
$126
$172 $170
2013 2014 2015 2016 2017F
>$140at
MidPtof EPSOutlook
($ in Millions)
Adj. Free Cash Flow (2)
+11% to +15%
125%
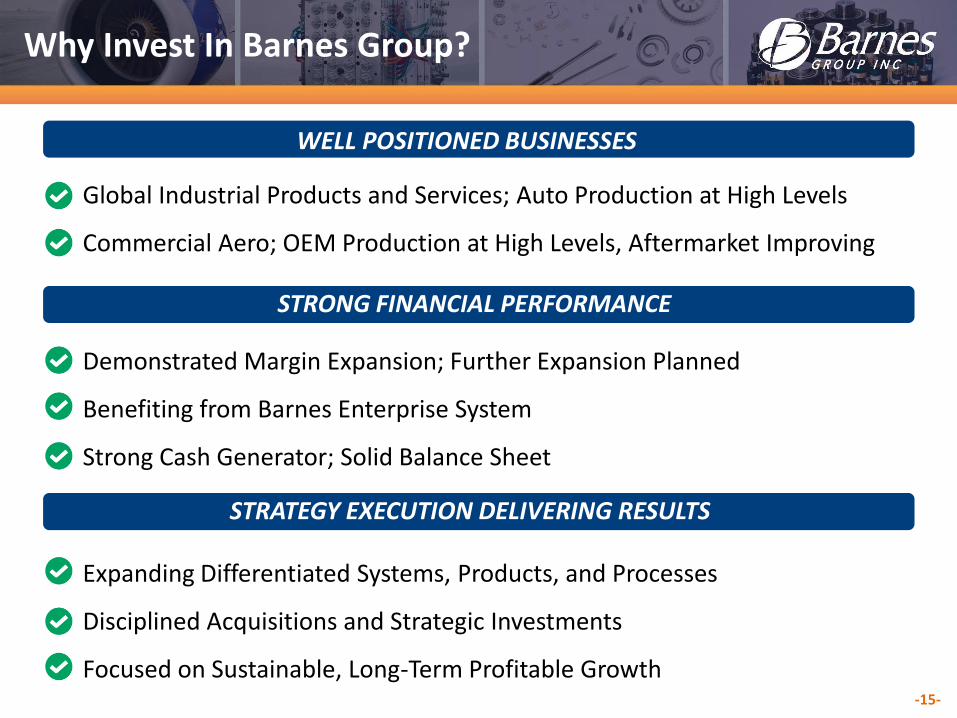
Why Invest In Barnes Group?
WELL POSITIONED BUSINESSES
STRONG FINANCIAL PERFORMANCE
STRATEGY EXECUTION DELIVERING RESULTS
• Global Industrial Products and Services; Auto Production at High Levels
• Commercial Aero; OEM Production at High Levels, Aftermarket Improving
• Demonstrated Margin Expansion; Further Expansion Planned
• Benefiting from Barnes Enterprise System
• Strong Cash Generator; Solid Balance Sheet
• Expanding Differentiated Systems, Products, and Processes
• Disciplined Acquisitions and Strategic Investments
• Focused on Sustainable, Long-Term Profitable Growth -15-
Appendix
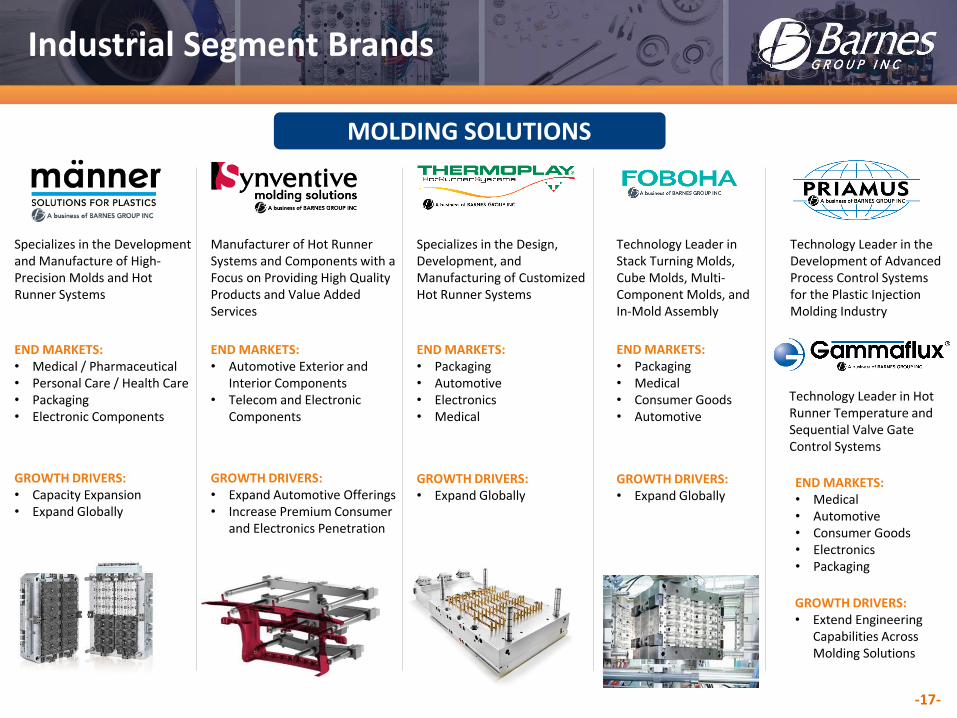
Industrial Segment Brands
MOLDING SOLUTIONS
Specializes in the Development and Manufacture of High-Precision Molds and Hot Runner Systems
END MARKETS:• Medical / Pharmaceutical • Personal Care / Health Care• Packaging• Electronic Components
GROWTH DRIVERS:• Capacity Expansion• Expand Globally
Manufacturer of Hot Runner Systems and Components with a Focus on Providing High Quality Products and Value Added Services
END MARKETS:• Automotive Exterior and
Interior Components • Telecom and Electronic
Components
GROWTH DRIVERS:• Expand Automotive Offerings• Increase Premium Consumer
and Electronics Penetration
Specializes in the Design, Development, and Manufacturing of Customized Hot Runner Systems
END MARKETS:• Packaging• Automotive• Electronics• Medical
GROWTH DRIVERS:• Expand Globally
Technology Leader in Hot Runner Temperature and Sequential Valve Gate Control Systems
END MARKETS:• Medical• Automotive• Consumer Goods• Electronics• Packaging
GROWTH DRIVERS:• Extend Engineering
Capabilities Across Molding Solutions
Technology Leader in Stack Turning Molds, Cube Molds, Multi-Component Molds, and In-Mold Assembly
END MARKETS:• Packaging• Medical• Consumer Goods• Automotive
GROWTH DRIVERS:• Expand Globally
-17-
Technology Leader in the Development of Advanced Process Control Systems for the Plastic Injection Molding Industry
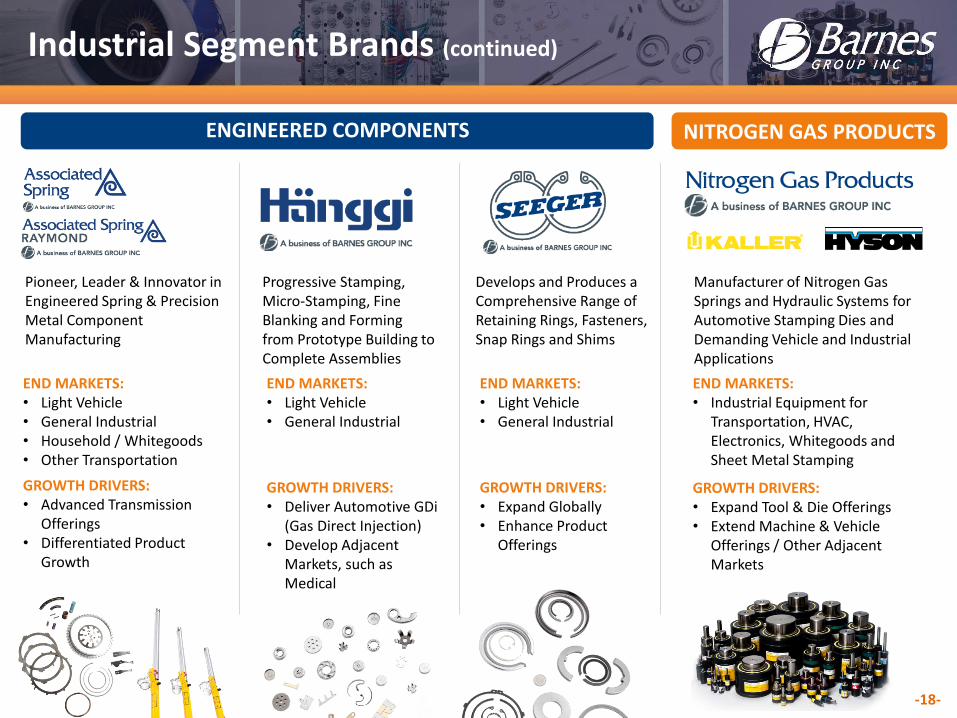
Industrial Segment Brands (continued)
ENGINEERED COMPONENTS NITROGEN GAS PRODUCTS
Pioneer, Leader & Innovator in Engineered Spring & Precision Metal Component Manufacturing
END MARKETS:• Light Vehicle• General Industrial• Household / Whitegoods• Other Transportation
GROWTH DRIVERS:• Advanced Transmission
Offerings• Differentiated Product
Growth
Progressive Stamping, Micro-Stamping, Fine Blanking and Forming from Prototype Building to Complete Assemblies
END MARKETS:• Light Vehicle• General Industrial
GROWTH DRIVERS:• Deliver Automotive GDi
(Gas Direct Injection)• Develop Adjacent
Markets, such as Medical
Develops and Produces a Comprehensive Range of Retaining Rings, Fasteners, Snap Rings and Shims
END MARKETS:• Light Vehicle• General Industrial
GROWTH DRIVERS:• Expand Globally• Enhance Product
Offerings
Manufacturer of Nitrogen Gas Springs and Hydraulic Systems for Automotive Stamping Dies and Demanding Vehicle and Industrial Applications
END MARKETS:• Industrial Equipment for
Transportation, HVAC, Electronics, Whitegoods and Sheet Metal Stamping
GROWTH DRIVERS:• Expand Tool & Die Offerings• Extend Machine & Vehicle
Offerings / Other Adjacent Markets
-18-
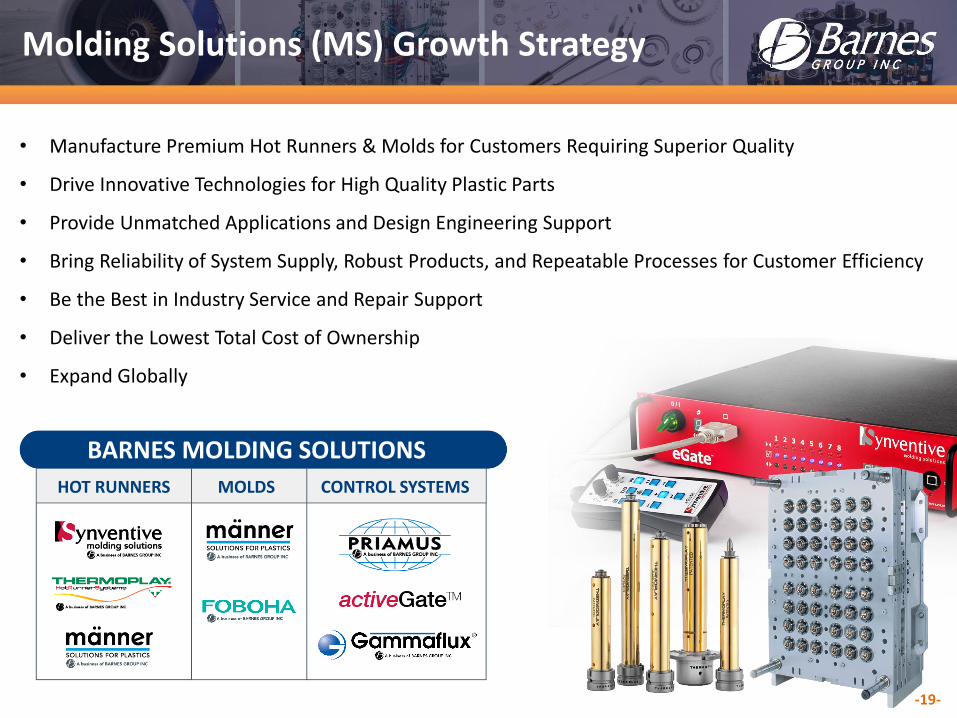
Molding Solutions (MS) Growth Strategy
BARNES MOLDING SOLUTIONS
HOT RUNNERS MOLDS CONTROL SYSTEMS
• Manufacture Premium Hot Runners & Molds for Customers Requiring Superior Quality
• Drive Innovative Technologies for High Quality Plastic Parts
• Provide Unmatched Applications and Design Engineering Support
• Bring Reliability of System Supply, Robust Products, and Repeatable Processes for Customer Efficiency
• Be the Best in Industry Service and Repair Support
• Deliver the Lowest Total Cost of Ownership
• Expand Globally
-19-
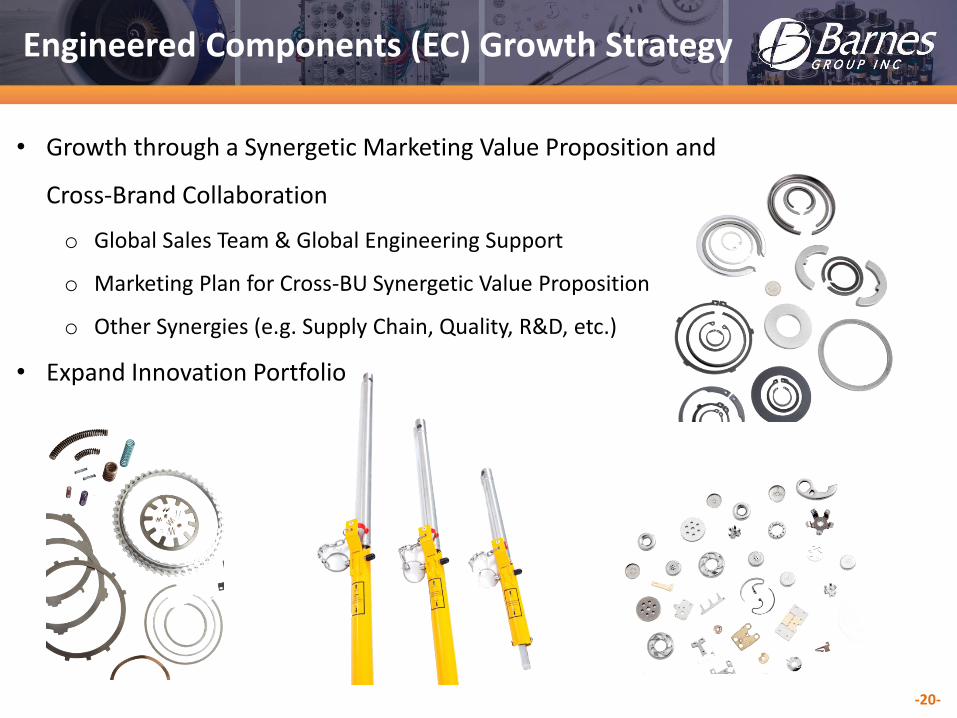
Engineered Components (EC) Growth Strategy
• Growth through a Synergetic Marketing Value Proposition and
Cross-Brand Collaboration
o Global Sales Team & Global Engineering Support
o Marketing Plan for Cross-BU Synergetic Value Proposition
o Other Synergies (e.g. Supply Chain, Quality, R&D, etc.)
• Expand Innovation Portfolio
-20-
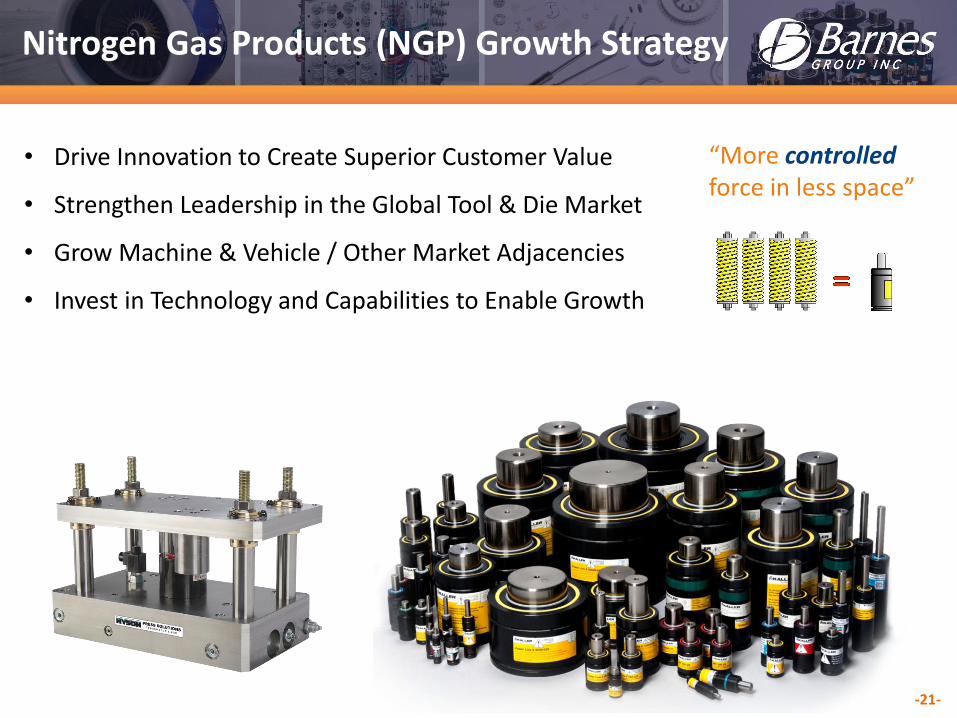
Nitrogen Gas Products (NGP) Growth Strategy
• Drive Innovation to Create Superior Customer Value
• Strengthen Leadership in the Global Tool & Die Market
• Grow Machine & Vehicle / Other Market Adjacencies
• Invest in Technology and Capabilities to Enable Growth
“More controlledforce in less space”
-21-
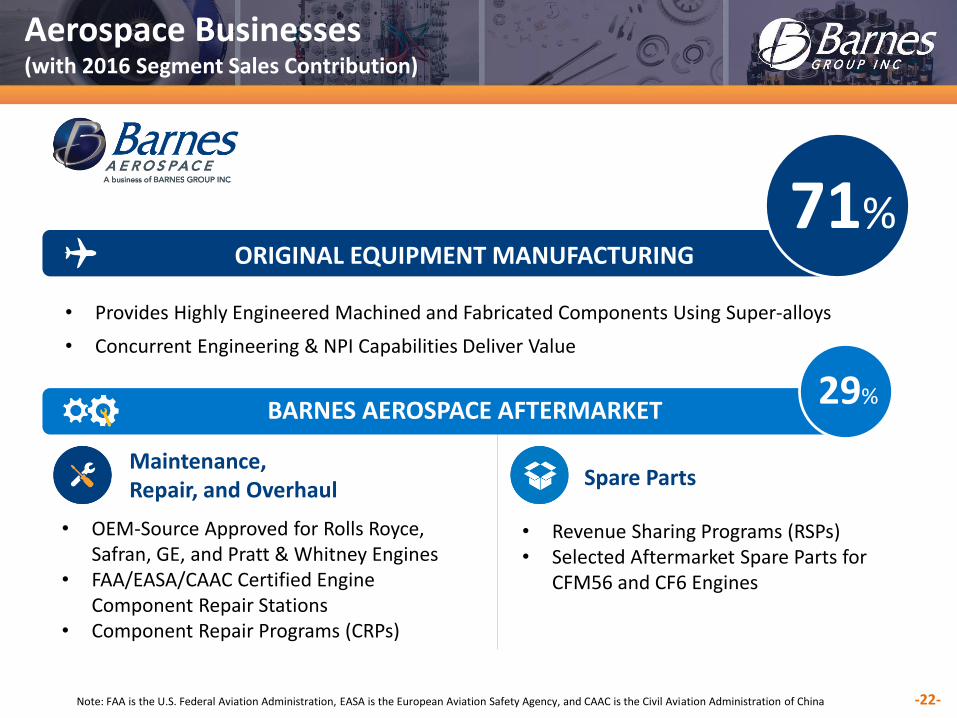
Aerospace Businesses(with 2016 Segment Sales Contribution)
Note: FAA is the U.S. Federal Aviation Administration, EASA is the European Aviation Safety Agency, and CAAC is the Civil Aviation Administration of China
ORIGINAL EQUIPMENT MANUFACTURING
71%
BARNES AEROSPACE AFTERMARKET29%
• Provides Highly Engineered Machined and Fabricated Components Using Super-alloys
• Concurrent Engineering & NPI Capabilities Deliver Value
Maintenance, Repair, and Overhaul
Spare Parts
• OEM-Source Approved for Rolls Royce, Safran, GE, and Pratt & Whitney Engines
• FAA/EASA/CAAC Certified Engine Component Repair Stations
• Component Repair Programs (CRPs)
• Revenue Sharing Programs (RSPs)• Selected Aftermarket Spare Parts for
CFM56 and CF6 Engines
-22-
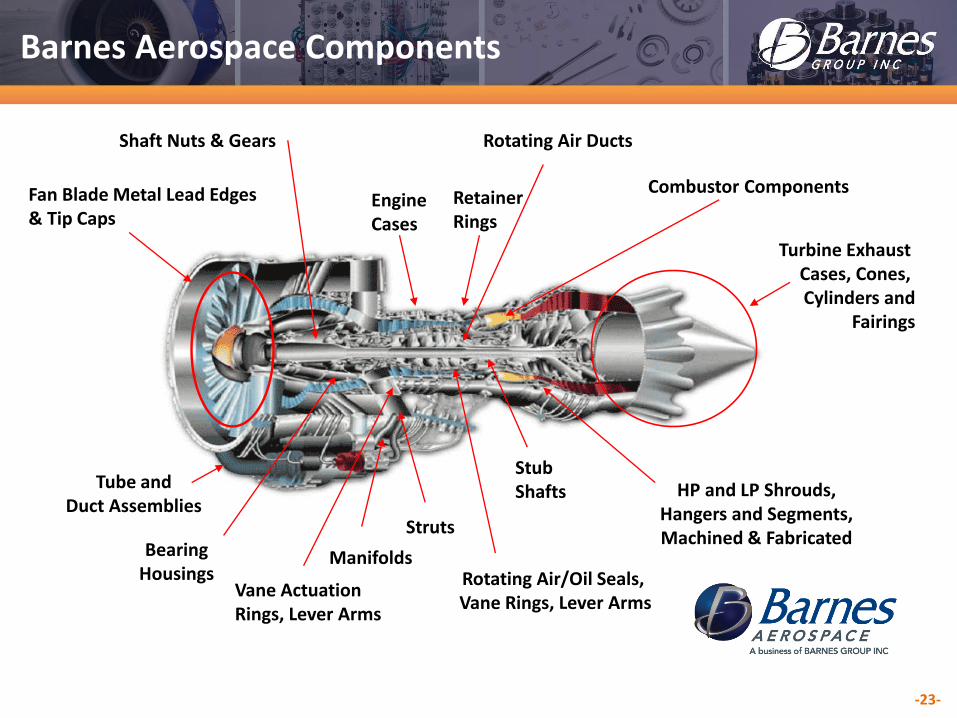
Shaft Nuts & Gears
EngineCases
RetainerRings
Rotating Air Ducts
HP and LP Shrouds,Hangers and Segments,Machined & Fabricated
Turbine Exhaust Cases, Cones, Cylinders and
Fairings
Combustor Components
Rotating Air/Oil Seals,Vane Rings, Lever Arms
StubShafts
Struts
ManifoldsBearingHousings
Tube andDuct Assemblies
Vane ActuationRings, Lever Arms
Barnes Aerospace Components
Fan Blade Metal Lead Edges & Tip Caps
-23-
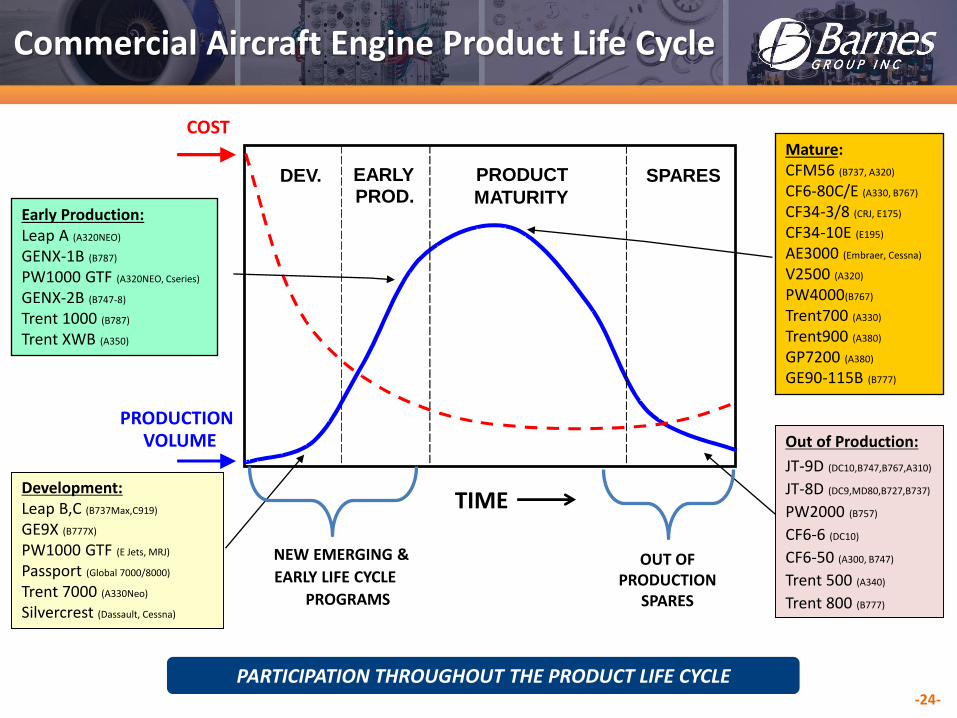
Out of Production:
JT-9D (DC10,B747,B767,A310)
JT-8D (DC9,MD80,B727,B737)
PW2000 (B757)
CF6-6 (DC10)
CF6-50 (A300, B747)
Trent 500 (A340)
Trent 800 (B777)
Development:Leap B,C (B737Max,C919)
GE9X (B777X)
PW1000 GTF (E Jets, MRJ)
Passport (Global 7000/8000)
Trent 7000 (A330Neo)
Silvercrest (Dassault, Cessna)
DEV. EARLYPROD.
PRODUCT
MATURITYSPARES
PRODUCTIONVOLUME
TIME
COST
OUT OFPRODUCTION
SPARES
NEW EMERGING &
EARLY LIFE CYCLE
PROGRAMS
Mature:CFM56 (B737, A320)
CF6-80C/E (A330, B767)
CF34-3/8 (CRJ, E175)
CF34-10E (E195)
AE3000 (Embraer, Cessna)
V2500 (A320)
PW4000(B767)
Trent700 (A330)
Trent900 (A380)
GP7200 (A380)
GE90-115B (B777)
Early Production:Leap A (A320NEO)
GENX-1B (B787)
PW1000 GTF (A320NEO, Cseries)
GENX-2B (B747-8)
Trent 1000 (B787)
Trent XWB (A350)
Commercial Aircraft Engine Product Life Cycle
PARTICIPATION THROUGHOUT THE PRODUCT LIFE CYCLE-24-
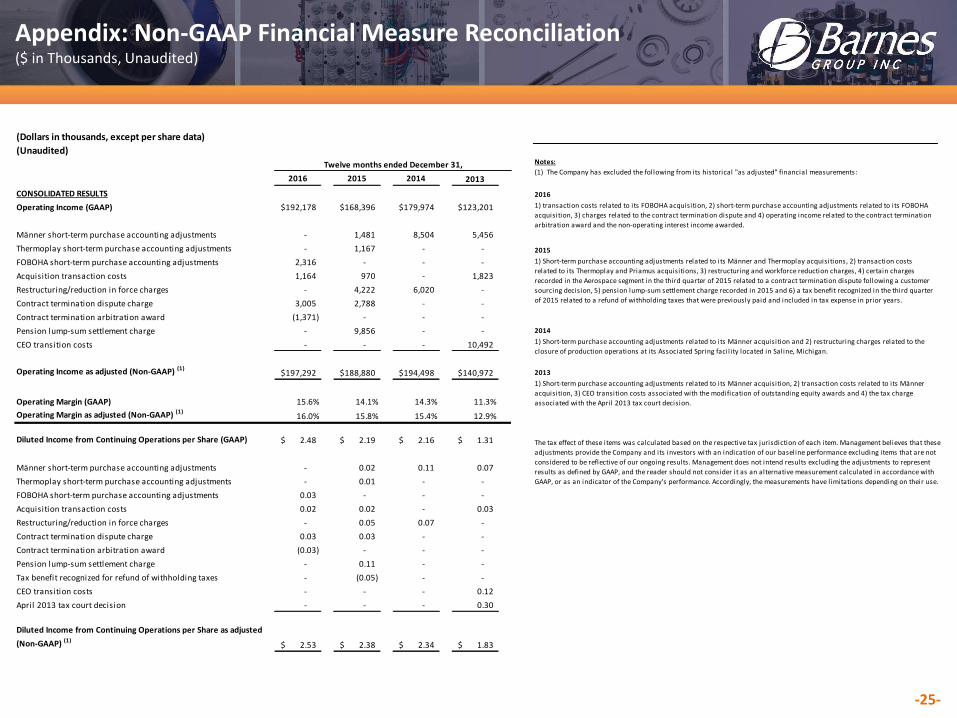
Appendix: Non-GAAP Financial Measure Reconciliation($ in Thousands, Unaudited)
(Dollars in thousands, except per share data)
(Unaudited)
2016 2015 2014 2013
CONSOLIDATED RESULTS
Operating Income (GAAP) 192,178$ 168,396$ 179,974$ 123,201$
Männer short-term purchase accounting adjustments - 1,481 8,504 5,456
Thermoplay short-term purchase accounting adjustments - 1,167 - -
FOBOHA short-term purchase accounting adjustments 2,316 - - -
Acquisition transaction costs 1,164 970 - 1,823
Restructuring/reduction in force charges - 4,222 6,020 -
Contract termination dispute charge 3,005 2,788 - -
Contract termination arbitration award (1,371) - - -
Pension lump-sum settlement charge - 9,856 - -
CEO transition costs - - - 10,492
Operating Income as adjusted (Non-GAAP) (1)197,292$ 188,880$ 194,498$ 140,972$
Operating Margin (GAAP) 15.6% 14.1% 14.3% 11.3%
Operating Margin as adjusted (Non-GAAP) (1)16.0% 15.8% 15.4% 12.9%
Diluted Income from Continuing Operations per Share (GAAP) 2.48$ 2.19$ 2.16$ 1.31$
Männer short-term purchase accounting adjustments - 0.02 0.11 0.07
Thermoplay short-term purchase accounting adjustments - 0.01 - -
FOBOHA short-term purchase accounting adjustments 0.03 - - -
Acquisition transaction costs 0.02 0.02 - 0.03
Restructuring/reduction in force charges - 0.05 0.07 -
Contract termination dispute charge 0.03 0.03 - -
Contract termination arbitration award (0.03) - - -
Pension lump-sum settlement charge - 0.11 - -
Tax benefit recognized for refund of withholding taxes - (0.05) - -
CEO transition costs - - - 0.12
April 2013 tax court decision - - - 0.30
Diluted Income from Continuing Operations per Share as adjusted
(Non-GAAP) (1)2.53$ 2.38$ 2.34$ 1.83$
Twelve months ended December 31, Notes:
2016
2015
2014
2013
(1) The Company has excluded the following from its historical "as adjusted" financial measurements:
The tax effect of these items was calculated based on the respective tax jurisdiction of each item. Management believes that these
adjustments provide the Company and its investors with an indication of our baseline performance excluding items that are not
considered to be reflective of our ongoing results. Management does not intend results excluding the adjustments to represent
results as defined by GAAP, and the reader should not consider it as an alternative measurement calculated in accordance with
GAAP, or as an indicator of the Company's performance. Accordingly, the measurements have limitations depending on their use.
1) Short-term purchase accounting adjustments related to its Männer and Thermoplay acquisitions, 2) transaction costs
related to its Thermoplay and Priamus acquisitions, 3) restructuring and workforce reduction charges, 4) certain charges
recorded in the Aerospace segment in the third quarter of 2015 related to a contract termination dispute following a customer
sourcing decision, 5) pension lump-sum settlement charge recorded in 2015 and 6) a tax benefit recognized in the third quarter
of 2015 related to a refund of withholding taxes that were previously paid and included in tax expense in prior years.
1) Short-term purchase accounting adjustments related to its Männer acquisition and 2) restructuring charges related to the
closure of production operations at its Associated Spring facil ity located in Saline, Michigan.
1) Short-term purchase accounting adjustments related to its Männer acquisition, 2) transaction costs related to its Männer
acquisition, 3) CEO transition costs associated with the modification of outstanding equity awards and 4) the tax charge
associated with the April 2013 tax court decision.
1) transaction costs related to its FOBOHA acquisition, 2) short-term purchase accounting adjustments related to its FOBOHA
acquisition, 3) charges related to the contract termination dispute and 4) operating income related to the contract termination
arbitration award and the non-operating interest income awarded.
-25-
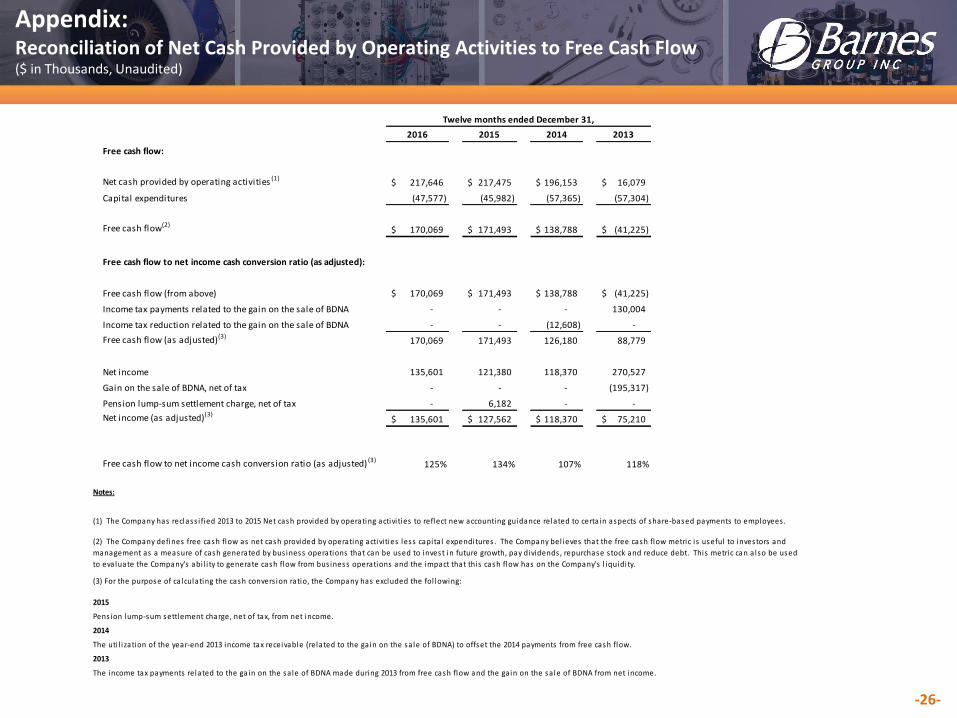
Appendix: Reconciliation of Net Cash Provided by Operating Activities to Free Cash Flow($ in Thousands, Unaudited)
2016 2015 2014 2013
Free cash flow:
Net cash provided by operating activities (1)217,646$ 217,475$ 196,153$ 16,079$
Capital expenditures (47,577) (45,982) (57,365) (57,304)
Free cash flow(2)170,069$ 171,493$ 138,788$ (41,225)$
Free cash flow to net income cash conversion ratio (as adjusted):
Free cash flow (from above) 170,069$ 171,493$ 138,788$ (41,225)$
Income tax payments related to the gain on the sale of BDNA - - - 130,004
Income tax reduction related to the gain on the sale of BDNA - - (12,608) -
Free cash flow (as adjusted)(3)170,069 171,493 126,180 88,779
Net income 135,601 121,380 118,370 270,527
Gain on the sale of BDNA, net of tax - - - (195,317)
Pension lump-sum settlement charge, net of tax - 6,182 - -
Net income (as adjusted)(3)135,601$ 127,562$ 118,370$ 75,210$
Free cash flow to net income cash conversion ratio (as adjusted) (3)125% 134% 107% 118%
Twelve months ended December 31,
Notes:
2015
Pens ion lump-sum settlement charge, net of tax, from net income.
2014
2013
The uti l i zation of the year-end 2013 income tax receivable (related to the ga in on the sa le of BDNA) to offset the 2014 payments from free cash flow.
The income tax payments related to the ga in on the sa le of BDNA made during 2013 from free cash flow and the ga in on the sa le of BDNA from net income.
(2) The Company defines free cash flow as net cash provided by operating activi ties less capita l expenditures . The Company bel ieves that the free cash flow metric i s useful to investors and
management as a measure of cash generated by bus iness operations that can be used to invest in future growth, pay dividends , repurchase s tock and reduce debt. This metric can a lso be used
to evaluate the Company's abi l i ty to generate cash flow from bus iness operations and the impact that this cash flow has on the Company's l iquidi ty.
(3) For the purpose of ca lculating the cash convers ion ratio, the Company has excluded the fol lowing:
(1) The Company has reclass i fied 2013 to 2015 Net cash provided by operating activi ties to reflect new accounting guidance related to certa in aspects of share-based payments to employees .
-26-
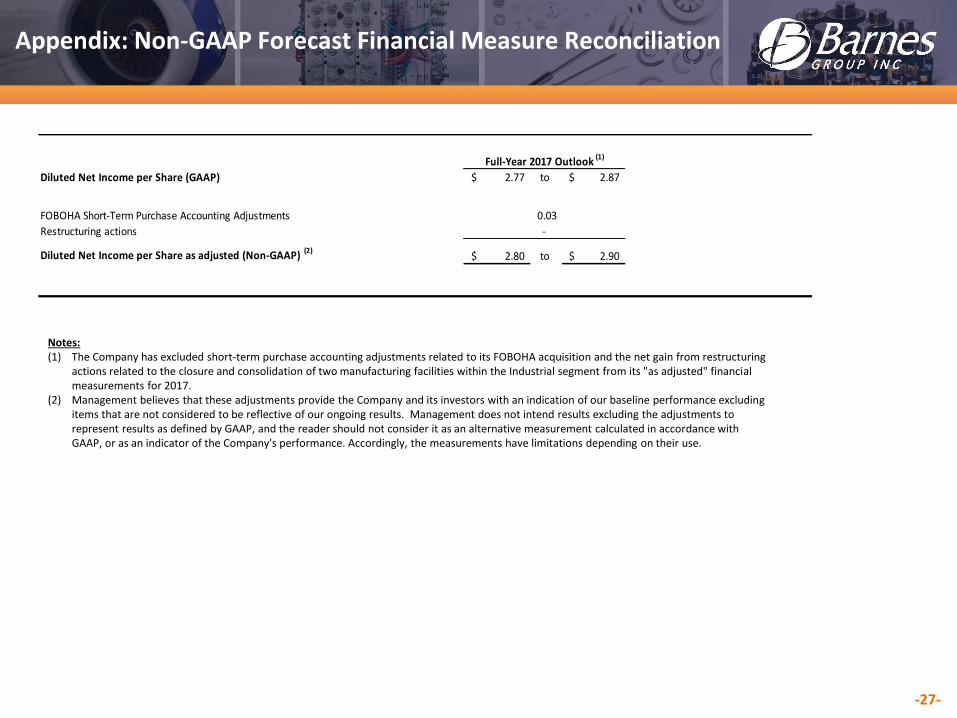
Appendix: Non-GAAP Forecast Financial Measure Reconciliation
Notes:(1) The Company has excluded short-term purchase accounting adjustments related to its FOBOHA acquisition and the net gain from restructuring
actions related to the closure and consolidation of two manufacturing facilities within the Industrial segment from its "as adjusted" financial measurements for 2017.
(2) Management believes that these adjustments provide the Company and its investors with an indication of our baseline performance excluding items that are not considered to be reflective of our ongoing results. Management does not intend results excluding the adjustments to represent results as defined by GAAP, and the reader should not consider it as an alternative measurement calculated in accordance with GAAP, or as an indicator of the Company's performance. Accordingly, the measurements have limitations depending on their use.
Diluted Net Income per Share (GAAP) 2.77$ to 2.87$
FOBOHA Short-Term Purchase Accounting Adjustments 0.03
Restructuring actions -
Diluted Net Income per Share as adjusted (Non-GAAP) (2)2.80$ to 2.90$
Full-Year 2017 Outlook (1)
-27-
Forward-Looking Statements
This presentation contains forward-looking statements as defined in the Private Securities Litigation Reform Act of 1995. Forward-looking statements often address our expected future operating and financial performance and financial condition, and often contain words such as "anticipate," "believe," "expect," "plan," "estimate," "project," and similar terms. These forward-looking statements do not constitute guarantees of future performance and are subject to a variety of risks and uncertainties that may cause actual results to differ materially from those expressed in the forward-looking statements. These include, among others: difficulty maintaining relationships with employees, including unionized employees, customers, distributors, suppliers, business partners or governmental entities; failure to successfully negotiate collective bargaining agreements or potential strikes, work stoppages or other similar events; difficulties leveraging market opportunities; changes in market demand for our products and services; rapid technological and market change; the ability to protect intellectual property rights; introduction or development of new products or transfer of work; higher risks in global operations and markets; the impact of intense competition; acts of terrorism, cybersecurity attacks or intrusions that could adversely impact our businesses; uncertainties relating to conditions in financial markets; currency fluctuations and foreign currency exposure; future financial performance of the industries or customers that we serve; our dependence upon revenues and earnings from a small number of significant customers; a major loss of customers; inability to realize expected sales or profits from existing backlog due to a range of factors, including changes in customer sourcing decisions, material changes, production schedules and volumes of specific programs; the impact of government budget and funding decisions; changes in raw material or product prices and availability; integration of acquired businesses; restructuring costs or savings; the continuing impact of prior acquisitions and divestitures; and any other future strategic actions, including acquisitions, divestitures, restructurings, or strategic business realignments, and our ability to achieve the financial and operational targets set in connection with any such actions; the outcome of pending and future legal, governmental, or regulatory proceedings and contingencies and uninsured claims; future repurchases of common stock; future levels of indebtedness; and numerous other matters of a global, regional or national scale, including those of a political, economic, business, competitive, environmental, regulatory and public health nature; and other risks and uncertainties described in documents filed with or furnished to the Securities and Exchange Commission ("SEC") by the Company, including, among others, those in the Management's Discussion and Analysis of Financial Condition and Results of Operations and Risk Factors sections of the Company's filings. The Company assumes no obligation to update its forward-looking statements.
-28-