Embed Size (px)
Citation preview
© 2015 Experian Information Solutions, Inc. All rights reserved. Experian and the marks used herein are service marks or registered trademarks of Experian Information Solutions, Inc.
Other product and company names mentioned herein are the trademarks of their respective owners. No part of this copyrighted work may be reproduced, modified, or distributed in
any form or manner without the prior written permission of Experian. Experian Public.
Attracting and retaining commercial and small-business clients with powerful segmentation strategies
© 2015 Experian Information Solutions, Inc. All rights reserved. Experian Public. 2
Joanne Pollitt CEB TowerGroup
Mike Horrocks Experian
Introducing:
@ExperianVision | #vision2015
Follow us on Twitter:
3 © 2015 Experian Information Solutions, Inc. All rights reserved. Experian Public.
What is happening in your markets?
What is at risk?
What is the segment within the segment?
What are the commercial borrowers wanting?
Case study
Call to action
Agenda
4 © 2015 Experian Information Solutions, Inc. All rights reserved. Experian Public.
Discover
Learn
Hear
React
Solidify
Commercial clients are unique So why do we treat them the same?

5 © 2015 Experian Information Solutions, Inc. All rights reserved. Experian Public.
Capturing the growth opportunity requires deep understanding of target segments, channel choices and products / services
1
3 2
Target segments What are the needs of our market’s
segments?
For which segment(s) should we build a value proposition to attract new businesses and those willing to switch
Product / service portfolio What are the products and
services that resonate with our target segments?
What is the most efficient go-to-market model?
Channel choices
What channels do our target segments prefer / primarily use?
What sales/ service delivery model best aligns to their preferences and needs

6 © 2015 Experian Information Solutions, Inc. All rights reserved. Experian Public.
There may be more than one target
Competitive rates
Access to credit
Knowledgeable banker
Credit seekers
Values my business
Passive customers
Common and distinct needs
Problem resolution
Financially stable
Trust
Delivers solutions
Common needs
Common needs vs. distinct needs Credit seekers vs. passive customers

© 2015 Experian Information Solutions, Inc. All rights reserved. Experian Public. 7
What is happening
in your markets?

8 © 2015 Experian Information Solutions, Inc. All rights reserved. Experian Public.
What is happening in your markets? Continued pressure for growth and cost controls
Expectations of higher revenue growth and cost pressure Percentage of FS Executives, Q1 2012 to Q3 2014
n = 3,825.
Source: CEB Q1 2012–Q3 2014 Business Barometer Survey.
50%
Q1
2012
Q2
2012
Q3
2012
Q4
2012
Q1
2013
Q2
2013
Q3
2013
Q4
2013
Q1
2014
Q2
2014
Q3
2014
70%
90%
72% Revenue growth
64% Cost pressure

9 © 2015 Experian Information Solutions, Inc. All rights reserved. Experian Public.
What is happening in your markets? Continued pressure for growth and cost controls
n = 374.
Source: CEB Q3 2014 Business Barometer Survey.
Note: Totals do not equal 100% due to rounding
© 2014 CEB. All rights reserved. RBLC1072214SYN
17% 14%
10% 23%
72% 64%
0%
25%
50%
75%
100%
Revenue growth Cost pressure
Higher
No change
Lower
Expectations of revenue growth and cost pressure Percentage of FS Executives, Q1 2012 to Q3 2014

10 © 2015 Experian Information Solutions, Inc. All rights reserved. Experian Public.
Growth driven by sales to current customers
0%
Q4 2013 Q1 2014 Q2 2014 Q3 2014
50%
100%
n = 195.
Source: CEB Q4 2013–Q3 2014 Business Barometer Survey.
Expectations of sales to existing customers Percentage of FS Executives, Q1 2012 to Q3 2014
70% Higher
19%
No change
11%
Lower
11 © 2015 Experian Information Solutions, Inc. All rights reserved. Experian Public.
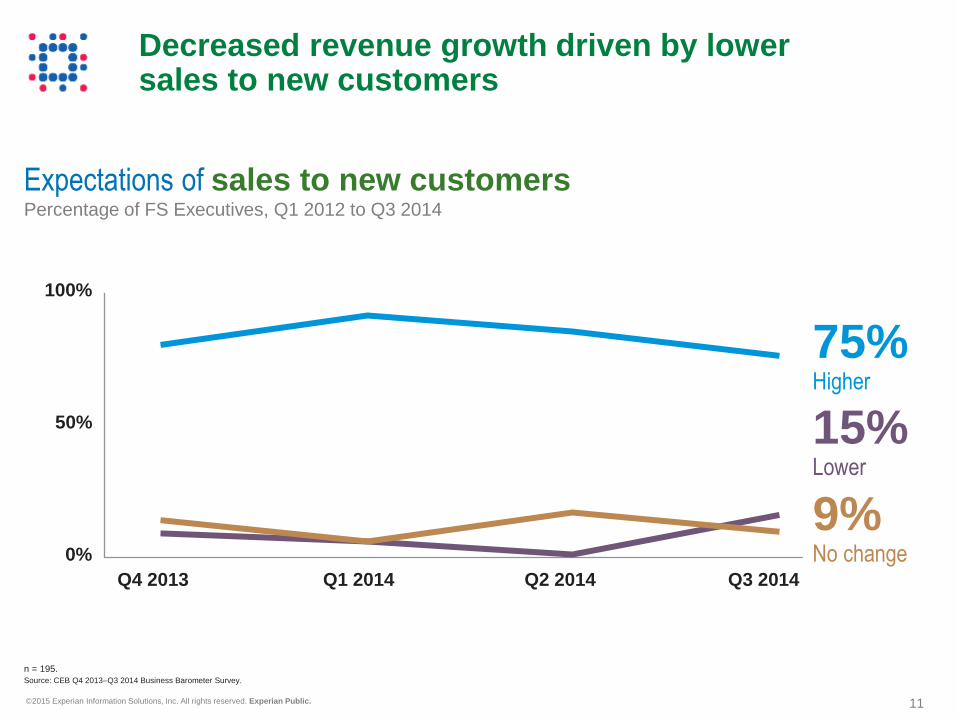
Decreased revenue growth driven by lower sales to new customers
0%
Q4 2013 Q1 2014 Q2 2014 Q3 2014
50%
100%
n = 195.
Source: CEB Q4 2013–Q3 2014 Business Barometer Survey.
Expectations of sales to new customers Percentage of FS Executives, Q1 2012 to Q3 2014
75% Higher
15%
Lower
9%
No change
12 © 2015 Experian Information Solutions, Inc. All rights reserved. Experian Public.
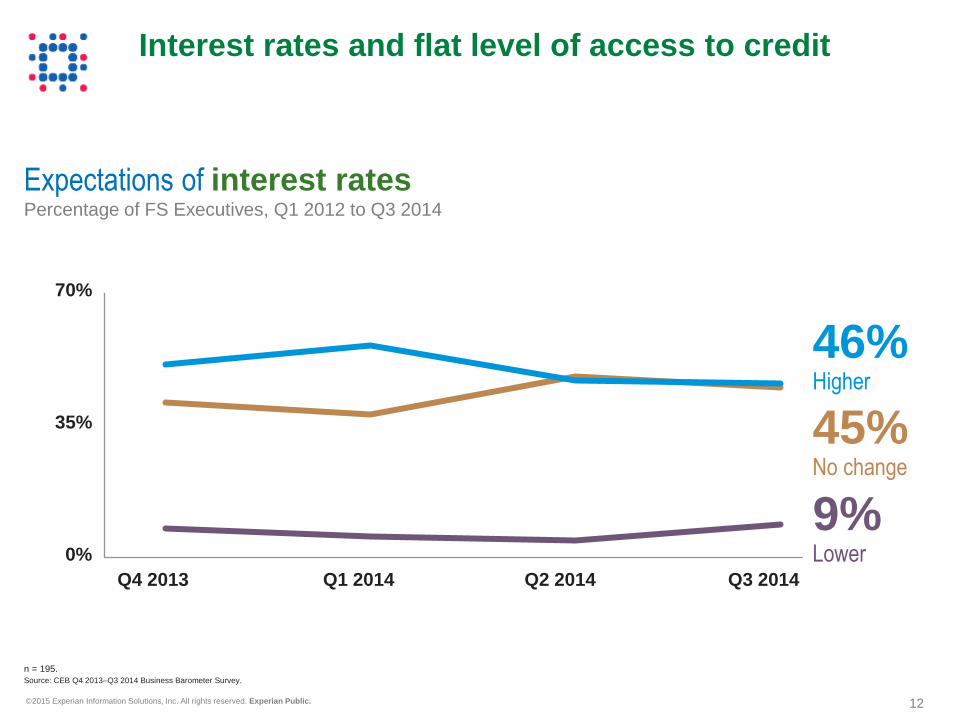
Interest rates and flat level of access to credit
0%
Q4 2013 Q1 2014 Q2 2014 Q3 2014
35%
70%
n = 195.
Source: CEB Q4 2013–Q3 2014 Business Barometer Survey.
Expectations of interest rates Percentage of FS Executives, Q1 2012 to Q3 2014
46% Higher
45%
No change
9%
Lower
13 © 2015 Experian Information Solutions, Inc. All rights reserved. Experian Public.
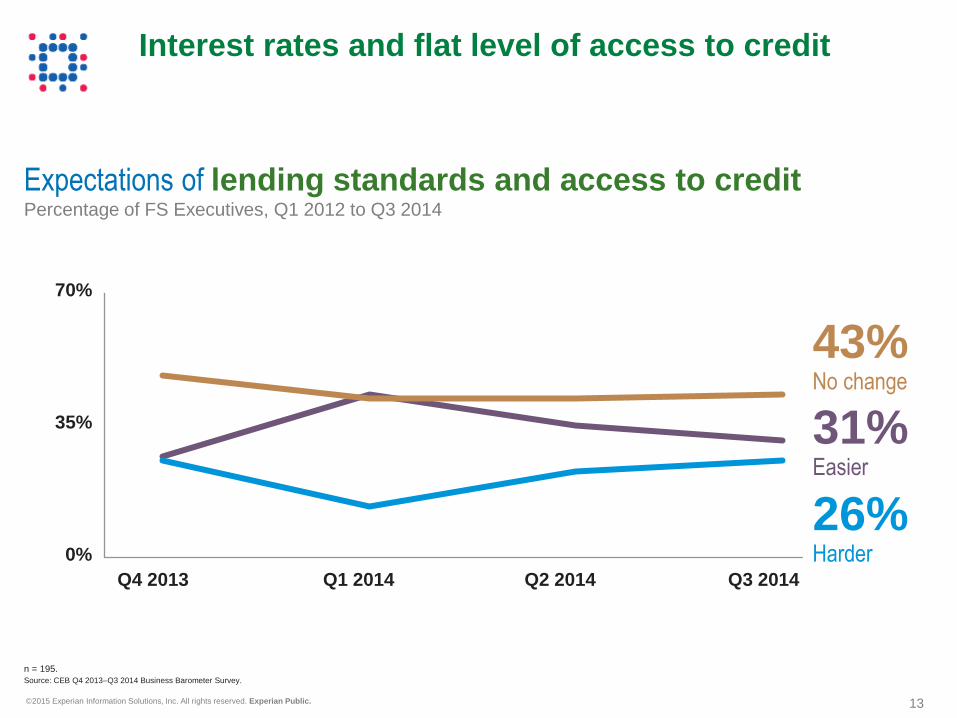
Interest rates and flat level of access to credit
0%
Q4 2013 Q1 2014 Q2 2014 Q3 2014
35%
70%
n = 195.
Source: CEB Q4 2013–Q3 2014 Business Barometer Survey.
Expectations of lending standards and access to credit Percentage of FS Executives, Q1 2012 to Q3 2014
43% No change
31%
Easier
26%
Harder
14 © 2015 Experian Information Solutions, Inc. All rights reserved. Experian Public.
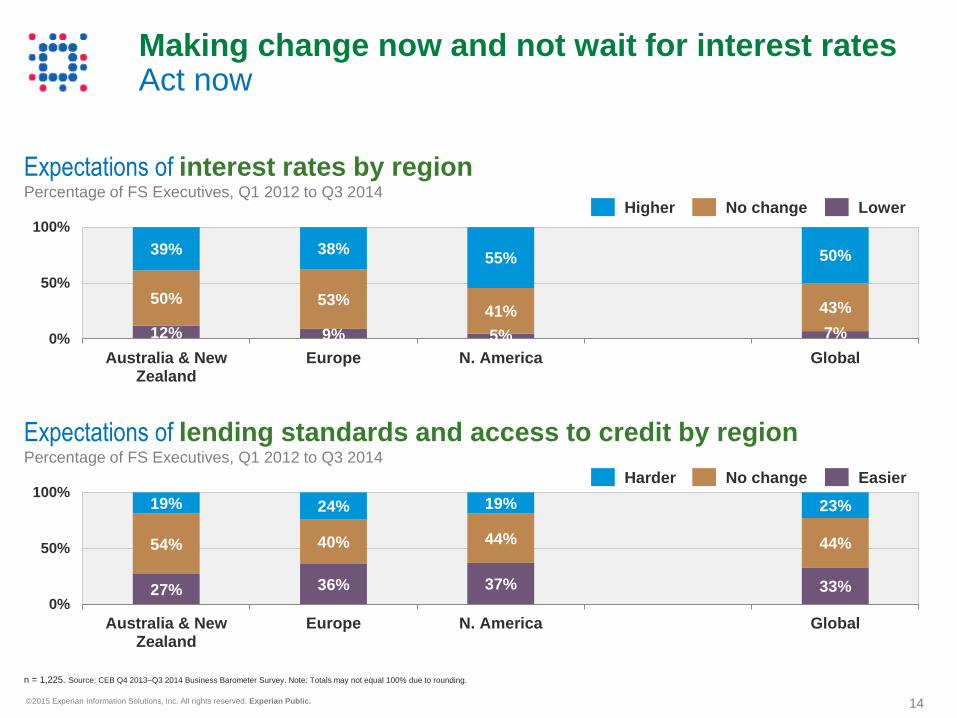
Expectations of interest rates by region Percentage of FS Executives, Q1 2012 to Q3 2014
12% 9% 5% 7%
50% 53% 41% 43%
39% 38% 55% 50%
0%
50%
100%
Australia & NewZealand
Europe N. America Global
Higher No change Lower
Making change now and not wait for interest rates Act now
n = 1,225. Source: CEB Q4 2013–Q3 2014 Business Barometer Survey. Note: Totals may not equal 100% due to rounding.
Expectations of lending standards and access to credit by region Percentage of FS Executives, Q1 2012 to Q3 2014
27% 36% 37% 33%
54% 40% 44% 44%
19% 24% 19% 23%
0%
50%
100%
Australia & NewZealand
Europe N. America Global
Harder No change Easier

© 2015 Experian Information Solutions, Inc. All rights reserved. Experian Public. 15
What is at risk?
16 © 2015 Experian Information Solutions, Inc. All rights reserved. Experian Public.
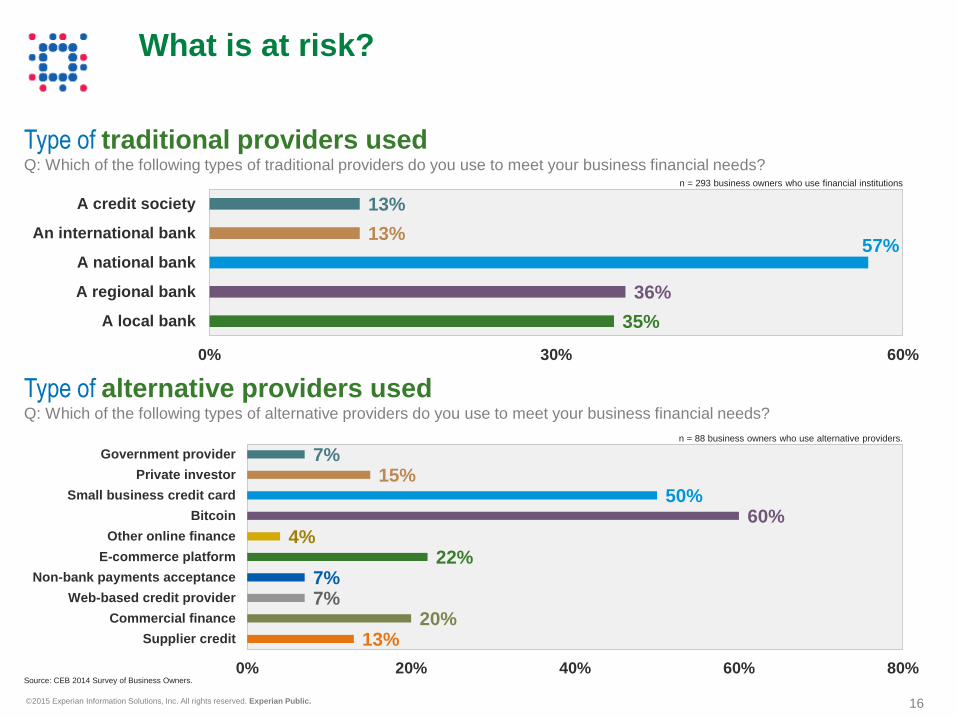
What is at risk?
n = 293 business owners who use financial institutions
35%
36%
57% 13%
13%
0% 30% 60%
A local bank
A regional bank
A national bank
An international bank
A credit society
Source: CEB 2014 Survey of Business Owners.
Type of alternative providers used Q: Which of the following types of alternative providers do you use to meet your business financial needs?
n = 88 business owners who use alternative providers.
13% 20%
7% 7%
22% 4%
60% 50%
15% 7%
0% 20% 40% 60% 80%
Supplier credit
Commercial finance
Web-based credit provider
Non-bank payments acceptance
E-commerce platform
Other online finance
Bitcoin
Small business credit card
Private investor
Government provider
Type of traditional providers used Q: Which of the following types of traditional providers do you use to meet your business financial needs?
17 © 2015 Experian Information Solutions, Inc. All rights reserved. Experian Public.
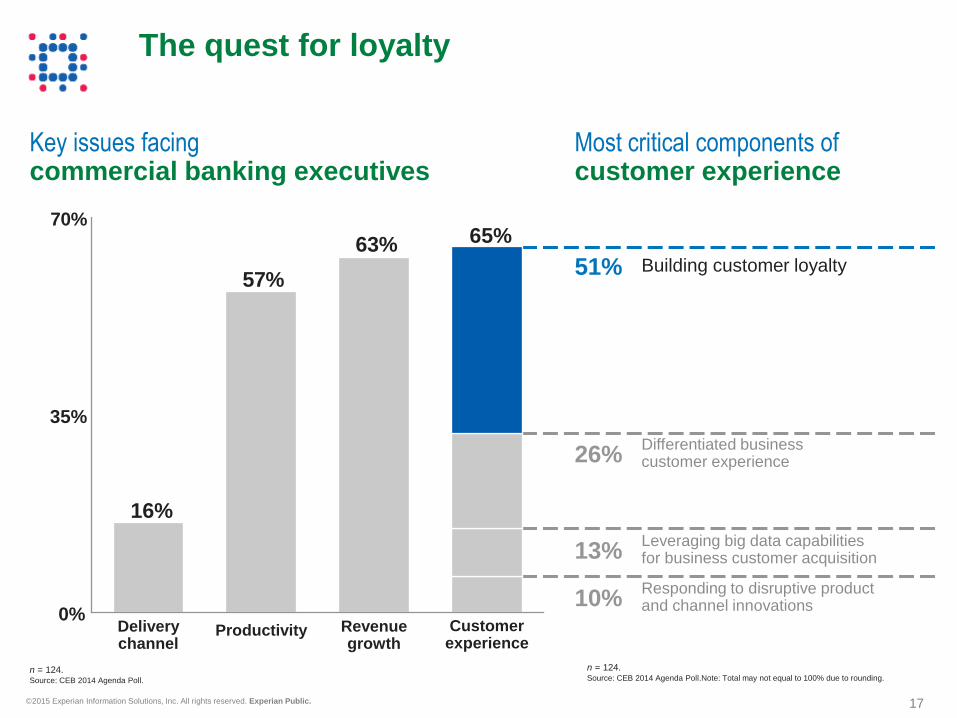
The quest for loyalty
n = 124. Source: CEB 2014 Agenda Poll.
n = 124. Source: CEB 2014 Agenda Poll.Note: Total may not equal to 100% due to rounding.
Most critical components of customer experience
26% Differentiated business customer experience
51% Building customer loyalty
13% Leveraging big data capabilities for business customer acquisition
10% Responding to disruptive product and channel innovations
Key issues facing commercial banking executives
Delivery channel
Productivity Revenue growth
Customer experience
0%
35%
70%
16%
57%
63% 65%

© 2015 Experian Information Solutions, Inc. All rights reserved. Experian Public. 18
What is the segment
within the segment?
19 © 2015 Experian Information Solutions, Inc. All rights reserved. Experian Public.
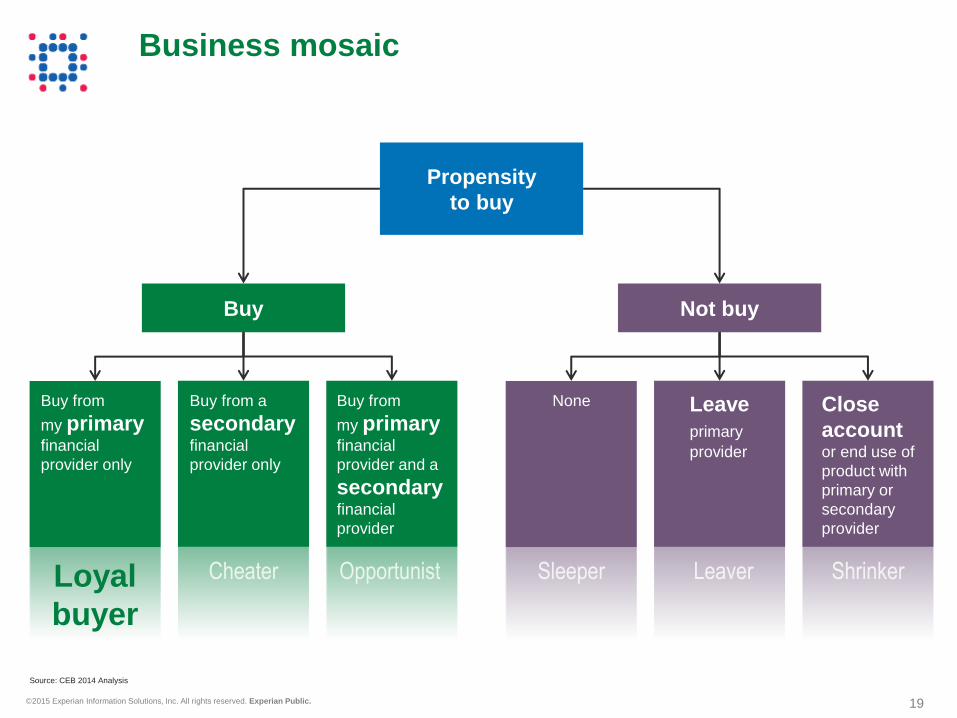
Business mosaic
Buy Not buy
Propensity
to buy
Buy from
my primary financial
provider and a
secondary financial
provider
Buy from a
secondary financial
provider only
Buy from
my primary financial
provider only
Leave
primary provider
None Close
account or end use of
product with
primary or
secondary
provider
Opportunist Cheater Sleeper Leaver Shrinker Loyal
buyer
Source: CEB 2014 Analysis

20 © 2015 Experian Information Solutions, Inc. All rights reserved. Experian Public.
Half of revenue opportunity is going to competitors
Source: CEB 2014
Business Owners Survey
21%
11% 8%
48%
8% 5%
17% 12%
6%
53%
8% 4%
0%
30%
60%
Loyal buyer Cheater Opportunist Sleeper Leaver Shrinker
Past Future
Typology distribution n = 1,493 (Past); 1,475 (Future)
Past purchases Future purchases
61%
Loyal buyer 28%
Cheater
21%
Opportunist
47%
Loyal buyer 35%
Cheater
18%
Opportunist
n = 572 n = 633

21 © 2015 Experian Information Solutions, Inc. All rights reserved. Experian Public.
Loyal buyer basics
9% 10%
53% 37%
31% 46%
7% 7%
0%
50%
100%
Loyal Buyers All Respondents
67 & above
47 to 67
30 to 46
Less than 30
Age of business owner Percentage of Loyal Buyers vs. All Respondents
n = 289 (Loyal Buyers); 1,485 (All Respondents) Source: CEB 2014 Business Owners Survey

22 © 2015 Experian Information Solutions, Inc. All rights reserved. Experian Public.
Loyal buyer basics
Age of business Percentage of Loyal Buyers vs. All Respondents
24%
28%
17%
25%
7%
0%
28%
29%
18%
17%
6%
2%
0% 20% 40%
> 20 years
11-20 years
7-10 years
4-6 years
1-3 years
< 1 year
All Respondents
Loyal Buyer
n = 263 (Loyal Buyers); 1,310 (All Respondents) Source: CEB 2014 Business Owners Survey
23 © 2015 Experian Information Solutions, Inc. All rights reserved. Experian Public.
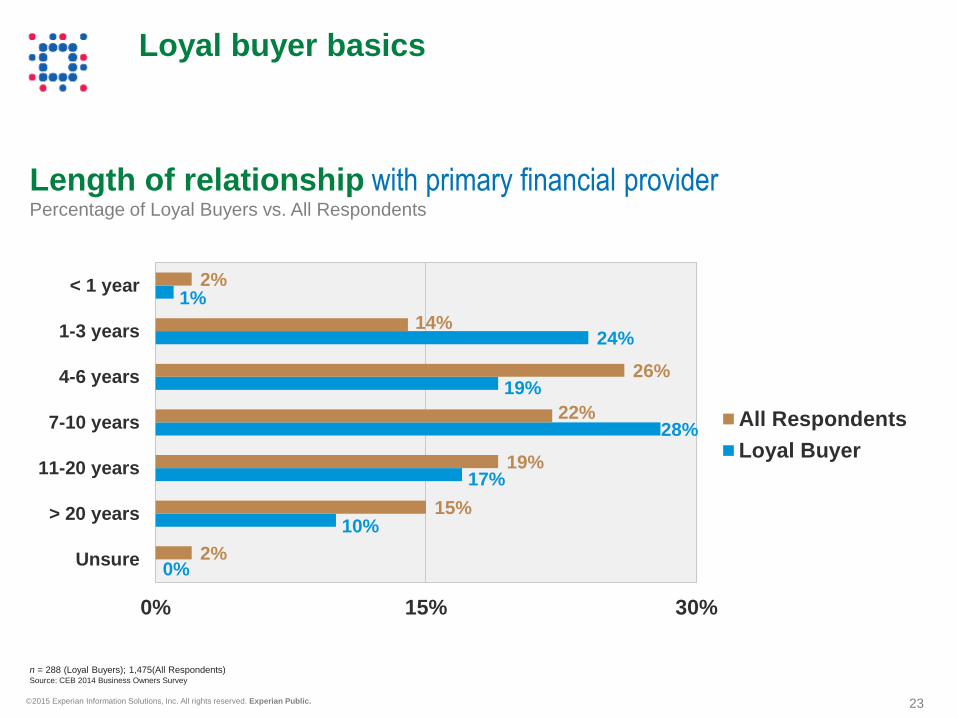
Loyal buyer basics
Length of relationship with primary financial provider Percentage of Loyal Buyers vs. All Respondents
0%
10%
17%
28%
19%
24%
1%
2%
15%
19%
22%
26%
14%
2%
0% 15% 30%
Unsure
> 20 years
11-20 years
7-10 years
4-6 years
1-3 years
< 1 year
All Respondents
Loyal Buyer
n = 288 (Loyal Buyers); 1,475(All Respondents) Source: CEB 2014 Business Owners Survey

© 2015 Experian Information Solutions, Inc. All rights reserved. Experian Public. 24
What are
commercial
borrowers
wanting?

25 © 2015 Experian Information Solutions, Inc. All rights reserved. Experian Public.
What is the buyer wanting and who does the buyer want to work with?
N = 336 United State; n = 1,544 Multi-national
Source: CEB 2014 Survey of Business Owners.
Type of contact at primary business provider
32% 37%
26%
33%
10%
10% 4%
6% 28%
14%
0%
50%
100%
United States Multi-national
No primary contact
Non-bank representative
Other bank representative
Bank branch manager
Bank regional manager

26 © 2015 Experian Information Solutions, Inc. All rights reserved. Experian Public.
n = 312 business owners.
Source: CEB 2014 Survey of Business Owners.
Face-to-face channels dominate purchasing
Current channel use for specific banking activities
38%
25%
36% 34%
47% 39%
18%
12%
13%
16% 17%
19%
17%
7%
39%
49% 20% 20%
21%
28%
18%
2% 5%
5% 5%
6% 3%
6%
1%
9% 7%
22% 21%
7% 12%
49%
2% 1% 1% 1%
0%
50%
100%
Resolvingproblems aboutmy transactions
Resolvingproblems about
my credit
Learning abouttransactionproducts
Learning aboutcredit products
Purchase newtransaction
products
Purchasing newcredit products
Using financialservices
Social media
Mobile app
Online bankWebsite
ATM
Automated phonecenter contact
Personal phonecontact
Face-to-face withreg mgr
Branch face-to-face

27 © 2015 Experian Information Solutions, Inc. All rights reserved. Experian Public.
What loyal buyers purchase Loyal buyers purchased primarily business lines of credit and online services in the past year
n = 310 (Loyal Buyer; n = 168 (Cheater); n = 128 (Opportunist)
Source: CEB 2014
12%
24%
12%
21%
24%
11%
16%
10%
22%
21%
15%
16%
19%
25%
34%
0% 10% 20% 30% 40%
Owner occupied real estate loans
Mobile business banking
General payment & collection services
Checking accounts
Business lines of credit
Loyal Buyer
Cheater
Opportunist

28 © 2015 Experian Information Solutions, Inc. All rights reserved. Experian Public.
Engaging loyal buyers
Source: CEB 2014 Business Owners Survey.
Reason for purchase Loyal Buyers vs. All Respondents
4%
29%
41%
25%
2% 6%
26%
36% 31%
2% 0%
25%
50%
Dissatisfed withanother product
Business need for anew product
Learned of businessneed for product
Responded toproduct offering
Other
n = 288 (Loyal Buyers); n = 685 (All Respondents)
Source of learned need Loyal Buyers vs. All Respondents
57%
18% 9% 8% 7% 3%
47% 19%
7% 10% 10% 8%
0%
30%
60%
Guidance fromfinancial provider
Advertisements Social media Friends / family Guidance fromnon-financial
provider
News / media
n = 117 (Loyal Buyers); n = 208 (All Respondents)
Loyal Buyers All Respondents

29 © 2015 Experian Information Solutions, Inc. All rights reserved. Experian Public.
Source: CEB analysis.
As “good” as it gets
Q: Which one word best describes your relationship with your primary financial provider?

30 © 2015 Experian Information Solutions, Inc. All rights reserved. Experian Public.
n = 338 business owners (U.S.); n = 1,553 business owners (Multi-national)
Source: CEB 2014 Survey of Business Owners.
“Nobody” is the most recommended
Recommendations
15%
10% 8%
15% 11%
21%
56%
25%
10%
15%
20%
10%
20%
37%
0%
30%
60%
Businessprimaryfinancialprovider
Businessnon-primary
financialprovider
Businessbank
relationshipmanager
Businessbank branch
manager
Businessnon-bankadvisor
Otherprofessional
advisor
None
United States
Multi-national
31 © 2015 Experian Information Solutions, Inc. All rights reserved. Experian Public.
n = 338 business owners (US); n = 1,551 business owners (Multi-national)
Source: CEB 2014 Survey of Business Owners.
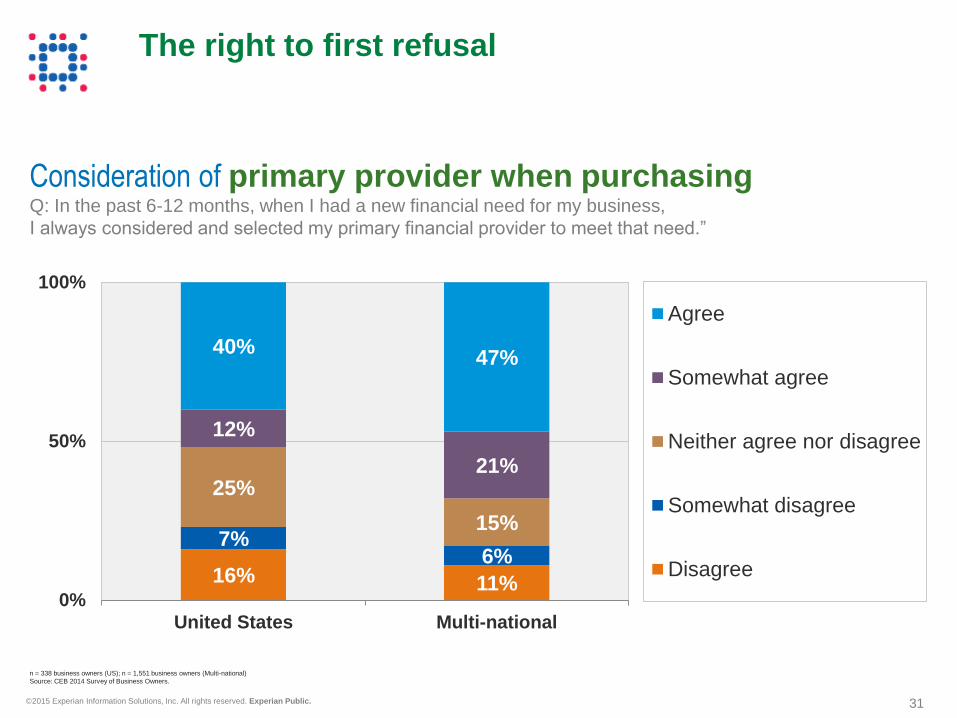
The right to first refusal
Consideration of primary provider when purchasing Q: In the past 6-12 months, when I had a new financial need for my business,
I always considered and selected my primary financial provider to meet that need.”
16% 11%
7% 6%
25%
15%
12%
21%
40% 47%
0%
50%
100%
United States Multi-national
Agree
Somewhat agree
Neither agree nor disagree
Somewhat disagree
Disagree

32 © 2015 Experian Information Solutions, Inc. All rights reserved. Experian Public.
Source: CEB 2014 Survey of Business Owners.
Well-connected to business owners
83% of business owners in the U.S. have a smartphone or tablet
Owners in the U.S. are slightly less likely to use social media than internal business owners
37% of U.S. business owners do not use social media, compared with 25% internationally
0%
50%
100%
United States Multi-national
Have smartphone & tablet
Have tablet, no smartphone
Have smartphone, no tablet
No smart phone or tablet
Prevalence of personal smartphone
or tablet ownership n = 337 business owners (US); n = 1,546 business owners (Multi-national)
0%
50%
100%
United States Multi-national
Actively read and contribute
Often read, occasionallycontribute
Often read, do not contribute
Sometimes read, do notcontribute
Do not use
Use of social media n = 337 business owners (US); n = 1,546 business owners (Multi-national)
33 © 2015 Experian Information Solutions, Inc. All rights reserved. Experian Public.
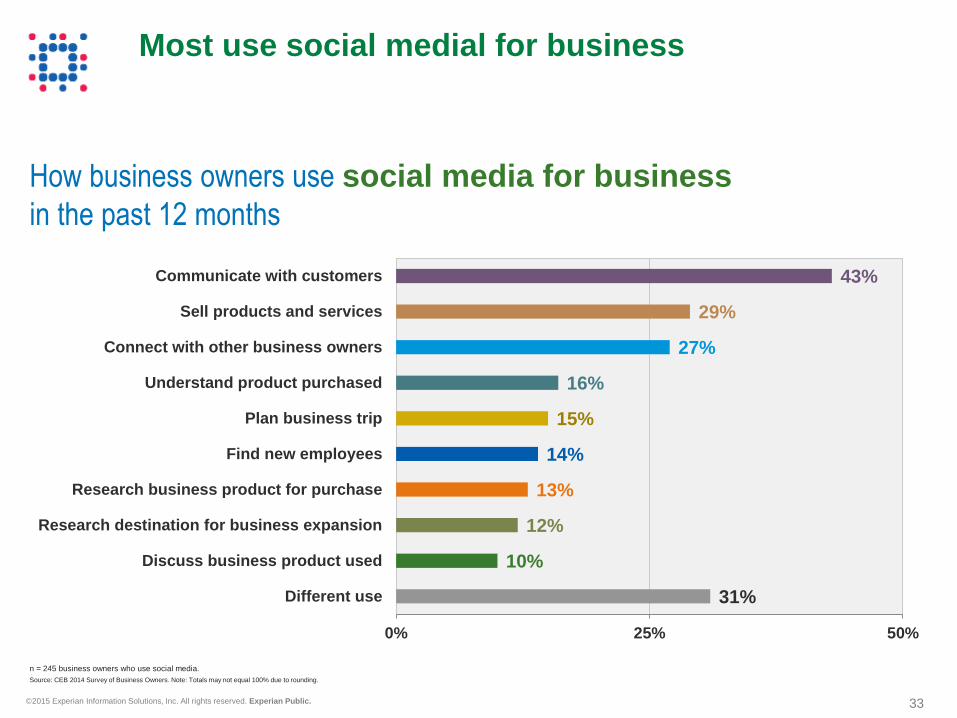
n = 245 business owners who use social media.
Source: CEB 2014 Survey of Business Owners. Note: Totals may not equal 100% due to rounding.
Most use social medial for business
How business owners use social media for business
in the past 12 months
31%
10%
12%
13%
14%
15%
16%
27%
29%
43%
0% 25% 50%
Different use
Discuss business product used
Research destination for business expansion
Research business product for purchase
Find new employees
Plan business trip
Understand product purchased
Connect with other business owners
Sell products and services
Communicate with customers

© 2015 Experian Information Solutions, Inc. All rights reserved. Experian Public. 34
Case study

35 © 2015 Experian Information Solutions, Inc. All rights reserved. Experian Public.
Develop an accessible and quantitative method for defining an prioritizing specialization areas
Imperative: Identify quality businesses Segment selection process
Define Prioritize Understand
Syndicated data
Customer data
Primary research Employee
size
Industry types
Priority: Market size (50%) + Penetration (15%) +
Profitability per business (35%)
Identify high-risk segments
Customer profitability
Market penetration
Market opportunity
Product needs
All businesses
Five groups

36 © 2015 Experian Information Solutions, Inc. All rights reserved. Experian Public.
Use existing customer data to better understand and build best-fit strategies for segments
Imperative: Identify quality businesses
Bank
Segmentation
Report
An analysis of segment
needs, demand, and
profitability in existing
customer base
Bank existing
customer base
Segmentation Report

37 © 2015 Experian Information Solutions, Inc. All rights reserved. Experian Public.
Use existing customer data to better understand and build best-fit strategies for segments
Imperative: Identify quality businesses
Industry profitability
by size Illustrative
Number of employees
1-3 4-9 10-24 25-50
Pro
fita
bilit
y p
er
em
plo
ye
e
Product propensity for industry
by size Illustrative
Number of employees
Deposits Loans Cash management
Merchant services
More likely to own
Indifferent
Less likely to own
1-3 4-9 10-24 25-50

38 © 2015 Experian Information Solutions, Inc. All rights reserved. Experian Public.
Express review
Faster, with a focus on serving an immediate need
Needs-driven outreach
CM may contact priority client with a targeted offer, such as a rewards credit card that fits his or her spending habits
Event-driven outreach
CM may contact priority client in response to certain triggers, such as a term deposit reaching maturity
Full A-to-Z needs-based discussion
20-30 minutes
In-depth detailed assessment of the whole client relationship
Imperative: Help customers plan Annual priority client relationship cycle
Q1 Q2
Q3 Q4

39 © 2015 Experian Information Solutions, Inc. All rights reserved. Experian Public.
Imperative: Help customers plan Characteristics and benefits of the A-Z needs-based discussion
Clients are receptive to periodic, in-depth discussions because they value the time saved by the service
Previously, their needs were underserved
Discussion format is flexible, meaning CMs talk broadly about clients’ situations and conversations feel focused on goals rather than sales
Information allows CMs to build a pipeline of life events and also proactively reach out with offers based on what they learn from the discussions
© 2015 Experian Information Solutions, Inc. All rights reserved. Experian Public. 40
@mikehorrocks
For additional information,
please contact:
@ExperianVision | #vision2015
Follow us on Twitter:

41 © 2015 Experian Information Solutions, Inc. All rights reserved. Experian Public.
Share your thoughts about Vision 2015!
Please take the time now to give us your feedback about this session. You can complete the survey in the mobile app or request a paper survey.
Select the breakout
session you attended
Select the Survey
button and complete 1 2

© 2015 Experian Information Solutions, Inc. All rights reserved. Experian Public.