Embed Size (px)
Citation preview

© 2017 IMD – International Institute for Management Development. Not to be used or reproduced without permission.
Arturo Bris – Professor of FinanceDirector, IMD World Competitiveness Center
The Changing Game of Global Competition
© IMD 2017
Ask an Economist
“…if Clinton wins it should be up about 3 percent and if Trump wins, it should go down 7 percent"
Eric Zitzewitz, Economics Professor at Dartmouth College, at NBC on Nov 3
© IMD 2017
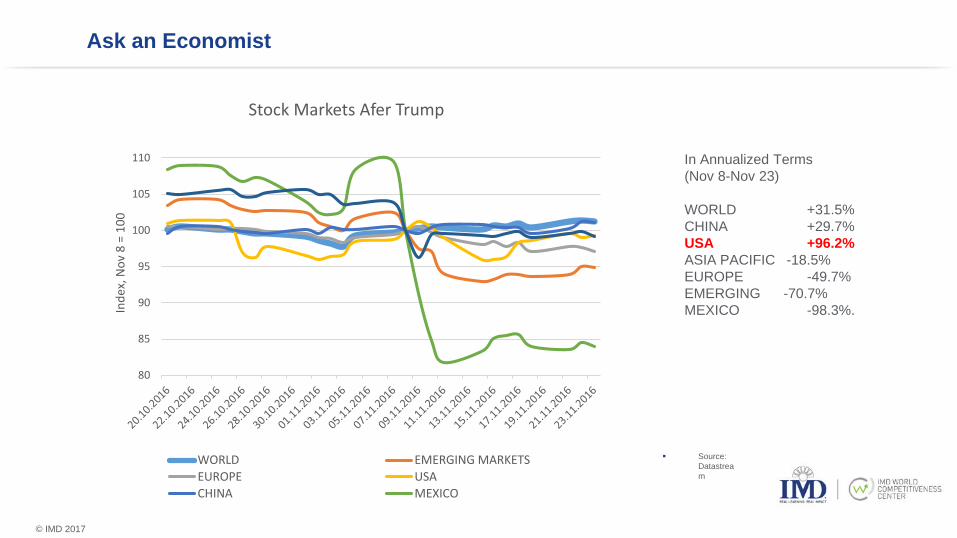
Source: Datastream
80
85
90
95
100
105
110
Inde
x, N
ov 8
= 1
00Stock Markets Afer Trump
WORLD EMERGING MARKETSEUROPE USACHINA MEXICO
In Annualized Terms(Nov 8-Nov 23)
WORLD +31.5%CHINA +29.7%USA +96.2%ASIA PACIFIC -18.5%EUROPE -49.7%EMERGING -70.7%MEXICO -98.3%.
Ask an Economist

© IMD 2017
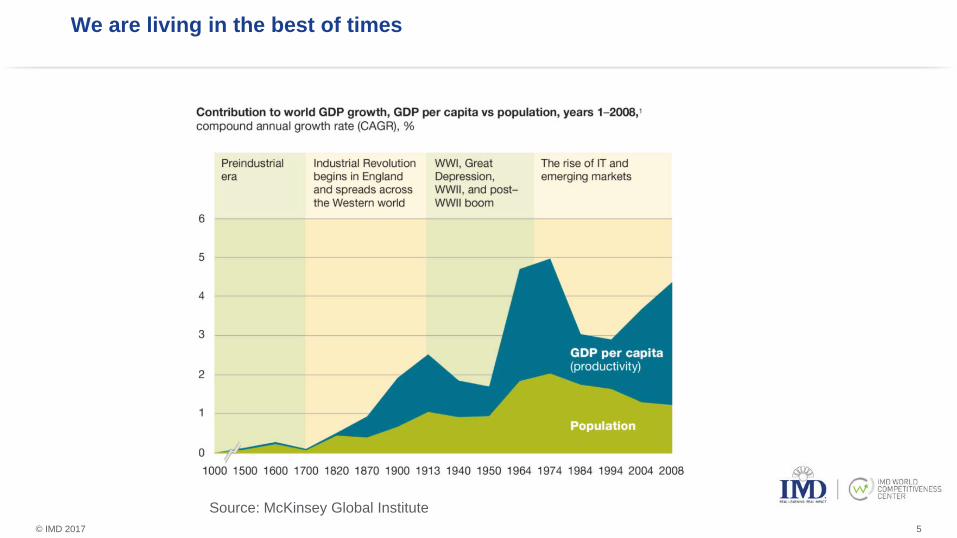
Between 1000 AC and 1930 real World GDP per capita increased by a factor of 3
21 over the 20th century
In the first decade of the 21st century, the population of the world has produced more economic output than in the first 19 centuries of the common era combined.
World GDP per capita has increased by a factor of
4
© IMD 2017
We are living in the best of times
Source: McKinsey Global Institute5
© IMD 2017
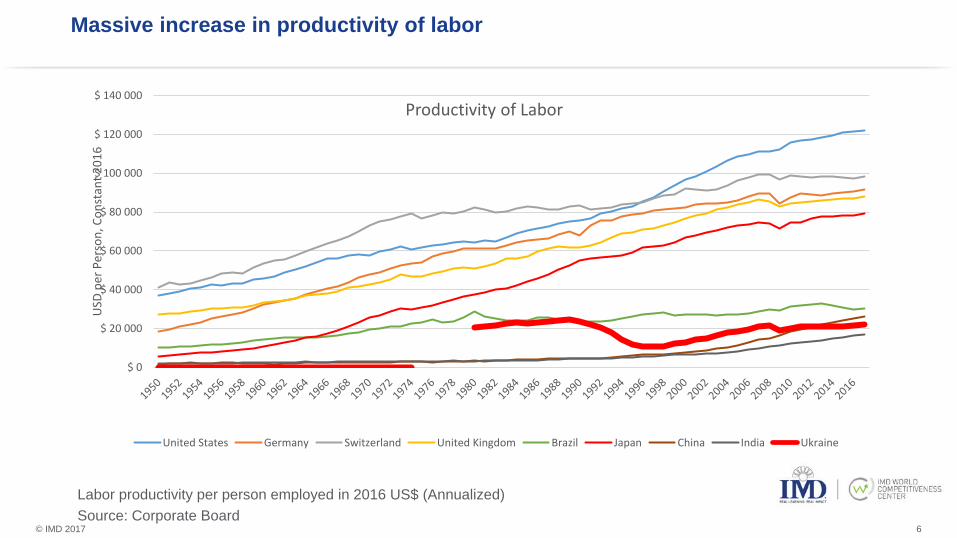
Massive increase in productivity of labor
6
Labor productivity per person employed in 2016 US$ (Annualized)Source: Corporate Board
$ 0
$ 20 000
$ 40 000
$ 60 000
$ 80 000
$ 100 000
$ 120 000
$ 140 000U
SD p
er P
erso
n, C
onst
ant 2
016
Productivity of Labor
United States Germany Switzerland United Kingdom Brazil Japan China India Ukraine
© IMD 2017
Why?Technology of course
7

© IMD 2017
Productivity Puzzle
8
% Increases in Labor productivity per person employed in 2016 US$ (Annualized)Source: Corporate Board
-5%
-3%
-1%
1%
3%
5%
7%
9%
UnitedStates
Germany Switzerland UnitedKingdom
Brazil Japan China India Ukraine
Productivity of Labor Growth
1950-1960 1961-1970 1971-1980 1981-1990 1991-2000 2001-2010 2011-2017
© IMD 2017
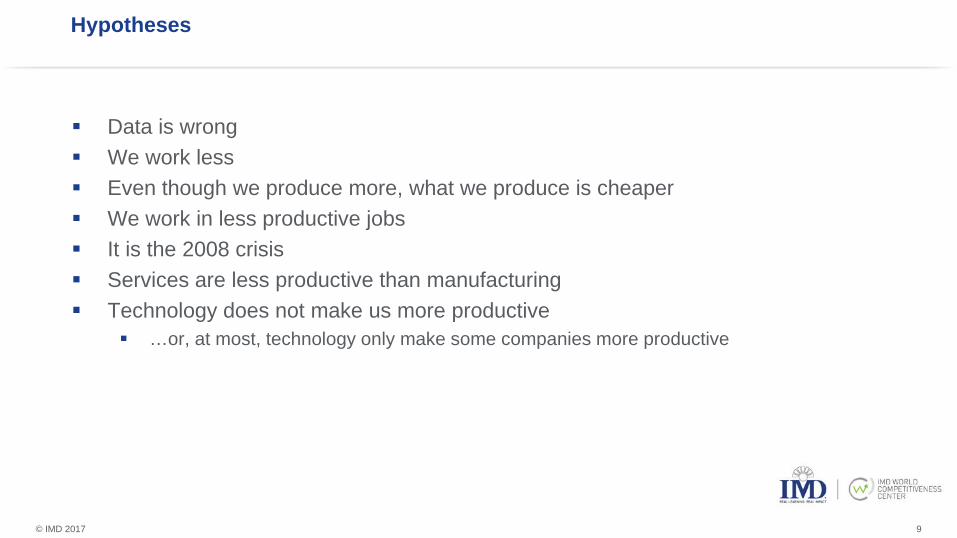
Hypotheses
Data is wrong We work less Even though we produce more, what we produce is cheaper We work in less productive jobs It is the 2008 crisis Services are less productive than manufacturing Technology does not make us more productive
…or, at most, technology only make some companies more productive
9

© IMD 2017
Hypotheses
Data is wrong We work less Even though we produce more, what we produce is cheaper We work in less productive jobs It is the 2008 crisis Services are less productive than manufacturing Technology does not make us more productive
…or, at most, technology only make some companies more productive
10
© IMD 2017
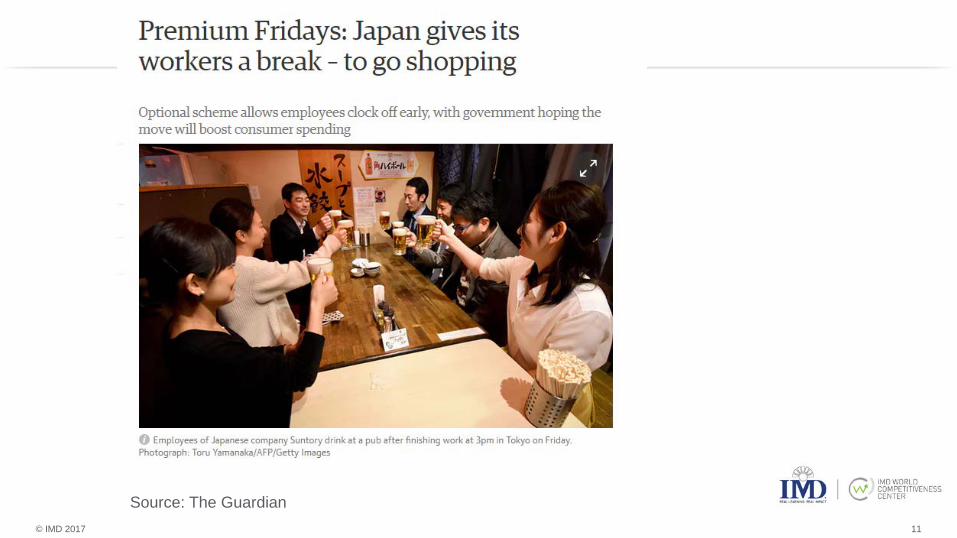
Source: The Guardian11
© IMD 2017
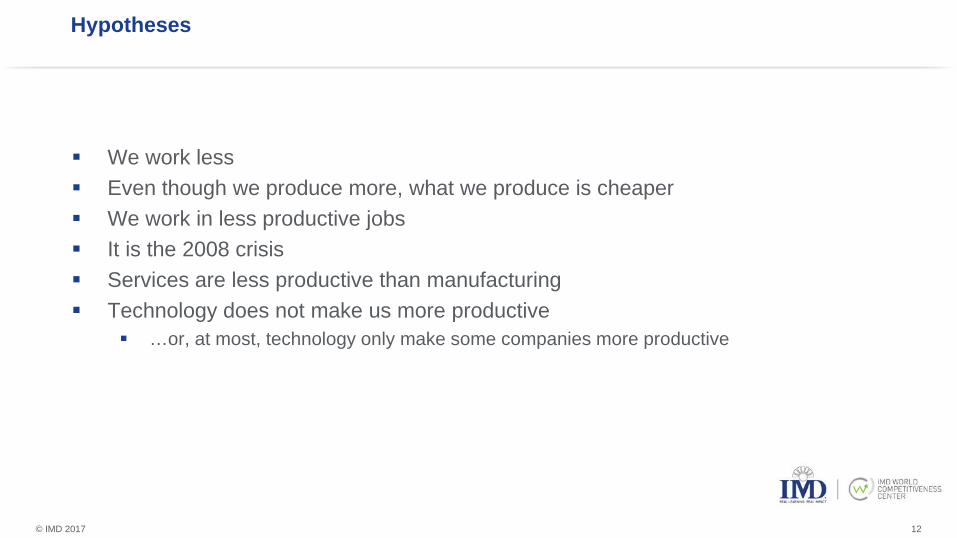
Hypotheses
We work less Even though we produce more, what we produce is cheaper We work in less productive jobs It is the 2008 crisis Services are less productive than manufacturing Technology does not make us more productive
…or, at most, technology only make some companies more productive
12
© IMD 2017
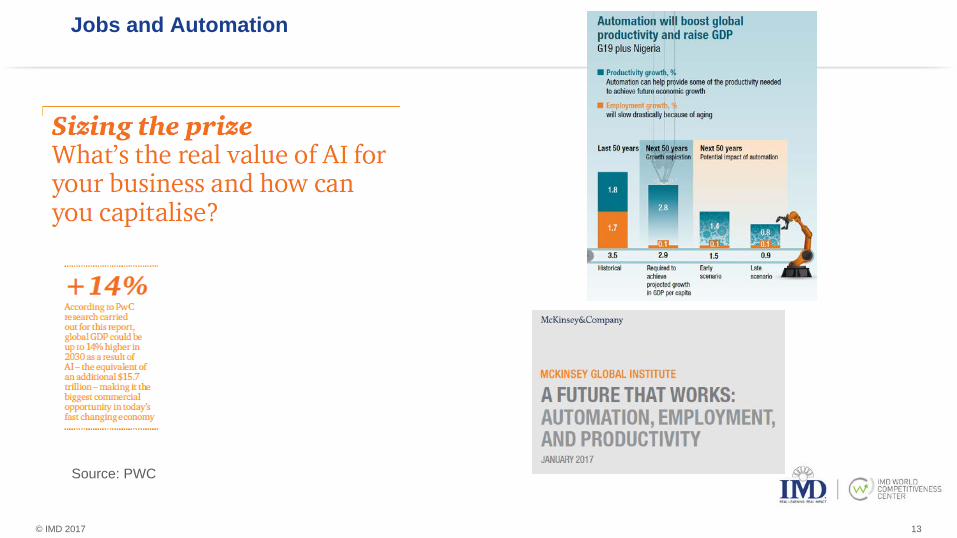
Jobs and Automation
Source: PWC
13

© IMD 2017
Hypotheses
We work in less productive jobs It is the 2008 crisis Services are less productive than manufacturing Technology does not make us more productive
…or, at most, technology only make some companies more productive
14

© IMD 2017
Crisis?
15
0%
2%
4%
6%
8%
10%
12%
0
100
200
300
400
500
600
Perc
ent o
f Ass
ets
Thou
sand
Dol
lars
General Electric - Productivity and Investment
Sales per Employee (Left Scale) Capex to Assets (Right Scale)
© IMD 2017
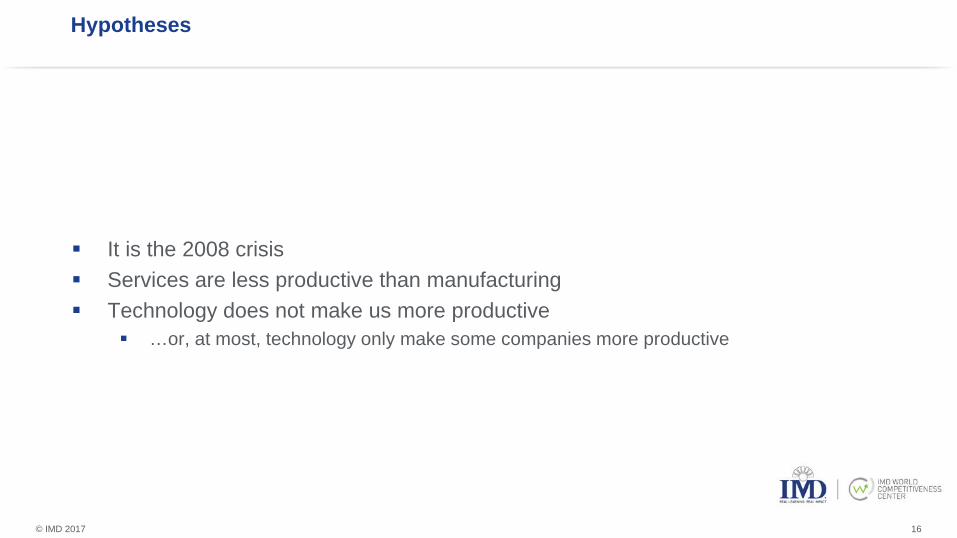
Hypotheses
It is the 2008 crisis Services are less productive than manufacturing Technology does not make us more productive
…or, at most, technology only make some companies more productive
16
© IMD 2017 17
$0
$500
$1 000
$1 500
$2 000
$2 500
$3 000
1980
1981
1982
1983
1984
1985
1986
1987
1988
1989
1990
1991
1992
1993
1994
1995
1996
1997
1998
1999
2000
2001
2002
2003
2004
2005
2006
2007
2008
2009
2010
2011
2012
2013
2014
2015
2016
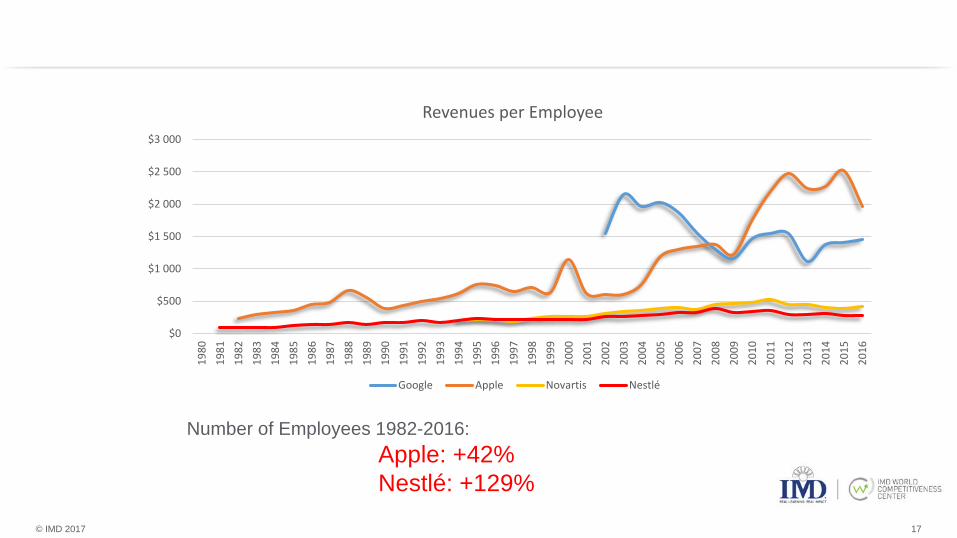
Revenues per Employee
Google Apple Novartis Nestlé
Number of Employees 1982-2016:Apple: +42%Nestlé: +129%
© IMD 2017 18
-5%
-3%
-1%
1%
3%
5%
7%
9%
11%
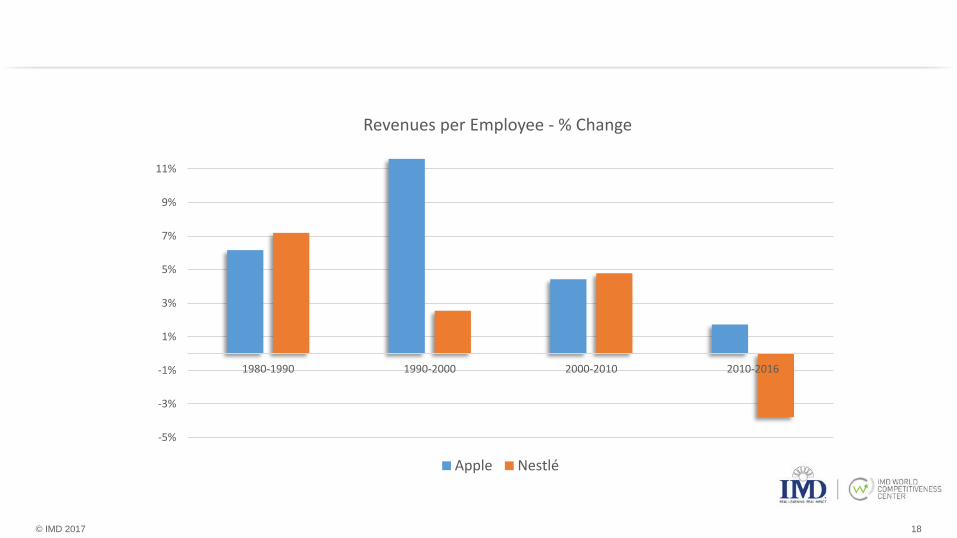
1980-1990 1990-2000 2000-2010 2010-2016
Revenues per Employee - % Change
Apple Nestlé

© IMD 2017 19
-5%
0%
5%
10%
15%
1980-1990 1990-2000 2000-2010 2010-2016
Profits per Employee - % Change
Apple Nestlé
© IMD 2017
McKinsey: “Our productivity estimates assume that people displaced by automation will find other employment.”
“Although automation is a global phenomenon, four economies—China, India, Japan, and the United States—account for just over half of the total wages and almost two-thirds the number of employees associated with activities that are technically automatable by adapting currently demonstrated technologies”
20
© IMD 2017
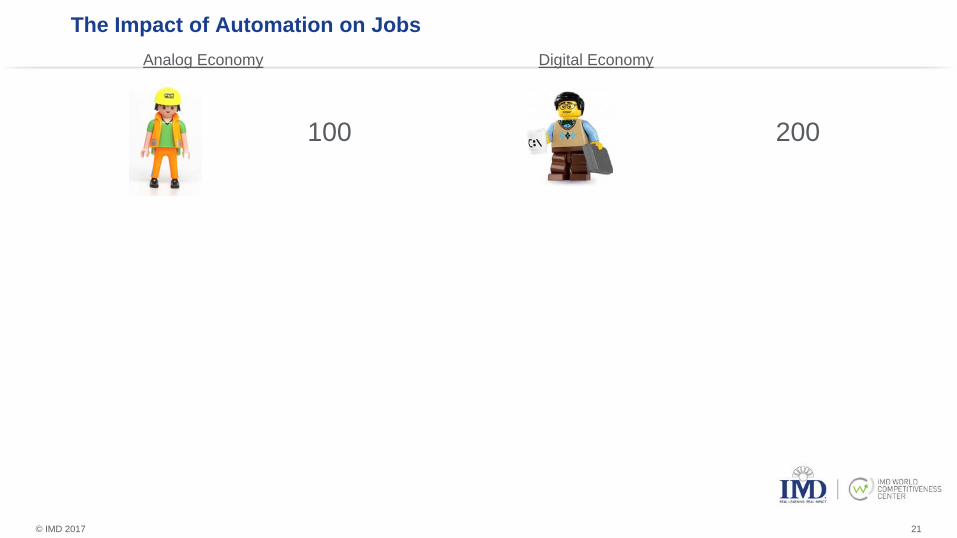
The Impact of Automation on Jobs
21
100 200
Analog Economy Digital Economy
© IMD 2017
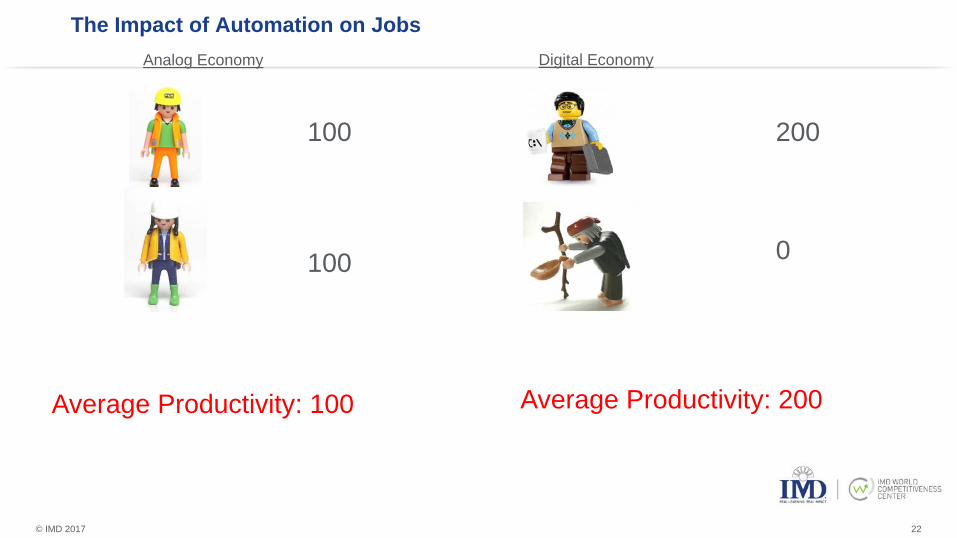
The Impact of Automation on Jobs
22
100 200
100
Average Productivity: 100
0
Average Productivity: 200
Analog Economy Digital Economy
© IMD 2017
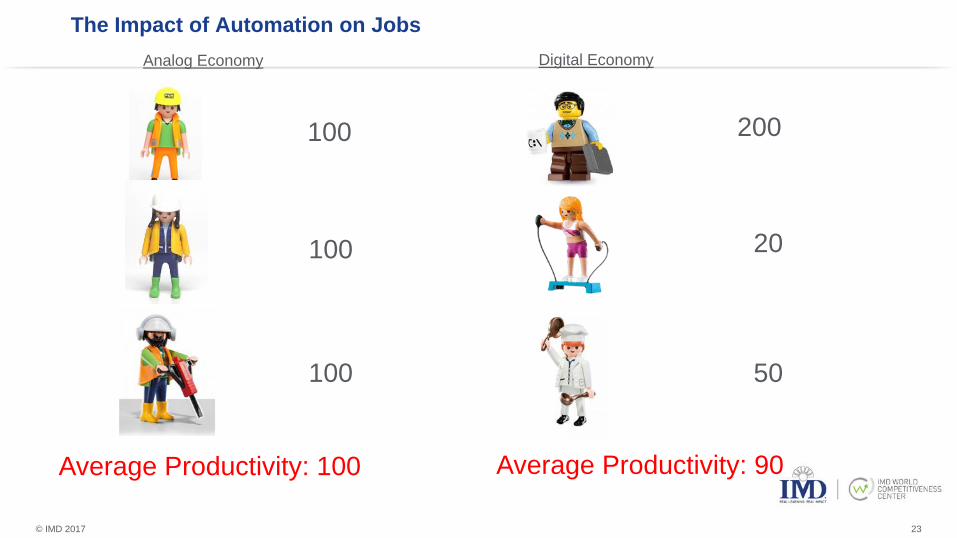
The Impact of Automation on Jobs
23
100
100
100
200
20
50
Average Productivity: 100 Average Productivity: 90
Analog Economy Digital Economy
© IMD 2017
Google “Playmobil Finance Professor”
24
© IMD 2017
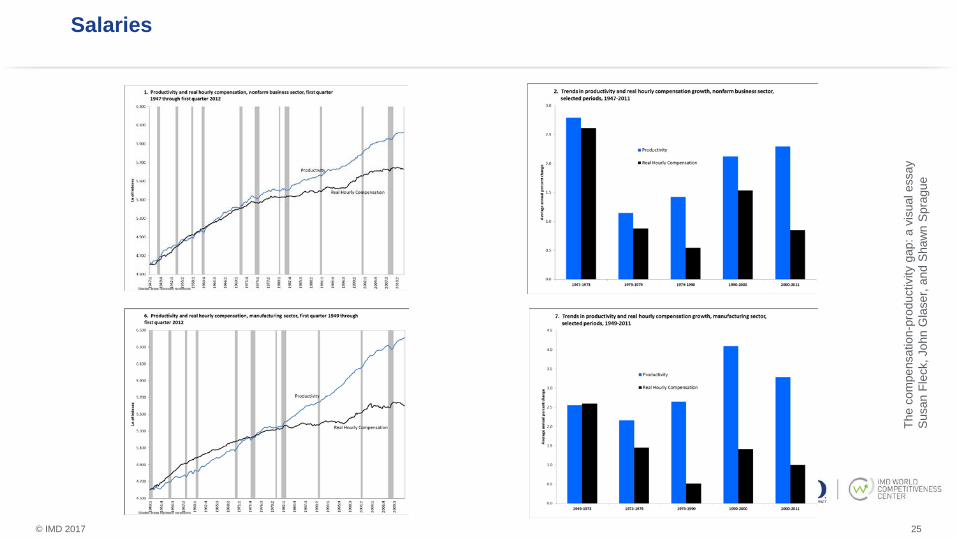
Salaries
25
The
com
pens
atio
n-pr
oduc
tivity
gap
: a v
isua
l ess
aySu
san
Flec
k, J
ohn
Gla
ser,
and
Shaw
n Sp
ragu
e
© IMD 2017
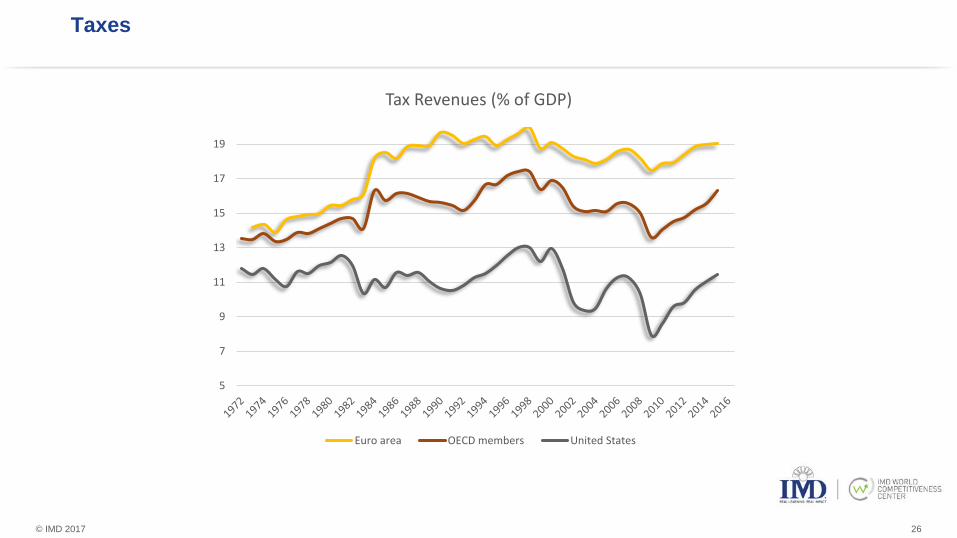
Taxes
26
5
7
9
11
13
15
17
19
Tax Revenues (% of GDP)
Euro area OECD members United States

© IMD 2017
Taxes
27
0,0
5,0
10,0
15,0
20,0
25,0
30,0
35,0
40,0
45,0
France Germany Japan Switzerland United Kingdom United States OECD Average
Taxes Around the World
Taxes on corporate income as % of total taxation 1980 Taxes on corporate income as % of total taxation 2014
Taxes on personal income as % of total taxation 1980 Taxes on personal income as % of total taxation 2014
© IMD 2017
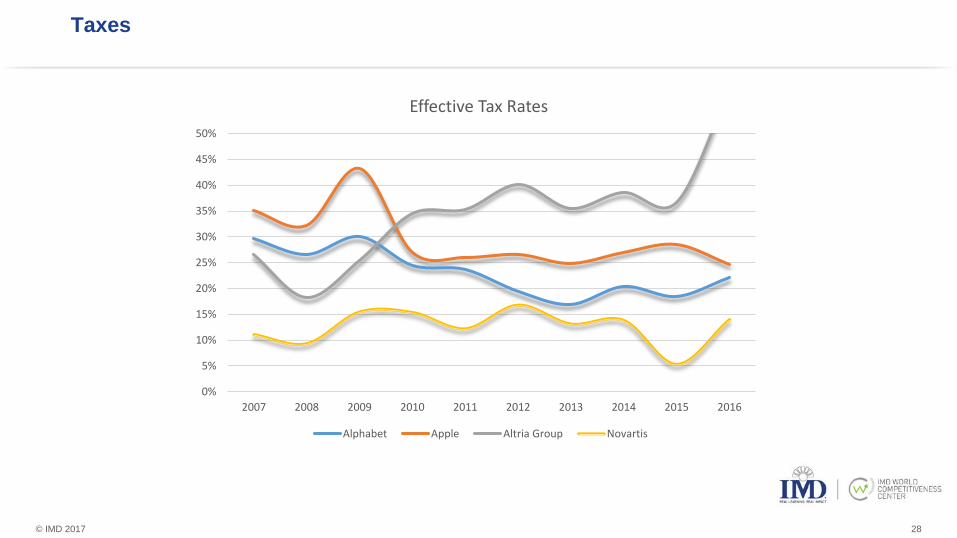
Taxes
28
0%
5%
10%
15%
20%
25%
30%
35%
40%
45%
50%
2007 2008 2009 2010 2011 2012 2013 2014 2015 2016
Effective Tax Rates
Alphabet Apple Altria Group Novartis
© IMD 2017
Technology is going to create a massive gap between the rich and the poor (Switzerland and Burundi), but also between technologically-advanced countries (China and the US), and the rest
The gap is self-perpetuating because fiscal rules will continue penalizing labor and production against technology in all countries.
Moreover, technology creates monopolies, and therefore market power and rents.
29

© IMD 2017 30
© IMD 2017
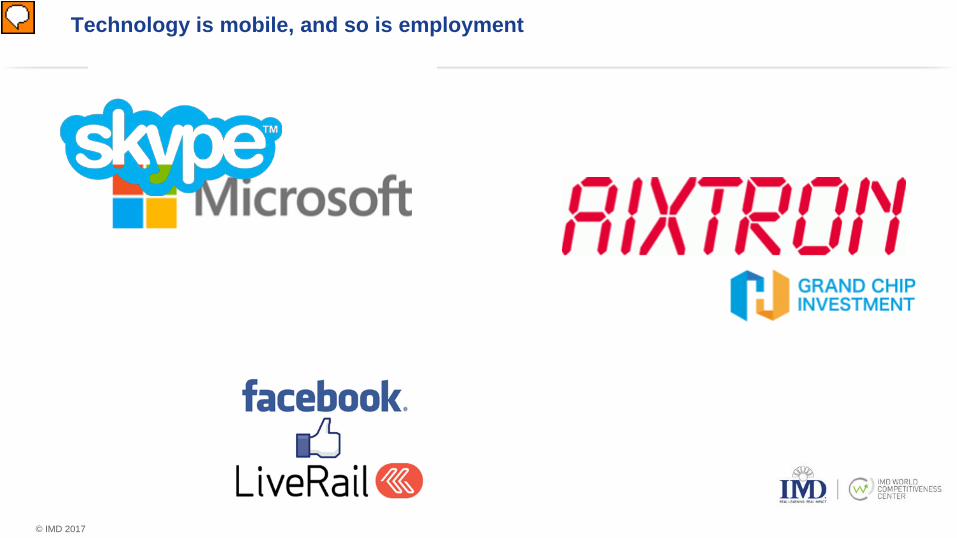
Technology is mobile, and so is employment
© IMD 2017
I tell you what will NOT work
Collaborative Economy
32
© IMD 2017
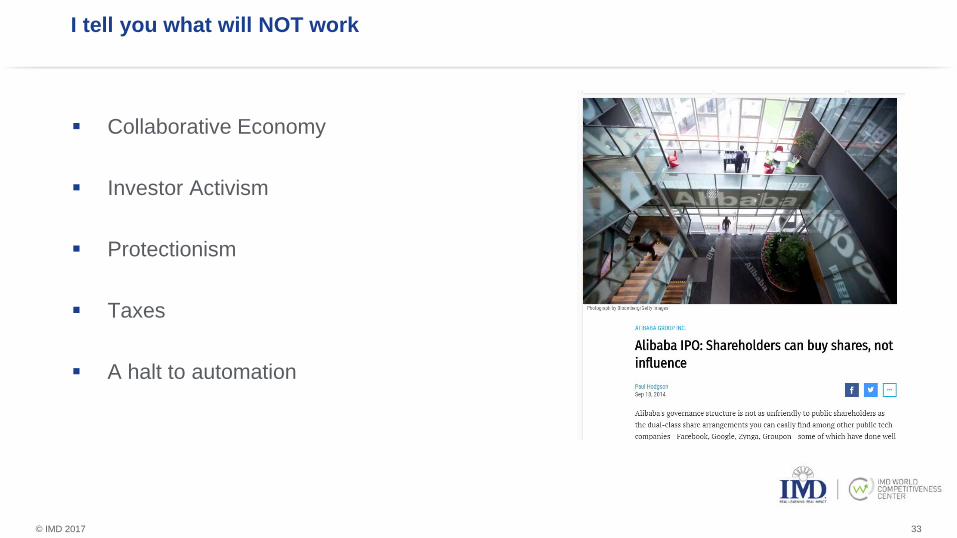
I tell you what will NOT work
Collaborative Economy
Investor Activism
Protectionism
Taxes
A halt to automation
33
© IMD 2017
Scary?
Source: Kai-Fu Lee “The Real Threat of Artificial Intelligence,” New York Times June 24, 2017
34

© IMD 2017
In Summary
2008 Today
Corporate Profits
GDP
Wages