Embed Size (px)
Citation preview


Q4 2014 HIGHLIGHTS
February 27, 2015

FORWARD-LOOKING STATEMENTS
3
Forward-looking statements are included in this presentation. These forward-looking statements are typically identified by the use of terms such as “outlook”, “guidance”, “target”, “forecast”, “assumption” and other similar expressions or future or conditional terms such as "anticipate", "believe", "could", "estimate", "expect", "intend", "may", "plan", "predict", "project", "will", "would", and “should”. Such statements may involve but are not limited to comments with respect to strategies, expectations, planned operations or future actions.
Forward-looking statements, by their nature, are based on assumptions and are subject to important risks and uncertainties. Any forecasts, predictions or forward-looking statements cannot be relied upon due to, among other things, changing external events and general uncertainties of the business and its corporate structure. Results indicated in forward-looking statements may differ materially from actual results for a number of reasons, including without limitation, dependency on significant Accumulation Partners and clients, failure to safeguard databases, cyber security and consumer privacy, changes to the Aeroplan Program, reliance on Redemption Partners, conflicts of interest, greater than expected air redemptions for rewards, regulatory matters, retail market/economic conditions, industry competition, Air Canada liquidity issues, Air Canada or travel industry disruptions, airline industry changes and increased airline costs, supply and capacity costs, unfunded future redemption costs, changes to coalition loyalty programs, seasonal nature of the business, other factors and prior performance, foreign operations, legal proceedings, reliance on key personnel, labour relations, pension liability, technological disruptions and inability to use third-party software, failure to protect intellectual property rights, interest rate and currency fluctuations (including currency risk or our foreign operations which are denominated in a currency other than the Canadian dollar, mainly pound sterling, and subject to fluctuations as a result of foreign exchange rate variations), leverage and restrictive covenants in current and future indebtedness, uncertainty of dividend payments, managing growth, credit ratings, audit by tax authorities, as well as the other factors identified throughout Aimia’s MD&A and its other public disclosure records on file with the Canadian securities regulatory authorities.
In particular, slides 27 and 28 of this presentation contain certain forward-looking statements with respect to certain financial metrics in 2015. Aimia made a number of general economic and market assumptions in making these statements, including assumptions regarding currencies, the performance of the economies in which the Corporation operates and market competition and tax laws applicable to the Corporation’s operations. The Corporation also made certain assumptions, with respect to the financial impact of the outcome of its ongoing negotiations with each of TD and CIBC, in relation to the Aeroplan financial card agreements as a result of changes to credit card interchange rates to be implemented as of April 30, 2015. The Corporation cautions that the assumptions used to make these statements with respect to 2015, although reasonable at the time they were made, may prove to be incorrect or inaccurate. In addition, these statements do not reflect the potential impact of any non-recurring or other special items or of any new material commercial agreements, dispositions, mergers, acquisitions, other business combinations or transactions that may be announced or that may occur after February 27, 2015. The financial impact of these transactions and non-recurring and other special items can be complex and depends on the facts particular to each of them. We therefore cannot describe the expected impact in a meaningful way or in the same way we present known risks affecting our business. Accordingly, our actual results could differ materially from the statements made on slides 27 and 28 of this presentation.
The forward-looking statements contained herein represent the Corporation’s expectations as of February 27, 2015 and are subject to change. However, Aimia disclaims any intention or obligation to update or revise any forward-looking statements whether as a result of new information, future events or otherwise, except as required under applicable securities regulations.
For further information, please contact Investor Relations at 416 352 3728 or [email protected].
RUPERT DUCHESNE GROUP CHIEF EXECUTIVE

2014 WAS A YEAR OF EXCEPTIONAL PROGRESS
5
• Aeroplan: fantastic year with
new financial partners and
launch of Distinction
• Expanded the coalition
business in Asia, Spain
• Intelligent Shopper Solutions
(ISS) data analytics business
momentum
• Initial sales of next-generation
global platforms (ALP/ACP)
Met or exceeded our
guidance on all key
financial metrics
2014 PROGRESS MAPPED AGAINST OUR STRATEGY
6
Aeroplan transformation delivered exceptional results
• Net new co-branded cards acquired with TD, CIBC, and AMEX
~400,000(1)
• Miles issued excluding promotional miles climbed 5.6% YoY
• Market Fare Flight Rewards up 128% YoY
• Distinction members more engaged with average accumulation up
+17% and earning rewards at 15% more partners on average than
a year ago
(1) Revised March 2015; 450,000 net cards shown previously included co-branded as well as American Express cards exercising the Aeroplan conversion option.
2014 PROGRESS MAPPED AGAINST OUR STRATEGY
7
Further opportunities for growth using a coalition loyalty model
• Club Premier: Gross Billings grew 14% CAGR since 2011
with $45 million distributions received, equity stake now worth
at least double
• Replicate model with Air Asia, evolving pure FFP into more
sophisticated coalition program
• Replicate the model with Travel Club in Spain
• Seek coalition opportunities in various markets

2014 PROGRESS MAPPED AGAINST OUR STRATEGY
8
Global growth strategy adding value and returns on investments
• Significant addressable market in proprietary loyalty
• Product sale successes with ALP, ACP, Smart Button
• Partnership strategy allows capabilities to be shared quickly
with lower risk
• Fair value of Cardlytics worth more than $100 million, double
our initial investment
• Significant growth potential for ISS business

2015 AND BEYOND
9
Leverage our unique capabilities and experience to replicate our
success globally
Continue to build breadth and scale in our business to serve global
clients
Make investments to enter new markets or to efficiently access
capabilities; and exit investments if not generating an acceptable return
on capital
Look for opportunities in evolving field of marketing data science that
drive benefits for partners and program members
Continue to deliver attractive returns to shareholders:
• Quarterly dividend per common share raised from $0.17 to $0.18 in
2014
• Approximately $30 million in common shares repurchased in 2014
with approximately another $20 million shares repurchased to date in
2015

DAVID ADAMS EXECUTIVE VICE-PRESIDENT
AND CFO
GROSS BILLINGS
11
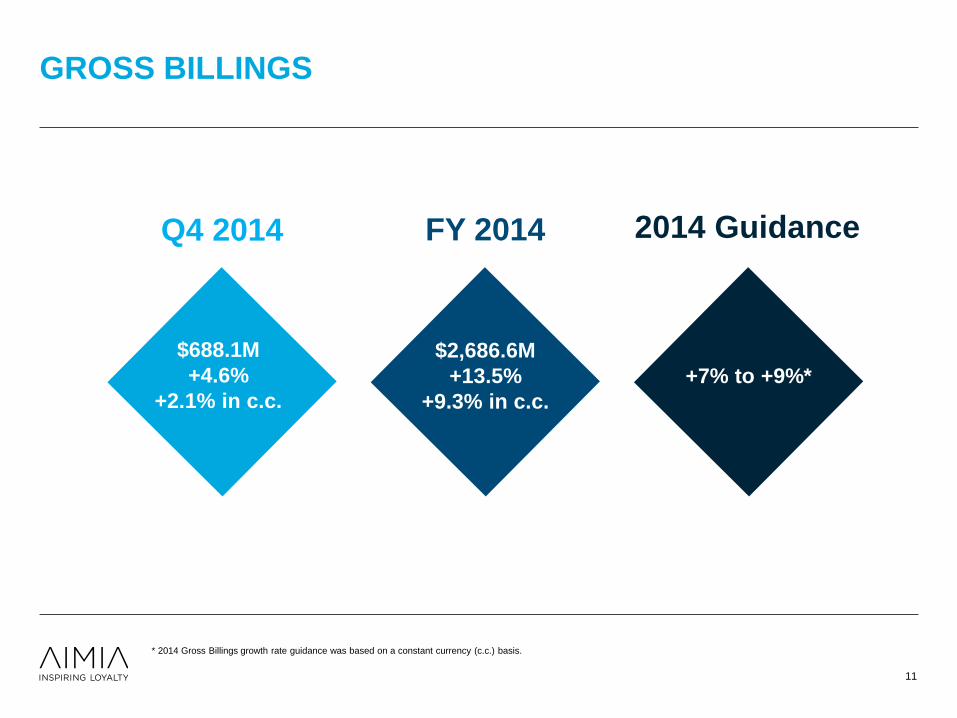
$2,686.6M
+13.5%
+9.3% in c.c.
FY 2014
$688.1M
+4.6%
+2.1% in c.c.
Q4 2014
+7% to +9%*
2014 Guidance
* 2014 Gross Billings growth rate guidance was based on a constant currency (c.c.) basis.

ADJUSTED EBITDA
12
* Adjusted EBITDA as a % of Gross Billings.
$316.4M
11.8%
margin*
FY 2014
$60.0M
8.7%
margin*
Q4 2014
~12.0%
margin*
2014 Guidance

FREE CASH FLOW*
13
$287.0M
FY 2014
$17.1M
Q4 2014
$230M to
$250M(1)
2014 Guidance
* Free cash flow before common and preferred dividends paid.
(1) The original 2014 guidance issued on February 26, 2014 for Free Cash Flow was a target range of $230.0 to $250.0 million which was updated on August 14, 2014 to a
revised target of in excess of $270.0 million.

CANADA PERFORMANCE
14
Q4 2014 FY 2014
Total Gross
Billings +7.7% +18.5%
Gross
Billings from
the sale of
Loyalty Units
+12.2% +23.6%
Other Gross
Billings (14.7%) (7.6%)
Air Canada
• Air rewards up >30%
• Ticket purchases:
• Q4 2014: +63%
• FY 2014: +50%
+$180M

CANADA PERFORMANCE
15
10.5%
14.6%
15.7%
7.0%
Q4 2014 FY 2014
Accumulation Redemption
93.0%
71.9%
76.6% 74.3%
78.7%
101.0%
80.0% 82.0% 79.7% 85.4%
Q1 2014 Q2 2014 Q3 2014 Q4 2014 FY 2014
Burn Earn Burn Earn excluding Promotional Miles
Accumulation and Redemption YoY% Burn Earn %

AEROPLAN TRANSFORMATION
16
• Investing to drive long-term growth
• Gross Billings better than expected
• Margins impacted as expected
Operational and
Financial Success

YIELD
17
Higher than expected card
acquisitions but price per mile diluted
because of:
1. Welcome Bonus miles on New Card
Acquisitions
2. Miles used for Marketing and Bonus
Programs
2014
• Welcome Bonus activity should
taper
• Marketing and bonus program
ongoing
• Impact of Interchange embedded in
guidance
2015

CARD SPEND
18
• New vs. Tenured
• New card spend 50% of tenured
• Split card spending
2014
• Renewal trends
• Spending patterns
2015

REWARDS MIX
19
• Customers embrace Market Fare
Flight Rewards
• Half of Air Canada rewards are
more-expensive MFFR
• Higher USD makes Star Alliance
redemptions more costly
2014
• Stronger USD
• Expected continued popularity of
MFFR
• Airfares remain stable
2015

CANADA 2015 OUTLOOK
20
• Yield + Spend + Rewards Mix resulted in 2014 margin pressure
• Mid-to-high single digit growth from financial partners
• Growth from Air Canada’s increased capacity
• Loss of large financial service client in proprietary business
• Interchange factored into guidance
15.5%(1)
2014 2015
Adjusted EBITDA Margin
Core business
Expect margin growth
for 2015
(1) Adjusted EBITDA margin excluding the $100.0 million contribution from TD.

EMEA PERFORMANCE
21
Q4 2014 FY 2014
Total Gross Billings
+2.2%
(3.1%) in c.c.
+9.7%
(1.7%) in c.c.
Gross Billings from the sale of
Loyalty Units
(1.7%)
(6.6%) in c.c.
+6.6%
(4.6%) in c.c.
Other Gross Billings
+29.1%
+21.9% in c.c.
+34.0%
+21.3% in c.c.
NECTAR UK
22
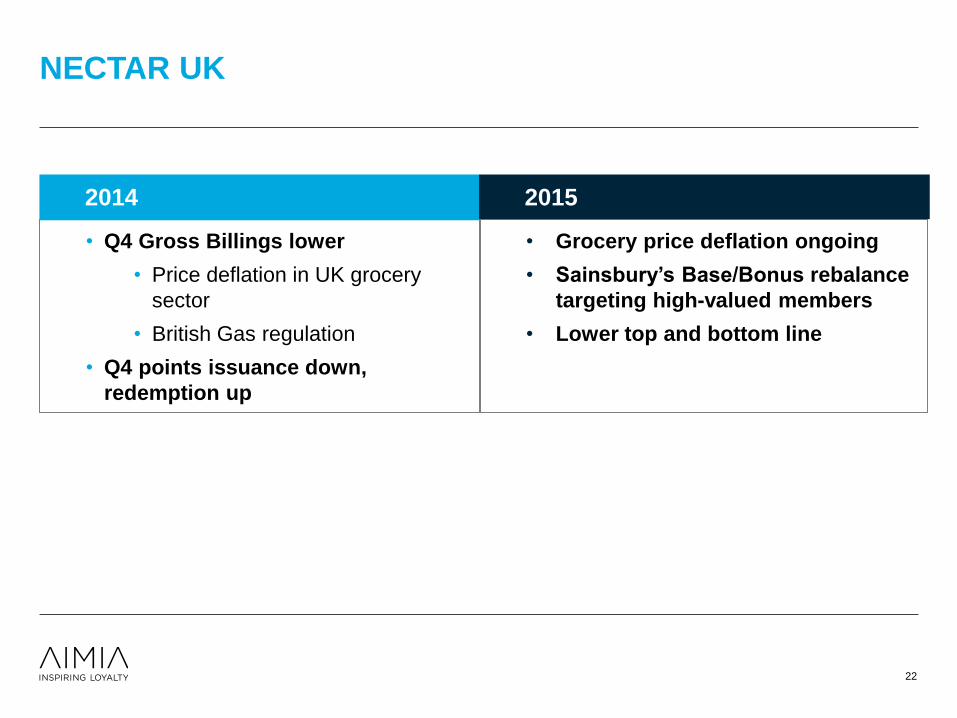
• Q4 Gross Billings lower
• Price deflation in UK grocery
sector
• British Gas regulation
• Q4 points issuance down,
redemption up
2014
• Grocery price deflation ongoing
• Sainsbury’s Base/Bonus rebalance
targeting high-valued members
• Lower top and bottom line
2015

NECTAR ITALIA
23
• Q4 points issuance down 8.4% and
points redeemed up 21%
• Impact of recession on Groupe
Auchan performance
2014
• In discussion with new grocery
partner; unlikely to launch this year
• Impact to Nectar Italia: $45M Gross
Billings, $8M Adjusted EBITDA, and
$13M FCF factored in guidance
2015
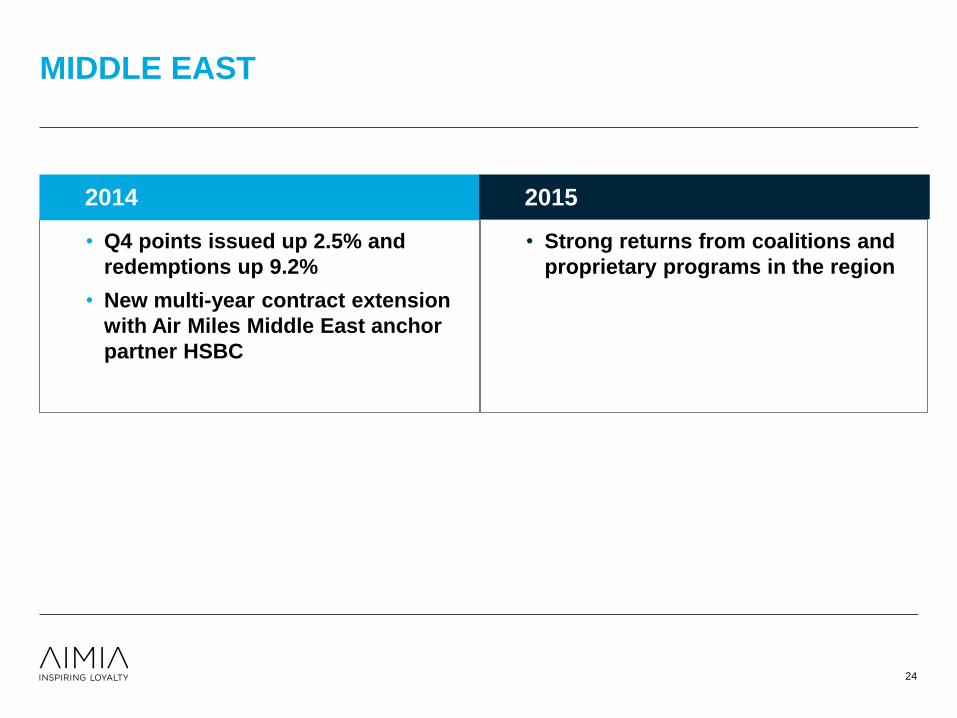
MIDDLE EAST
24
• Q4 points issued up 2.5% and
redemptions up 9.2%
• New multi-year contract extension
with Air Miles Middle East anchor
partner HSBC
2014
• Strong returns from coalitions and
proprietary programs in the region
2015

EMEA 2015 OUTLOOK
25
• Continued sales momentum in proprietary loyalty and analytics
• Delivering Aimia Loyalty Platform and Aimia Campaign Product
pushing up global product costs slightly
• Industry and macroeconomic factors ongoing in Italy and UK
A return to growth in
2016
$24.0
$ (16.2)
2013 2014
$94.0 $76.1
$ (3.0)
$73.0
$(3.0)
EMEA excluding the one-
time 2013 VAT benefit and
product development costs
Global product
development costs
$24.0 million related
to VAT judgment
$92.4

US & APAC
26
• Realigned and refocused for growth
• Momentum in proprietary and platforms with
sales of ACP and ALP platforms in US and Asia
Pacific
• Continued investment in coalition development
across the region
Measured investments to
pursue growth
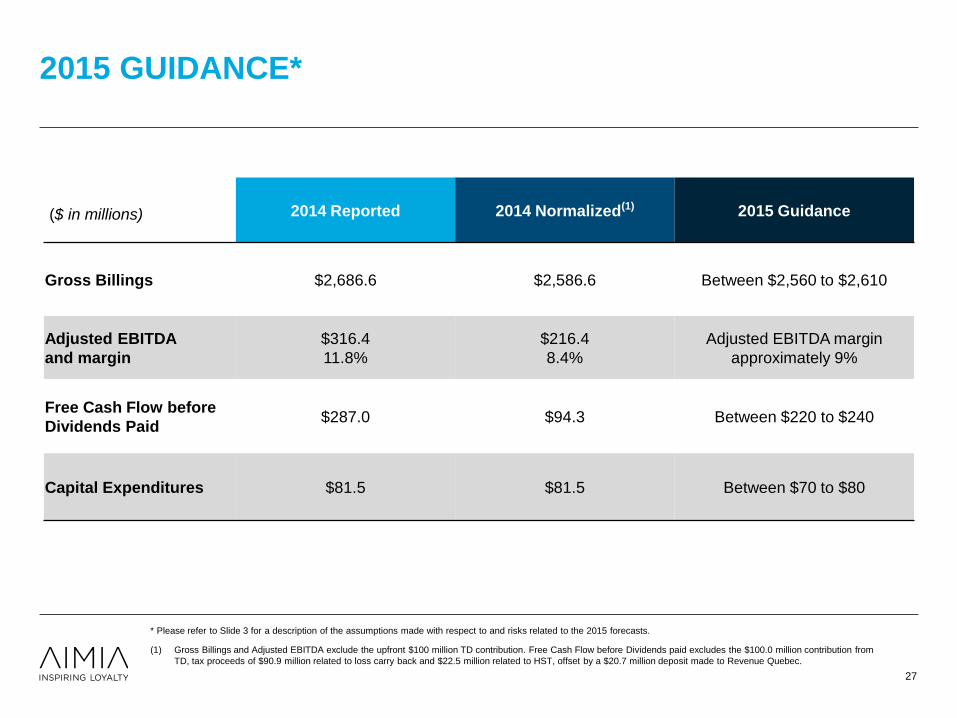
2015 GUIDANCE*
27
($ in millions)
2014 Reported 2014 Normalized(1) 2015 Guidance
Gross Billings $2,686.6 $2,586.6 Between $2,560 to $2,610
Adjusted EBITDA
and margin
$316.4
11.8%
$216.4
8.4%
Adjusted EBITDA margin
approximately 9%
Free Cash Flow before
Dividends Paid $287.0 $94.3 Between $220 to $240
Capital Expenditures $81.5 $81.5 Between $70 to $80
* Please refer to Slide 3 for a description of the assumptions made with respect to and risks related to the 2015 forecasts.
(1) Gross Billings and Adjusted EBITDA exclude the upfront $100 million TD contribution. Free Cash Flow before Dividends paid excludes the $100.0 million contribution from
TD, tax proceeds of $90.9 million related to loss carry back and $22.5 million related to HST, offset by a $20.7 million deposit made to Revenue Quebec.

2015 OUTLOOK ($ IN MILLIONS)
28
US &
APAC
EMEA
Canada
Breakage
Impact PLM Stock
Based
Compensation
Corporate
Consolidated +60.1% growth
Consolidated: +17.0% growth; 12.1% in c.c.(1)
Canada: +22.4%; EMEA: +12.7%; -1.2% in c.c.(1)
US & APAC: +5.2%; 0.0% in c.c.(1)
Non-recurring items as footnoted for each metric
(1)
(1)
(2)
(1) Gross Billings and Adjusted EBITDA excluding $100.0 million upfront contribution from TD.
(2) Free Cash Flow excluding $100.0 million upfront contribution from TD, $90.9 million refund related to prior year tax loss carry back, $22.5 million refund related to HST on prior
year payment to CIBC, offset by $20.7 million deposit made to Revenue Quebec.
$2,586.6
2014 2015
Gross Billings
$2,560 - $2,610
$2,686.6
$216.4
2014 2015
Adjusted EBITDA
8.4%
Margin
~9% Margin
$316.4
$94.3
2014 2015
Free Cash Flow
$220 - $240
$287.0
~2.5x
2014
Excluding non-recurring items
* Please refer to Slide 3 for a description of the assumptions made with respect to and risks related to the 2015 forecasts.

THANK YOU

APPENDIX

2014 NORMALIZED
31
n.m. means not meaningful.
(1) Adjustment for the $100.0 million TD contribution received in the first quarter of 2014.
(2) Adjustment for the $100.0 million TD contribution, tax proceeds of $90.9 million related to loss carry back and $22.5 million related to HST, offset by a $20.7
million deposit made to Revenue Quebec.
(in millions CAD)
2014
As Reported Adjustments
2014
Normalized
Consolidated Gross Billings 2,686.6 (100.0)(1) 2,586.6
Consolidated Adjusted EBITDA
and margin
316.4
11.8% (100.0)(1)
216.4
8.4%
Free Cash Flow before Dividends Paid 287.0 (192.7)(2) 94.3
Canada Gross Billings 1,540.2 (100.0)(1)
1,440.2
Canada Adjusted EBITDA
and margin
323.5
21.0%
(100.0)(1)
223.5
15.5%
EMEA Gross Billings 772.2 - 772.2
EMEA Adjusted EBITDA
and margin
76.1
9.9% -
76.1
9.9%
US & APAC Gross Billings 375.1 - 375.1
US & APAC Adjusted EBITDA
and margin
(1.5)
n.m. -
(1.5)
n.m.

ATTRACTIVE DIVIDEND RECORD
32
$0.125 $0.150 $0.160 $0.170 $0.180
$0.00
$0.02
$0.04
$0.06
$0.08
$0.10
$0.12
$0.14
$0.16
$0.18
$0.20
2010 2011 2012 2013 2014
(1) Quarterly dividends paid in June of each year.
Quarterly Dividends Per Common Share(1)

Aeroplan
Financial Sector
Gross Billings*
FY 2014
+20.5%
• Active co-branded credit
cards base broadly stable
• Net new cards acquired
taking AMEX base up by
almost 40% YoY
• Strong momentum at AMEX
with new converters up
significantly YoY
FINANCIAL SERVICES MOMENTUM FY 2014
33
Spend Per Card Active Card Base
Program Conversions
• Higher spend per card
among tenured cardholders
• Yield reflecting impact of
higher contractual price
agreed in 2013, partly offset
by promotional miles issued
Price Per Mile $
* Gross Billings from the Sale of Loyalty Units excluding the $100.0 million TD contribution.

AEROPLAN ACCUMULATION & REDEMPTION
34
2.1%
15.4%
17.9%
14.8%
10.5%
2.1%
6.9%
10.4%
8.7%
3.6%
Q4/13 Q1/14 Q2/14 Q3/14 Q4/14
-8.9%
2.9% 0.5%
11.0%
15.7%
9.6% 8.2%
19.8%
29.4%
Q4/13 Q1/14 Q2/14 Q3/14 Q4/14
Accumulation with
promotional miles Redemption Accumulation without
promotional miles
ACCUMULATION PATTERN REDEMPTION PATTERN
Redemption at 2013
average miles redeemed
per travel reward

FY 2014 CONSOLIDATED GROSS BILLINGS GROWTH ($ IN MILLIONS)
35
US &
APAC
EMEA
Canada
Breakage
Impact PLM Stock
Based
Compensation
Corporate
Consolidated +60.1% growth
Consolidated: +17.0% growth; 12.1% in c.c.(1)
Canada: +22.4%; EMEA: +12.7%; -1.2% in c.c.(1)
US & APAC: +5.2%; 0.0% in c.c.(1)
$2,686.6
$100.0 $140.1 $68.1
$12.4
$2,366.4
2013 Reported 2014 Reported
TD
Contribution
(Canada)
Canada
EMEA US & APAC

FY 2014 CONSOLIDATED AEBITDA GROWTH ($ IN MILLIONS)
36
$316.4
($24.0)
($37.4)
($76.8)
($13.0) ($4.3)
$200.0
$100.0
$19.1 $2.3
$150.5
2013Reported
2014Reported
Conveyance
items
(Canada)
VAT
impact
(EMEA)
TD
Contribution
Impact of
promotional
miles on
change in
FRC Canada Product
development
costs
EMEA US &
APAC
Corporate
2013
Canada
EMEA

FREE CASH FLOW* ($ IN MILLIONS)
37
* Free Cash Flow before Dividends Paid (Common and Preferred).
(1) Harmonized sales tax of $22.5 million made in the fourth quarter of 2013 related to the CIBC conveyance payment.
(2) Includes tax proceeds of $90.9 million related to loss carry back and $22.5 million related to HST, offset by a $20.7 million deposit made to Revenue Quebec.
CIBC
Payment
HST(1)
TD
Contribution
Tax
Refunds(2)
$268.1
$150.0
$22.5
$95.6
FY 2013Reported
FY 2013Normalized
$94.3
($100.0)
($92.7) $287.0
FY 2014Reported
FY 2014Normalized

Q4 2014 GROSS BILLINGS GROWTH BY REGION ($ IN MILLIONS)
38
Canada EMEA US & APAC
$688.1(1) ($0.8) $26.7 $4.3 $658.0
2013 Reported 2014 Reported
(1) Variance related to intercompany elimination of $(0.1) million which has been excluded from the bridge.
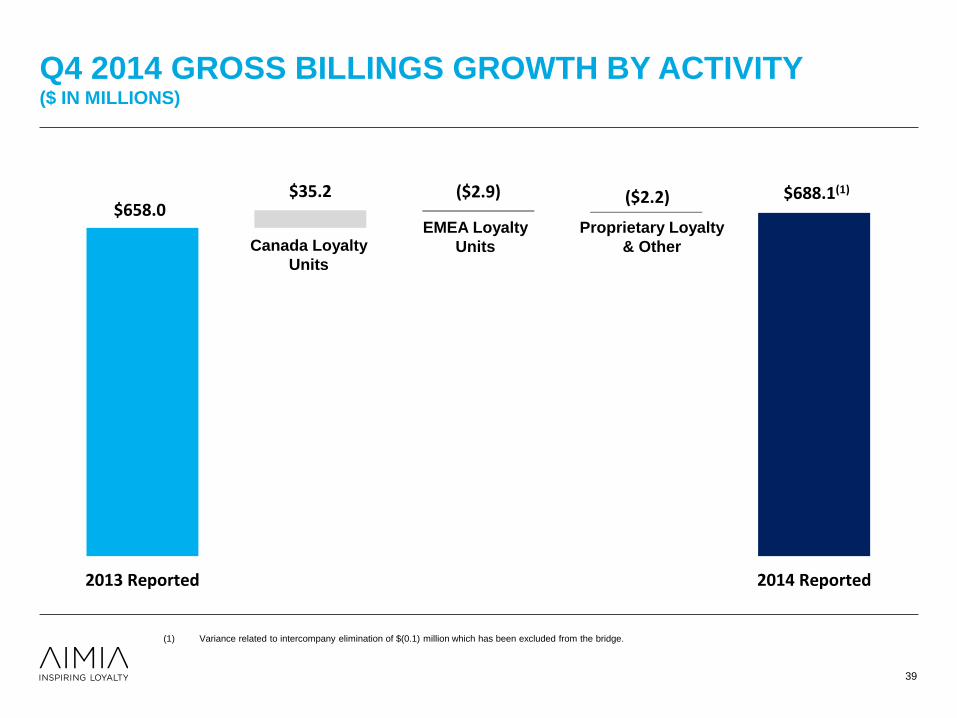
Q4 2014 GROSS BILLINGS GROWTH BY ACTIVITY ($ IN MILLIONS)
39
Consolidated Loyalty Units: +12.7% growth; +8.9% in c.c.(1)
Canada Loyalty Units: +17.5% growth;
EMEA Loyalty Units: +4.1% growth; (6.6%) in c.c.(1)
Proprietary Loyalty & Other: +2.0% growth; (2.3%) in c.c.(1)
(1) Variance related to intercompany elimination of $(0.1) million which has been excluded from the bridge.
$688.1(1) ($2.9) ($2.2) $35.2 $658.0
2013 Reported 2014 Reported
Canada Loyalty
Units
EMEA Loyalty
Units
Proprietary Loyalty
& Other

Q4 2014 CONSOLIDATED AEBITDA ($ IN MILLIONS)
40
US &
APAC
EMEA
Canada
Breakage
Impact PLM Stock
Based
Compensation
Corporate
$60.0
($35.2)
($9.5)
$200.0
$8.7 $0.2 $0.2
$6.7
($111.1)
2013Reported
2014Reported
CIBC Payment
& Card Migration
Provision
Canada EMEA
US &
APAC Distributions from
equity-accounted
investments
Corporate Stock
based
compensation

Q4 2014 FINANCIAL HIGHLIGHTS – CANADA
41
(1) Before depreciation and amortization.
(2) Includes the impact of the CIBC Payment of $150.0 million and the card migration of $50.0 million which were recorded in the fourth quarter of 2013.
n.m. means not meaningful.
Three months ended December 31,
(in millions of Canadian dollars) 2014 2013 Variance
Reported Reported %
Gross Billings
Aeroplan 334.0 300.9 11.0%
Proprietary Loyalty 66.6 68.1 -2.2%
Intercompany eliminations (26.8) (21.9) n.m.
373.8 347.1 7.7%
Total revenue
Aeroplan 271.6 236.9 14.6%
Proprietary Loyalty 66.5 67.9 -2.1%
Intercompany eliminations (26.8) (21.9) n.m.
311.3 282.9 10.0%
Gross margin(1)
Aeroplan 78.2 105.8 -26.1%
Proprietary Loyalty 20.8 21.7 -4.1%
Intercompany eliminations (0.2) (0.3) n.m.
98.8 127.2 -22.3%
Operating income (loss)(2)
Aeroplan (15.9) (170.1) n.m.
Proprietary Loyalty 2.5 (2.5) n.m.
(13.4) (172.6) n.m.
Adjusted EBITDA(2)
Adjusted EBITDA margin
(as a % of Gross Billings) 13.3% n.m. n.m.
Aeroplan 43.0 -115.8 n.m.
Proprietary Loyalty 6.9 0.9 n.m.
49.9 -114.9 n.m.

FY 2014 FINANCIAL HIGHLIGHTS – CANADA
42
(1) Before depreciation and amortization.
(2) Includes the $100.0 million upfront TD contribution in the first quarter of 2014.
(3) Includes the impact of the CIBC Payment of $150.0 million and the card migration of $50.0 million which were recorded in the fourth quarter of 2013.
(4) Excludes the $100 million upfront contribution received from TD in the first quarter of 2014.
n.m. means not meaningful.
Year ended December 31,
(in millions of Canadian dollars) 2014 2013 Variance
Reported Reported %
Gross Billings
Aeroplan(2) 1,384.3 1,133.2 22.2%
Proprietary Loyalty 236.2 247.3 -4.5%
Intercompany eliminations (80.3) (80.4) n.m.
1,540.2 1,300.1 18.5%
Total revenue
Aeroplan 1,133.4 440.9 n.m.%
Proprietary Loyalty 236.1 246.9 -4.4%
Intercompany eliminations (80.3) (80.4) n.m.
1,289.2 607.4 n.m.%
Gross margin(1)
Aeroplan 346.9 (162.6) n.m.
Proprietary Loyalty 77.0 82.3 -6.4%
Intercompany eliminations (1.1) (1.4) n.m.
422.8 (81.7) n.m.
Operating income (loss)(3)
Aeroplan 21.0 (623.0) n.m.
Proprietary Loyalty 5.8 3.7 56.8%
26.8 (619.3) n.m.
Adjusted EBITDA(3)
Adjusted EBITDA margin
(as a % of Gross Billings) 21.0% 10.6%
Aeroplan(2) 302.5 120.7 n.m.%
Proprietary Loyalty 21.0 17.0 23.5%
323.5 137.7 n.m.%
Adjusted EBITDA margin
(as a % of Gross Billings)(4)
15.5%* 10.6%

AEROPLAN REVENUE
43
($ in millions) Q4 2014 Q4 2013 FY 2014 FY 2013
Miles revenue 233.5 200.8 967.3 900.3
Breakage revenue 28.7 24.6 118.5 (506.8)(1)
Other 9.4 11.5 47.6 47.4
Total Revenue 271.6 236.9 1,133.4 440.9
(1) Includes the non-comparable unfavourable impact of the change in the Breakage estimate in the Aeroplan program which
occurred in the second quarter of 2013 of $617.0 million.

30.3%
21.6% 10.6%
13.4%
24.1%
GROSS BILLINGS FROM SALE OF LOYALTY UNITS BY
MAJOR PARTNER
44
14.9%
20.6%
19.8%
10.7%
13.8%
20.2%
AMEX
CIBC
TD
Air
Canada
Other CIBC
Sainsbury’s
Air Canada
Other
Q4 2013
$464.7M Q4 2014
$497.0M
Sainsbury’s
AMEX

32.1%
19.2% 10.2%
14.0%
24.5%
GROSS BILLINGS FROM SALE OF LOYALTY UNITS BY
MAJOR PARTNER
45
14.7%
19.4%
19.3% 11.9%
13.1%
21.6%
AMEX
CIBC
Sainsbury’s
TD
Air
Canada
Other
CIBC
Sainsbury’s AMEX
Air
Canada
Other
FY 2013
$1,711.4M FY 2014
$1,909.2M*
*Excludes the $100.0 million upfront contribution received from TD in the first quarter of 2014.

BALANCE SHEET AT DECEMBER 31, 2014
AVAILABLE CASH
$ millions
December
31, 2014
Cash and cash equivalents 567.6
Restricted cash 28.8
Short-term investments 51.3
Long-term investments in bonds 258.0
Cash and Investments 905.7
Aeroplan reserves (300.0)
Other loyalty programs reserves (137.4)
Restricted cash (28.8)
Available cash 439.5
DEBT
$ millions
Annual
Interest
Rate
Maturing
December
31, 2014
Revolving Facility(1) Apr. 23, 2018 -
Senior Secured Notes 3 6.95% Jan. 26, 2017 200.0
Senior Secured Notes 4 5.60% May 17, 2019 250.0
Senior Secured Notes 5 4.35% Jan. 22, 2018 200.0
Total Long-Term Debt 650.0
Less Current Portion (0.0)
Long-Term Debt 650.0
46
Preferred Shares (Series 1) 6.50%(2) Perpetual 172.5
(1) As of December 31, 2014, Aimia held a $300.0 million revolving credit facility maturing on April 23, 2018. Interest rates on this facility are tied to the Corporation’s credit ratings and
range between Canadian prime rate plus 0.20% to 1.50% and Bankers’ Acceptance and LIBOR rates plus 1.20% to 2.50%. As of December 31, 2014, Aimia also had irrevocable
outstanding letters of credit in the aggregate amount of $54.4 million which reduces the available credit under this facility.
(2) Annual dividend rate is subject to a rate reset on March 31, 2015 and every 5 years thereafter.
(3) Annual dividend rate is subject to a rate reset on March 31, 2019 and every 5 years thereafter.
Preferred shares at Dec 31, 2014
Preferred Shares (Series 3) 6.25%(3) Perpetual 150.0

FOREIGN EXCHANGE RATES
47
Q4 2014 Q4 2013 % Change
Average
Quarter
Average
YTD
Period
End
Average
Quarter
Average
YTD
Period
End
Average
Quarter
Average
YTD
Period
End
£ to $ 1.7975 1.8182 1.8058 1.6975 1.6111 1.7633 5.9% 12.9% 2.4%
AED to $ 0.3091 0.3005 0.3165 0.2855 0.2803 0.2911 8.3% 7.2% 8.7%
USD to $ 1.1356 1.1039 1.1627 1.0488 1.0298 1.0694 8.3% 7.2% 8.7%
€ to $ 1.4180 1.4664 1.4132 1.4273 1.3677 1.4722 -0.7% 7.2% -4.0%