Embed Size (px)
Citation preview

Q1 2016 HIGHLIGHTS
May 12, 2016
Forward-looking statements are included in this presentation. These forward-looking statements are typically identified by the use of terms such as “outlook”, “guidance”, “target”,
“forecast”, “assumption” and other similar expressions or future or conditional terms such as "anticipate", "believe", "could", "estimate", "expect", "intend", "may", "plan", "predict",
"project", "will", "would", and “should”. Such statements may involve but are not limited to comments with respect to strategies, expectations, planned operations or future actions.
Forward-looking statements, by their nature, are based on assumptions and are subject to important risks and uncertainties. Any forecasts, predictions or forward-looking statements
cannot be relied upon due to, among other things, changing external events and general uncertainties of the business and its corporate structure. Results indicated in forward-looking
statements may differ materially from actual results for a number of reasons, including without limitation, dependency on significant Accumulation Partners and clients, failure to
safeguard databases, cyber security and consumer privacy, changes to the Aeroplan Program, reliance on Redemption Partners, conflicts of interest, greater than expected air
redemptions for rewards, regulatory matters, retail market/economic conditions, industry competition, Air Canada liquidity issues, Air Canada or travel industry disruptions, airline industry
changes and increased airline costs, supply and capacity costs, unfunded future redemption costs, changes to coalition loyalty programs, seasonal nature of the business, other factors
and prior performance, foreign operations, legal proceedings, reliance on key personnel, labour relations, pension liability, technological disruptions, inability to use third-party software
and outsourcing, failure to protect intellectual property rights, interest rate and currency fluctuations (including currency risk or our foreign operations which are denominated in a currency
other than the Canadian dollar, mainly pound sterling, and subject to fluctuations as a result of foreign exchange rate variations), leverage and restrictive covenants in current and future
indebtedness, uncertainty of dividend payments, managing growth, credit ratings, audit by tax authorities, as well as the other factors identified throughout Aimia’s MD&A and its other
public disclosure records on file with the Canadian securities regulatory authorities.
In particular, slides 17 and 21 of this presentation contain certain forward-looking statements with respect to certain financial metrics in 2016. Aimia made a number of general economic
and market assumptions in making these statements, including assumptions regarding currencies, the performance of the economies in which the Corporation operates and market
competition and tax laws applicable to the Corporation’s operations. The Corporation cautions that the assumptions used to make these statements with respect to 2016, although
reasonable at the time they were made, may prove to be incorrect or inaccurate. In addition, these statements do not reflect the potential impact of any non-recurring or other special
items or of any new material commercial agreements, dispositions, mergers, acquisitions, other business combinations or transactions that may be announced or that may occur after
May 12, 2016. The financial impact of these transactions and non-recurring and other special items can be complex and depends on the facts particular to each of them. We therefore
cannot describe the expected impact in a meaningful way or in the same way we present known risks affecting our business. Accordingly, our actual results could differ materially from
the statements made on slides 17 and 21 of this presentation.
The forward-looking statements contained herein represent the Corporation’s expectations as of May 12, 2016 and are subject to change. However, Aimia disclaims any intention or
obligation to update or revise any forward-looking statements whether as a result of new information, future events or otherwise, except as required under applicable securities
regulations.
This presentation contains both IFRS and non-GAAP financial measures. Non-GAAP financial measures are defined and reconciled to the most comparable IFRS measures, if
applicable, in our MD&A. See caution regarding Non-GAAP financial measures on slide 4.
FORWARD-LOOKING AND CAUTIONARY STATEMENTS
3
Aimia uses the following non-GAAP financial measures which it believes provides investors and analysts with additional information to better understand results as well as assess its potential. GAAP means
generally accepted accounting principles in Canada and represents International Financial Reporting Standards (“IFRS”). For a reconciliation of non-GAAP financial measures to the most comparable GAAP
measure, please refer to the section entitled “Performance Indicators (including certain non-GAAP financial measures)” in our Management Discussion & Analysis for the three months ended March 31, 2016.
Adjusted EBITDA
Adjusted EBITDA is not a measurement based on GAAP, is not considered an alternative to operating income or net earnings in measuring performance, and is not comparable to similar measures used by other
issuers. We do not believe that Adjusted EBITDA has an appropriate directly comparable GAAP measure. As an alternative, we do however provide a reconciliation to operating income in our MD&A. Adjusted
EBITDA is used by management to evaluate performance, and to measure compliance with debt covenants. Management believes Adjusted EBITDA assists investors in comparing the Corporation’s performance
on a consistent basis without regard to depreciation and amortization and impairment charges, which are non-cash in nature and can vary significantly depending on accounting methods and non-operating factors
such as historical cost. Adjusted EBITDA is operating income adjusted to exclude depreciation, amortization and impairment charges, as well as adjusted for certain factors particular to the business, such as
changes in deferred revenue and Future Redemption Costs. Adjusted EBITDA also includes distributions and dividends received or receivable from equity-accounted investments. Adjusted EBITDA should not be
used as an exclusive measure of cash flow because it does not account for the impact of working capital growth, capital expenditures, debt repayments and other sources and uses of cash, which are disclosed in
the statements of cash flows.
Adjusted Net Earnings
Adjusted Net Earnings is not a measurement based on GAAP, is not considered an alternative to net earnings in measuring profitability, and is not comparable to similar measures used by other issuers. Adjusted
Net Earnings provides a measurement of profitability calculated on a basis consistent with Adjusted EBITDA. Net earnings attributable to equity holders of the Corporation are adjusted to exclude Amortization of
Accumulation Partners’ contracts, customer relationships and technology, share of net earnings (loss) of equity accounted investments and impairment charges. Adjusted Net Earnings includes the Change in
deferred revenue and Change in Future Redemption Costs, net of the income tax effect and non-controlling interest effect (where applicable) on these items at an entity level basis. Adjusted Net Earnings also
includes distributions and dividends received or receivable from equity-accounted investments.
Adjusted Net Earnings per Common Share
Adjusted Net Earnings per Common Share is not a measurement based on GAAP, is not considered an alternative to Net Earnings per Common Share in measuring profitability per Common Share and is not
comparable to similar measures used by other issuers. Adjusted Net Earnings per Common Share provides a measurement of profitability per Common Share on a basis consistent with Adjusted Net Earnings.
Calculated as Adjusted Net Earnings less dividends declared on preferred shares divided by the number of weighted average number of basic and diluted common shares. Free Cash Flow Free Cash Flow is not a measurement based on GAAP and is unlikely to be comparable to similar measures used by other issuers. Management believes Free cash flow (“Free Cash Flow”) provides a consistent and comparable measurement of cash generated from operations and is used as an indicator of financial strength and performance. Free Cash Flow is defined as cash flows from operating activities, as reported in accordance with GAAP, less: (a) total capital expenditures as reported in accordance with GAAP; and (b) dividends paid.
Free Cash Flow before Dividends Paid and Free Cash Flow before Dividends Paid per Common Share
Free Cash Flow before Dividends Paid are non-GAAP measures and are not comparable to similar measures used by other issuers. They are used in order to provide a consistent and comparable measurement
of cash generated from operations and used as indicators of financial strength and performance. Free Cash Flow before Dividends Paid is defined as cash flows from operating activities as reported in accordance
with GAAP, less capital expenditures as reported in accordance with GAAP. Free Cash Flow before Dividends Paid per Common Share is a measurement of cash flow generated from operations on a per share
basis. It is calculated as follows: Free Cash Flow before dividends paid minus dividends paid on preferred shares and non-controlling interests over the weighted average number of common shares outstanding.
Constant Currency
Because exchange rates are an important factor in understanding period to period comparisons, management believes that the presentation of various financial metrics on a constant currency basis or after giving
effect to foreign exchange translation, in addition to the reported metrics, helps improve the ability to understand operating results and evaluate performance in comparison to prior periods. Constant currency
information compares results between periods as if exchange rates had remained constant over the periods. Constant currency is derived by calculating current-year results using prior-year foreign currency
exchange rates. Results calculated on a constant currency basis should be considered in addition to, not as a substitute for, results reported in accordance with GAAP and may not be comparable to similarly titled
measures used by other companies.
NON-GAAP FINANCIAL MEASURES
4
RUPERT DUCHESNE GROUP CHIEF EXECUTIVE
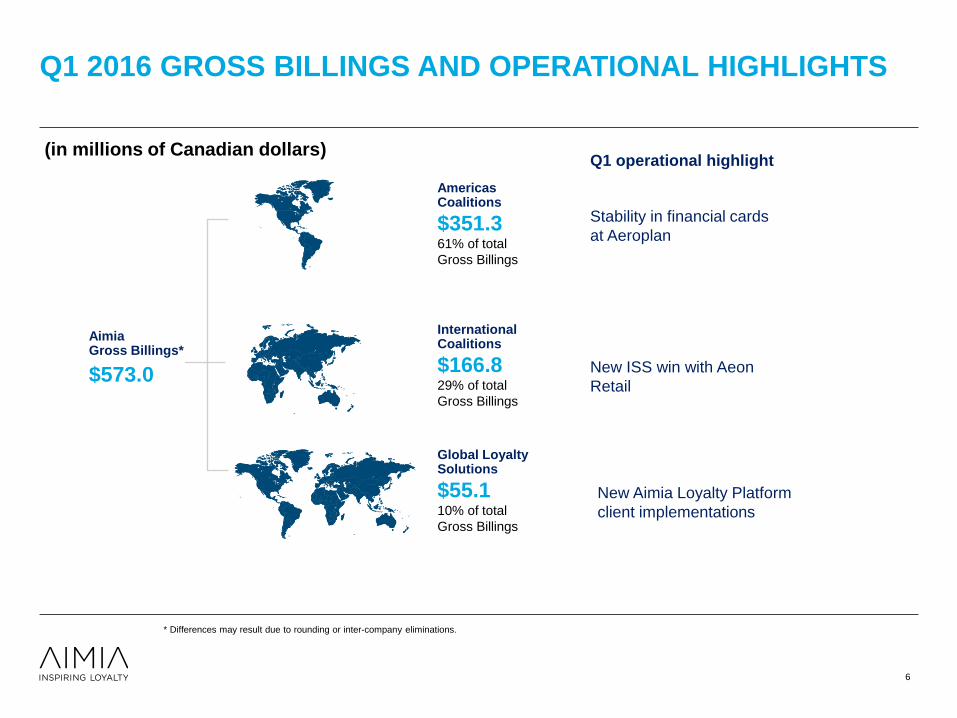
Q1 2016 GROSS BILLINGS AND OPERATIONAL HIGHLIGHTS
(in millions of Canadian dollars)
Aimia Gross Billings*
$573.0
Americas Coalitions
$351.3 61% of total
Gross Billings
International Coalitions
$166.8 29% of total
Gross Billings
Global Loyalty Solutions
$55.1 10% of total
Gross Billings
6
New Aimia Loyalty Platform
client implementations
Stability in financial cards
at Aeroplan
New ISS win with Aeon
Retail
Q1 operational highlight
* Differences may result due to rounding or inter-company eliminations.
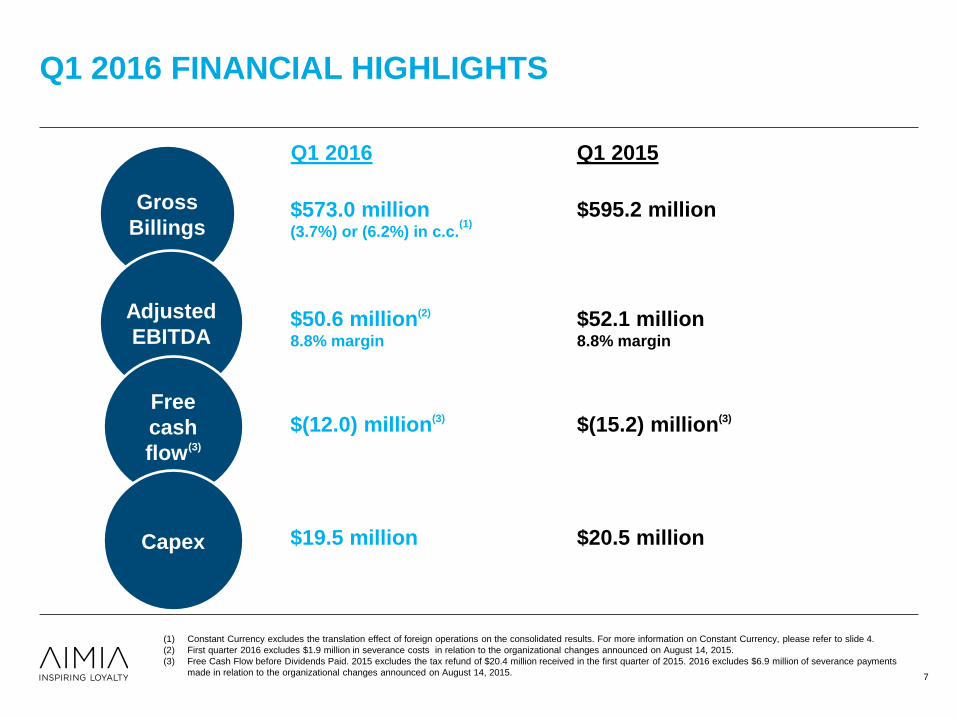
Q1 2016 FINANCIAL HIGHLIGHTS
(1) Constant Currency excludes the translation effect of foreign operations on the consolidated results. For more information on Constant Currency, please refer to slide 4.
(2) First quarter 2016 excludes $1.9 million in severance costs in relation to the organizational changes announced on August 14, 2015.
(3) Free Cash Flow before Dividends Paid. 2015 excludes the tax refund of $20.4 million received in the first quarter of 2015. 2016 excludes $6.9 million of severance payments
made in relation to the organizational changes announced on August 14, 2015.
7
Gross
Billings
Adjusted
EBITDA
Free
cash
flow(3)
Capex
Q1 2016
$573.0 million (3.7%) or (6.2%) in c.c.
(1)
$50.6 million(2)
8.8% margin
$(12.0) million(3)
$19.5 million
Q1 2015
$595.2 million
$(15.2) million(3)
$20.5 million
$52.1 million
8.8% margin
8
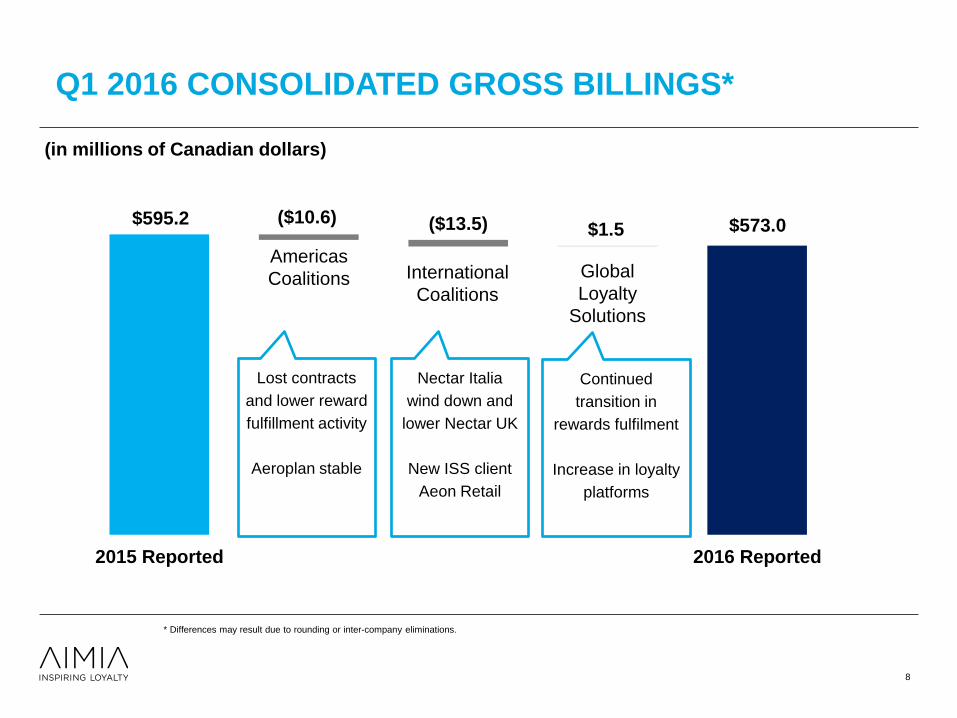
* Differences may result due to rounding or inter-company eliminations.
$573.0 ($10.6) ($13.5) $1.5 $595.2
2015 Reported 2016 Reported
Americas
Coalitions International
Coalitions
Global
Loyalty
Solutions
Q1 2016 CONSOLIDATED GROSS BILLINGS*
Lost contracts
and lower reward
fulfillment activity
Aeroplan stable
Nectar Italia
wind down and
lower Nectar UK
New ISS client
Aeon Retail
Continued
transition in
rewards fulfilment
Increase in loyalty
platforms
(in millions of Canadian dollars)
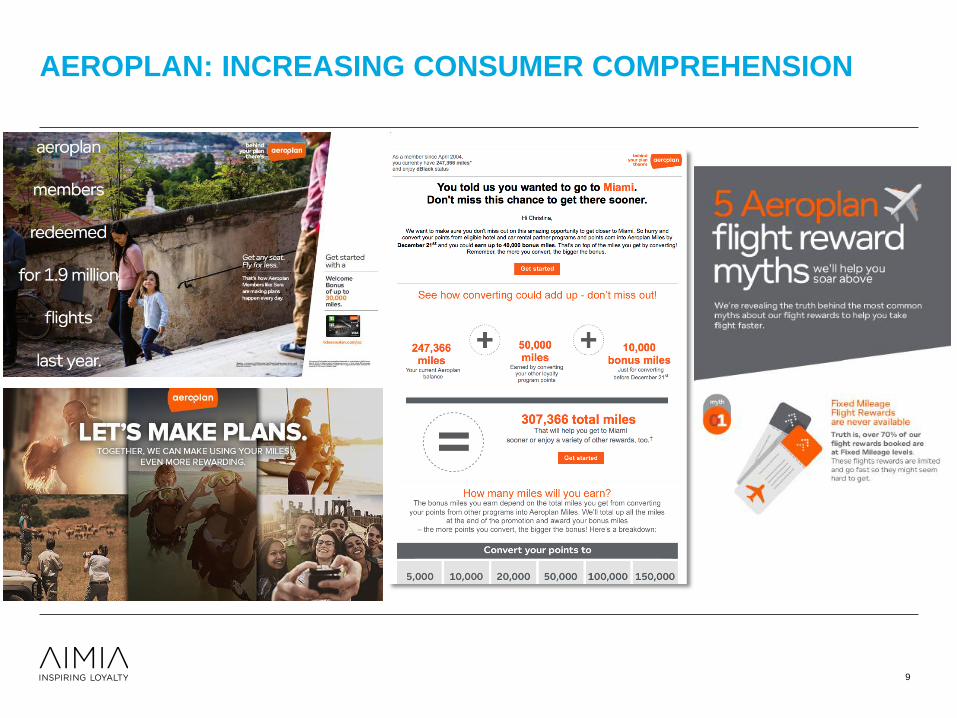
AEROPLAN: INCREASING CONSUMER COMPREHENSION
9
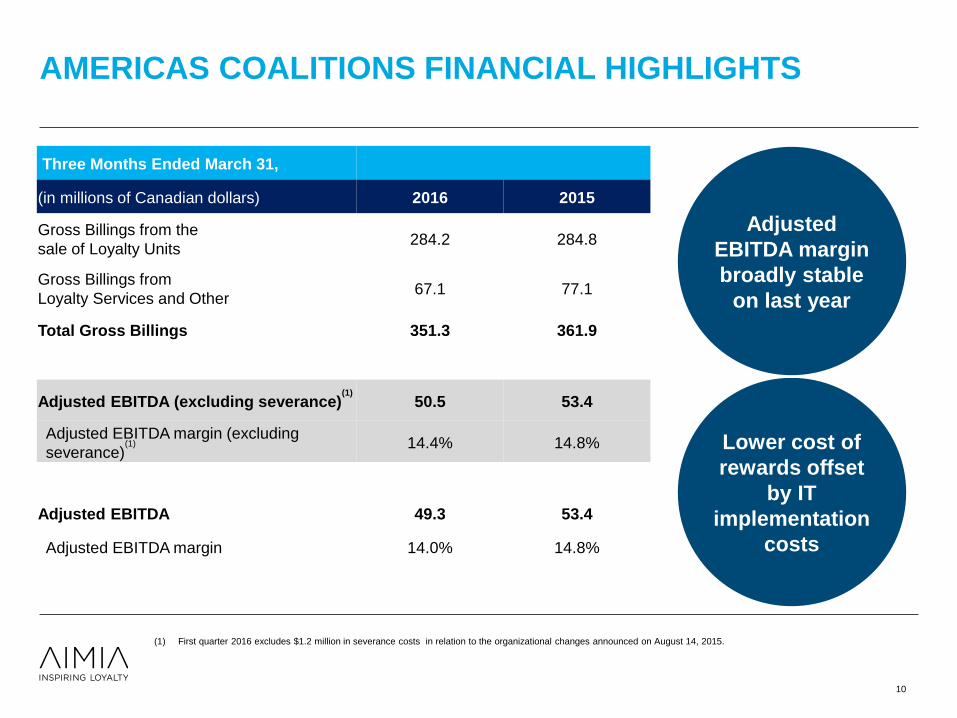
AMERICAS COALITIONS FINANCIAL HIGHLIGHTS
10
Three Months Ended March 31,
(in millions of Canadian dollars) 2016 2015
Gross Billings from the
sale of Loyalty Units 284.2 284.8
Gross Billings from
Loyalty Services and Other 67.1 77.1
Total Gross Billings 351.3 361.9
Adjusted EBITDA (excluding severance)(1)
50.5 53.4
Adjusted EBITDA margin (excluding
severance)(1) 14.4% 14.8%
Adjusted EBITDA 49.3 53.4
Adjusted EBITDA margin 14.0% 14.8%
Lower cost of
rewards offset
by IT
implementation
costs
Adjusted
EBITDA margin
broadly stable
on last year
(1) First quarter 2016 excludes $1.2 million in severance costs in relation to the organizational changes announced on August 14, 2015.
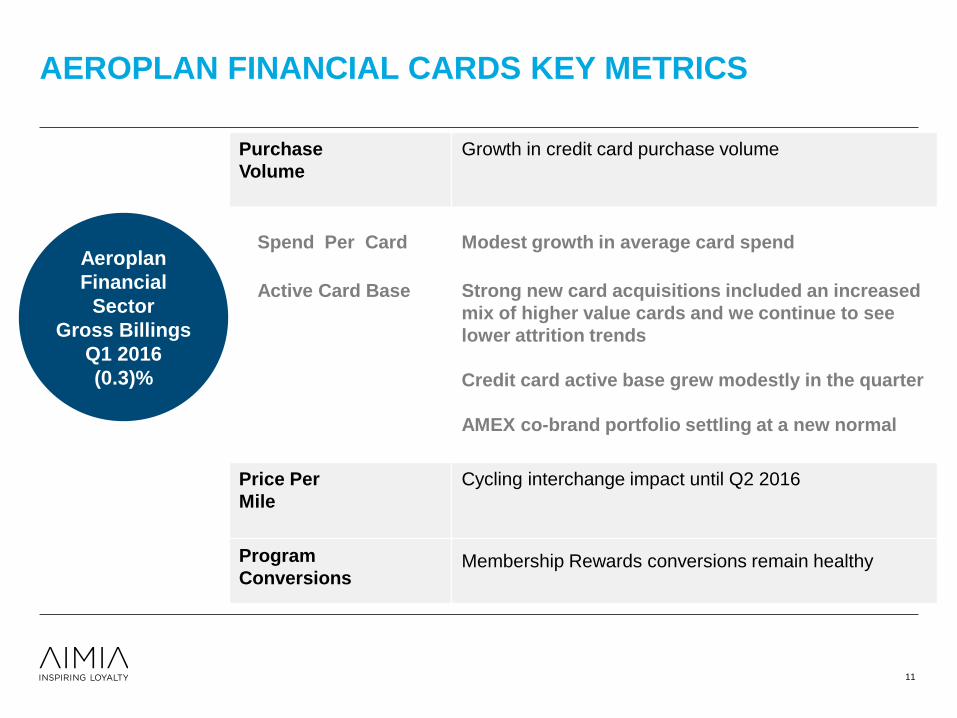
AEROPLAN FINANCIAL CARDS KEY METRICS
11
Purchase
Volume
Growth in credit card purchase volume
Spend Per Card Modest growth in average card spend
Active Card Base Strong new card acquisitions included an increased
mix of higher value cards and we continue to see
lower attrition trends
Credit card active base grew modestly in the quarter
AMEX co-brand portfolio settling at a new normal
Price Per
Mile
Cycling interchange impact until Q2 2016
Program
Conversions Membership Rewards conversions remain healthy
Aeroplan
Financial
Sector
Gross Billings
Q1 2016
(0.3)%

New mobile app Cash-free redemptions
IMPROVING THE CUSTOMER REDEMPTION EXPERIENCE
12
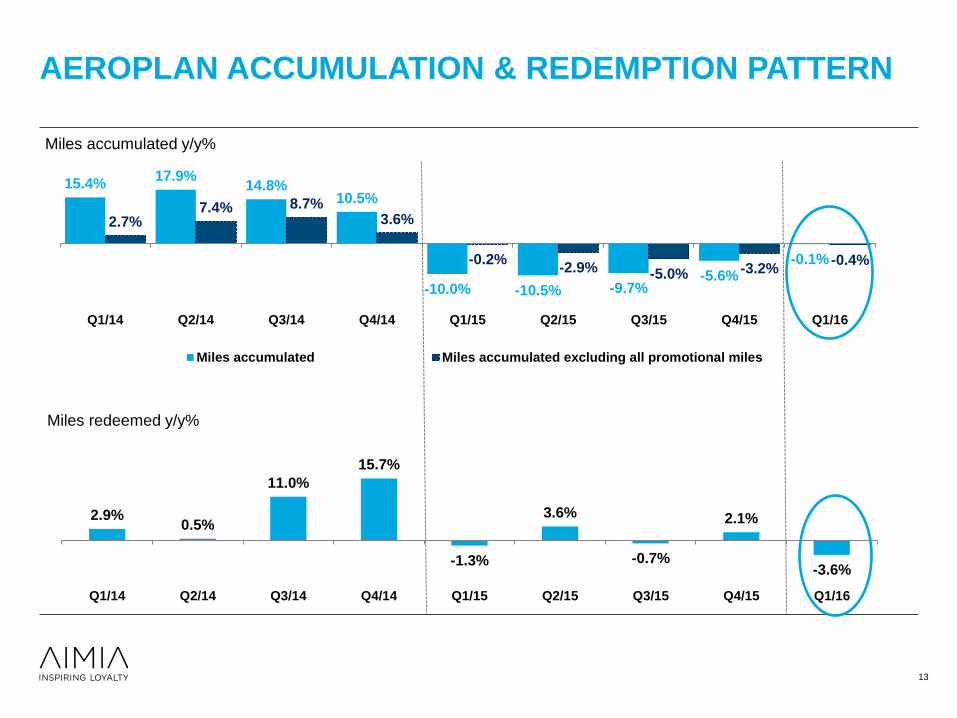
AEROPLAN ACCUMULATION & REDEMPTION PATTERN
13
15.4% 17.9%
14.8% 10.5%
-10.0% -10.5% -9.7% -5.6%
-0.1%
2.7% 7.4% 8.7%
3.6%
-0.2% -2.9% -5.0% -3.2%
-0.4%
Q1/14 Q2/14 Q3/14 Q4/14 Q1/15 Q2/15 Q3/15 Q4/15 Q1/16
Miles accumulated y/y%
Miles accumulated Miles accumulated excluding all promotional miles
2.9% 0.5%
11.0%
15.7%
-1.3%
3.6%
-0.7%
2.1%
-3.6%
Q1/14 Q2/14 Q3/14 Q4/14 Q1/15 Q2/15 Q3/15 Q4/15 Q1/16
Miles redeemed y/y%
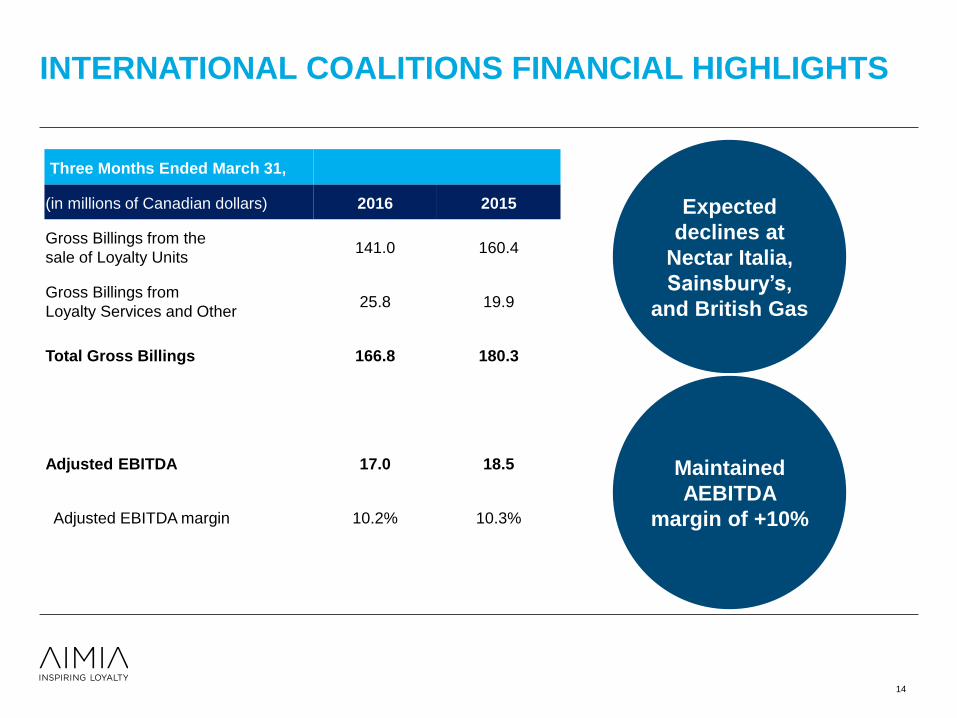
INTERNATIONAL COALITIONS FINANCIAL HIGHLIGHTS
14
Three Months Ended March 31,
(in millions of Canadian dollars) 2016 2015
Gross Billings from the
sale of Loyalty Units 141.0 160.4
Gross Billings from
Loyalty Services and Other 25.8 19.9
Total Gross Billings 166.8 180.3
Adjusted EBITDA 17.0 18.5
Adjusted EBITDA margin 10.2% 10.3%
Expected
declines at
Nectar Italia,
Sainsbury’s,
and British Gas
Maintained
AEBITDA
margin of +10%
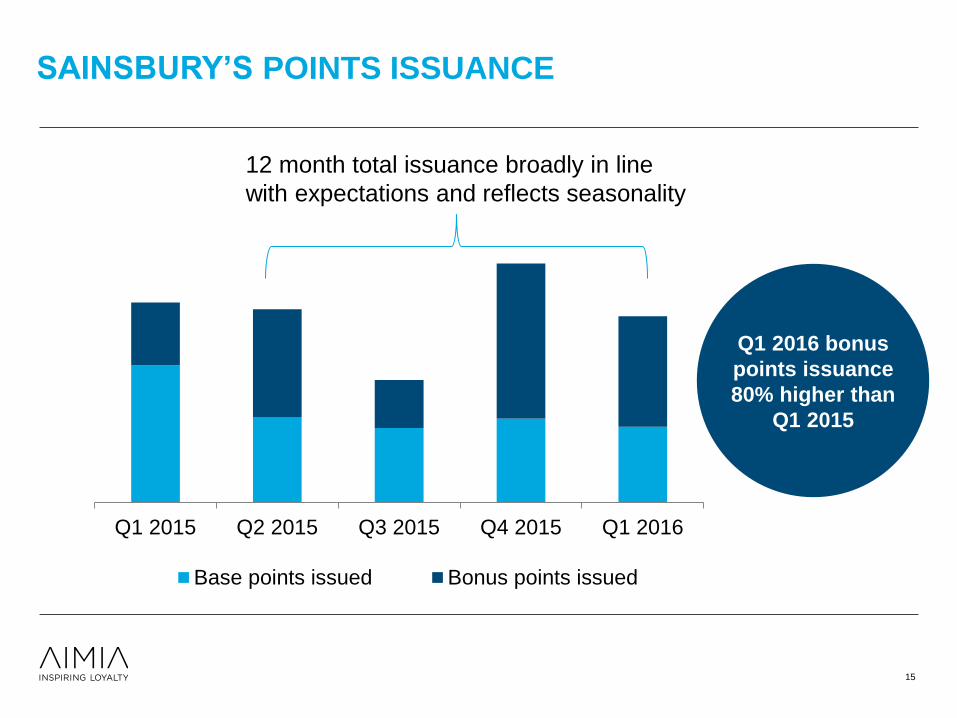
SAINSBURY’S POINTS ISSUANCE
Q1 2015 Q2 2015 Q3 2015 Q4 2015 Q1 2016
Base points issued Bonus points issued
12 month total issuance broadly in line
with expectations and reflects seasonality
Q1 2016 bonus
points issuance
80% higher than
Q1 2015
15
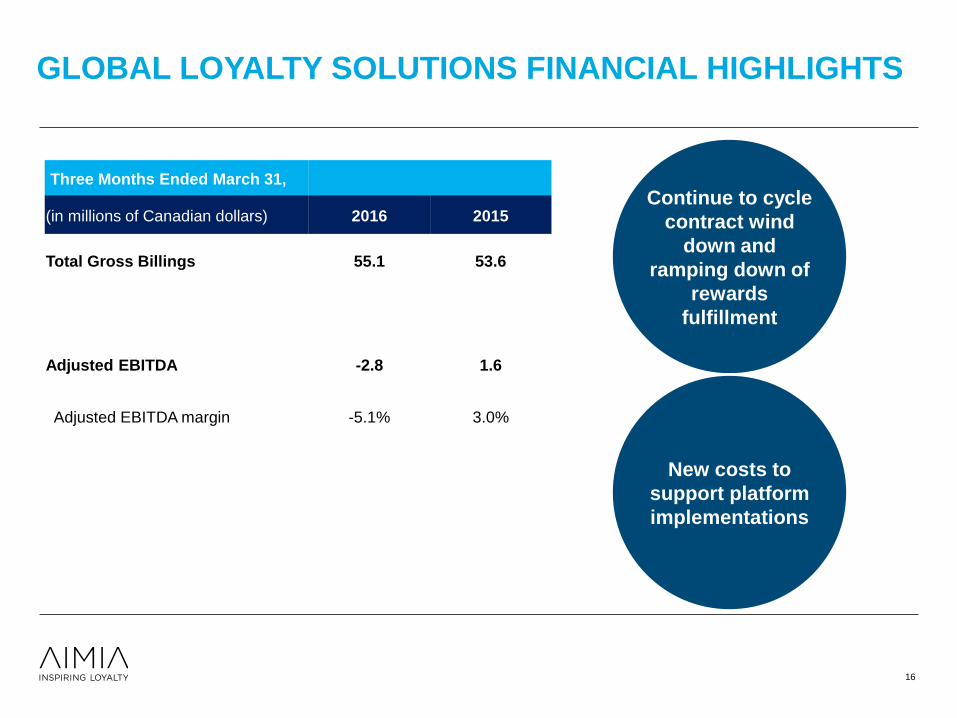
GLOBAL LOYALTY SOLUTIONS FINANCIAL HIGHLIGHTS
Three Months Ended March 31,
(in millions of Canadian dollars) 2016 2015
Total Gross Billings 55.1 53.6
Adjusted EBITDA -2.8 1.6
Adjusted EBITDA margin -5.1% 3.0%
Continue to cycle
contract wind
down and
ramping down of
rewards
fulfillment
New costs to
support platform
implementations
16
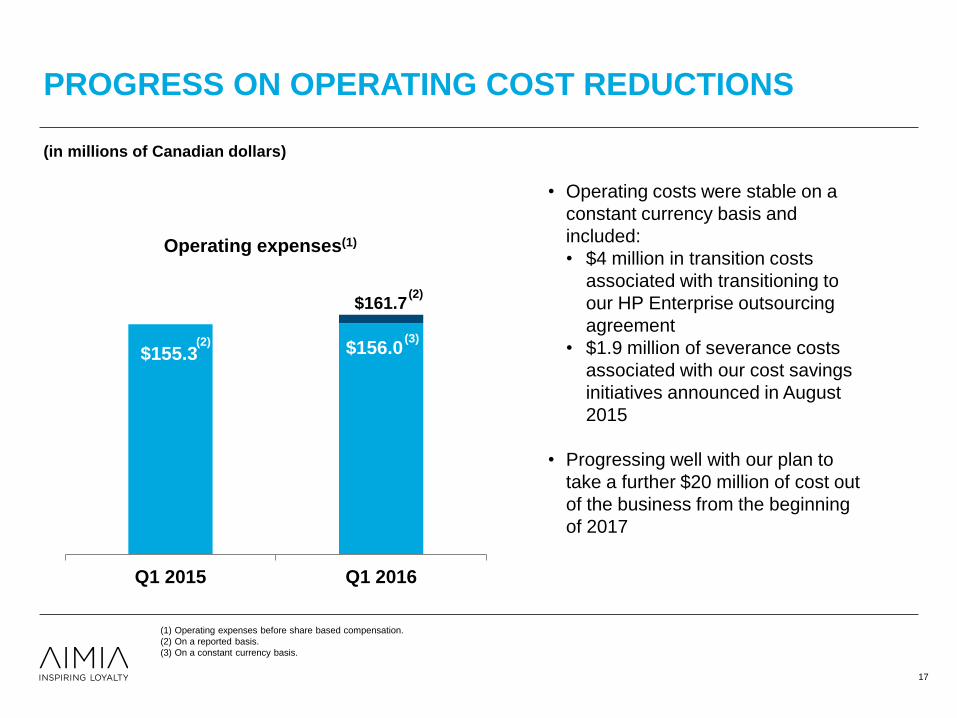
PROGRESS ON OPERATING COST REDUCTIONS
17
• Operating costs were stable on a
constant currency basis and
included:
• $4 million in transition costs
associated with transitioning to
our HP Enterprise outsourcing
agreement
• $1.9 million of severance costs
associated with our cost savings
initiatives announced in August
2015
• Progressing well with our plan to
take a further $20 million of cost out
of the business from the beginning
of 2017
$155.3 $156.0
Q1 2015 Q1 2016
Operating expenses(1)
$161.7
(in millions of Canadian dollars)
(3)
(1) Operating expenses before share based compensation.
(2) On a reported basis.
(3) On a constant currency basis.
(2)
(2)
44%
29%
5%
22%
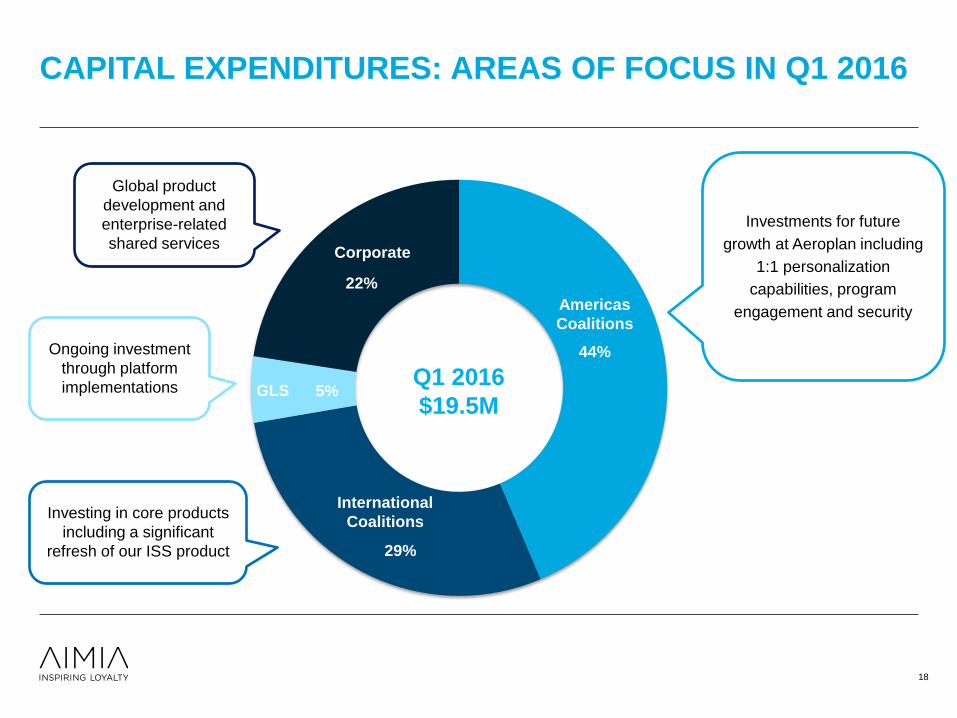
CAPITAL EXPENDITURES: AREAS OF FOCUS IN Q1 2016
18
GLS
Corporate
Q1 2016
$19.5M
International
Coalitions
Americas
Coalitions
Investments for future
growth at Aeroplan including
1:1 personalization
capabilities, program
engagement and security
Investing in core products
including a significant
refresh of our ISS product
Ongoing investment
through platform
implementations
Global product
development and
enterprise-related
shared services
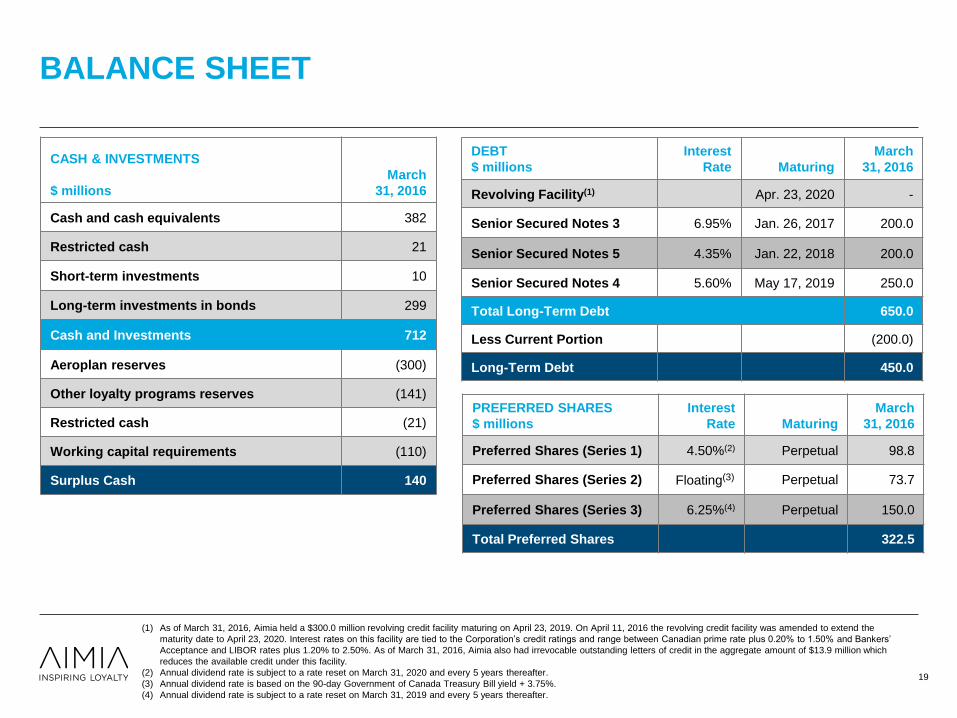
BALANCE SHEET
19
CASH & INVESTMENTS
$ millions
March
31, 2016
Cash and cash equivalents 382
Restricted cash 21
Short-term investments 10
Long-term investments in bonds 299
Cash and Investments 712
Aeroplan reserves (300)
Other loyalty programs reserves (141)
Restricted cash (21)
Working capital requirements (110)
Surplus Cash 140
DEBT
$ millions
Interest
Rate
Maturing
March
31, 2016
Revolving Facility(1) Apr. 23, 2020 -
Senior Secured Notes 3 6.95% Jan. 26, 2017 200.0
Senior Secured Notes 5 4.35% Jan. 22, 2018 200.0
Senior Secured Notes 4 5.60% May 17, 2019 250.0
Total Long-Term Debt 650.0
Less Current Portion (200.0)
Long-Term Debt 450.0
(1) As of March 31, 2016, Aimia held a $300.0 million revolving credit facility maturing on April 23, 2019. On April 11, 2016 the revolving credit facility was amended to extend the
maturity date to April 23, 2020. Interest rates on this facility are tied to the Corporation’s credit ratings and range between Canadian prime rate plus 0.20% to 1.50% and Bankers’
Acceptance and LIBOR rates plus 1.20% to 2.50%. As of March 31, 2016, Aimia also had irrevocable outstanding letters of credit in the aggregate amount of $13.9 million which
reduces the available credit under this facility.
(2) Annual dividend rate is subject to a rate reset on March 31, 2020 and every 5 years thereafter.
(3) Annual dividend rate is based on the 90-day Government of Canada Treasury Bill yield + 3.75%.
(4) Annual dividend rate is subject to a rate reset on March 31, 2019 and every 5 years thereafter.
PREFERRED SHARES
$ millions
Interest
Rate
Maturing
March
31, 2016
Preferred Shares (Series 1) 4.50%(2) Perpetual 98.8
Preferred Shares (Series 2) Floating(3) Perpetual 73.7
Preferred Shares (Series 3) 6.25%(4) Perpetual 150.0
Total Preferred Shares 322.5
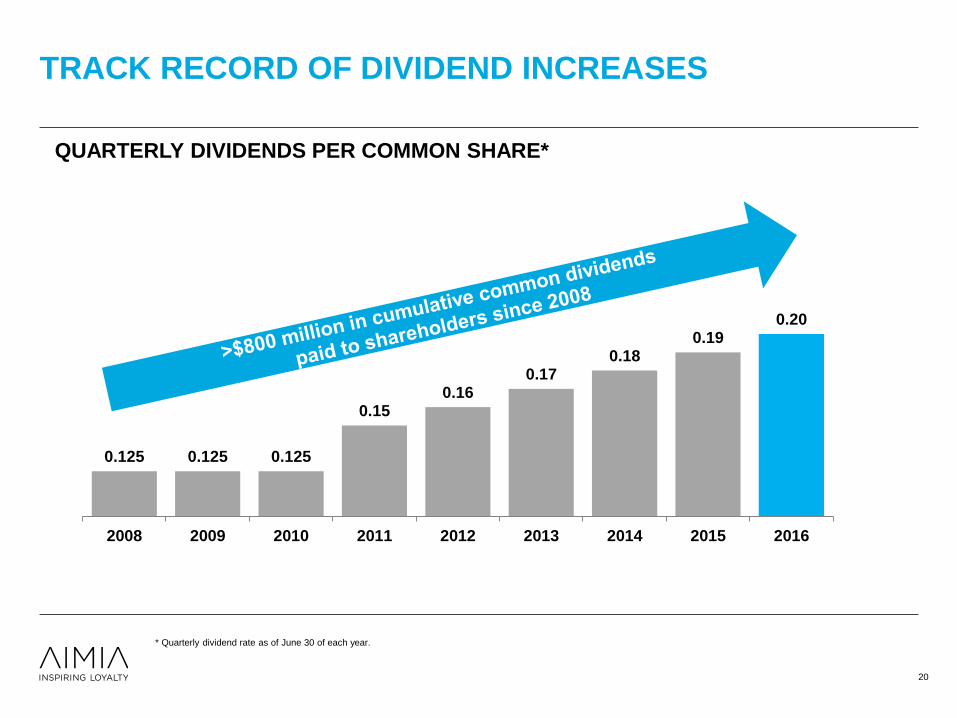
TRACK RECORD OF DIVIDEND INCREASES
0.125 0.125 0.125
0.15 0.16
0.17 0.18
0.19 0.20
2008 2009 2010 2011 2012 2013 2014 2015 2016
* Quarterly dividend rate as of June 30 of each year.
QUARTERLY DIVIDENDS PER COMMON SHARE*
20
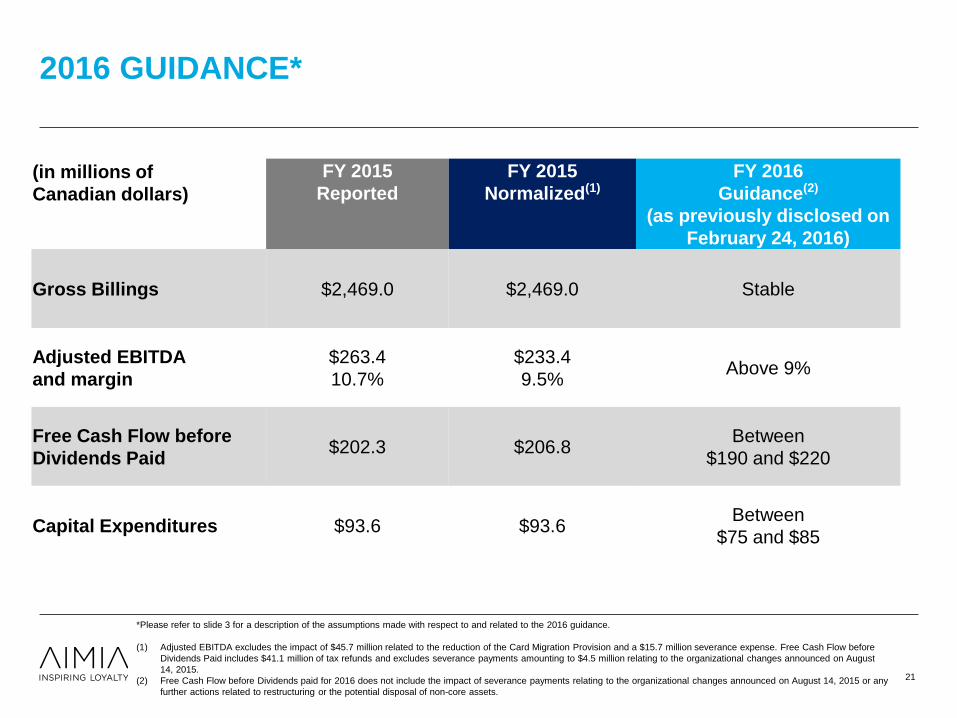
2016 GUIDANCE*
21
(in millions of
Canadian dollars)
FY 2015
Reported
FY 2015
Normalized(1)
FY 2016
Guidance(2)
(as previously disclosed on
February 24, 2016)
Gross Billings $2,469.0 $2,469.0 Stable
Adjusted EBITDA
and margin
$263.4
10.7%
$233.4
9.5% Above 9%
Free Cash Flow before
Dividends Paid $202.3 $206.8 Between
$190 and $220
Capital Expenditures $93.6 $93.6 Between
$75 and $85
*Please refer to slide 3 for a description of the assumptions made with respect to and related to the 2016 guidance.
(1) Adjusted EBITDA excludes the impact of $45.7 million related to the reduction of the Card Migration Provision and a $15.7 million severance expense. Free Cash Flow before
Dividends Paid includes $41.1 million of tax refunds and excludes severance payments amounting to $4.5 million relating to the organizational changes announced on August
14, 2015.
(2) Free Cash Flow before Dividends paid for 2016 does not include the impact of severance payments relating to the organizational changes announced on August 14, 2015 or any
further actions related to restructuring or the potential disposal of non-core assets.

Q&A

THANK YOU
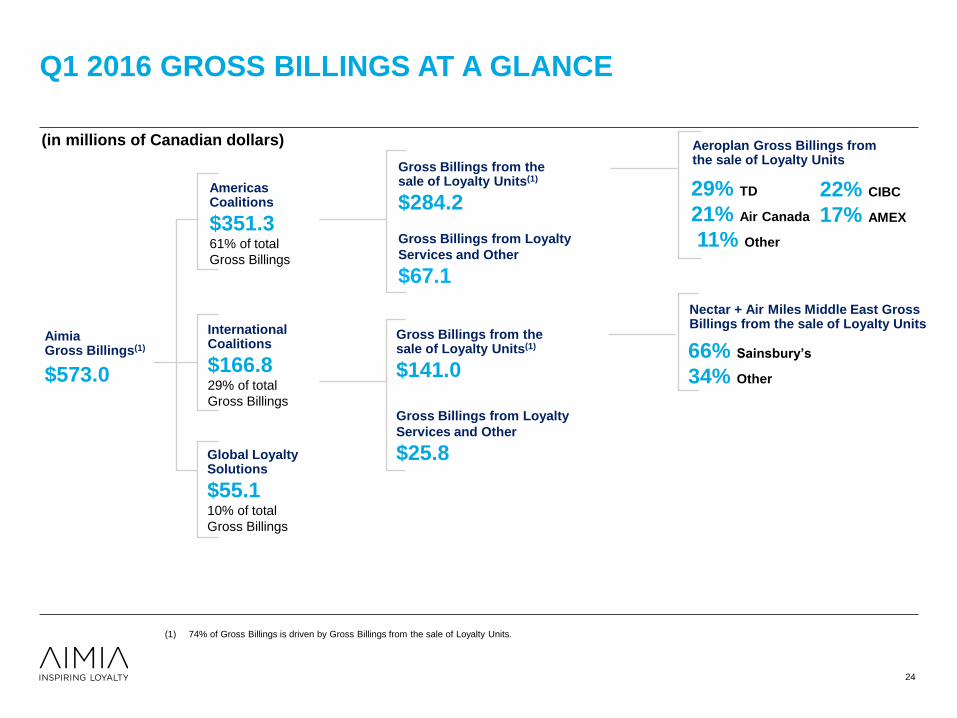
Q1 2016 GROSS BILLINGS AT A GLANCE
(1) 74% of Gross Billings is driven by Gross Billings from the sale of Loyalty Units.
Aimia Gross Billings(1)
$573.0
Americas Coalitions
$351.3 61% of total
Gross Billings
International Coalitions
$166.8 29% of total
Gross Billings
Global Loyalty Solutions
$55.1 10% of total
Gross Billings
Gross Billings from the sale of Loyalty Units(1)
$284.2
Gross Billings from Loyalty
Services and Other
$67.1
Gross Billings from the sale of Loyalty Units(1)
$141.0
Gross Billings from Loyalty
Services and Other
$25.8
29% TD
21% Air Canada
11% Other
22% CIBC
17% AMEX
Aeroplan Gross Billings from the sale of Loyalty Units
66% Sainsbury’s
34% Other
Nectar + Air Miles Middle East Gross Billings from the sale of Loyalty Units
24
(in millions of Canadian dollars)
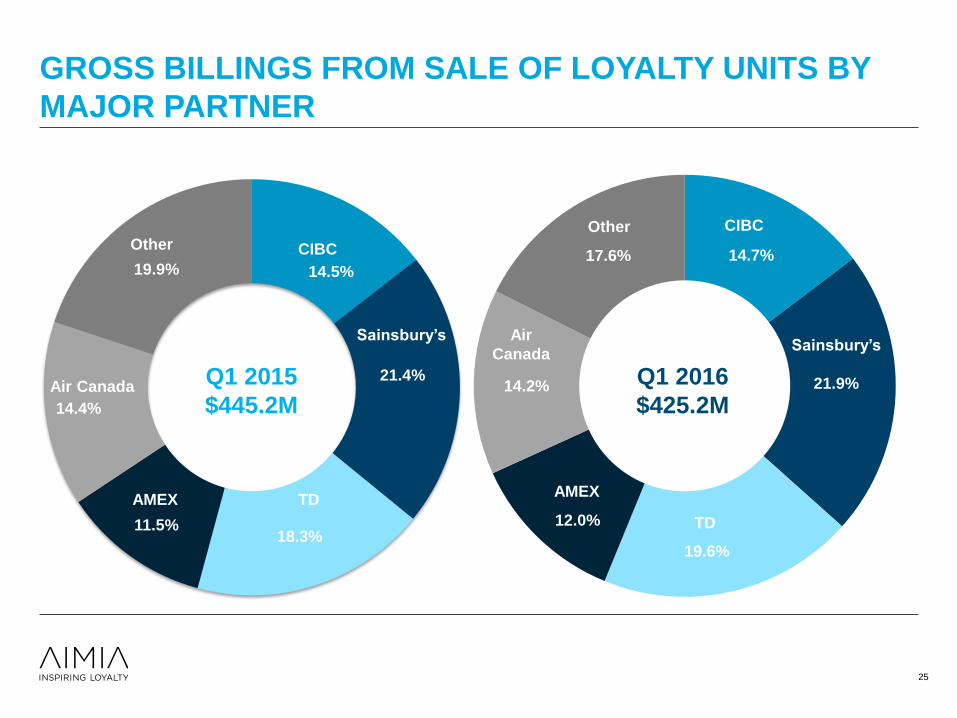
14.5%
21.4%
18.3% 11.5%
14.4%
19.9%
GROSS BILLINGS FROM SALE OF LOYALTY UNITS BY
MAJOR PARTNER
25
14.7%
21.9%
19.6%
12.0%
14.2%
17.6%
AMEX
CIBC
TD
Air
Canada
Other
CIBC
Sainsbury’s
Air Canada
Other
Q1 2015
$445.2M
Q1 2016
$425.2M
Sainsbury’s
AMEX TD
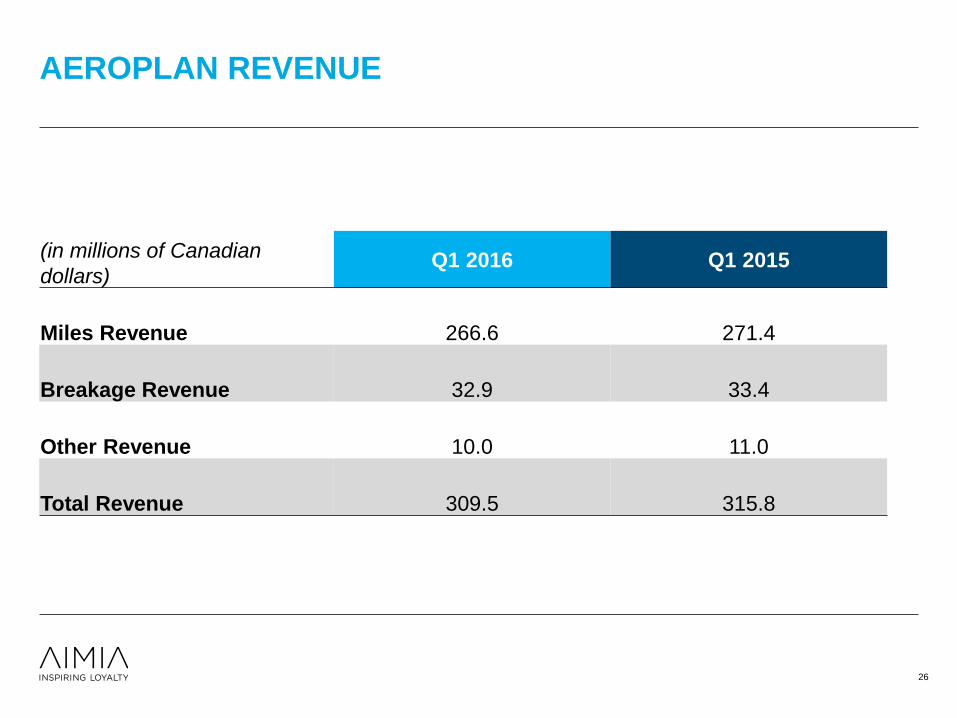
AEROPLAN REVENUE
26
(in millions of Canadian
dollars) Q1 2016 Q1 2015
Miles Revenue 266.6 271.4
Breakage Revenue 32.9 33.4
Other Revenue 10.0 11.0
Total Revenue 309.5 315.8
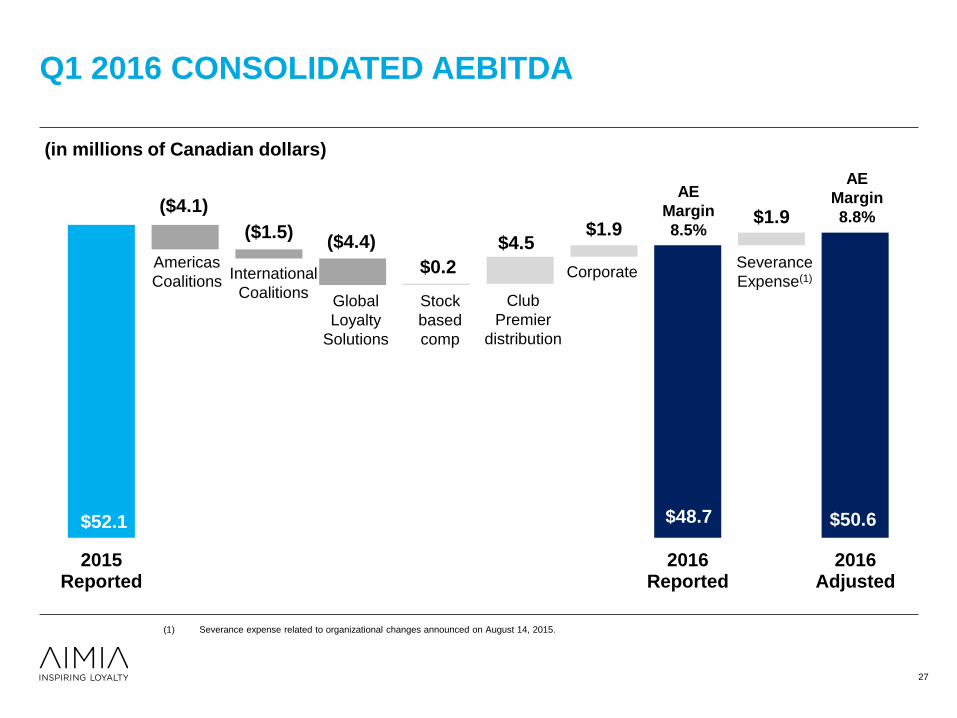
Q1 2016 CONSOLIDATED AEBITDA
27
(1) Severance expense related to organizational changes announced on August 14, 2015.
$48.7 $50.6
($4.1)
($1.5) ($4.4)
$1.9
$0.2
$4.5 $1.9
$52.1
2015Reported
2016Reported
2016Adjusted
Americas
Coalitions International
Coalitions Global
Loyalty
Solutions
Stock
based
comp
Club
Premier
distribution
Corporate Severance
Expense(1)
AE
Margin
8.5%
AE
Margin
8.8%
(in millions of Canadian dollars)
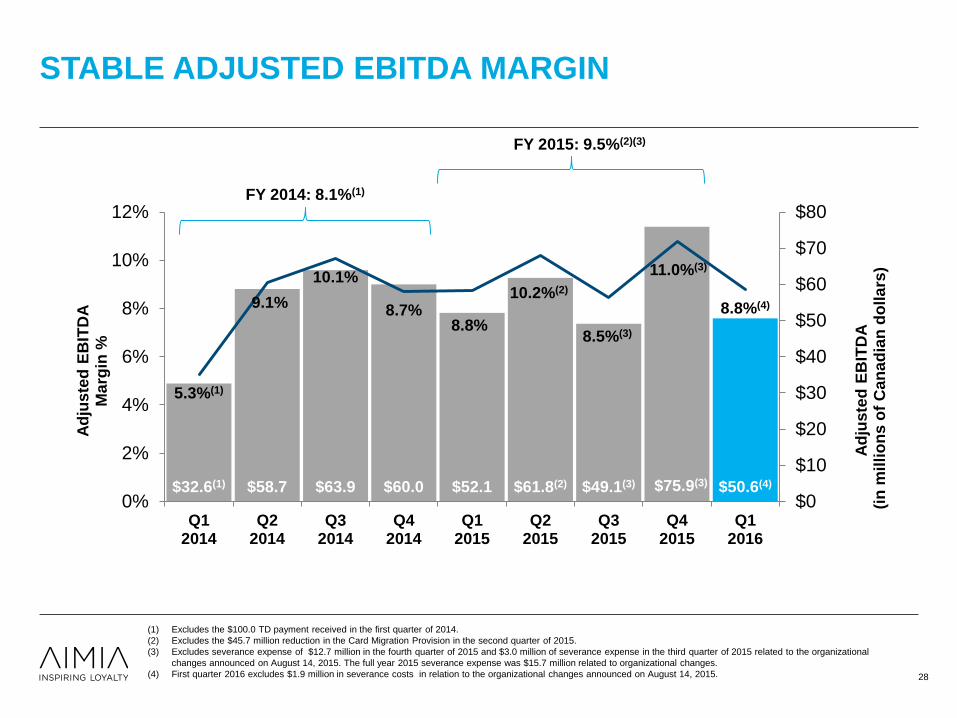
STABLE ADJUSTED EBITDA MARGIN
28
$32.6(1) $58.7 $63.9 $60.0 $52.1 $61.8(2) $49.1(3) $75.9(3) $50.6(4)
5.3%(1)
9.1%
10.1%
8.7% 8.8%
10.2%(2)
8.5%(3)
11.0%(3)
8.8%(4)
0%
2%
4%
6%
8%
10%
12%
Q12014
Q22014
Q32014
Q42014
Q12015
Q22015
Q32015
Q42015
Q12016
$0
$10
$20
$30
$40
$50
$60
$70
$80
Ad
juste
d E
BIT
DA
M
arg
in %
Ad
juste
d E
BIT
DA
(
in m
illi
on
s o
f C
an
ad
ian
do
lla
rs)
(1) Excludes the $100.0 TD payment received in the first quarter of 2014.
(2) Excludes the $45.7 million reduction in the Card Migration Provision in the second quarter of 2015.
(3) Excludes severance expense of $12.7 million in the fourth quarter of 2015 and $3.0 million of severance expense in the third quarter of 2015 related to the organizational
changes announced on August 14, 2015. The full year 2015 severance expense was $15.7 million related to organizational changes.
(4) First quarter 2016 excludes $1.9 million in severance costs in relation to the organizational changes announced on August 14, 2015.
FY 2014: 8.1%(1)
FY 2015: 9.5%(2)(3)
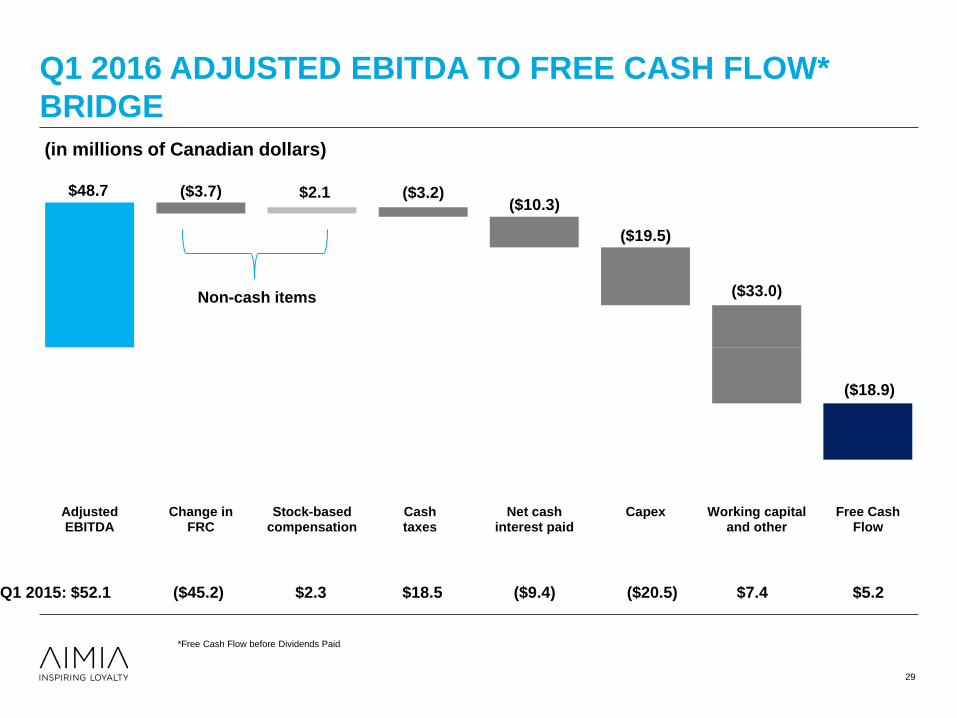
Q1 2016 ADJUSTED EBITDA TO FREE CASH FLOW*
BRIDGE
Q1 2015: $52.1 ($45.2) $2.3 $18.5 ($9.4) ($20.5) $7.4 $5.2
(in millions of Canadian dollars)
*Free Cash Flow before Dividends Paid
($18.9)
($3.7) ($3.2) ($10.3)
($19.5)
($33.0)
$2.1 $48.7
AdjustedEBITDA
Change inFRC
Stock-basedcompensation
Cashtaxes
Net cashinterest paid
Capex Working capitaland other
Free CashFlow
Non-cash items
29
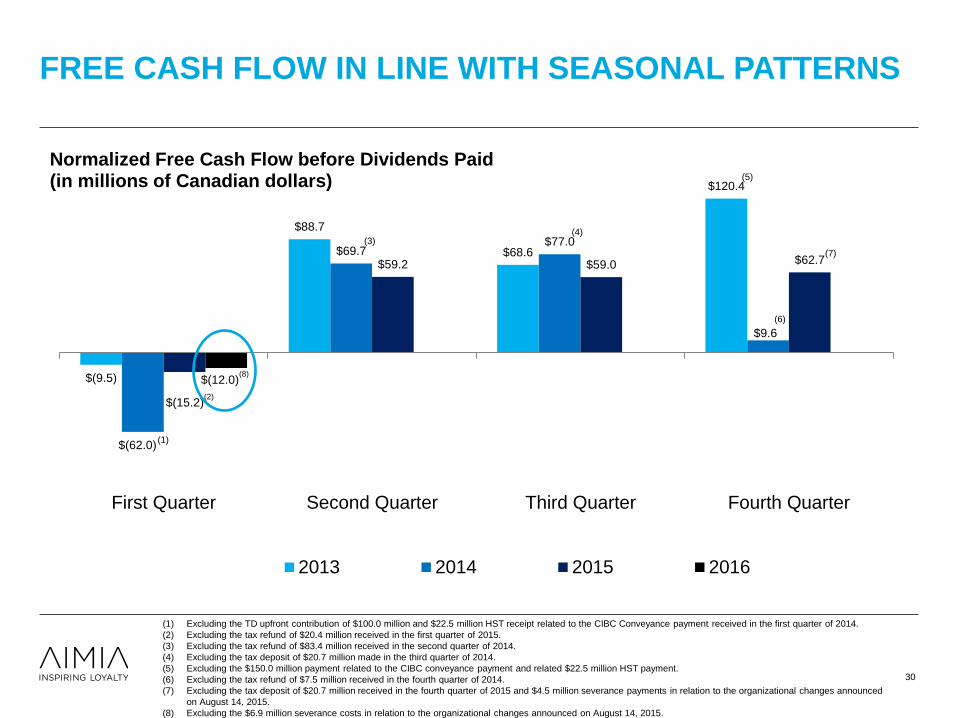
FREE CASH FLOW IN LINE WITH SEASONAL PATTERNS
30
$(9.5)
$88.7
$68.6
$120.4
$(62.0)
$69.7 $77.0
$9.6
$(15.2)(2)
$59.2 $59.0 $62.7
$(12.0)(8)
First Quarter Second Quarter Third Quarter Fourth Quarter
Normalized Free Cash Flow before Dividends Paid (in millions of Canadian dollars)
2013 2014 2015 2016
(1) Excluding the TD upfront contribution of $100.0 million and $22.5 million HST receipt related to the CIBC Conveyance payment received in the first quarter of 2014.
(2) Excluding the tax refund of $20.4 million received in the first quarter of 2015.
(3) Excluding the tax refund of $83.4 million received in the second quarter of 2014.
(4) Excluding the tax deposit of $20.7 million made in the third quarter of 2014.
(5) Excluding the $150.0 million payment related to the CIBC conveyance payment and related $22.5 million HST payment.
(6) Excluding the tax refund of $7.5 million received in the fourth quarter of 2014.
(7) Excluding the tax deposit of $20.7 million received in the fourth quarter of 2015 and $4.5 million severance payments in relation to the organizational changes announced
on August 14, 2015.
(8) Excluding the $6.9 million severance costs in relation to the organizational changes announced on August 14, 2015.
(1)
(3) (4)
(6)
(7)
(5)
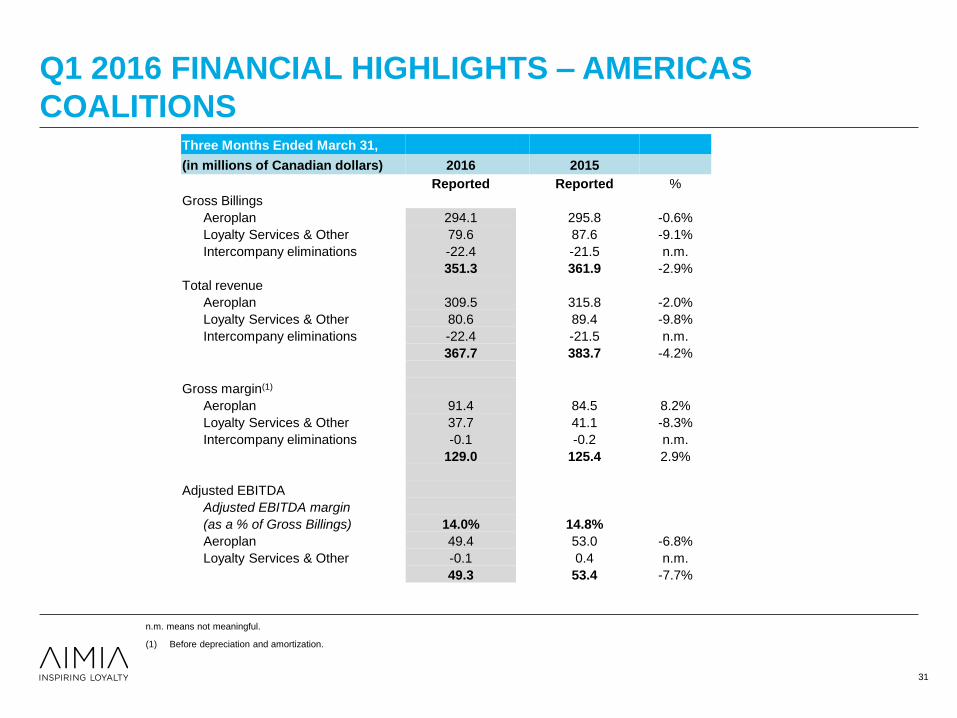
Q1 2016 FINANCIAL HIGHLIGHTS – AMERICAS
COALITIONS
31
(1) Before depreciation and amortization.
n.m. means not meaningful.
Three Months Ended March 31,
(in millions of Canadian dollars) 2016 2015
Reported Reported %
Gross Billings
Aeroplan 294.1 295.8 -0.6%
Loyalty Services & Other 79.6 87.6 -9.1%
Intercompany eliminations -22.4 -21.5 n.m.
351.3 361.9 -2.9%
Total revenue
Aeroplan 309.5 315.8 -2.0%
Loyalty Services & Other 80.6 89.4 -9.8%
Intercompany eliminations -22.4 -21.5 n.m.
367.7 383.7 -4.2%
Gross margin(1)
Aeroplan 91.4 84.5 8.2%
Loyalty Services & Other 37.7 41.1 -8.3%
Intercompany eliminations -0.1 -0.2 n.m.
129.0 125.4 2.9%
Adjusted EBITDA
Adjusted EBITDA margin
(as a % of Gross Billings) 14.0% 14.8%
Aeroplan 49.4 53.0 -6.8%
Loyalty Services & Other -0.1 0.4 n.m.
49.3 53.4 -7.7%
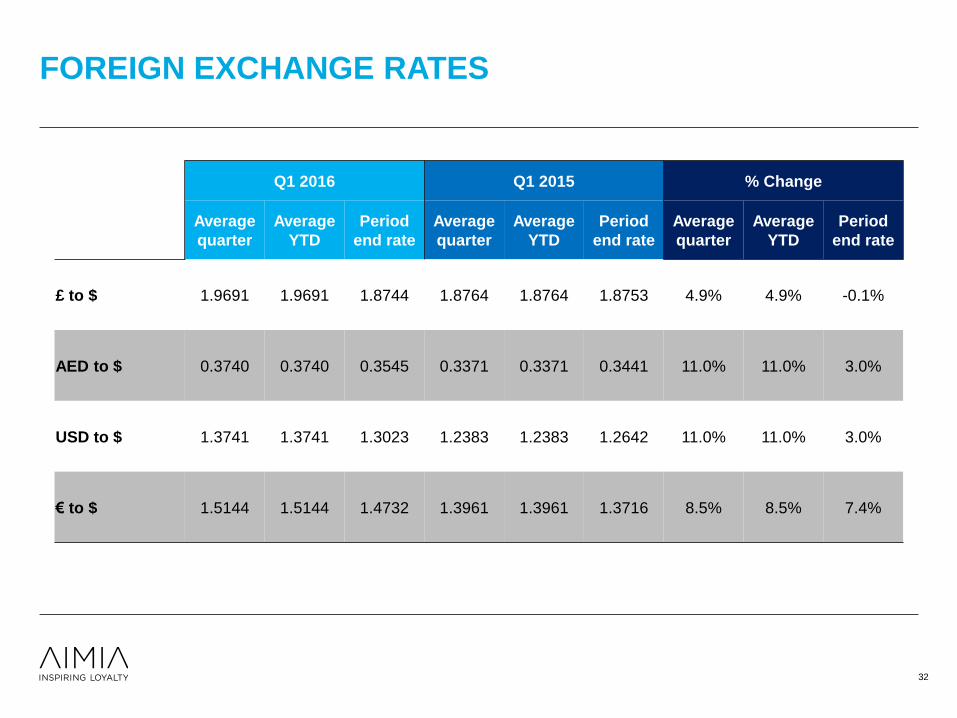
FOREIGN EXCHANGE RATES
32
Q1 2016 Q1 2015 % Change
Average
quarter
Average
YTD
Period
end rate
Average
quarter
Average
YTD
Period
end rate
Average
quarter
Average
YTD
Period
end rate
£ to $ 1.9691 1.9691 1.8744 1.8764 1.8764 1.8753 4.9% 4.9% -0.1%
AED to $ 0.3740 0.3740 0.3545 0.3371 0.3371 0.3441 11.0% 11.0% 3.0%
USD to $ 1.3741 1.3741 1.3023 1.2383 1.2383 1.2642 11.0% 11.0% 3.0%
€ to $ 1.5144 1.5144 1.4732 1.3961 1.3961 1.3716 8.5% 8.5% 7.4%
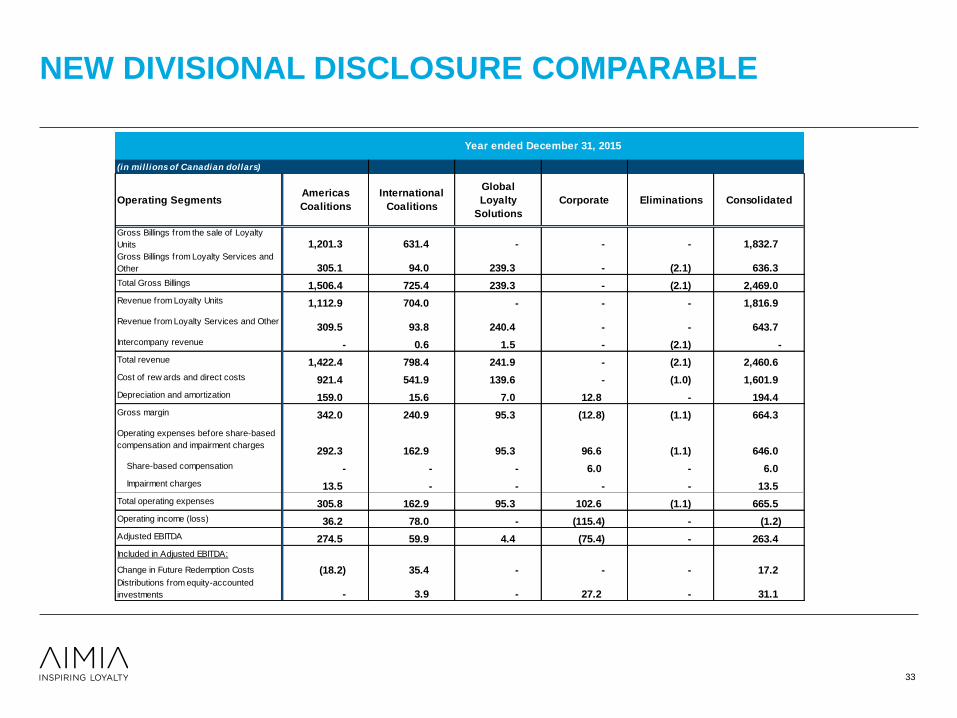
NEW DIVISIONAL DISCLOSURE COMPARABLE
(in millions of Canadian dollars)
Operating Segments
Gross Billings from the sale of Loyalty
Units 1,201.3 631.4 - - - 1,832.7Gross Billings from Loyalty Services and
Other 305.1 94.0 239.3 - (2.1) 636.3
Total Gross Billings 1,506.4 725.4 239.3 - (2.1) 2,469.0
Revenue from Loyalty Units 1,112.9 704.0 - - - 1,816.9
Revenue from Loyalty Services and Other309.5 93.8 240.4 - - 643.7
Intercompany revenue - 0.6 1.5 - (2.1) -
Total revenue 1,422.4 798.4 241.9 - (2.1) 2,460.6
Cost of rew ards and direct costs 921.4 541.9 139.6 - (1.0) 1,601.9
Depreciation and amortization 159.0 15.6 7.0 12.8 - 194.4
Gross margin 342.0 240.9 95.3 (12.8) (1.1) 664.3
Operating expenses before share-based
compensation and impairment charges292.3 162.9 95.3 96.6 (1.1) 646.0
Share-based compensation - - - 6.0 - 6.0
Impairment charges 13.5 - - - - 13.5
Total operating expenses 305.8 162.9 95.3 102.6 (1.1) 665.5
Operating income (loss) 36.2 78.0 - (115.4) - (1.2)
Adjusted EBITDA 274.5 59.9 4.4 (75.4) - 263.4
Included in Adjusted EBITDA:
Change in Future Redemption Costs (18.2) 35.4 - - - 17.2Distributions from equity-accounted
investments - 3.9 - 27.2 - 31.1
ConsolidatedAmericas
Coalitions
International
Coalitions
Global
Loyalty
Solutions
Corporate Eliminations
Year ended December 31, 2015
33


![V21 [AIMIA] Presentation, Robbee Minicola](https://img.pdfslide.us/doc/110x75/5554dcedb4c9051b6e8b513c/v21-aimia-presentation-robbee-minicola.jpg)