Embed Size (px)
Citation preview

Digging deeper
Prepared for:
Global Iron Ore & Steel ConferenceMarch 2016
Adrian DoyleSenior Consultant – Iron Ore Costs

2
• Recap of 2014 & 2015
• Key changes in 2015: macro factors, productivity and marketing
• What does the outlook for iron ore costs look like
• Conclusions
Agenda

The key themes from 2014 and 2015

A large amount of production was required to exit to
balance the market in 2014 and 2015
4
Additional supply, demand changes and displacement requirements for 2014 and 2015, Mt
195
3513
217
0
50
100
150
200
250
Supply from estabished producers Demand changes Displacement requirements
Australia
Data: CRU
Brazil

The majority of this displacement was fulfilled from non-
traditional exporters, China and other markets
31 Mt15 Mt
10 Mt
20 Mt
2 Mt
100 Mt
2014 and 2015 supply exits, Mt
23 Mt
15 Mt
5

Cost reductions in 2015:
macro vs productivity

7
The majors all posted strong cost reductions in 2015…
Indexed FOB cash costs, $/t (dry), 2014=100
40
60
80
100
120
Q1 Q2 Q3 Q4 Q1 Q2 Q3 Q4
2014 2015
FMG Rio Tinto BHP Billiton Vale
Data: CRU, Company reports
-38%
-23%
-31%
-35%

8
…but in each case these were eclipsed by the decline in the
iron ore priceIndexed 62% fines price, $/t (dry), 2014=100
40
60
80
100
120
Q1 Q2 Q3 Q4 Q1 Q2 Q3 Q4
2014 2015
Data: CRU, Company reports
-43%

Lower oil prices have provided assistance to these cost
reductions
9
Oil price scenario analysis, index $100/bbl oil = 100, Australian mines
45 41
2320
22
13
10
11
0
10
20
30
40
50
60
70
80
90
100
$100/bbl $30/bbl
Other Freight Transportation Mining
Data: CRU Iron Ore Cost Model

0
10
20
30
40
50
60
70
2014 Q4 2015 Q3 2015 Q4
Other costs Freight costs Cash costs, FOB
Data: Vale Day London 2015
56.5 32.4 31.2
10
Vale achieved a staggering 45% y/y reduction in delivered
costs...Vale's cash cost landed China, $/t dry

0
10
20
30
40
50
60
70
2014 Q4 2015 Q3 2015 Q4
Other costs Freight costs Cash costs, FOB
Data: Vale Day London 2015
21.7
16.4 14.3
11
…although macroeconomic factors helped. Freight costs
to China fell 35%, or by over $7 /tVale's cash cost landed China, $/t dry

0
10
20
30
40
50
60
70
2014 Q4 2015 Q3 2015 Q4
Data: Vale Day London 2015
48.0 36.3 34.1
12
… while FOB cash costs in local currency fell by 29%,
indicating that this wasn’t purely driven by macro factorsVale's FOB cash cost, adjusted for quality, BRL/t dry

0
10
20
30
40
50
60
70
80
2014 2014 2014 2014 2015 2015 2015 2015
Q1 Q2 Q3 Q4 Q1 Q2 Q3 Q4
Cash costs, FOB, USD
Cash costs, FOB, AUD
Data: FMG company reports, CRU estimatesData: FMG company reports, CRU estimates
FMG’s results paint a similar picture of cost reductions,
with the AUD assisting pure productivity gains
13
-37%
-51%
FMG's FOB cash cost, $/t dry

14
0
10
20
30
40
50
60
70
80
2014 2014 2014 2014 2015 2015 2015 2015
Q1 Q2 Q3 Q4 Q1 Q2 Q3 Q4
Normalisation to 62% price
Cash costs + freight + royalty + admin
Cash costs, FOB
Data: FMG company reports, CRU estimates
FMG's FOB cash costs, CFR costs and breakeven cost, $/t dry
FMG’s results paint a similar picture of cost reductions,
with the AUD assisting pure productivity gains

The Australian juniors have also continued to lower costs
into the last quarterBenchmark breakeven price, Australian mid-tiers, CFR China, $/dry t.
Left estimate: 2015 Q3. Right estimate: 2015 Q4
15
0
10
20
30
40
50
60
70
80
Arrium Atlas Iron Cliffs Gindalbie Grange Resources
Mineral Resources
Mount Gibson
+1% -18%-15%-8%-9%-7%-6%
Data: CRU estimate, including sustaining capital, royalties and corporate costs

Looking ahead: market dynamics

-88
-129
-46 -47
-12-16
-8
2014 2015 2016 2017 2018 2019 2020
Displacement requirements, while below the levels in 2014
& 2015, are still significant
17
Data: CRU.
Displacement needed to balance market, Mt
18
Beijing
Hebei Inner Mongolia
Shanxi
Heilongjiang
JilinLiaoning
Anhui
Fujian
Guangdong
Guangxi
Henan
Hubei
Hunan
Jiangsu
Jiangxi
ShandongZhejiang
Gansu
Guizhou
Qinghai
ShaanxiSichuan
Xinjiang
Yunnan
-20%
-10%
0%
10%
20%
30%
40%
50%
15.0% 20.0% 25.0% 30.0% 35.0% 40.0% 45.0% 50.0%
NorthSouth EastNorth EastWest
Data: Mysteel, CRU
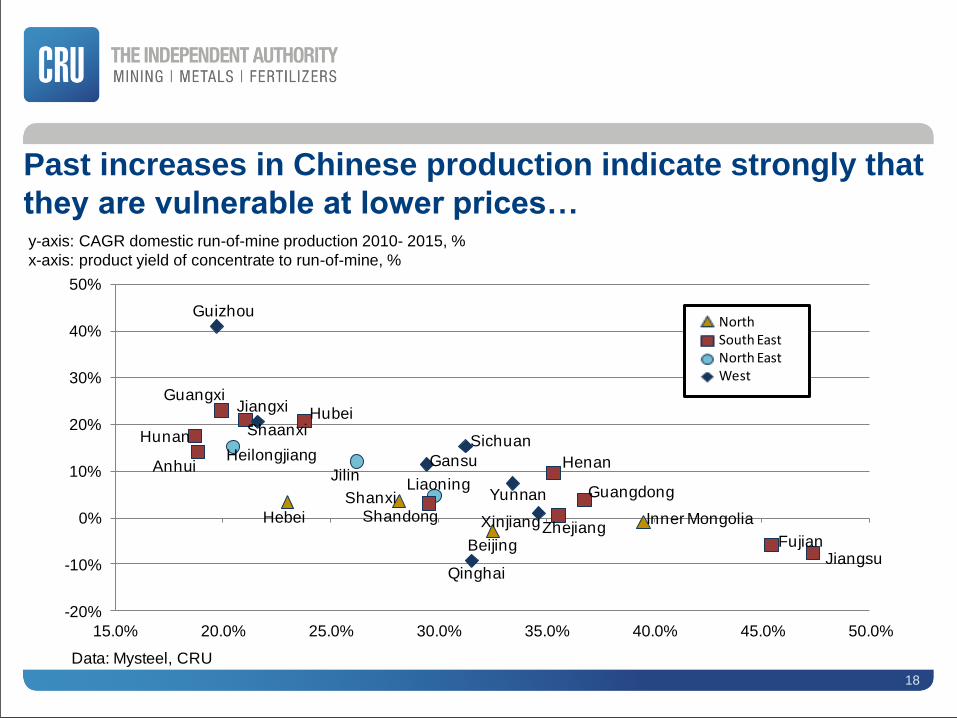
Past increases in Chinese production indicate strongly that
they are vulnerable at lower prices…y-axis: CAGR domestic run-of-mine production 2010- 2015, %
x-axis: product yield of concentrate to run-of-mine, %

…with large amounts of high-cost ore being situated in
range of low-cost imports
0. 0
20. 0
40. 0
60. 0
80. 0
100. 0
120. 0
140. 0
Q1 Q2 Q3 Q4 Q1 Q2 Q3 Q4 Q1
2014 2015 2016
GansuSha’anxi
Guizhou
Guangxi
HunanJiangxi
AnhuiHubei
HEBEI
Jilin
Heilongjiang
19

20
We expect further reductions. However, a solid core of
production will remainy-axis: Supply of iron ore to Chinese steel market, 2017, Mt
x-axis: 62% fines price, CFR China, $/t
0
200
400
600
800
1000
1200
20253035404550556065707580
Imported ore Domestic - Southeast Domestic - Northeast Domestic - North Domestic - West
Data: CRU

How will macroeconomic factors
change looking ahead

22
After a volatile 2015, we expect major commodity currencies to
begin to level off from this yearSelected currencies against US dollar, index 2014=100
0
20
40
60
80
100
120
140
160
180
200
2013 2014 2015 2016 2017 2018 2019 2020
AUD BRL CNY EUR RUB UAH
Data: CRU

23
Oil and freight will provide start to stretch the cost curve
LHS: Brent oil price, $/bbl
RHS: Capesize time charter rate, $’000/day
Modelled freight differential, Australia to
China & Brazil to China, $/t
0
10
20
30
40
50
60
0
20
40
60
80
100
120
20
13
20
14
20
15
20
16
20
17
20
18
20
19
20
20
20
21
20
22
20
23
20
24
20
25
Brent oil Capesize charter rate
Data: CRU
0
2
4
6
8
10
12
14
16
18
20
20
13
20
14
20
15
20
16
20
17
20
18
20
19
20
20
20
21
20
22
20
23
20
24
20
25
Data: CRU

The road ahead
24
Effect on costs/prices
Factor 2014-2015 2016-2020 Long-term
Supply additions FMG,AA,RTIO Roy Hill, S11D Uncertain
Oil Fall below $50/bbl $80/bbl by 2020 Recovery to $100/bbl
Freight Collapse in freight
rates
Sharp recovery Further steady
recovery
FOREX Widespread
depreciation
Stabilisation in most
currencies
Stabilisation in most
currencies
Demand Demand correction
in China
Demand stabilisation Long-term demand
story remains
Productivity Price falls drive
gains
Price pressure to
drive further increases
Price pressure to
unwind
Steel profitability Collapse in Chinese
steelmakers’ profit
Increasing from low
base
Continuing increase
Negative No change Positive

25
• 2014 & 2015 saw large displacement requirements mostly met through a
combination of exits from China, non-traditional exporters and existing
producers.
• Cost reductions were impressive throughout 2015 across the cost curve, driven
by productivity improvements and macroeconomic factors. The majority of
these cuts are sustainable. These led to a lower and flatter cost curve.
• We require further displacement from a much more resilient set of producers in
2016 and 2017. Market dynamics are ugly for these years.
• However, macroeconomic factors and an anticipated improvement in steel
industry conditions will raise and stretch the cost curve, leading to increased
profitability.

Adrian Doyle
Senior Consultant, Iron Ore Costs
T: +61 2 8412 2807
CRU International (Australia) Pty
71 Walker Street
North Sydney, 2060
NSW
Please address any questions or comments relating to this
presentation to:
Philip Sewell
Business Development Manager
T: +61 2 9387 8842
Alex Tonks
Managing Consultant, CRU Consulting
T: +61 2 8412 2801