Embed Size (px)
Citation preview

6 forecasting best practices for smart businesses

2
www.BetterVu.com
PARTNERBETTERVU
25+ Years of experience in Financial Performance ManagementMultiple industries with service focus
Frequent speaker and innovation leaderBased in Toronto, Canada
MITCH MAX
Today’s speaker
1-844-423-8788 x201
@Better_Vu
3
www.BetterVu.com
BetterVu designs and implements innovative
solutions that link sales, operational and
financial applications to create
transformational change.
Anaplan is our canvas to bring Best
Practices in Performance Management from
vision to reality.
www.BetterVu.com

4
www.BetterVu.com
WHAT’S NEXT?
5
www.BetterVu.com
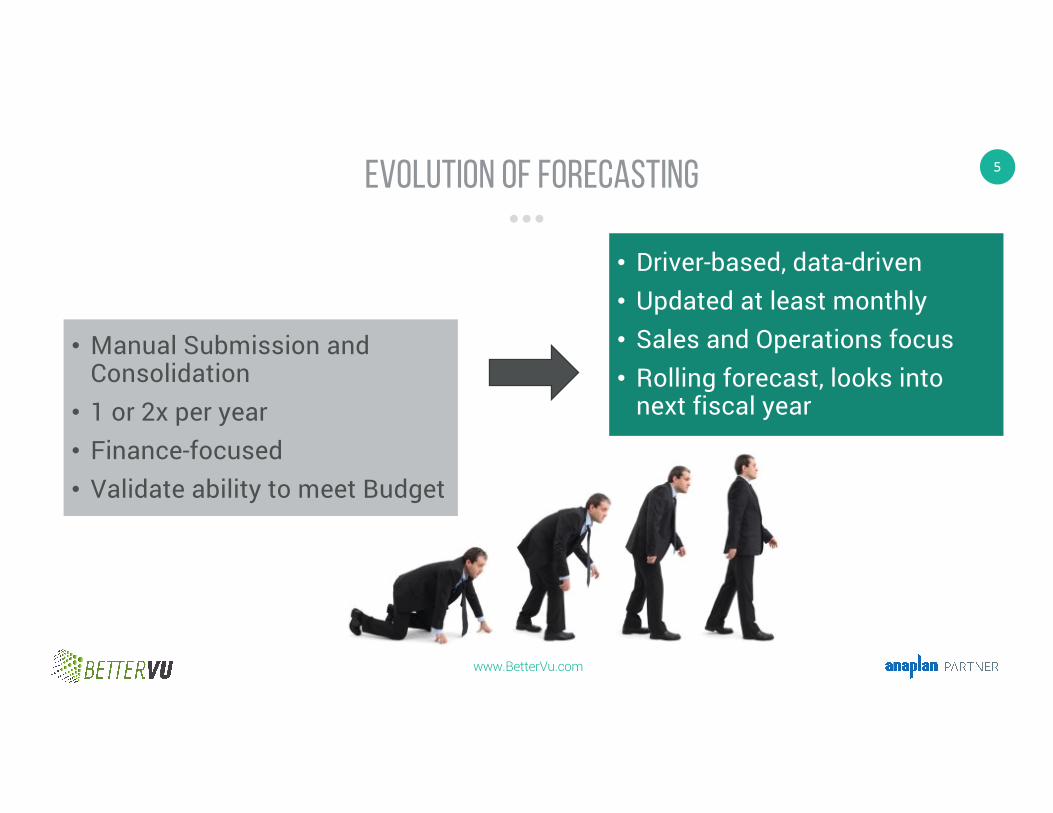
Evolution of Forecasting
• Driver-based, data-driven• Updated at least monthly• Sales and Operations focus• Rolling forecast, looks into
next fiscal year
• Manual Submission and Consolidation
• 1 or 2x per year• Finance-focused• Validate ability to meet Budget
6
www.BetterVu.com
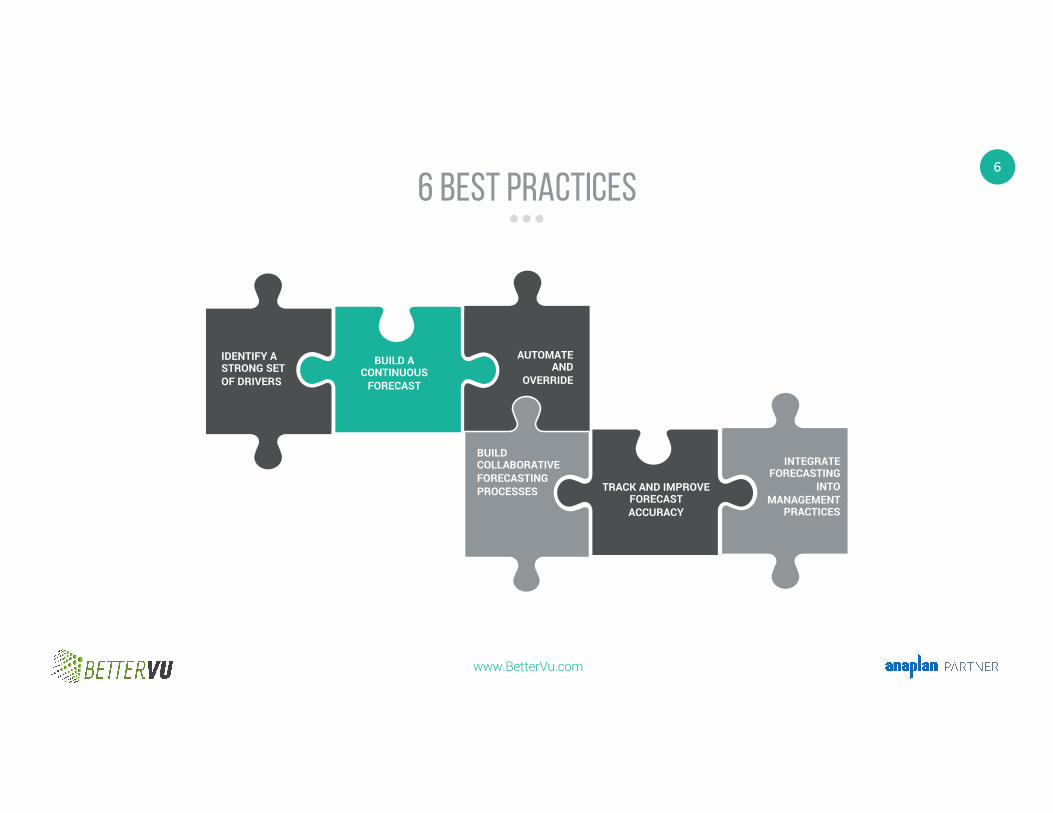
TRACK AND IMPROVE FORECAST ACCURACY
IDENTIFY A STRONG SET OF DRIVERS
INTEGRATE FORECASTING
INTO MANAGEMENT
PRACTICES
BUILD A CONTINUOUS
FORECAST
AUTOMATE AND
OVERRIDE
BUILD COLLABORATIVE FORECASTING PROCESSES
6 Best Practices
7
www.BetterVu.com
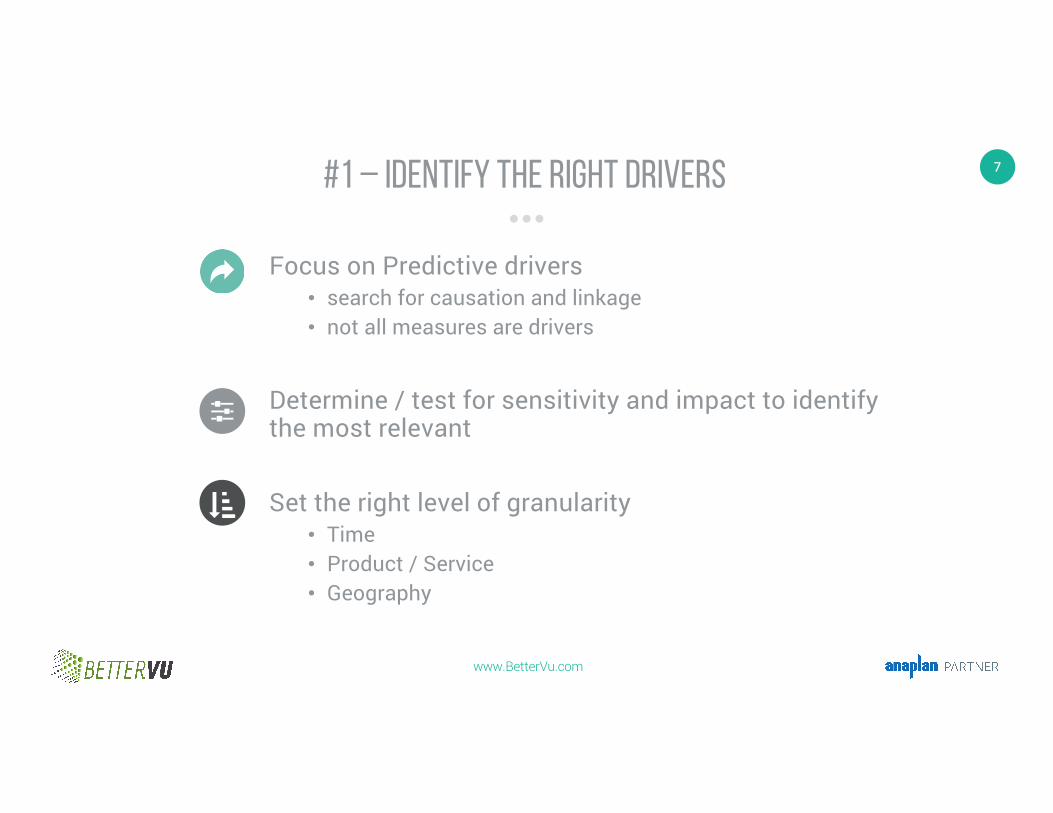
#1 – IDENTIFY THE RIGHT DRIVERS
Focus on Predictive drivers• search for causation and linkage• not all measures are drivers
Determine / test for sensitivity and impact to identify the most relevant
Set the right level of granularity• Time• Product / Service• Geography
8
www.BetterVu.com
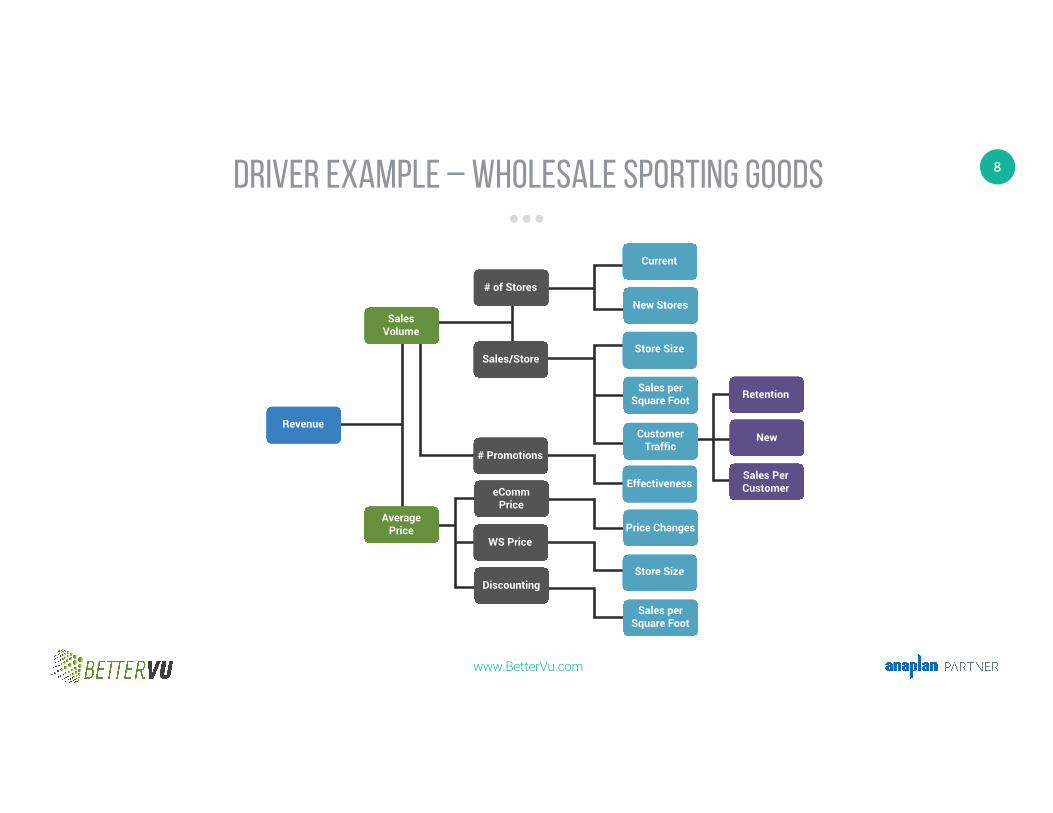
Driver example – wholesale sporting goodsONE: IDENTIFY A STRONG SET OF DRIVERS FOR YOUR BUSINESS OR FUNCTION
2 Data-Driven Forecasting // 6 Best Practices to Efficiently Drive Timely and Accurate Decision Making
In this example, Revenue is the product of Sales Volume and
Average Price. Macro-level adjustments may be made at this level,
but it is best to drill down to a lower driver - in this example sales
volume is driven by the number of stores, sales per store, and the
number of promotions. Each of these drivers is further driven by
lower level components. By modelling each of the components
and their relationship and sensitivity based on historical trends, a
robust and reliable forecast can be constructed based on changes
in any of the underlying components. Often the granularity helps
to identify those drivers which are the most impactful historically
- assuming that historical trends will continue into the future - so
that forecast effort can be more tightly focused.
It’s important to note that having a simple list of drivers is not
sufficient; we strongly recommend that each organization
understand its drivers in ‘chain’ fashion, as shown above. This
allows metrics to be used in multiple chains while understanding
how each metric contributes to overall success.
Driver Example - Wholesale Sporting Goods
Revenue
# of Stores
Sales/Store
# Promotions
eCommPrice
WS Price
Discounting
Retention
New
Sales PerCustomer
Current
New Stores
Store Size
Sales perSquare Foot
CustomerTraffic
Effectiveness
Price Changes
Store Size
Sales perSquare Foot
Average Price
SalesVolume
9
www.BetterVu.com
#2 – build a continuous process
Use driver data to project future outcomes• Build on linkages and trends• Adjust for likely variations• Avoid fiscal timeframes
Target a quick process (1-2 days)
Move from fiscal cycle to on-demand• Constantly updated• Alerts trigger review and action
10
www.BetterVu.com
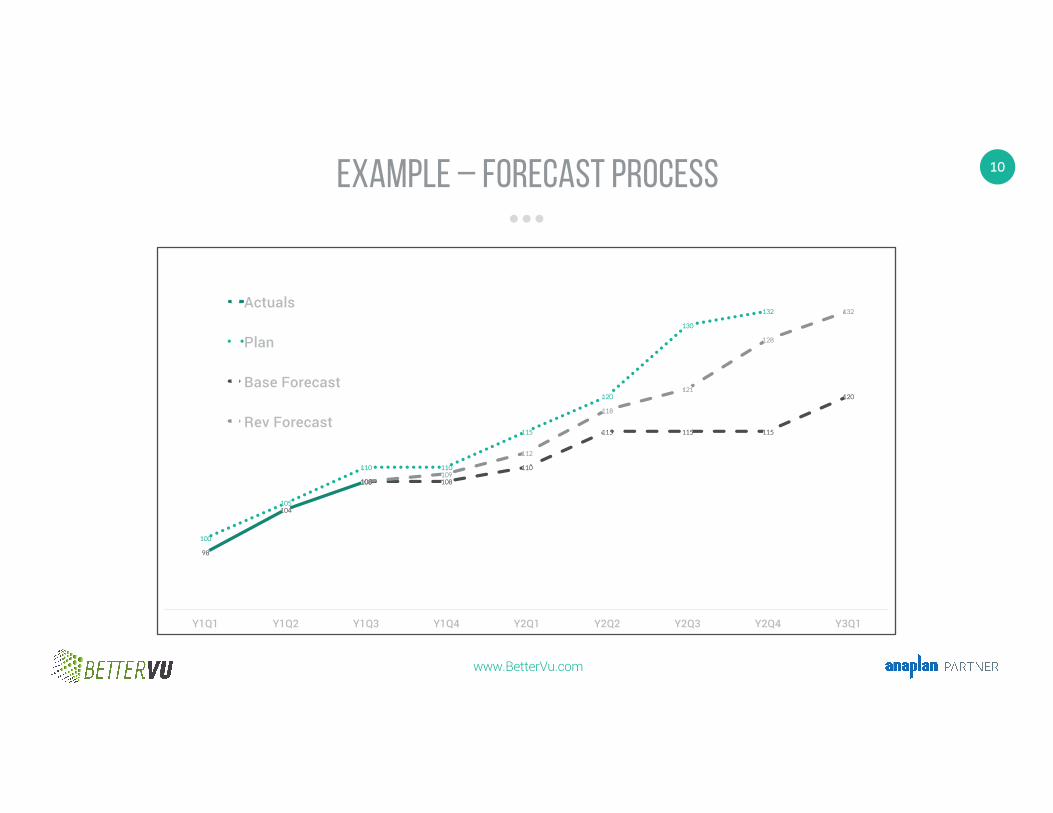
Example – forecast process
98
104
108
100
105
110 110
115
120
130
132
108 108
110
115 115 115
120
108109
112
118
121
128
132
Y1Q1 Y1Q2 Y1Q3 Y1Q4 Y2Q1 Y2Q2 Y2Q3 Y2Q4 Y3Q1
Actuals
Plan
Base Forecast
Rev Forecast
11
www.BetterVu.com
#3 – automate and override
Create statistical projections that are auto-tuned to each driver
Allow for human override or capture of field data• Use statistical data for high volume, low value
items• Gather local expertise for high value items• Manual input may be required if low data volumes
Identify accuracy of auto-forecasts and improve over time
12
www.BetterVu.com
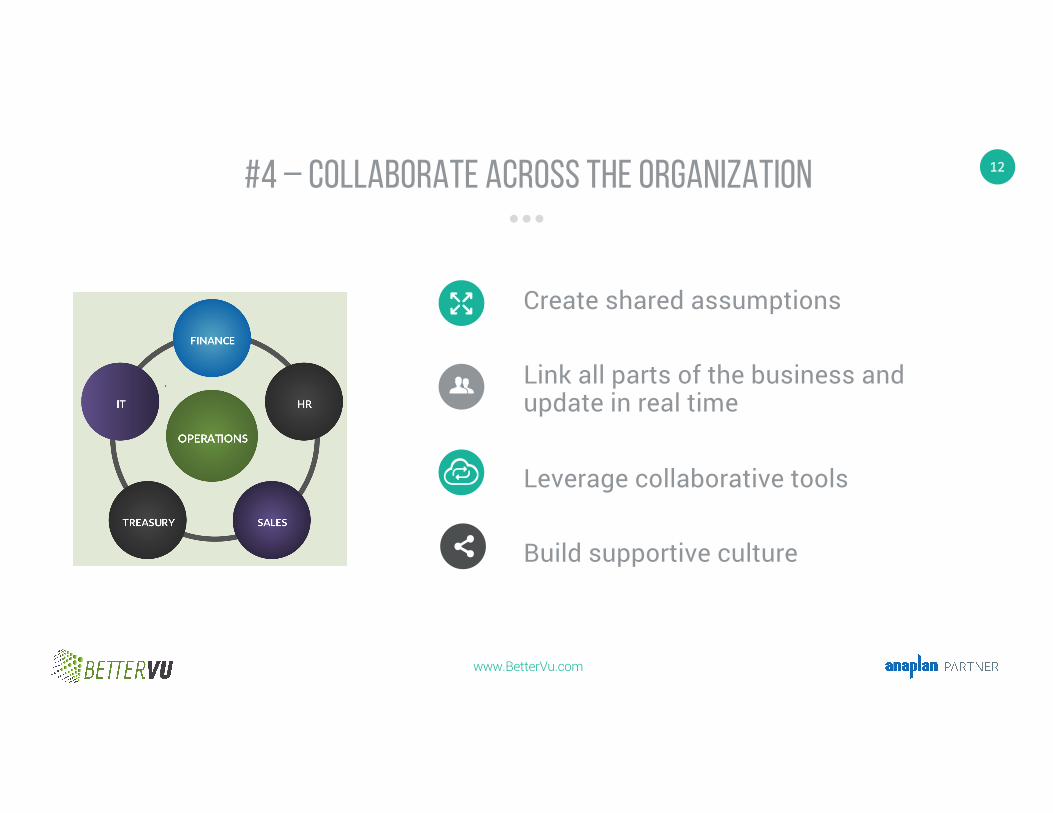
#4 – collaborate across the organization
Create shared assumptions
Link all parts of the business and update in real time
Leverage collaborative tools
Build supportive culture
13
www.BetterVu.com
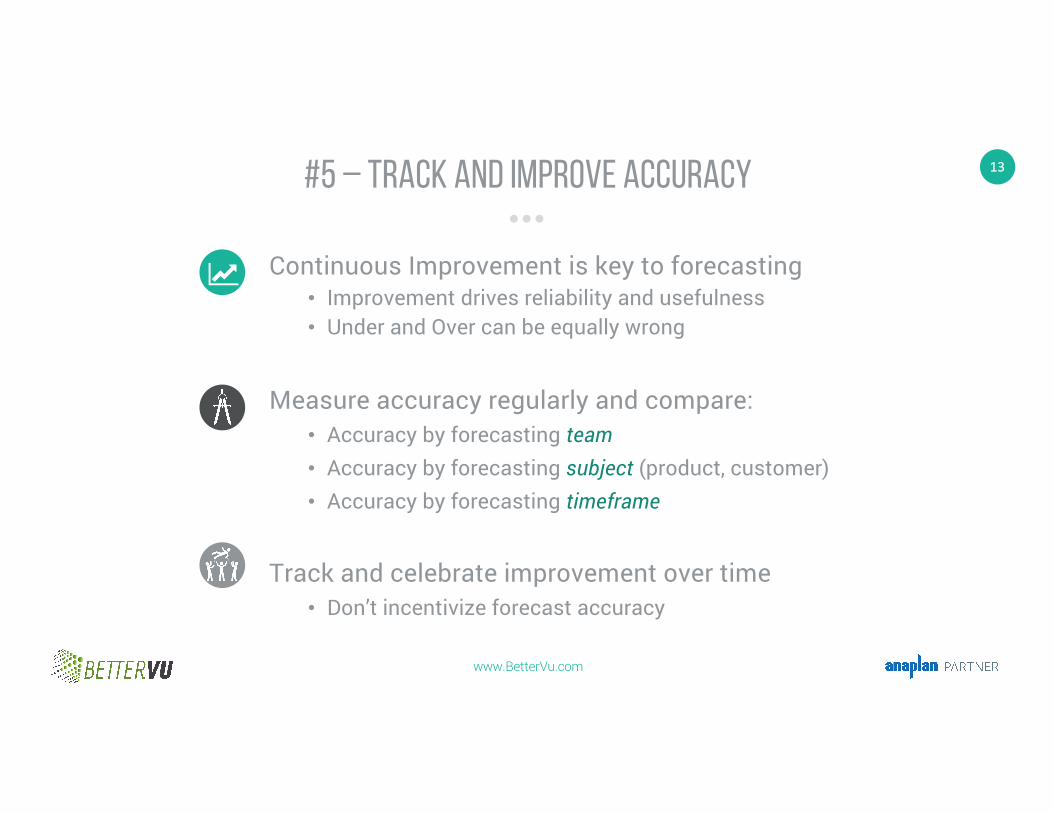
#5 – track and improve accuracy
Continuous Improvement is key to forecasting• Improvement drives reliability and usefulness• Under and Over can be equally wrong
Measure accuracy regularly and compare:• Accuracy by forecasting team• Accuracy by forecasting subject (product, customer)• Accuracy by forecasting timeframe
Track and celebrate improvement over time• Don’t incentivize forecast accuracy
14
www.BetterVu.com
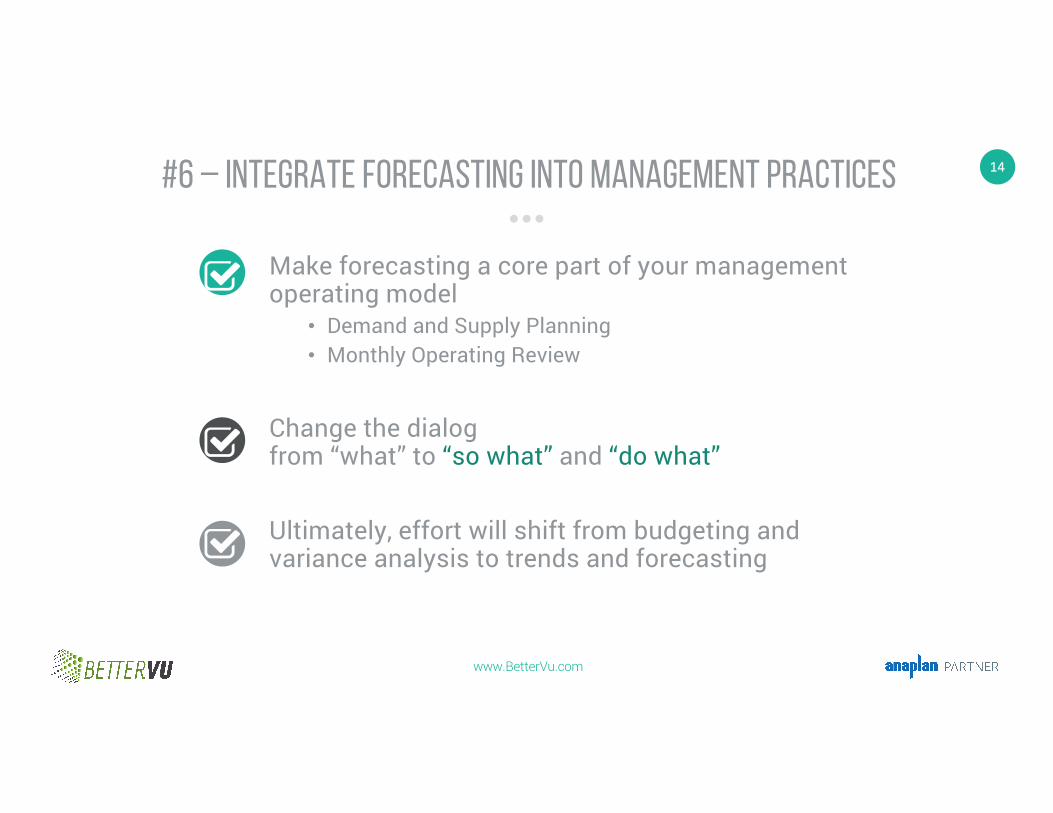
#6 – integrate forecasting into management practices
Make forecasting a core part of your management operating model
• Demand and Supply Planning• Monthly Operating Review
Change the dialog from “what” to “so what” and “do what”
Ultimately, effort will shift from budgeting and variance analysis to trends and forecasting

15
www.BetterVu.com
THANKS FOR WATCHINGDownload our White Paper @ www.BetterVu.com

16
www.BetterVu.com
ANY QUESTIONS?