Embed Size (px)
Citation preview

Evolving Prospect for the Global Economy,
China’s New Normal and its Relevance to
Mongolia
Presentation at the Economic research Institute Mongolia
Bert Hofman, World Bank
Ulaanbaatar, March 25 2016
1

THE WORLD EONOMY IN THE
SHORT AND (VERY) LONG RUN
2

The World Economy
Source: ICP Program http://siteresources.worldbank.org/ICPINT/Resources/270056-
1183395201801/Summary-of-Results-and-Findings-of-the-2011-International-Comparison-Program.pdf
Mongolia
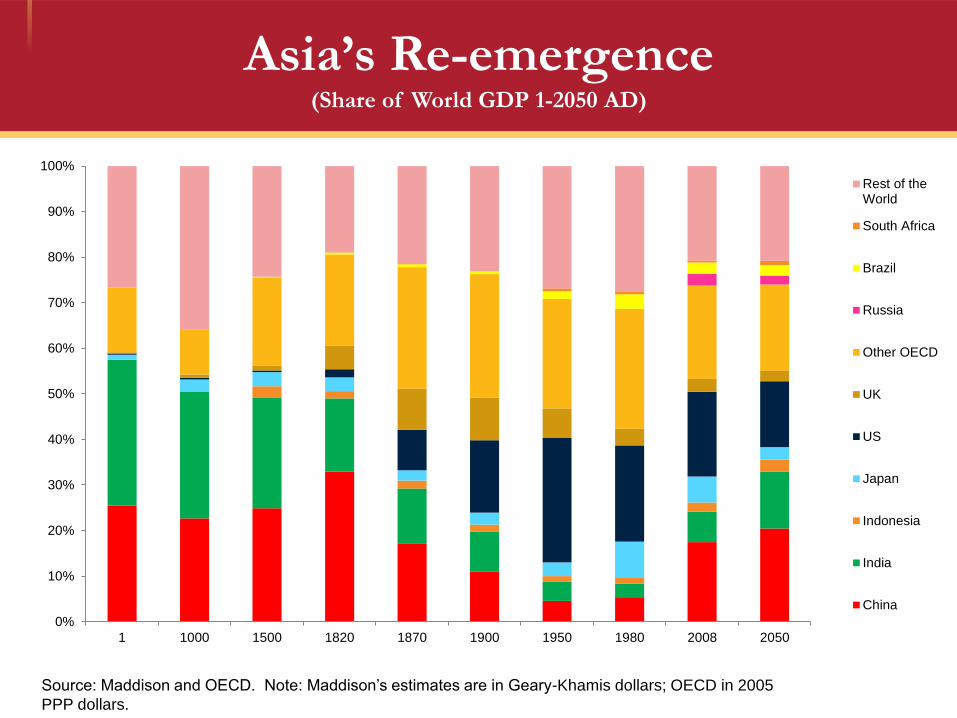
Asia’s Re-emergence(Share of World GDP 1-2050 AD)
Source: Maddison and OECD. Note: Maddison’s estimates are in Geary-Khamis dollars; OECD in 2005
PPP dollars.
0%
10%
20%
30%
40%
50%
60%
70%
80%
90%
100%
1 1000 1500 1820 1870 1900 1950 1980 2008 2050
Rest of theWorld
South Africa
Brazil
Russia
Other OECD
UK
US
Japan
Indonesia
India
China

Emerging Markets Catching Up as
OECD Productivity Slows
5Source: Conference Board, staff estimates. Note: Output per employee in 2014 US$ (converted to US$
using 2014 market exchange rates) Labor productivity growth five year moving average centered on final
year.
0
5,000
10,000
15,000
20,000
25,000
-0.3
0.7
1.7
2.7
3.7
4.7
5.7
1955 1960 1965 1970 1975 1980 1985 1990 1995 2000 2005 2010 2015
Gobal labor productivity growth OECD Labor productivity growth Output per employed person
Output per Employee (rhs)
Global labor productivity growth (lhs)
OECD Labor productivity growth (lhs)

Lower Global Inequality, but a Squeezed
(Western) Middle Class
6
Change in real income per global income
percentile 1988-2008
Source: Branko Milanovic

An Older, Urban World
20
30
40
50
60
70
80
90
100
0 10 20 30 40 50 60 70 80 90 100
China
2050
Urbanization
Old-age dependency ratio
EU
2050
Japan 2050
India 2050
EU 2010
Brazil 2050
US 2050
US 2010
Nigeria
2050
India 2010
China
Brazil 2010 Korea 2050
Indonesia 2050
Japan
Nigeria
Pakistan 2050
Size of bubbles
corresponds with
population of age 15-65Indonesia
2010
Philippines
Pakistan 2010
Korea 2010
Russia
Russia
2010
Vietnam 2050
Vietnam 2010
Source: World Bank Nutrition Population and Health
Database, UN Population Database

8
GDP Growth (Percent)
Source: World Bank.
Note: Several countries were reclassified from middle-income to high-income country status in 2015, including Argentina, Hungary, and Venezuela.
All series have been adjusted to ensure a constant sample according to current income status.
-4
0
4
8
12
2007 2008 2009 2010 2011 2012 2013 2014 2015 2016 2017 2018
World High-income countries Developing countries
Global Growth:
Slower in 2015. Modest Pickup 2016 and beyond

9
GDP Growth(Percent)
Source: World Bank.
Note: Several countries were reclassified from middle-income to high-income country status in 2015, including Argentina, Hungary, and Venezuela. All series have been adjusted to ensure a
constant sample according to current income status.
Regional Forecasts
Current forecastChange from
October
2014 2015 2016 2017 2015 2016 2017
World 2.6 2.4 2.9 3.1 -0.1 -0.1 0.0
High-income countries 1.7 1.6 2.1 2.1 -0.1 0.0 0.0
Developing countries 4.9 4.3 4.8 5.3 0.0 -0.2 0.0
East Asia and Pacific 6.8 6.4 6.3 6.2 -0.1 -0.1 -0.1
Europe and Central Asia 2.3 2.1 3.0 3.5 0.5 -0.2 0.0
Latin America and Caribbean 1.5 -0.7 0.1 2.3 -0.4 -1.0 0.0
Middle East and North Africa 2.5 2.5 5.1 5.8 0.2 0.7 0.7
South Asia 6.8 7.0 7.3 7.5 -0.1 -0.1 0.0
Sub-Saharan Africa 4.6 3.4 4.2 4.7 -0.3 -0.3 -0.2

Diminishing Expectations
10
Change in growth forecast for 2020 from 2010-2015
Source: World Bank
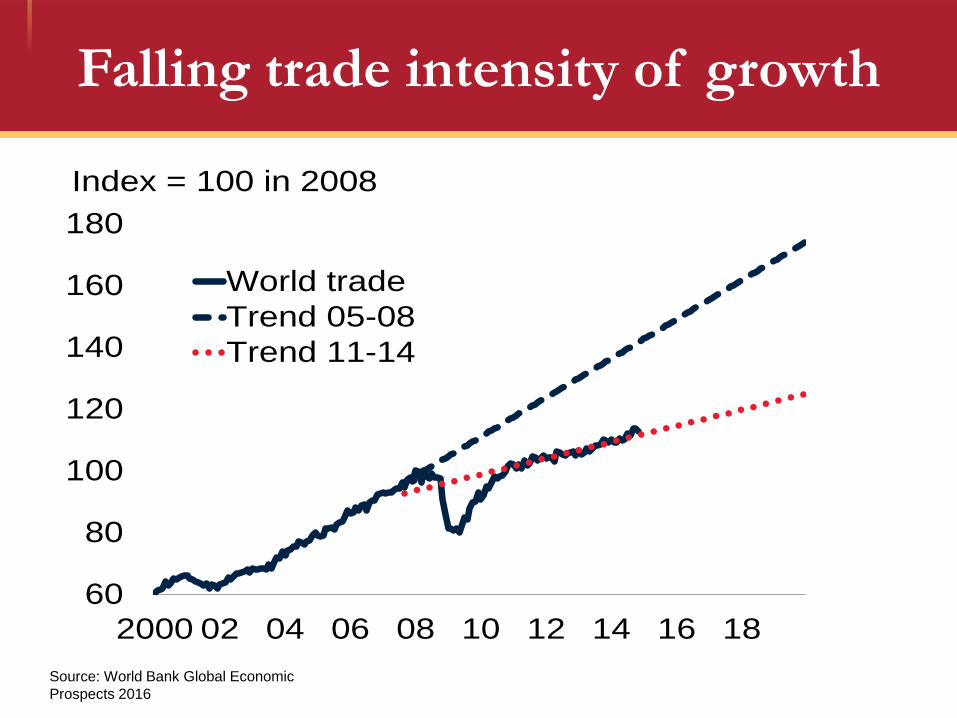
Falling trade intensity of growth
60
80
100
120
140
160
180
2000 02 04 06 08 10 12 14 16 18
World trade
Trend 05-08
Trend 11-14
Index = 100 in 2008
Source: World Bank Global Economic
Prospects 2016

All that Debt
12Source: BIS

13
FED expected to move up
Individual FED Board Member’s projection of
the Federal Funds Rate, percent
Source: Federal reserve board, Financial Times

A SLOWING, CHANGING
CHINA
14

Ties that Bind
15
84%
35%
45%
50%
25%
0%
10%
20%
30%
40%
50%
60%
70%
80%
90%
Exports (2015) Imports (2015) Tourists (2015) Registered foreigncompanies (2014)
FDI (2005-13)
China’s share in Mongolia’s key economic variables

Mongolia’s dramatic export shift
16
0%
10%
20%
30%
40%
50%
60%
70%
80%
90%
100%
1992 1993 1994 1995 1996 1997 1998 1999 2000 2001 2002 2003 2004 2005 2006 2007 2008 2009 2010 2011 2012 2013 2014
Mongolia’s export share per destination, percent
China European Union United States Russia Japan Switserland Kazakhstan Other
Source: IMF Directions of Trade

China’s New Normal
Note: World Bank projections. These assume progressive implementation of reforms announced in the 3rd Plenum of
the Central Committee of the 18th Party Congress
0
1
2
3
4
5
6
7
8
2014 2015 2016 2017 2018 2019 2020
private consumption government consumption gross capital formation next exports GDP
GDP Growth Rate and Percentage Point Contribution to Growth

Growing less, but adding more
Change in GDP, Absolute Value, bn. 2005 US$
-1000
-500
0
500
1000
1500
1981 1986 1991 1996 2001 2006 2011
China US Japan Eurozone
Bn. 2005$
Source: World Bank Estimates

The Largest Manufacturer in the World
0
2E+12
4E+12
6E+12
8E+12
1E+13
1.2E+13
1.4E+13
2000 2005 2010 2012 2013
China European Union Japan India United States ROW
Current US$
Manufacturing Value Added Current $
Source: World Development Indicators

Largest Exporter
0
2E+12
4E+12
6E+12
8E+12
1E+13
1.2E+13
1.4E+13
1.6E+13
1980 1985 1990 1995 2000 2005 2010 2012 2013
China France Germany Japan India Korea, Rep. United States United Kingdom Rest of EU
Current US$
Exports of Goods and Services, Current US$
Source: World Development Indicators

Largest Energy User
0
2000000
4000000
6000000
8000000
10000000
12000000
14000000
1980 1985 1990 1995 2000 2005 2010 2012
China European Union Japan India United States ROW
Kiloton coal eq.
Energy Use, Kilotons of Coal Equivalent
Source: World Development Indicators

Largest Consumer of many Commodities
Source: World Economic Forum based on BP Statistical review of World Energy 2015, , World Bureau of Metal Statistics, US
Department of Agriculture, JP Morgan, Wall Street Journal,

Services now more important than
Industry
39
40
41
42
43
44
45
46
47
48
49
200
0
200
1
200
2
200
3
200
4
200
5
200
6
200
7
200
8
200
9
201
0
201
1
201
2
201
3
201
4
Service Industry
Percent of GDP
Source: National Bureau of Statistics

Though structural change in real terms
is less pronounced
0
0.1
0.2
0.3
0.4
0.5
0.6
1966 1971 1976 1981 1986 1991 1996 2001 2006 2011
Agriculture Industry Services
Share of GDP, calculated at 2005 constant prices

China is still less urbanized than
expected on the basis of income
0
10
20
30
40
50
60
70
80
90
100
100 1000 10000 100000
China
China 1990
China 2000
China
2010
Income per capita, constant
Urbanization
Source: World Development Indicators and Staff Estimates

Urbanization will facilitate services
industry
0
10
20
30
40
50
60
70
80
0 10 20 30 40 50 60 70 80 90 100
Services value added (% of GDP)
Urban population (% total)
Taiwan, China (1962-2009) Japan (1955-2011)
Korea (1965-2011) China (1978-2011)

China’s exports becoming more
sophisticated
-4
-3
-2
-1
0
1
2
3
900 9000 90000
China 1995-2012
South Sudan
Qatar
Singapore
Malaysia
RussiaIndia
Brazi
Germany
Japan
USA
Economic Complexity Index
GDP Per Capita 2012 (2011 PPP$. Log Scale)
Source: AJG Simoes, CA Hidalgo. The Economic Complexity Observatory: An Analytical Tool for Understanding the Dynamics of Economic
Development. Workshops at the Twenty-Fifth AAAI Conference on Artificial Intelligence. (2011) and https://atlas.media.mit.edu/en/rankings/country/
accessed 9-2—2015
Note: ECI combines metrics of the diversity of countries and the ubiquity of products to create measures of the relative complexity of a country’s
exports

China’s exports becoming more
sophisticated
1995 2012
Source: AJG Simoes, CA Hidalgo. The Economic Complexity Observatory: An Analytical Tool for Understanding the Dynamics of Economic
Development. Workshops at the Twenty-Fifth AAAI Conference on Artificial Intelligence. (2011) and https://atlas.media.mit.edu/en/rankings/country/
accessed 9-2--2015

Quality rapidly catching up
29

China is becoming more innovative
0
100
200
300
400
500
600
700
800
900
1989 1992 1995 1998 2001 2004 2007 2010
Resident Patens Applications per 10000 Population
China India Malaysia Russia Germany USA UK Brazil

Rapid real appreciation reduced current
account surpluses
31
-2
0
2
4
6
8
10
12
14
1998
1999
2000
2001
2002
2003
2004
2005
2006
2007
2008
2009
2010
2011
2012
2013
2014
2015
Current Account
Percent of GDP
80
90
100
110
120
130
140REER (RHS)
Index, 2010 = 100
Source: World Bank Prospects group

More real appreciation to come
Source: World Development Indicators, Staff Estimates
0
0.2
0.4
0.6
0.8
1
1.2
1.4
1.6
1.8
700 7000 70000
Series2Series4
Domestic/International
Prices ("Real Exchange
Other countries 2013
China 1991-2013
Income per capita 2013, PPP $ log
USA
Korea
Japan
Australia
Burundi
Eurozo
Norway
SingaporQatar
LuxembourUK
Cuba
Macao,

Importance of external demand
declining
0
5
10
15
20
25
30
35
40
45
50
1980 1985 1990 1995 2000 2005 2010
Eurozone
China
Japan
Exports as a share of
GDP, Percent
Source: WDI

Real estate leading the investment
slowdown
0
5
10
15
20
25
30
35
40
2005 2006 2007 2008 2009 2010 2011 2012 2013 2014 2015
Fixed Asset Investment, yoy % FAI: Real Estate, yoy %
Source: National Bureau of Statistics through
CIEC
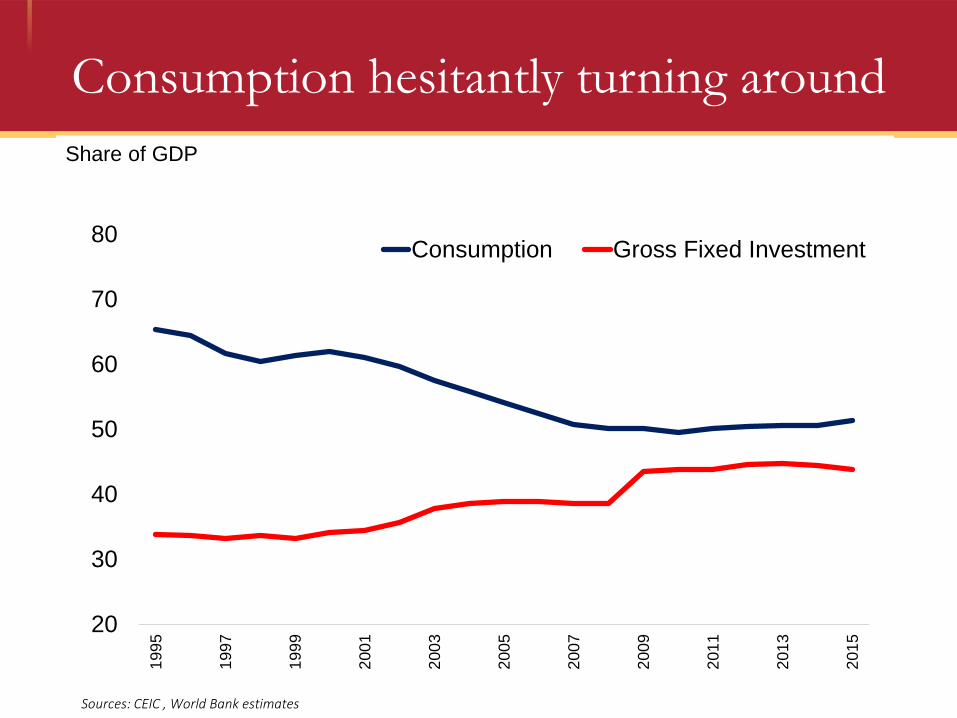
Consumption hesitantly turning around
Sources: CEIC , World Bank estimates
20
30
40
50
60
70
80
199
5
199
7
199
9
200
1
200
3
200
5
200
7
200
9
201
1
201
3
201
5
Consumption Gross Fixed Investment
Share of GDP

Household Income Share Increasing
Sources: CEIC , World Bank estimates
40.0%
45.0%
50.0%
55.0%
60.0%
65.0%
70.0%
1992 1993 1994 1995 1996 1997 1998 1999 2000 2001 2002 2003 2004 2005 2006 2007 2008 2009 2010 2011 2012 2013
Household disposable income Wages

The Aftermath of a Credit Binge
10
15
20
25
30
35
40
2007 2007 2008 2008 2009 2009 2010 2010 2011 2011 2012 2012 2013 2013 2014 2014 2015
Aggregate financing (stock,% yoy) All loan (stock,% yoy)
Growth in outstanding total credit stock (% yoy)
Sources: CEIC
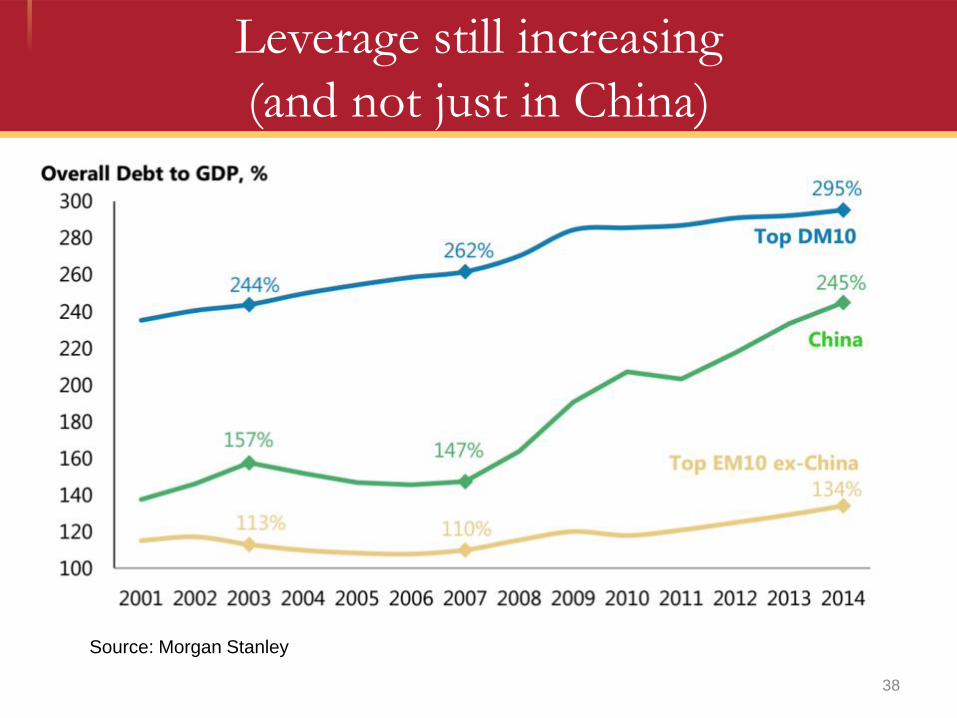
Leverage still increasing
(and not just in China)
38
Source: Morgan Stanley

39Source: Bloomberg
Corporate debt the biggest risk

Rapid Credit Growth Tends to Result in
Non-performing Loans
R² = 0.338
0
5
10
15
20
25
30
35
0.0 0.5 1.0 1.5 2.0 2.5 3.0 3.5 4.0
NP
Ls
to
Gro
ss
To
tal L
oa
ns
Actual/Predicted Private Credit to GDP
All other countries HIC G20 Non-Asia MIC East Asia MIC China

Cost of Environmental Damage
Rising
0
100
200
300
400
500
600
1990 1995 2000 2005 2010 2012
Carbon Dioxide Damage Energy Depletion Mineral Depletion
Net Forest Depletion Particulate Emission Damage
Bn. Current US$
Source: World Development Indicators

Though not as a share of GDP
0
2
4
6
8
10
12
1990 1995 2000 2005 2010 2012
Carbon Dioxide Damage Energy Depletion Mineral Depletion
Net Forest Depletion Particulate Emission Damage
Percent of Gross National
Income
Source: World Development Indicators

The Big Global Issue
0
0.1
0.2
0.3
0.4
0.5
0.6
0.7
0.8
0.9
1
0 5 10 15 20 25
China
US
EU
Sustainable Emission per Capita: 1.7 ton per year
to keep global warming<2 degrees (IPCC)
India
Latin America
Japan
Russia
South
IndonesiaCO2 emissions per capita
CO2 emissions per Unit of
GDP (2005 PPP $)
Source: World Development Indicators. Note: Emissions exclude change in land
use. Bubble indicates total emissions

China’s energy intensity is falling
Source: IEA Energy Outlook 2015

China’s copper intensity of GDP among
highest in the world
45Source: International Copper Studies Group

SPILLOVERS FROM CHINA’S
SLOWDOWN
46

47
-1.0
-0.8
-0.6
-0.4
-0.2
0.0
EM Global
BRICS China
Source: World Bank staff estimates.
Note: Cumulated impulse responses of EM and global growth at the two-year horizon. The shock size is such that BRICS growth declines by one percentage point on
impact. The shock size for China is calibrated such that its growth declines by exactly the same amount as BRICS at the end of two years. Solid bars denote the median
and the error bars denote the 33-66 percent confidence bands.
Large Spillovers from Slowing BRICS
Decline in BRICS and China Growth on Other Emerging Markets and World (Percentage point)

48
Decline in each of the BRICS growth (1 pp) on Global and Other EM growth(Percentage point)
Source: World Bank staff estimates.
Notes: Cumulated impulse responses at the end of two years due to a one percentage point decline on impact in China growth. EM excludes BRICS. Global is GDP-
weighted average of BRICS, EM, FM, and G7 responses. Bars represent medians, and error bars 16-84 percent confidence bands.
-0.8
-0.6
-0.4
-0.2
0.0
0.2
0.4
Global EM excl. BRICS
China Russia Brazil India South Africa
China a Source of Global Spillovers

49
Slowing China Affects Commodity Exporters More
Decline in China Growth (1 pp) on Emerging Markets Growth(Percentage point)
Source: World Bank staff estimates.
Left: Cumulated impulse responses of GDP growth, at the two year horizon, due to a one percentage point decline in China growth. For each group, the figures refer to the cross-sectional
average response across all the countries in that group.
-1.0
-0.8
-0.6
-0.4
-0.2
0.0
Commodity exporter Commodity importer

ANNEX: RECENT FINANCIAL
MARKET VOLATILITY
50
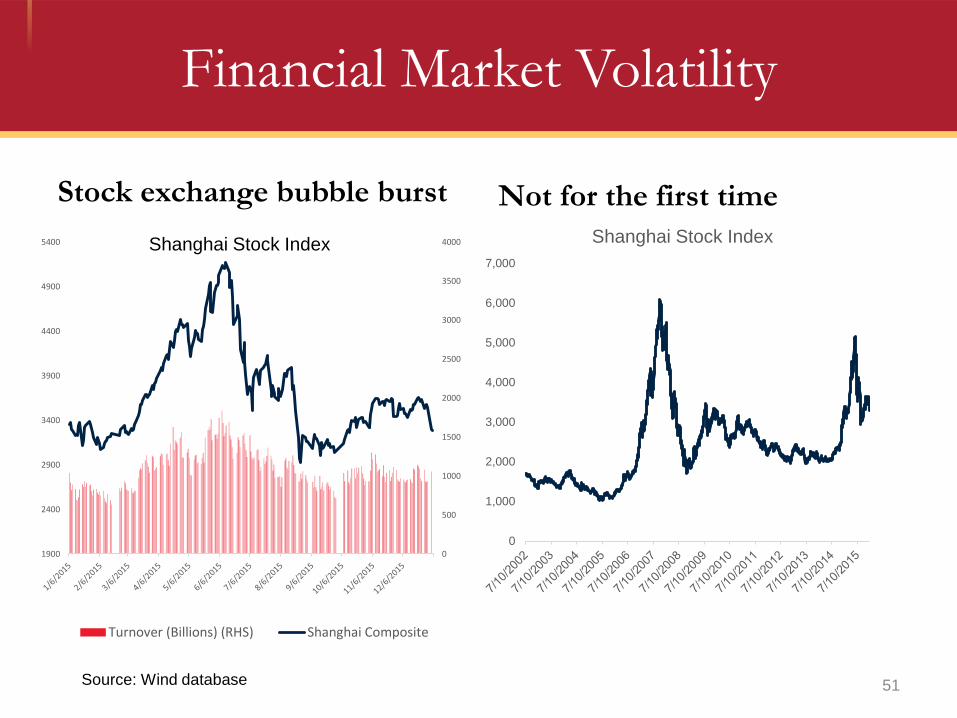
Financial Market Volatility
Stock exchange bubble burst Not for the first time
51
0
500
1000
1500
2000
2500
3000
3500
4000
1900
2400
2900
3400
3900
4400
4900
5400
Turnover (Billions) (RHS) Shanghai Composite
0
1,000
2,000
3,000
4,000
5,000
6,000
7,000
Shanghai Stock IndexShanghai Stock Index
Source: Wind database

Mixed results of circuit breakers
52
0
2000
4000
6000
8000
10000
12000
14000
16000
2800
2900
3000
3100
3200
3300
3400
3500
3600
09
:30
09
:56
10
:22
10
:48
11
:14
13
:09
13
:35
14
:01
14
:27
14
:53
09
:48
10
:14
10
:40
11
:06
13
:01
13
:27
13
:53
14
:19
14
:45
09
:40
10
:06
10
:32
10
:58
11
:24
13
:19
13
:45
14
:11
14
:37
09
:32
09
:58
10
:24
10
:50
11
:16
13
:11
13
:37
14
:03
14
:29
14
:55
09
:50
10
:16
10
:42
11
:08
13
:03
13
:29
13
:55
14
:21
14
:47
2016-01-04 2016-01-05 2016-01-06 2016-01-07 2016-01-08
Volume Price
Source: Wind database

Financial Market Volatility
Pressures on RMB/USD5.9500
6.0500
6.1500
6.2500
6.3500
6.4500
6.5500
6.6500
Spot rate Reference rate
Upper bound Lower bound
August 10-January 5
Driven by capital outflows
53Source: Wind database

Financial Market Volatility
And arbitrage opportunities
-0.14
-0.12
-0.1
-0.08
-0.06
-0.04
-0.02
0
0.02
0.04
But RMB Basket still in a band
0.93
0.95
0.97
0.99
1.01
1.03
1.05
1.07
RMB/USD RMB/Basket
Upper Bound Lower Bound
54
CNY/CNH spread, negative values indicate that onshore rate is higher
(stronger) than offshore rates
Source: Wind database

Financial Market Volatility
Interbank rate surprisingly calm
0.8
1.3
1.8
2.3
2.8
Per
cen
t
CN: Shanghai Interbank Offered Rate (SHIBOR): Overnight
CN: Shanghai Interbank Offered Rate (SHIBOR): 1 Week
Lots of volatility in Hong Kong
0.0
2.0
4.0
6.0
8.0
10.0
12.0
6/1/2015 7/1/2015 8/1/2015 9/1/2015 10/1/2015 11/1/2015 12/1/2015 1/1/2016
Per
cen
t
CNH HIBOR Fixing: TMA: Overnight
CNH HIBOR Fixing: TMA: 1 Week
55Source: CIEC Data

56
U.S. Monetary Policy:Slower Tightening Cycle; Gap Remains
U.S. Policy Interest Rates(Percent)
Source: World Bank, Bloomberg, US Federal Open Market Committee.
Note: Left panel: Past tightening cycles refers to average of Fed fund rate hikes during previous tightening cycles (December 86, March 88, February 94,
March 97, June 99, and June 04). Market expectations as of December 15.
0
1
2
3
4
Dec-14 Dec-15 Dec-16 Dec-17
FOMC expectations
Past tightening cycles
Gap between FOMC and Market Expectations(Basis points)
0
40
80
120
160
Ma
r-1
4
Ju
n-1
4
Sep
-14
Dec
-14
Mar-
15
Ju
n-1
5
Sep
-15
Dec
-15
2016
2017

57
Private Debt and Credit Growth
in Emerging Markets
Source: World Bank, International Monetary Fund, Bank for International Settlements.
Left panel: Weighted-average of debt-to-GDP ratios of households and non-financial corporations in Brazil, Russia, India, South Africa, Mexico, Indonesia, Malaysia, and Turkey. Right
panel: EM with general government debt above 60 percent of GDP in 2015 include Brazil, Egypt, India, Hungary, Morocco, Pakistan.
Number of Emerging Markets with
Elevated Government Debt(Percent, share of countries)
Financial Market Turbulence: Elevated Debt
(Percent of GDP, percent)
10
15
20
25
80
90
100
110
120
130
2010 2011 2012 2013 2014 2015
Private debt
Credit growth (RHS)
0
20
40
60
80
Debt >
40% of GDP
Debt >
60% of GDP
2007 2015