Embed Size (px)
Citation preview


Alan Coleman, CEO Wolfgang Digital
After many weeks of cleansing data, crunching numbers, distilling insights, constructing sentences and then double and triple checking copy, I’m delighted to bring you Wolfgang Digital’s 2017 E-Commerce Benchmark KPI Study. This is our gift to the global e-commerce industry. The objective of the study is to reveal the state of play in the industry over the last 12 months and ultimately to help digital marketers make better digital marketing decisions.
I hope you learn as much reading it as we learned putting it together.
H o w r y a

C O N T E N T S
02
05
09
12
15
03
06
10
13
04
07
11
14
Introduction
What Sources Generate Most Traffic
Does Site Speed Matter?
Assisted Conversions
Million Euro Question
The Data
What Sources Generate Most Revenue
What Are The Average On-site Engagement Metrics
Commercial Metrics: AOV And Conversion Rates
TL;DR
What Devices Are People Using To Browse And Buy
Typical Paths To Purchase
What High Performance E-Commerce Websites Do Differently
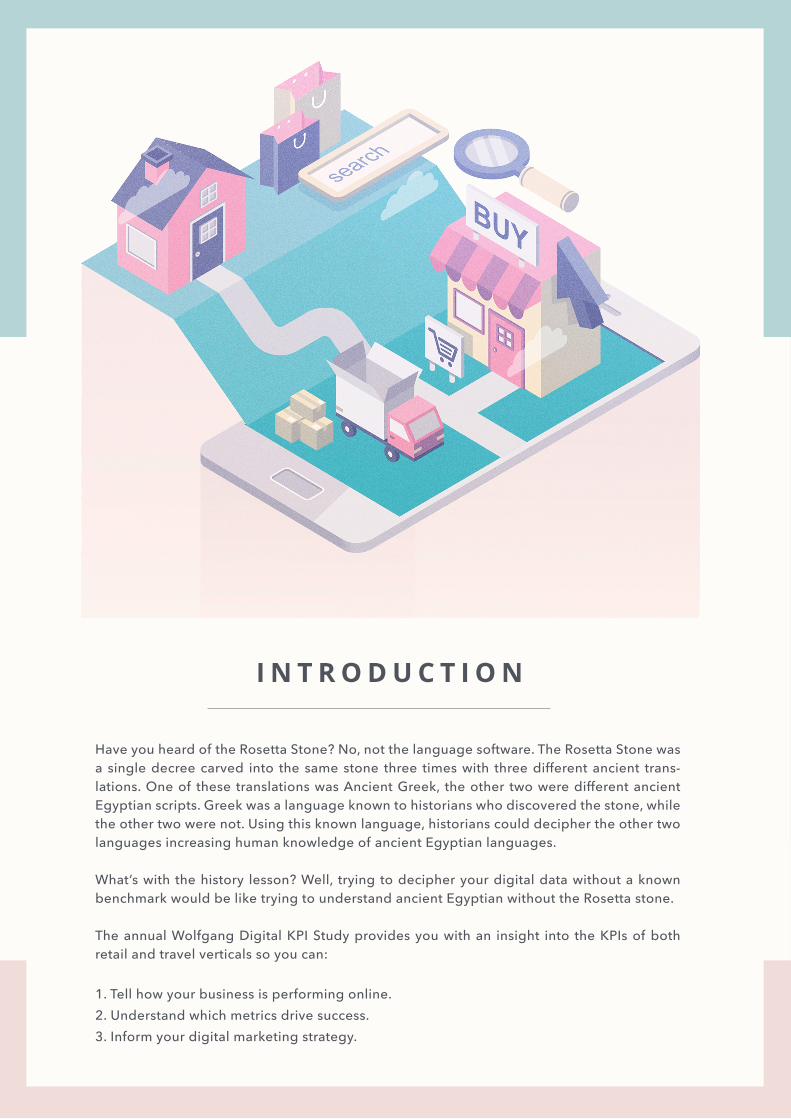
I N T R O D U C T I O N
Have you heard of the Rosetta Stone? No, not the language software. The Rosetta Stone was a single decree carved into the same stone three times with three different ancient trans-lations. One of these translations was Ancient Greek, the other two were different ancient Egyptian scripts. Greek was a language known to historians who discovered the stone, while the other two were not. Using this known language, historians could decipher the other two languages increasing human knowledge of ancient Egyptian languages.
What’s with the history lesson? Well, trying to decipher your digital data without a known benchmark would be like trying to understand ancient Egyptian without the Rosetta stone.
The annual Wolfgang Digital KPI Study provides you with an insight into the KPIs of both retail and travel verticals so you can:
1. Tell how your business is performing online.2. Understand which metrics drive success.3. Inform your digital marketing strategy.

Our study is based on data contributed by participant e-commerce sites between 1 July 2016 and 30 June 2017. Our dataset consists of:
143 million sessionsand€447 million in online revenue
The overall number of participants has increased by 58%. We’re delighted to be working with an even bigger sample size as this means more accuracy than ever before.
Throughout the study, we adopt last-click revenue attribution.
Our retail contributors come from many walks of life including fashion, electrical, jewelers, department stores, pharmacies and more. To dig deeper, retail is further broken out into online only and multichannel sub-categories. Our research over the years has shown these two subsets display distinct differences. This year we’ve uncovered a third category of online retailer that displays dramatically different behaviour: online food ordering. This category is made up of grocery and fast food delivery websites. We’ve broken this out into a third subset.
Contributors to the study hailing from the travel vertical are predominantly hotels. The dataset does include a small number of other travel related e-commerce sites such as attractions and events.
The KPIs for travel contributors are a good reflection of KPIs for ‘single item’ travel purchases. These KPIs are not so accurate a reflection for ‘package purchases’, which demon-strate very different consumer behaviour.
RETAIL CONTRIBUTORS
THE DATA
TRAVEL CONTRIBUTORS

E X E C U T I V E S U M M A R Y : T L ; D R
3.Speed Matters.
There was a strong inverse correlation between average page
load time (-0.36) and revenue growth.
1.Customer purchase journeys
are growing longer.
The number of clicks required to generate €1,000,000 online has
grown by 12% in 12 months!
4.Sticky websites sell more.
Pages per session (0.25) correlated solidly with revenue growth.
6.Tablet shoppers love a bit
luxury.
Higher than average tablet ses-sions correlated very strongly with
high average order values (0.4).
5.Mobile is a Money Making
Machine.
Those who got more mobile page views (0.25) and more tablet page views (0.24) grew revenue faster.
2.Google remains the key driver
of the web.
The search giant generates 62% of all traffic and 63% of all revenue. However, its influence is waning as consumers’ paths to purchase
become more diverse. ‘Dark Traffic’ is very much on the rise.
Average Revenue Growth for participant websites is 32%. What
can we learn from the high per-formers by analysing other metrics correlation with revenue growth?
Let’s look for correlations with the research heavy
High-Value Transactions.

E X E C U T I V E S U M M A R Y : T L ; D R
9.Time Is Money.
The strongest correlation in study was between higher session dura-tions and conversion rate (0.60). This means by increasing time on site by 16% your conversion rate
will ramp up 10%!
8.CRM strategy pays dividends.
Those who get more traffic from email enjoy a higher AOV (0.24).
12.Dont shop while you’re hungry.
Conversion rates for food ordering sites are 15x those of typical retail
e-commerce!
10.The value of the loyal online
shopper.
Your best converting customers are always your returning loyal
customers. Typically they show up as direct traffic, high levels of
which correlated very strongly with conversion rates. direct (0.35)
7.The Power of Pinterest.
Websites with more Pinterest traffic enjoyed higher average
order values (0.22). This demon-strates Pinterest is a research engine NOT a social network.
Good news for digital marketers is Pinterest recently launched its self
service ad platform.
11.People Trust Google.
If Google places you top of the organic list there is a transferral
of trust from Google to you. High levels of Google organic traffic en-joyed a savagely strong correlation
with conversion rates. (0.48)
Let’s analyse correlations with the almighty Conversion Rate.

W H A T S O U R C E S G E N E R A T E M O S T T R A F F I C
% SESSIONS BY SOURCE/MEDIUM
Direct traffic completes the top-three sources, with an 18% slice of the pie.
Direct traffic typically consists of three different types of site visitor:
Returning visitors and returning customers: A high proportion of direct traffic is a good indicator of brand loyalty.
Advertising: This includes people who’ve seen your above the line marketing, such as TV ads. A contributing factor is changing consumer behaviour as 74% of people now multiscreen (Source- Google Consumer Barometer). Multiscreening means people are watching TV and on the internet at the same time, meaning your audience’s attention can migrate from your TV ad to your mobile website in an instant.
Dark Traffic: Dark Traffic occurs when Google Analytics doesn’t recognise a source by default. An example of this is the increasingly popular practice of people sharing links on WhatsApp. Clicks on these links in WhatsApp will appear in Google Analytics as Direct traffic.
Google is constantly playing catch-up with how people share content, tweaking Google Ana-lytics to show sources of traffic properly. Today, you can see Instragram traffic easily but at the start of 2016 this traffic was dark, just like WhatsApp traffic is now.
Google generates 62% of e-commerce website traffic. The composition of this traffic is primarily organic traffic (39%) while the remainder is generated through Google CPC (23%).
GoogleOrganic
GoogleCPC Direct Email
Face-book
Organic
Face-bookCPC
BingOrganic
YahooOrganic Others
Retail 38% 24% 18% 3% 3% 1% 1% 1% 12%
Multi-Channel 40% 24% 17% 4% 3% 0% 1% 1% 9%
Online Only 32% 23% 21% 1% 2% 2% 1% 0% 16%
Travel 45% 18% 20% 2% 2% 0% 2% 1% 10%
Overall 39% 23% 18% 3% 3% 1% 1% 1% 11%

W H A T S O U R C E S G E N E R A T E M O S T R E V E N U E
Where is the money coming from? Again, Google maintains the lion’s share when it comes to revenue generation with Google Organic and Google CPC bringing in 38% and 25% of all revenue respectively. That’s a combined 63% of all revenue.
Direct traffic contributes 18% and the increasing ‘long tail’ of ‘other websites’ contributing 11% of revenue.
Interestingly, email delivers three times as much revenue as Facebook on a last click basis.
GoogleOrganic
GoogleCPC Direct Email
Face-book
Organic
Face-bookCPC
BingOrganic
YahooOrganic Others
Retail 37% 24% 18% 4% 1% 0% 2% 1% 12%
Multi-Channel 38% 24% 17% 5% 1% 0% 2% 1% 11%
Online Only 35% 25% 19% 2% 1% 0% 2% 1% 14%
Travel 41% 28% 15% 1% 1% 0% 3% 1% 8%
Overall 38% 25% 18% 3% 1% 0% 2% 1% 11%

This is finally the year of mob… sorry, it’s a running joke at this stage.
Joking aside, even though it has been done to death, it’s important to highlight that mobile is dominating when it comes to raw traffic.
2017 is the first year where our KPI study has found mobile laying claim to more sessions than desktop and tablet combined.
However, there are still few shoppers purchasing on mobile, evident through this 52% of share in traffic being chopped down to 26% share of revenue.
While this is a 19% increase in revenue share since last year for mobile, it pales in comparison to desktop performance.
According to our data, desktop generates 61% of all online revenue, desktop users are 164% more likely to convert than those browsing on mobile. To top it off, when desktop users convert, they spend an average of 20% per order more than mobile shoppers.
However, that isn’t the whole story. Google’s own research shows 90% of conversions hap-pen across multiple devices, yet Google Ana-lytics struggles to measure these cross-device conversions. The big loser here is Facebook, Google’s arch-rival for ad spend. 9 out of 10 Facebook sessions are mobile, leaving Face-book’s contribution to conversion dramatically understated in Google Analytics.
Google is promising great advancements in analytics attribution later this year. It will be interesting to see if this increased visibility ex-tends to cross- device conversions and social’s role in conversion.
W H A T D E V I C E S A R E P E O P L E U S I N G T O B R O W S E A N D B U Y
Mobile
Tablet
Desktop
% SESSION BY DEVICE
52%
12%
36%
Tablet
Desktop
% REVENUE BY DEVICE
Mobile
13%61%
26%

Desktop
35%
53%
12%
Desktop
Mobile
Tablet
% RETAIL SESSIONS BY DEVICE % RETAIL REVENUE BY DEVICE
59%
12%
28%
Desktop
Tablet
Mobile
% TRAVEL SESSIONS BY DEVICE % TRAVEL REVENUE BY DEVICE
45%
72%
46%
16%
9%
12%
Desktop
Desktop
Mobile
Mobile
Tablet
Tablet

D O E S S I T E S P E E D M A T T E R ?
Usain Bolt ran his world record-breaking 100 meter sprint in 9.58 seconds. A gun-shot sounded, Bolt’s reaction time out of the blocks was 0.146 of a second, he accelerated to a stunning 44 km/h in just 41 steps and captured the world’s attention. The differ-ence between world record holder Bolt and his nearest rival was a mere 0.13 of a second.
The moral of this story? Speed matters and shaving what may appear to be insignificant milliseconds off any element of your time can lead to seismic results. The same rings true for your website.
Our study revealed a shockingly highAverage Page Load Time at 6.06 seconds.
Google and internet users expect pages to load within 2 seconds. 6.06 seconds must feel like an eternity for people on the web.
In fact, according to our correlation calcula-tion reducing this average load time by 1.6 seconds would increase annual revenue growth by 10%.
We found Average Server Response time is 1.04 seconds
Reducing Average Server Response Time by 0.37 of a second will increase conversion rate by 10%.
Google and Facebook have publicly stated that they will favour sites that load and react faster.
Optimising for site speed is a no brainer people.

W H A T A R E T H E A V E R A G E O N - S I T E E N G A G E M E N T M E T R I C S
Let’s look at on-site metrics in two categories:
‘engagement metrics’ and then those critical ‘conversion metrics’.
First up, engagement metrics:
Pages / Sessions Session Duration Bounce Rate Page Load Time Server Response Time
Retail 5 3m 29s 38% 6.11s 1.11
Multi Channel 6 3m 45s 36% 6.27s 1.28
Online Only 5 3m 24s 44% 5.78s 0.75
Travel 4 2m 37s 35% 5.81s 0.67
Overall 5 3m 31s 38% 6.06s 1.04

Because Google Analytics struggles to measure cross-device conversions we can only measure conversion paths and lengths that occur on the same device. With this in mind, it’s safe to say actual conversion paths are longer than the data we’ve provided here.
The principal implication of longer paths to purchase is the increased importance of an ‘Audience Strategy’ to advertisers. Creating an online communications strategy in which messaging matures as a customer moves across multiple touch points closer to a conversion is a key action point for savvy digital marketers as we move towards 2018.
T Y P I C A L P A T H S T O P U R C H A S E
0.00%
1
2
3
4
5
6
7
8
9
10
11
12+
10.00% 20.00% 30.00% 40.00% 50.00%
Percentage of total Conversions
Percentage of total Conversions Value
CLICKS TO PURCHASE
0.00%
1
0
2
3
4
5
6
7
8
9
10
11
12
10.00% 20.00% 30.00% 40.00% 50.00% 60.00% 70.00%
Percentage of total Conversions Percentage of total Conversions Value
DAYS TO PURCHASE

A S S I S T E D C O N V E R S I O N S
How to read the Assisted Conversion figure:
Channel Grouping Assisted Conversions
Assited / Last Click /
Direct
Direct 59% 0.70
Paid Search 30% 1.16
Organic Search 38% 1.16
Email 6% 3.40
Social Networking 2% 2.41
Referal 6% 1.06
Display 2% 17.88
Other 3% 2.79
The stand out channels for delivering assisted conversions are:
Direct: As you might expect, Direct traffic contributes the highest proportion of assisted conversions. Direct traffic, consisting largely of returning visitors and returning customers who are already already aware of and interested in your brand are more likely to convert.
Google Organic and Paid Search: When you take Google as a single channel it’s the largest source of assisted conversions. Google drives 63% of all ‘last-click’ revenue so it’s expected to appear as a major contributor to assisted conversions.
Social Network performance in the table is fugazi. It’s a fake. We know social networks have become excellent at generating conversions over the last two years with the likes of DPAs and lead gen ads coming to the fore. The reason they appear to be underperforming is Google Analytics struggles to count cross-device conversions. Where do social clicks happen? On mobile. Where do conversions happen? On desktop. Google Analytics, by mistake or by design, is under-reporting on social’s role in conversion.
The percentages represent the proportion of assisted conversions attributed to this channel. They add up to more than 100% because there is more than one assisted conversion per conver-sion on average.
For example, a conversion could have Social, PPC and Organic touch points, where organic is the final touch point.
In this example, Organic is attributed the conver-sion and one assist is attributed to both Social and PPC.
Assisted conversions add up to 146% which means there are 1.46 assisted conversions for every conversion. From this figure we can also calculate that on average it takes 2.46 same device clicks to generate a conversion.

C O M M E R C I A L M E T R I C S : A O V A N D C O N V E R S I O N R A T E S
Avg. Conversion
RateAOV
Retail 1.39% €139
-Multi Channel 1.20% €137
- Online Only 1.81% €142
Travel 2.42% €392
Overall 1.56% €178
Avg. Conversion
RateAOV
Food Order Sites 21.23% €62.03
Retail’s Average Order Value weighed in at €139.
With an AOV of €392, our study’s travel sites enjoyed a 18% increase in AOV versus our study’s findings last year.The overall Conversion Rate for our KPI study is
1.56%. Digging a little deeper we can see online only retailers enjoy a conversion rate 51% higher than multichannel retailers.
Attribution of online activity leading to in-store conversions has been notoriously difficult for multichannel to address. Those untracked conversions contribute to the disparity in conversion figures.
WHAT IS AN AVERAGE CONVERSION RATE?
AVERAGE ORDER VALUE
There are moves being made by both Facebook and Google to measure in-store sales against online activity. We’ve reported on this for a small number of clients and found the range is 3:1 right up to 8:1 for in-store sales:online sales. This shows us that much of the commercial benefits from your digital marketing efforts are still invisible as they happen in-store. When businesses gain more clarity on the massive impact of online marketing on in-store sales digital marketing budgets will ramp up further

W H A T H I G H P E R F O R M A N C E E - C O M M E R C E W E B S I T E D O
D I F F E R E N T L Y
In the next section, our famous conversion correlation, we are going to analyse our 10,000 data points to get insights into what the high performance websites do differently.
We will analyse three different success metrics:
Revenue GrowthConversion RateAverage Order Value
A correlation shows the strength of a relationship between two metrics. They are measured on a scale from 0 to 1 where 0 means no correlation or relationship between the two metrics and 1 means a perfect correlation between the two metrics. A negative correlation indicates an inverse relationship between the two metrics, so as one decreases the other increases.
WHAT ARE CORRELATIONS?
R E V E N U E G R O W T H
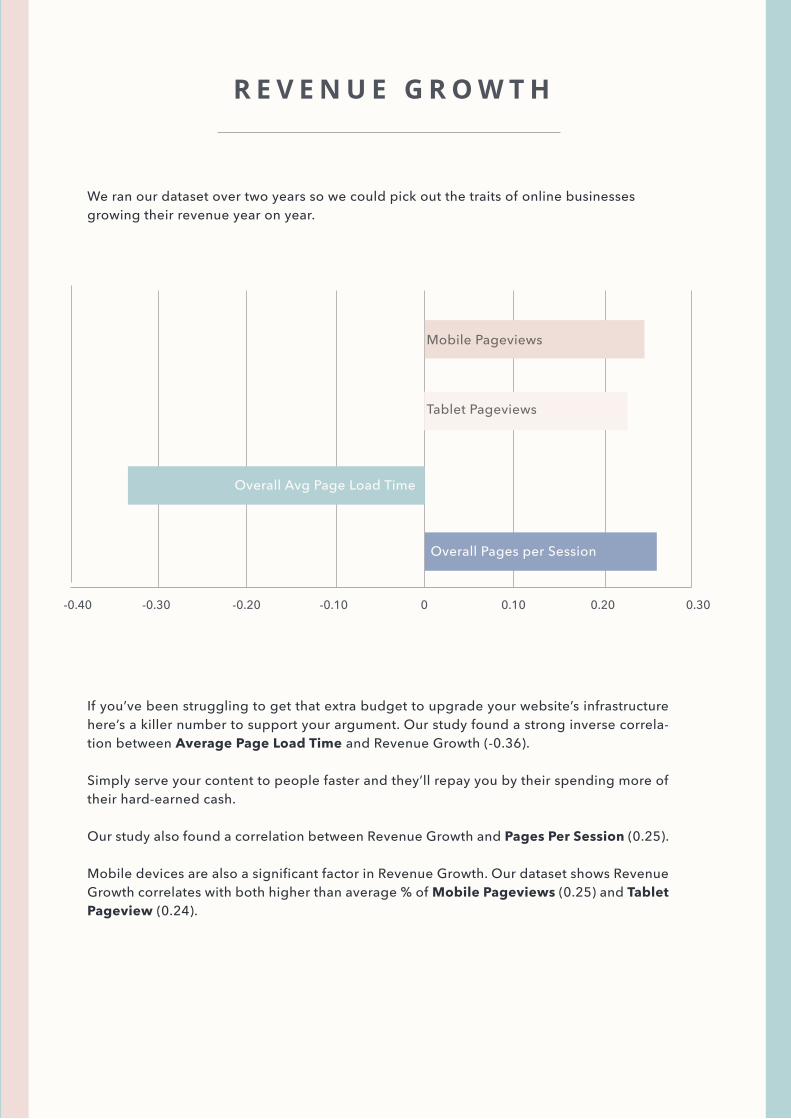
If you’ve been struggling to get that extra budget to upgrade your website’s infrastructure here’s a killer number to support your argument. Our study found a strong inverse correla-tion between Average Page Load Time and Revenue Growth (-0.36).
Simply serve your content to people faster and they’ll repay you by their spending more of their hard-earned cash.
Our study also found a correlation between Revenue Growth and Pages Per Session (0.25).
Mobile devices are also a significant factor in Revenue Growth. Our dataset shows Revenue Growth correlates with both higher than average % of Mobile Pageviews (0.25) and Tablet Pageview (0.24).
We ran our dataset over two years so we could pick out the traits of online businesses growing their revenue year on year.
0-0.10-0.20-0.30-0.40 0.10 0.20 0.30
Mobile Pageviews
Tablet Pageviews
Overall Avg Page Load Time
Overall Pages per Session

C O N V E R S I O N R A T E
TIME IS MONEY
The strongest correlation in our study is between Average Session Duration and Conversion rate (0.60). To increase your Conversion Rate by 10%, keep users on site for another 35 seconds. How do you increase time on site? We found websites that got more traffic from Facebook had higher time on site metrics (0.38)
DRIVING CONVERSIONS
Our study found sites with high volumes of Organic Traffic from Google enjoyed a higher conversion rate supported by a 0.48 correlation between the two metrics. Similarly, sites with high volumes of Direct Traffic saw a Conversion Rate correlation of 0.35.
SITE SPEED IS MORE IMPORTANT THAN EVER
People’s demand for info is increasing. Yet there are only so many hours in the day
0.20--0.20-0.40 0.40 0.60 0.80
OVERALL CONVERSION RATE
# Sessions facebook.com / referral
# Sessions Google / cpc
# Sessions Direct / (none)
Overall Avg. Server Response Time
Overall Avg. Session Duration
# Sessions Google / organic
available. If a website is slowing down somebody’s internet experience they are far less likely to spend precious time and money on a slow shopping experience.
This is evident through an inverse correlation between Average Server Response Time and Conversion Rate (-0.26).
THE LOYAL SHOPPER
The high street shopper is typically loyal to brands but not so much to retailers selling those brands. The online shopper is a different beast, once an online shopper has their card details stored with a merchant, has happily experienced their delivery and returns process they are fiercely retailer loyal. Direct traffic generally comprises of people who have shopped with you in the past and is an indicator of loyal, returning customers. As a result, there is a significant correlation (0.35) between the volume of direct traffic sessions on our participants’ websites and conversion rate.

A V E R A G E O R D E R V A L U E
TARGET THE TABLET USER
Tablet as a device often falls between the cracks due to the dominance of Desktop and Mobile. Our study did uncover a fascinating correlation of 0.40 between Average Order Value and the share of Tablet Sessions enjoyed by e-commerce sites. We believe the cause of this correlation is that in the era of the larger smartphones tablets are a luxury device owned by those with extra disposable income. Tablets are then used by those people while disposing of said extra income on high value online orders.
A regular theme in our KPI study is the often underestimated value of Email as a channel. This owned audience is extremely valuable to businesses and is often laden with brand-loyal followers. This is evident through a 0.24 correlation between Average Order Value and websites with a higher percentage share of traffic coming from email.
If you’re not doing so already, start building an email base and owning your audience. With GDPR around the corner, it’s important you do so with new regulations in mind and if you have a base it’s essential you’re prepared to protect it.
There added benefit of an owned email audience is the ability to execute high performance email target digital marketing campaigns.
AVERAGE ORDER VALUE (AOV)
--0.10-0.20-0.30 0.10 0.20 0.30 0.40
Overall Conversion Rate
Tablet Sessions %
% Sessions Bing / cpc
% Sessions Pinterest.com / referral
% Sessions / email

PINTEREST: A POWERFUL CONSUMER INTENT-BASED PLATFORM
Pinterest is often incorrectly classified as a Social Network. The reality is that Pinterest is an intent-driven research engine where users bookmark content for themselves often with a view to taking an action at a later date. This is reflected in a considerable correlation between the websites with a higher proportion of Pinterest traffic and Average Order Value (0.22).
BING FOR THE QUICK WIN
Sites with a higher share of Bing CPC traffic tend to see a higher AOV (0.22). These are likely sites with high-performing AdWords campaigns looking to expand their reach even fur-ther. It’s a logical step to make if you find your business in a saturated AdWords environment.
Bing has made the route into Bing Ads much easier, introducing a simple one click tool which will convert your AdWords campaigns into Bing Ad campaigns
HIGH AOV HURTS YOUR CONVERSION RATE
It might seem pretty logical, but for a second year running we’ve found a strong inverse correlation between Average Order Value and Conversion Rate (-0.27). Pricey purchases require more clicks.

[email protected] | www.wolfgangdigital.com
If you wanted hit a cool €1,000,000 turnover with your site, how many clicks would you need?
We ran the numbers and it turns out you’d need 360,775.
Here’s the full industry breakdown;
M I L L I O N E U R O Q U E S T I O N
Avg. Conversion Rate AOV Number of
TransactionsNumber of
Sessions Revenue
Retail 1.39% €139 7207 516,037 €1,000,000
Multi-Channel 1.20% €137 7280 605,884 €1,000,000
Online Only 1.81% €142 7054 388,961 €1,000,000
Travel 2.42% €392 2550 105,572 €1,000,000
Overall 1.56% €178 5613 360,775 €1,000,000

Study by Alan Coleman | Numbers by David O’Daly | Words By Martin Meany | Pictures by Jen Darcy


![Benchmarks - June, 2013 | Benchmarks Onlineit.unt.edu/sites/default/files/benchmarks-06-2013.pdf · Benchmarks - June, 2013 | Benchmarks Online 4/26/16, 8:52:25 AM] Skip to content](https://img.pdfslide.us/doc/110x75/5f9d6dd4a6e586755376b37d/benchmarks-june-2013-benchmarks-benchmarks-june-2013-benchmarks-online.jpg)