Embed Size (px)
Citation preview
Measuring Right: Case Study: KPIs &
Performance metrics to
sustain change.
Ivan Broodryk DIRECTOR QUALITY ASSURANCE, EMEA
Objectives
KPIs and Performance metrics to sustain change.
Choosing the right KPIs and Metrics for your transformation.
Tracking your performance and adjusting accordingly to sustain change.
Measuring Right
Index
Introduction
Terminology
Statement of the Case Study
OGSM Framework
KPIs & Metrics Selection
SWOT Analysis
Questions
About Me
Director Quality Assurance EMEA at Ecolab
Lead the EMEA Integrated Management System, and the Supply Chain Quality Teams in Multiple Plant Locations (26) in Europe, Middle East and Africa.
Our company is a trusted partner at more than one million customer locations, Ecolab is the global leader in water, hygiene and energy technologies and services that provide and protect clean water, safe food, abundant energy and healthy environments. Founded in 1923 and headquartered in St. Paul, Minn., Ecolab serves customers in more than 170 countries across North America, Europe, Asia Pacific, Latin America, the Middle East and Africa. Our global workforce of 44,000 associates helps protect people and vital resources by delivering comprehensive solutions to meet the unique needs of customers in the food, energy, healthcare, hospitality and industrial markets..
I hold a Bachelor of Commerce, specializing in Business Management from University of South Africa. I partcipated in various management development programs throughout my career, and are still learning.
My career reflects career growth through diverse industry sectors and international business environments.
I focus my energy on observing the world, and in generating ideas and possibilities, and active participation in making a change. I place a great importance on honesty and integrity. I generally take things seriously, but have a definite offbeat sense of humor and can be a lot of fun...
Terminology
KEY PERFORMANCE INDICATOR:
A performance indicator or key performance indicator (KPI) is a type of performance measurement.
Are quantifiable measurements, agreed to beforehand, that reflect the critical success factors of an organization.
METRIC:
Standards of measurement by which efficiency, performance, progress, or quality of a plan, process, or product can be assessed.
OGSM
Objective, Goals, Strategies and Measures.
OGSM Framework forms the basis for strategic planning and execution as well as subsequent reviews
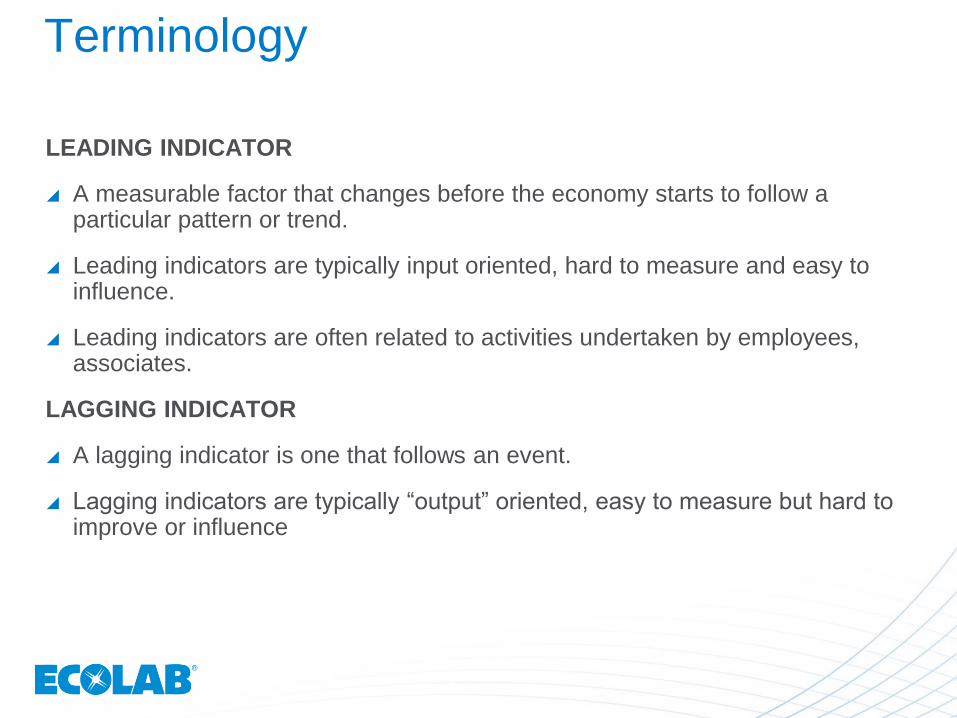
Terminology
LEADING INDICATOR
A measurable factor that changes before the economy starts to follow a particular pattern or trend.
Leading indicators are typically input oriented, hard to measure and easy to influence.
Leading indicators are often related to activities undertaken by employees, associates.
LAGGING INDICATOR
A lagging indicator is one that follows an event.
Lagging indicators are typically “output” oriented, easy to measure but hard to improve or influence
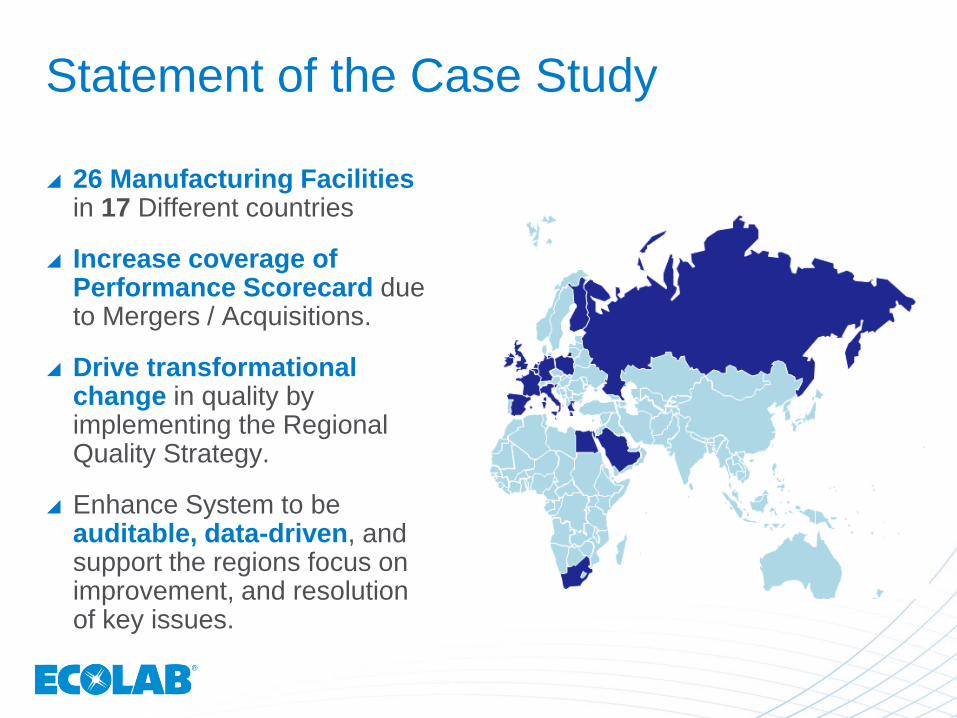
Statement of the Case Study
26 Manufacturing Facilities in 17 Different countries
Increase coverage of Performance Scorecard due to Mergers / Acquisitions.
Drive transformational change in quality by implementing the Regional Quality Strategy.
Enhance System to be auditable, data-driven, and support the regions focus on improvement, and resolution of key issues.
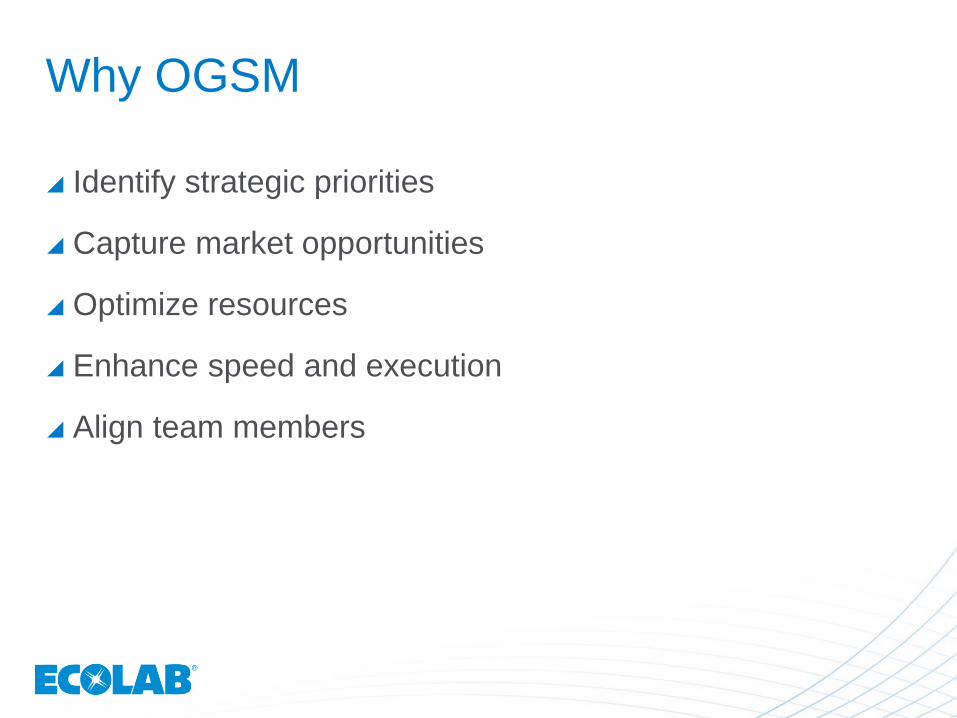
Why OGSM
Identify strategic priorities
Capture market opportunities
Optimize resources
Enhance speed and execution
Align team members
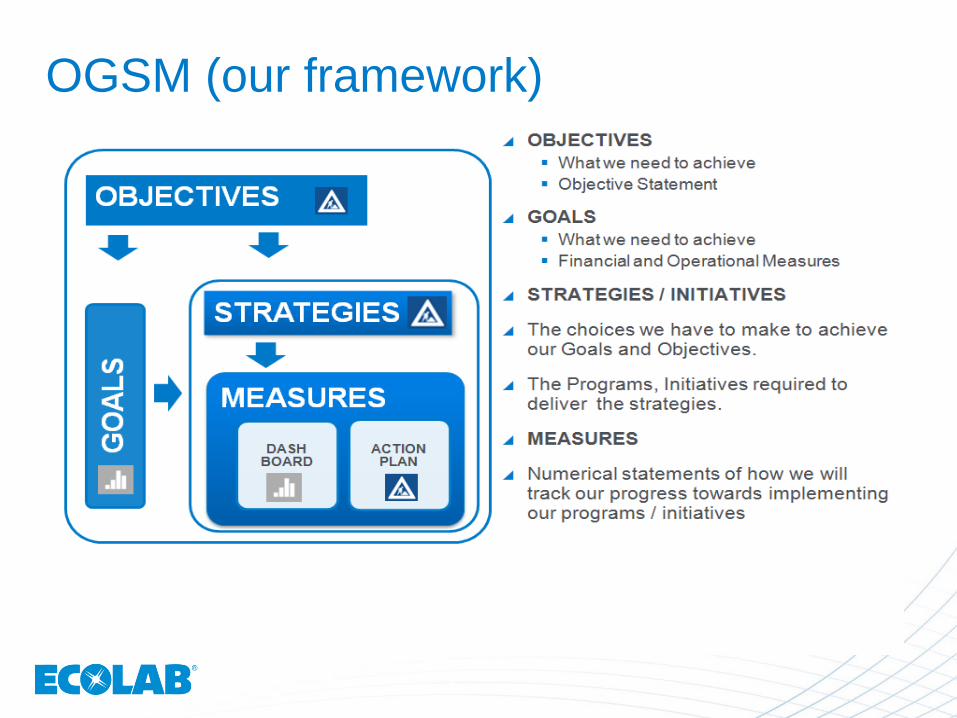
OGSM (our framework)
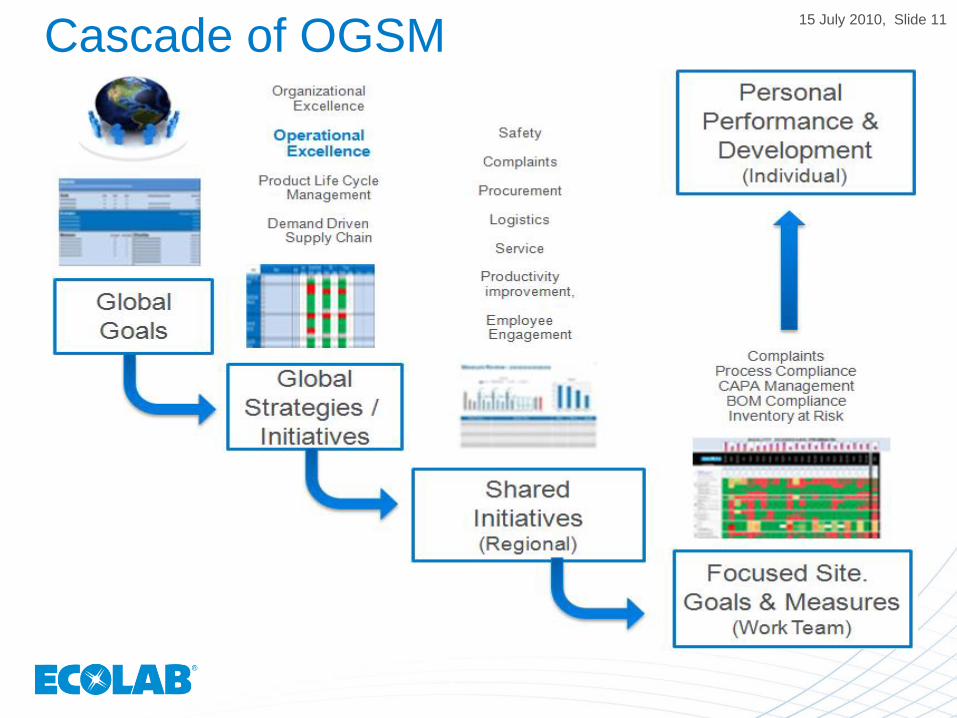
Cascade of OGSM 15 July 2010, Slide 11

13
KPIs & Metrics Selection
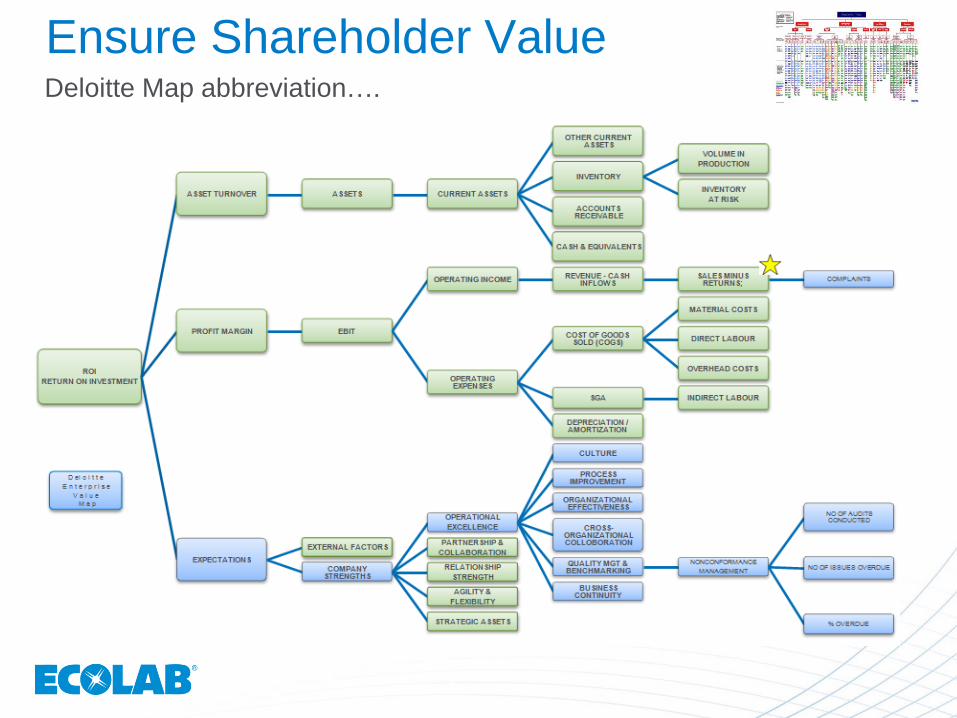
Ensure Shareholder Value Deloitte Map abbreviation….
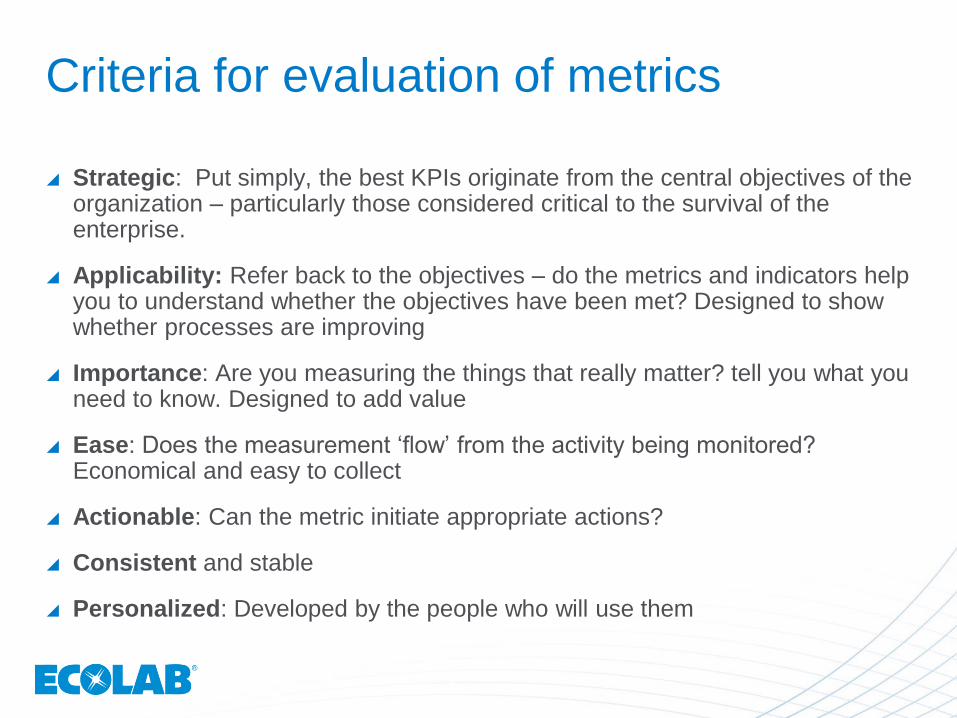
Criteria for evaluation of metrics
Strategic: Put simply, the best KPIs originate from the central objectives of the
organization – particularly those considered critical to the survival of the enterprise.
Applicability: Refer back to the objectives – do the metrics and indicators help you to understand whether the objectives have been met? Designed to show whether processes are improving
Importance: Are you measuring the things that really matter? tell you what you need to know. Designed to add value
Ease: Does the measurement ‘flow’ from the activity being monitored? Economical and easy to collect
Actionable: Can the metric initiate appropriate actions?
Consistent and stable
Personalized: Developed by the people who will use them
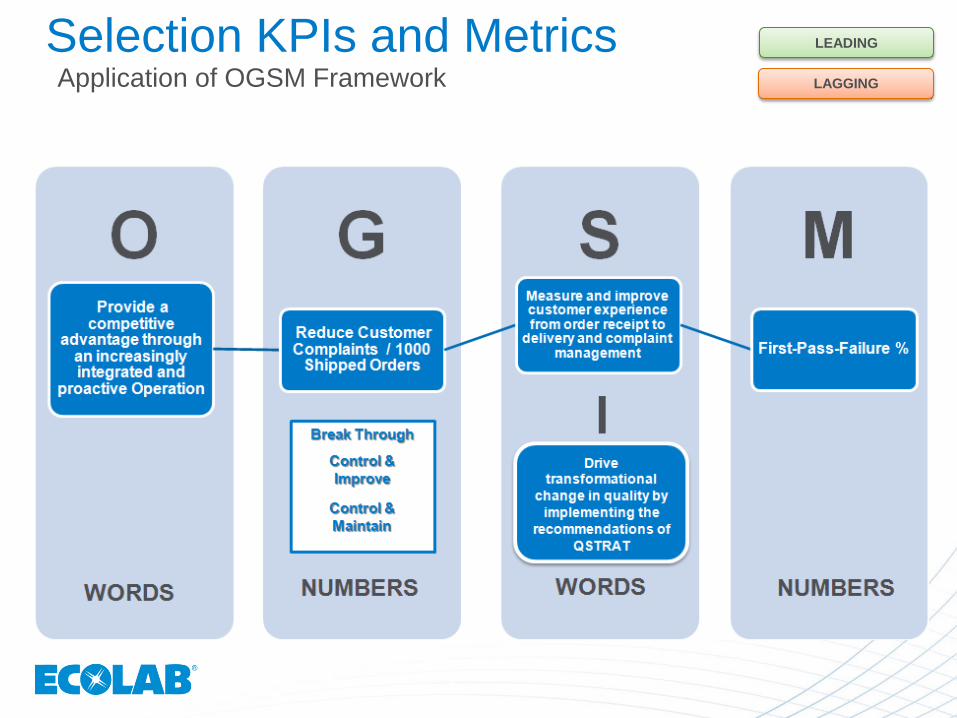
Selection KPIs and Metrics Application of OGSM Framework LAGGING
LEADING
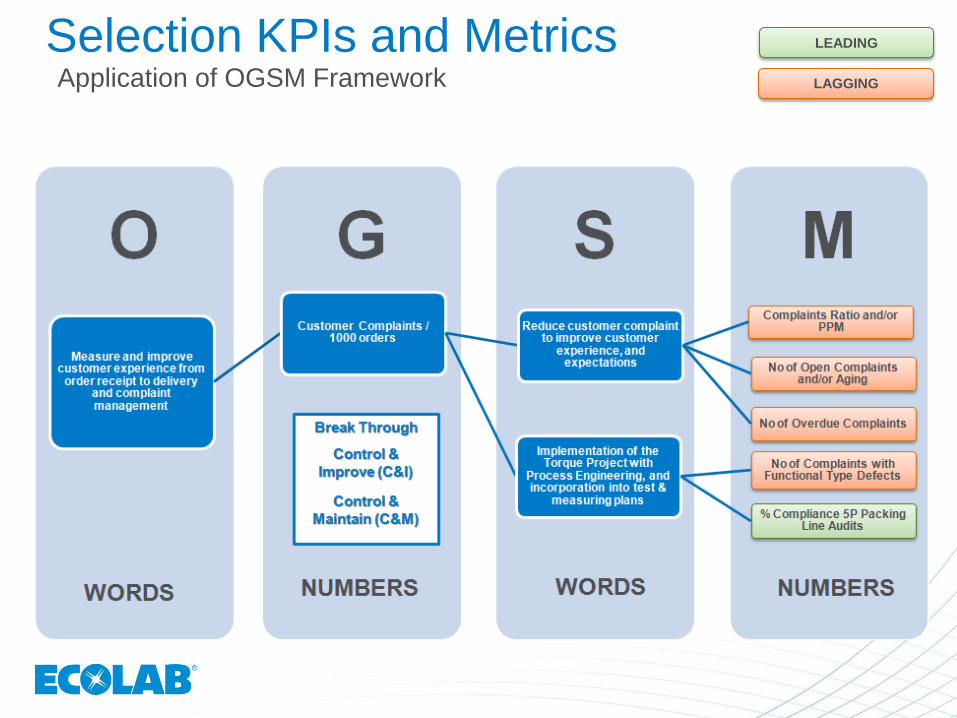
Selection KPIs and Metrics Application of OGSM Framework LAGGING
LEADING
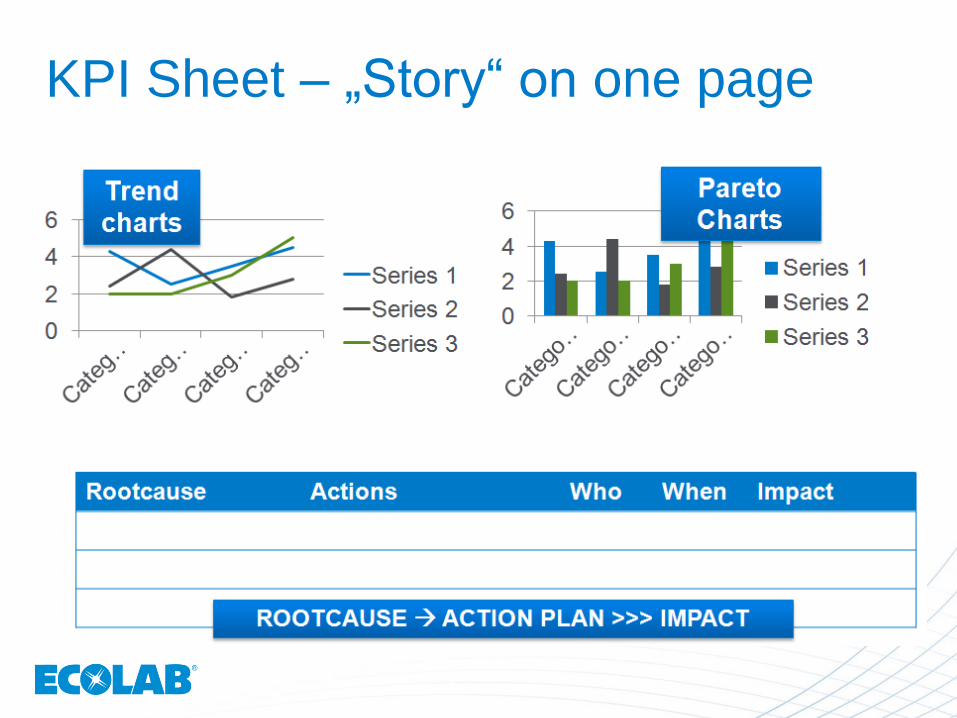
KPI Sheet – „Story“ on one page
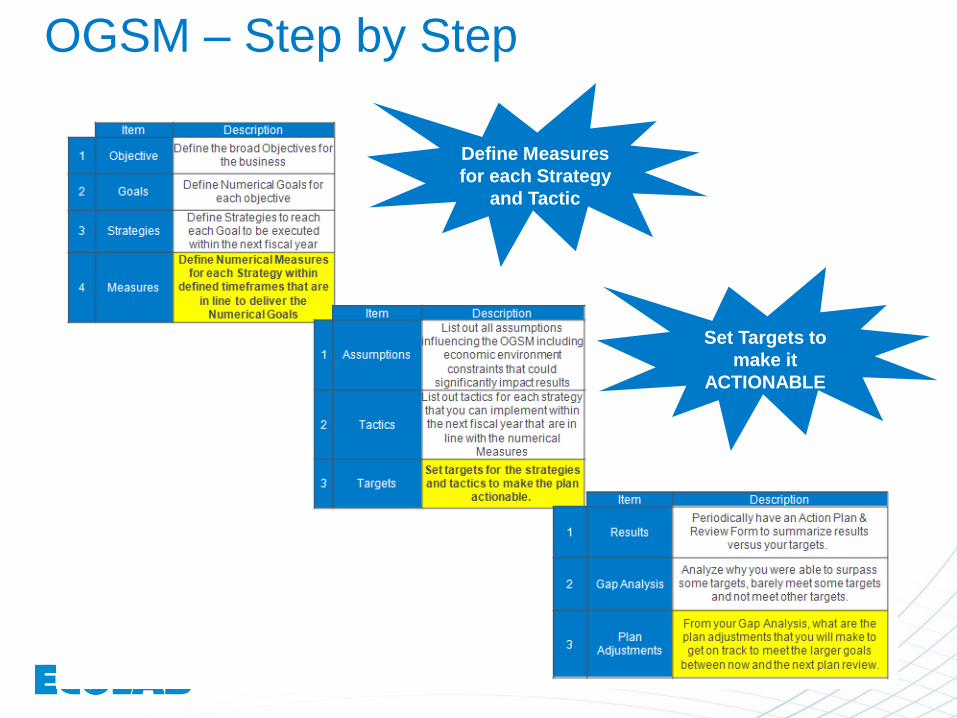
OGSM – Step by Step
Define Measures
for each Strategy
and Tactic
Set Targets to
make it
ACTIONABLE
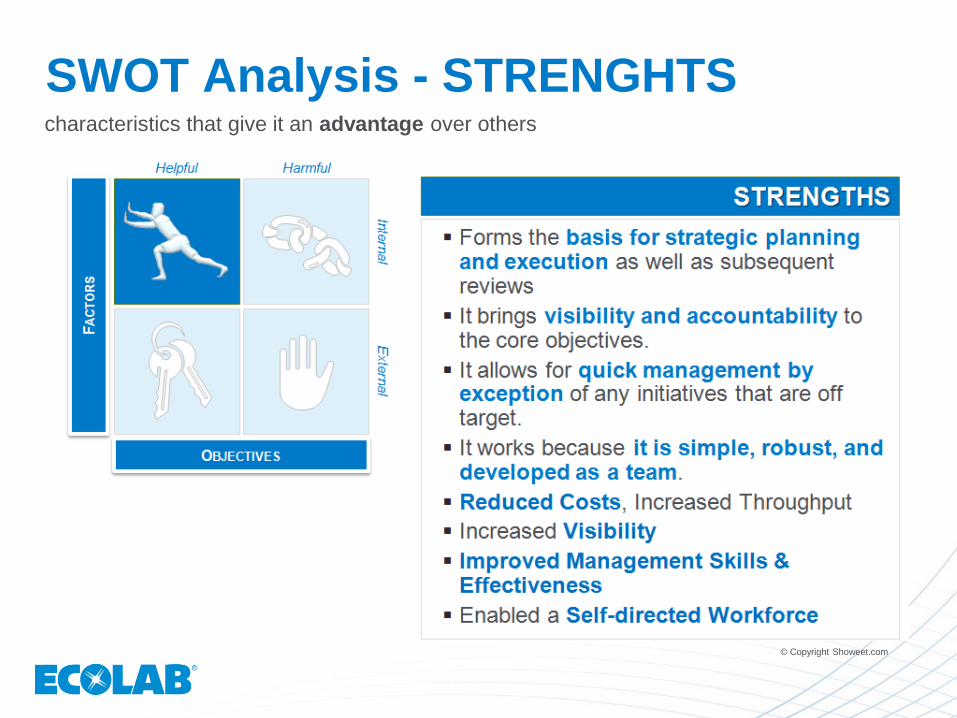
SWOT Analysis - STRENGHTS characteristics that give it an advantage over others
© Copyright Showeet.com
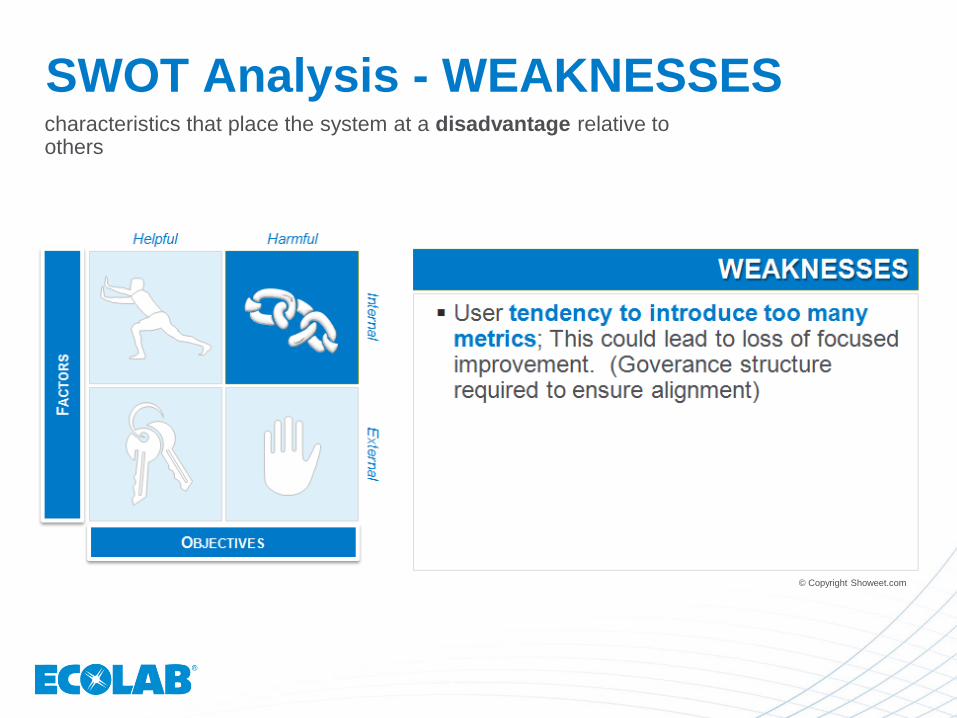
SWOT Analysis - WEAKNESSES characteristics that place the system at a disadvantage relative to others
© Copyright Showeet.com
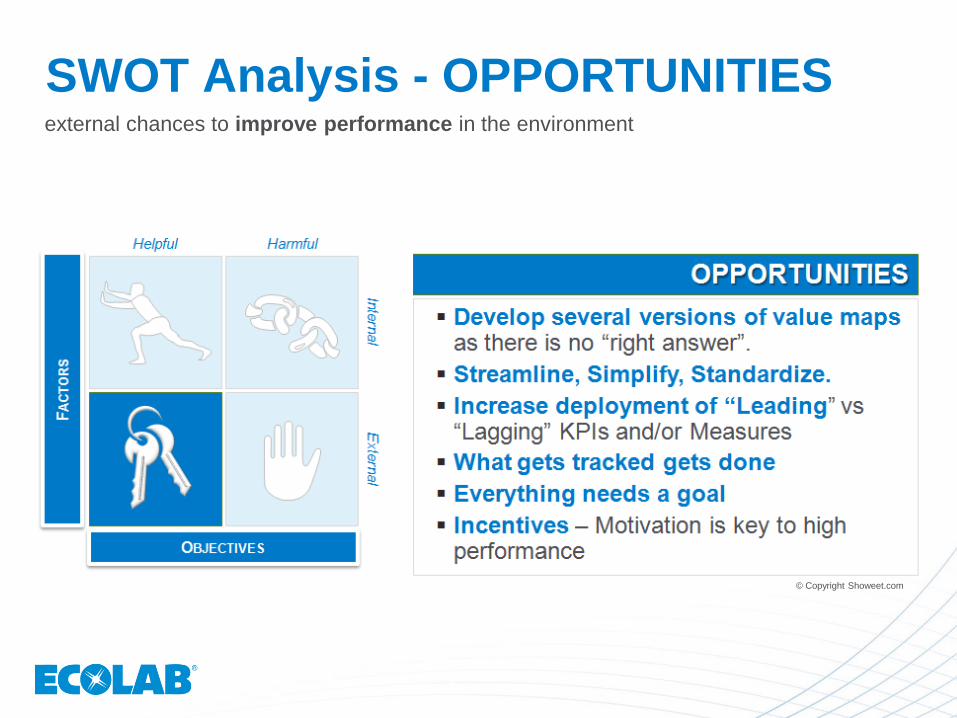
SWOT Analysis - OPPORTUNITIES external chances to improve performance in the environment
© Copyright Showeet.com
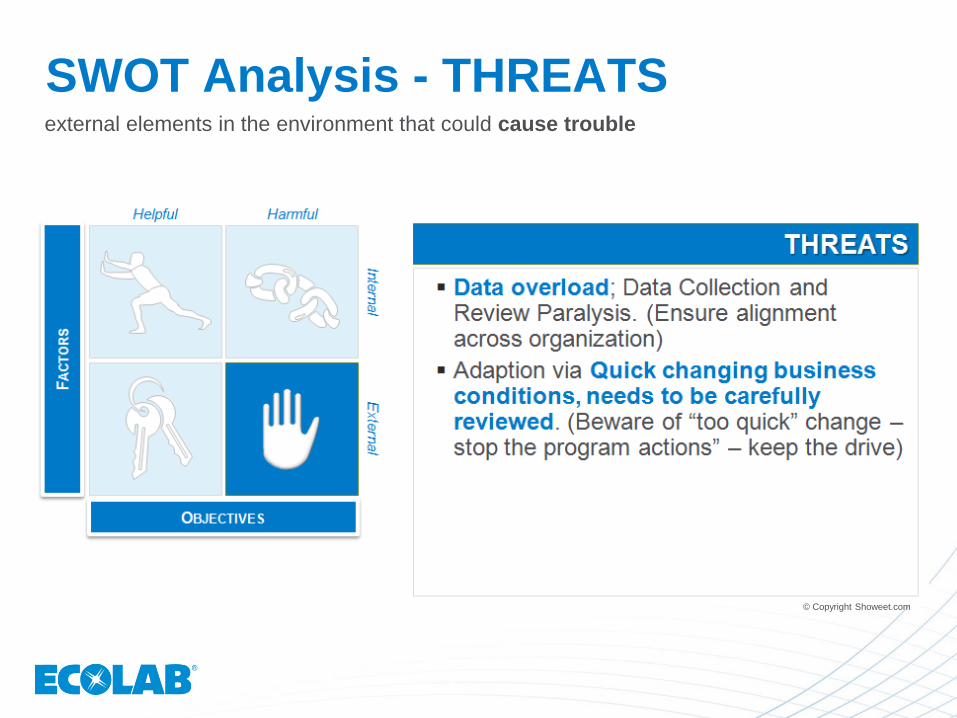
SWOT Analysis - THREATS external elements in the environment that could cause trouble
© Copyright Showeet.com
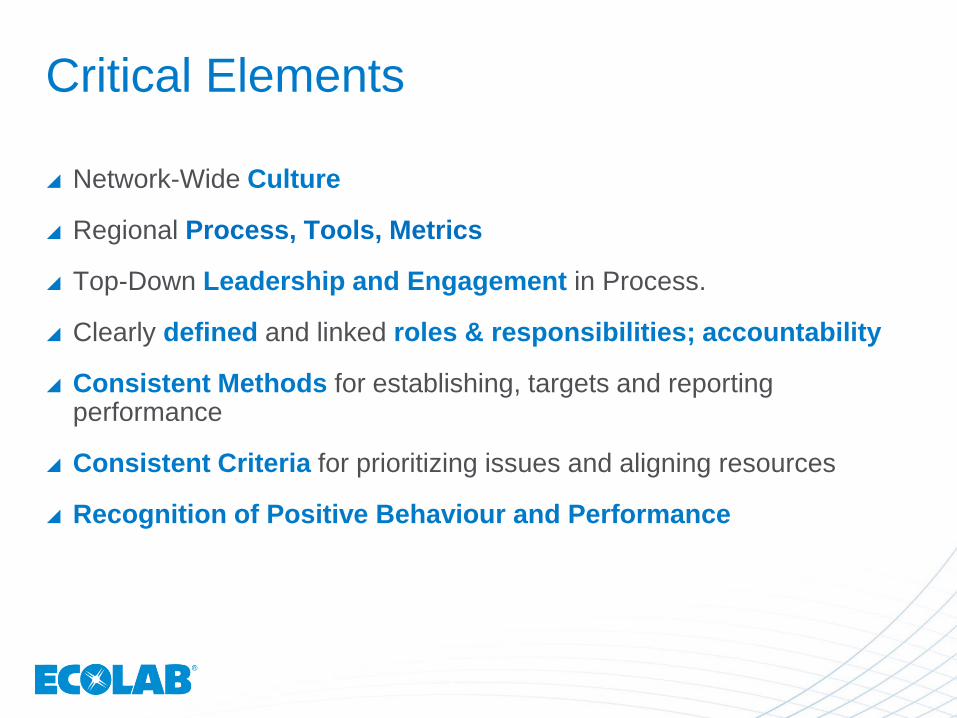
Critical Elements
Network-Wide Culture
Regional Process, Tools, Metrics
Top-Down Leadership and Engagement in Process.
Clearly defined and linked roles & responsibilities; accountability
Consistent Methods for establishing, targets and reporting performance
Consistent Criteria for prioritizing issues and aligning resources
Recognition of Positive Behaviour and Performance

27
KEY MESSAGES


33
Questions?
Ivan Broodryk DIRECTOR QUALITY ASSURANCE, EMEA
ECOLAB DEUTSCHLAND GMBH Ecolab-Allee 1, D-40789 Monheim am Rhein
T +49 217 35991882 M +49 172 2916 905
E [email protected] LinkedIN : de.linkedin.com/in/ivanbroodryk
Acknowledgements
OGSM Planning http://www.agenttech.com/newsletter/200901_BusinessPlanningLikePG.html
OGSM Model http://www.archpointconsulting.com/articles/strategic-planning-works-archpoint-ogsm-model
Deloitte Enterprise Value Map http://public.deloitte.com/media/0268/enterprise_value_map_2_0.pdf
http://www.aryng.com/blog/data-doesnt-speak-it-responds/?utm_source=Forbes&utm_medium=Partner&utm_campaign=Art
SWOT analysis format © Copyright Showeet.com