Embed Size (px)
Citation preview
May 12th, 2014
1Q14 Results
2
100/156/243
127 / 127 / 127
12/65/154
217 / 217 / 217
235/137/27
Disclaimer
The stand-alone and consolidated financial statements were prepared in accordance with the accounting
principles adopted in Brazil, which include corporation law, the pronouncements, instructions and
interpretations issued by the Accounting Pronouncements Committee (CPC) and the regulations of the
Securities and Exchange Commission of Brazil (CVM), combined with specific legislation issued by the
National Electric Power Agency (ANEEL). As the industry regulator, ANEEL has powers to regulate the
concessions. The results are usually presented in both IFRS and former formats in order to permit
comparisons with other periods. However, the results presented in “Regulatory” format are not audited.
ALUPAR uses the audited results based on the IFRS principles to declare dividends.
The forward-looking statements contained in this document relating to the business outlook, projections of
operational and financial results and the growth prospects of ALUPAR are merely projections, and as such
are based exclusively on management’s expectations for the future of the business. These expectations
depend materially on changes in market conditions and the performance of the Brazilian economy, the
sector and international markets and therefore are subject to change without prior notice.
3
100/156/243
127 / 127 / 127
12/65/154
217 / 217 / 217
235/137/27
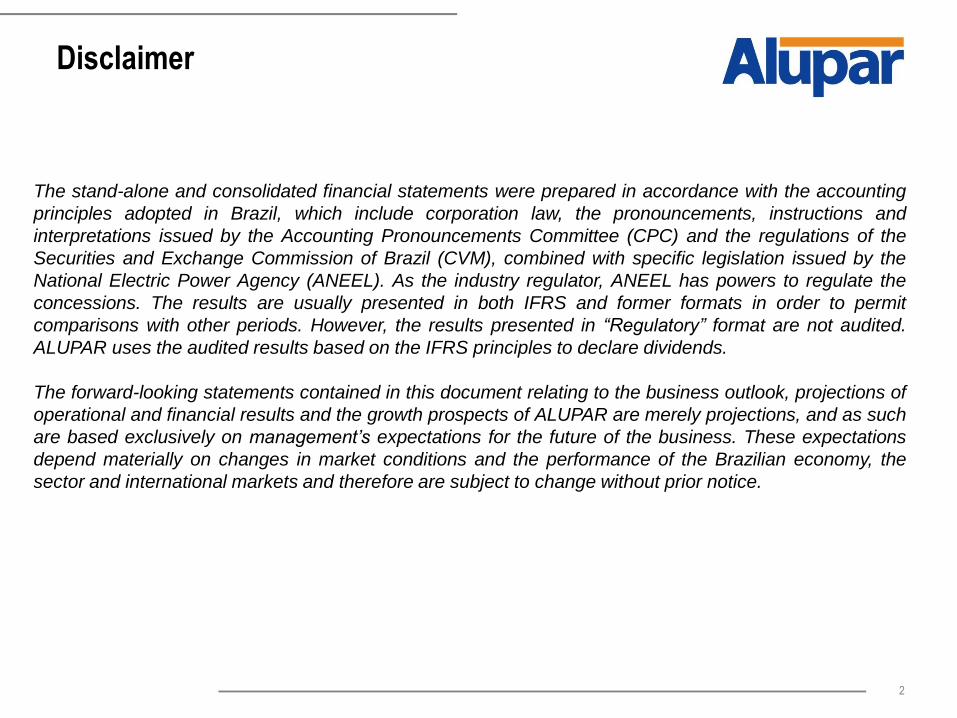
Alupar at a Glance Alupar is the only listed company in Brazil operating in transmission and generation segments
Geographic Footprint of the Assets
Portfolio of 30 long-term
concessions, starting to expire
in 2030 (transmission) and
2034 (generation)
Alupar Concession – Transmission and Generation
Today
Lifetime Transchile
Operating Under Construction
Lifetime
Lifetime
Operational Under construction
Transmission
Generation
Portfolio of 30 long-term
concessions, starting to expire
in 2030 (transmission) and
2034 (generation)
4
100/156/243
127 / 127 / 127
12/65/154
217 / 217 / 217
235/137/27 V 50.01%
T 42,51%
100%
50.01% V 50.02%
T 50.02%
V 100%
T 50.01%
70.02%
V 50.01%
T 42.51%
99.70%
41.00%
41.00%
41.00%
Transminas
47.51%
51.00%
V 50.02%
T 50.02%
51.00%
80.00% 15.00% 80.00% 20.00%
Transirapé
Transleste
STC
EBTE
Transudeste
Lumitrans
ETES
50.01%
V 100%
T 50.01%
STN ENTE EATE
ECTE
ERTE
ETEP
ETEM 62.06%
ETVG
ESDE
100%
TNE 51.00%
99.89%
100%
ETSE 100%
46.00%
TME
51.00%
51.00% Transchile
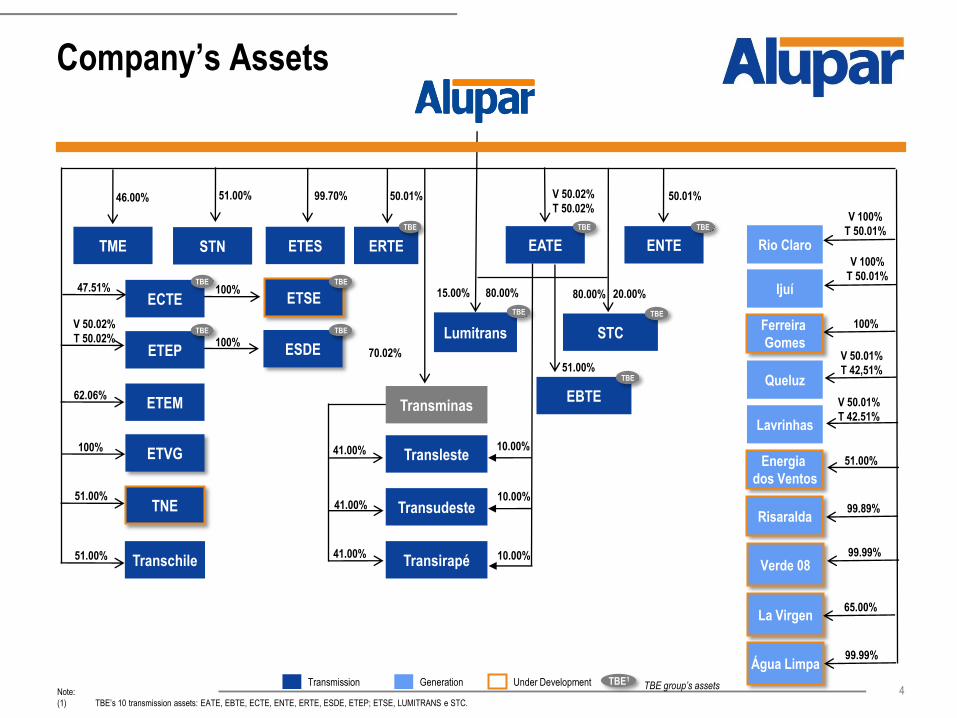
Company’s Assets
TBE
TBE
TBE
TBE
TBE TBE TBE
TBE TBE
TBE
Note:
(1) TBE’s 10 transmission assets: EATE, EBTE, ECTE, ENTE, ERTE, ESDE, ETEP; ETSE, LUMITRANS e STC.
10.00%
10.00%
10.00% 99.99%
Generation Under Development TBE1 TBE group’s assets Transmission
Lavrinhas
Rio Claro
Ijuí
Queluz
Ferreira
Gomes
Risaralda
Energia
dos Ventos
Verde 08
La Virgen
Água Limpa
65.00%
99.99%
5
100/156/243
127 / 127 / 127
12/65/154
217 / 217 / 217
235/137/27
Alupar’s Business Culture
Financial Discipline
Responsible and Sustainable Growth
Efficient Capital Structure
Corporate Governance and Transparency
Skilled and Motivated Team
6
100/156/243
127 / 127 / 127
12/65/154
217 / 217 / 217
235/137/27
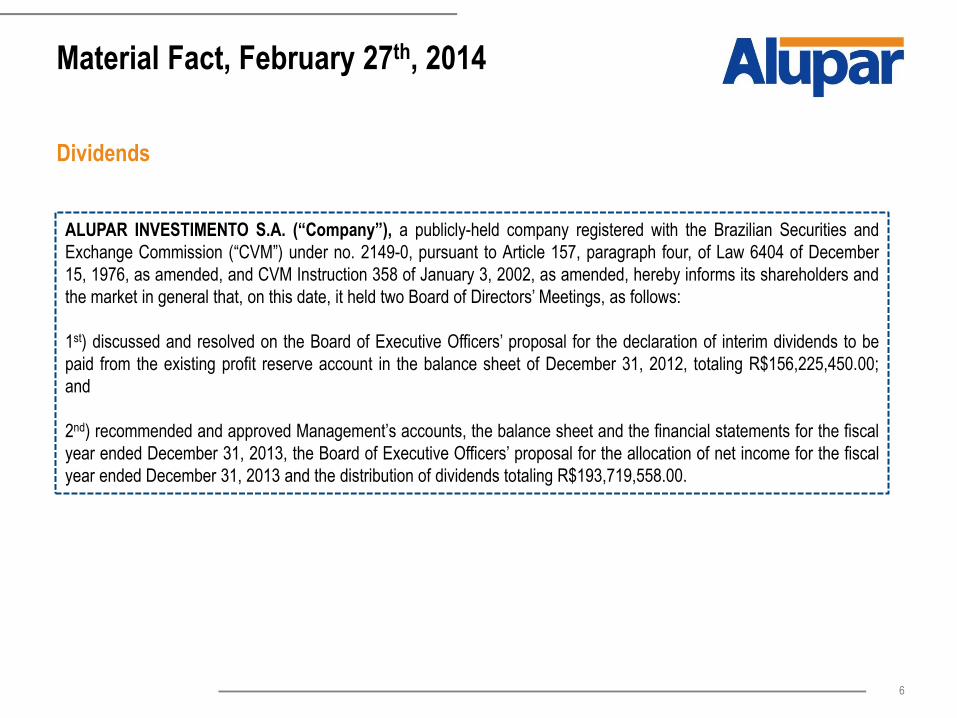
Material Fact, February 27th, 2014
Dividends
ALUPAR INVESTIMENTO S.A. (“Company”), a publicly-held company registered with the Brazilian Securities and
Exchange Commission (“CVM”) under no. 2149-0, pursuant to Article 157, paragraph four, of Law 6404 of December
15, 1976, as amended, and CVM Instruction 358 of January 3, 2002, as amended, hereby informs its shareholders and
the market in general that, on this date, it held two Board of Directors’ Meetings, as follows:
1st) discussed and resolved on the Board of Executive Officers’ proposal for the declaration of interim dividends to be
paid from the existing profit reserve account in the balance sheet of December 31, 2012, totaling R$156,225,450.00;
and
2nd) recommended and approved Management’s accounts, the balance sheet and the financial statements for the fiscal
year ended December 31, 2013, the Board of Executive Officers’ proposal for the allocation of net income for the fiscal
year ended December 31, 2013 and the distribution of dividends totaling R$193,719,558.00.
7
100/156/243
127 / 127 / 127
12/65/154
217 / 217 / 217
235/137/27
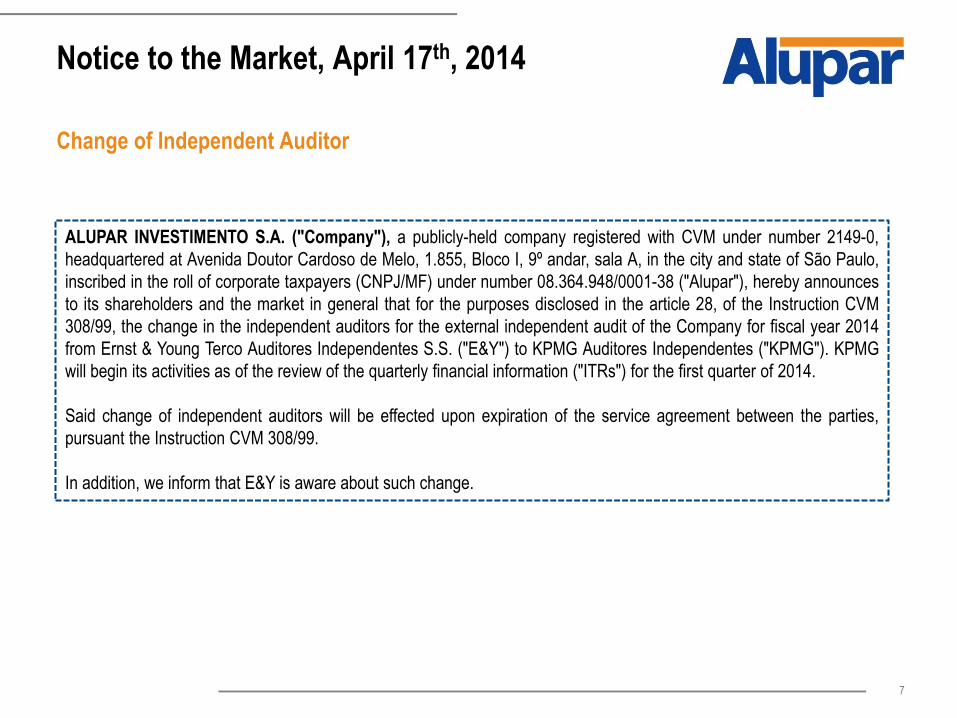
Notice to the Market, April 17th, 2014
Change of Independent Auditor
ALUPAR INVESTIMENTO S.A. ("Company"), a publicly-held company registered with CVM under number 2149-0,
headquartered at Avenida Doutor Cardoso de Melo, 1.855, Bloco I, 9º andar, sala A, in the city and state of São Paulo,
inscribed in the roll of corporate taxpayers (CNPJ/MF) under number 08.364.948/0001-38 ("Alupar"), hereby announces
to its shareholders and the market in general that for the purposes disclosed in the article 28, of the Instruction CVM
308/99, the change in the independent auditors for the external independent audit of the Company for fiscal year 2014
from Ernst & Young Terco Auditores Independentes S.S. ("E&Y") to KPMG Auditores Independentes ("KPMG"). KPMG
will begin its activities as of the review of the quarterly financial information ("ITRs") for the first quarter of 2014.
Said change of independent auditors will be effected upon expiration of the service agreement between the parties,
pursuant the Instruction CVM 308/99.
In addition, we inform that E&Y is aware about such change.
8
100/156/243
127 / 127 / 127
12/65/154
217 / 217 / 217
235/137/27
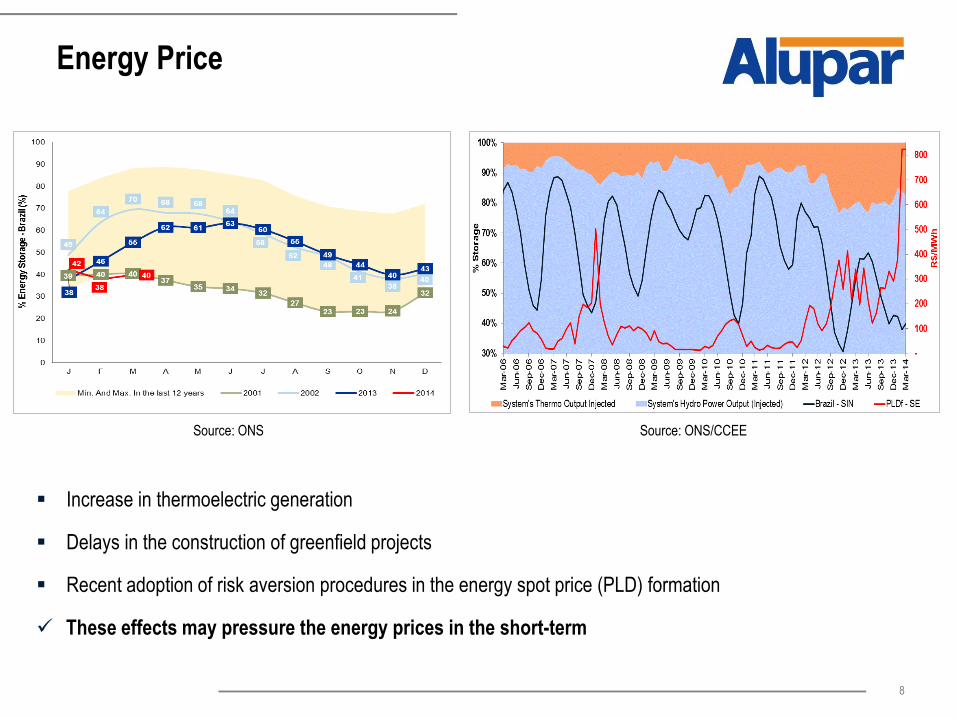
Energy Price
-
- Increase in thermoelectric generation
Delays in the construction of greenfield projects
Recent adoption of risk aversion procedures in the energy spot price (PLD) formation
These effects may pressure the energy prices in the short-term
Source: ONS/CCEE Source: ONS
9
100/156/243
127 / 127 / 127
12/65/154
217 / 217 / 217
235/137/27
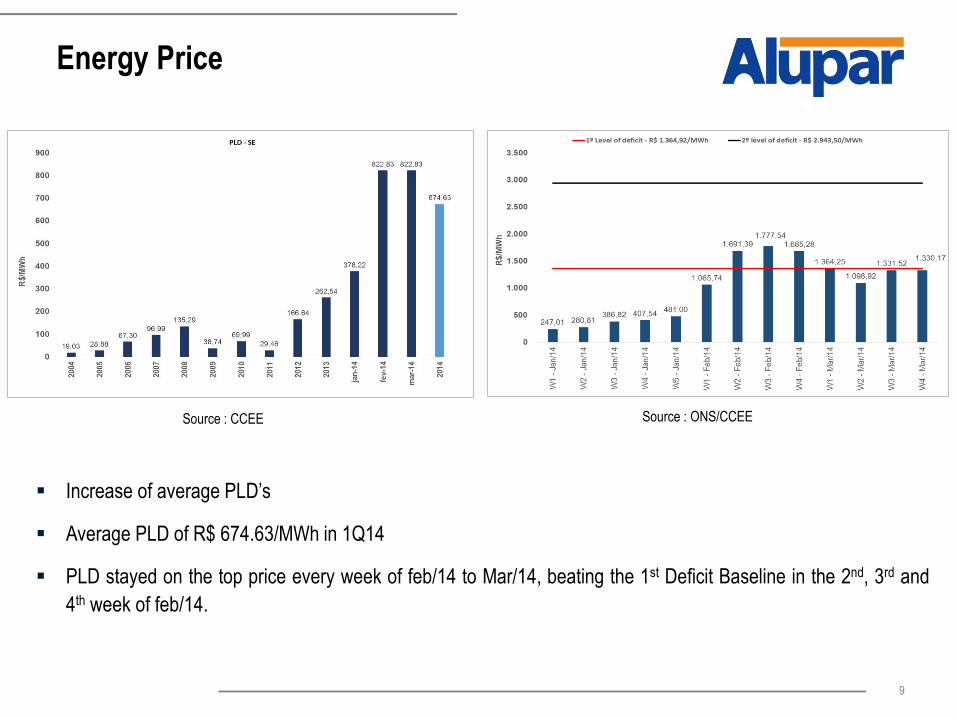
Energy Price
-
- Source : ONS/CCEE Source : CCEE
Increase of average PLD’s
Average PLD of R$ 674.63/MWh in 1Q14
PLD stayed on the top price every week of feb/14 to Mar/14, beating the 1st Deficit Baseline in the 2nd, 3rd and
4th week of feb/14.
Financial Highlights
11
100/156/243
127 / 127 / 127
12/65/154
217 / 217 / 217
235/137/27
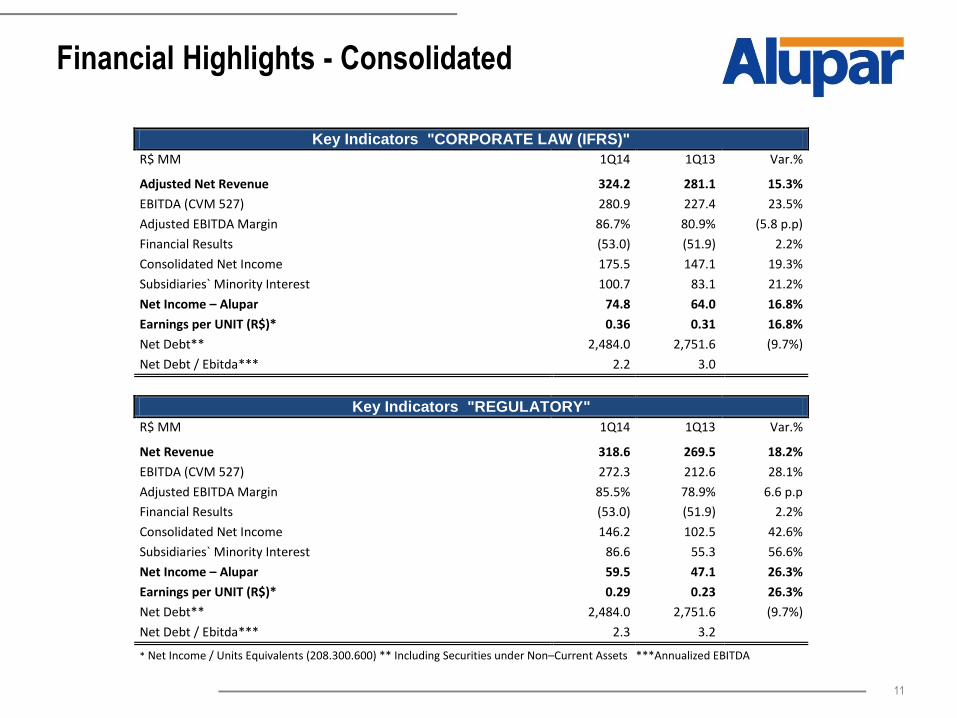
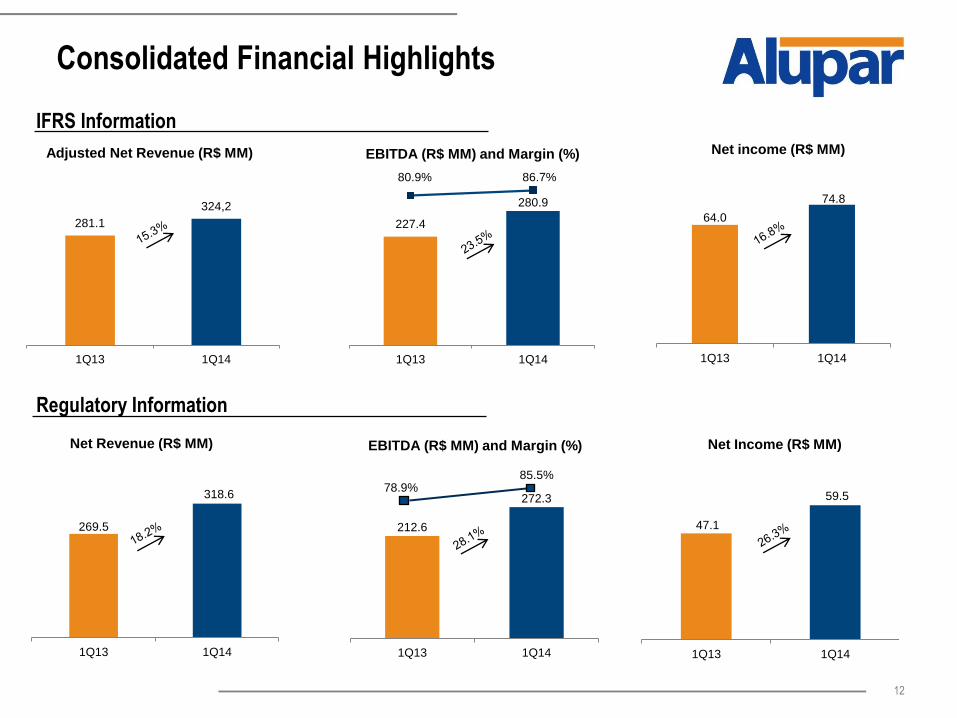
Financial Highlights - Consolidated
Key Indicators "CORPORATE LAW (IFRS)"
R$ MM 1Q14 1Q13 Var.%
Adjusted Net Revenue 324.2 281.1 15.3%
EBITDA (CVM 527) 280.9 227.4 23.5%
Adjusted EBITDA Margin 86.7% 80.9% (5.8 p.p)
Financial Results (53.0) (51.9) 2.2%
Consolidated Net Income 175.5 147.1 19.3%
Subsidiaries` Minority Interest 100.7 83.1 21.2%
Net Income – Alupar 74.8 64.0 16.8%
Earnings per UNIT (R$)* 0.36 0.31 16.8%
Net Debt** 2,484.0 2,751.6 (9.7%)
Net Debt / Ebitda*** 2.2 3.0
Key Indicators "REGULATORY"
R$ MM 1Q14 1Q13 Var.%
Net Revenue 318.6 269.5 18.2%
EBITDA (CVM 527) 272.3 212.6 28.1%
Adjusted EBITDA Margin 85.5% 78.9% 6.6 p.p
Financial Results (53.0) (51.9) 2.2%
Consolidated Net Income 146.2 102.5 42.6%
Subsidiaries` Minority Interest 86.6 55.3 56.6%
Net Income – Alupar 59.5 47.1 26.3%
Earnings per UNIT (R$)* 0.29 0.23 26.3%
Net Debt** 2,484.0 2,751.6 (9.7%)
Net Debt / Ebitda*** 2.3 3.2
* Net Income / Units Equivalents (208.300.600) ** Including Securities under Non–Current Assets ***Annualized EBITDA
12
100/156/243
127 / 127 / 127
12/65/154
217 / 217 / 217
235/137/27
Consolidated Financial Highlights
227.4
280.9
80.9% 86.7%
1Q13 1Q14
EBITDA (R$ MM) and Margin (%)
64.0
74.8
1Q13 1Q14
Net income (R$ MM)
281.1
324,2
1Q13 1Q14
Adjusted Net Revenue (R$ MM)
212.6
272.3
1Q13 1Q14
EBITDA (R$ MM) and Margin (%)
85.5% 78.9%
47.1
59.5
1Q13 1Q14
Net Income (R$ MM)
269.5
318.6
1Q13 1Q14
Net Revenue (R$ MM)
IFRS Information
Regulatory Information
13
100/156/243
127 / 127 / 127
12/65/154
217 / 217 / 217
235/137/27
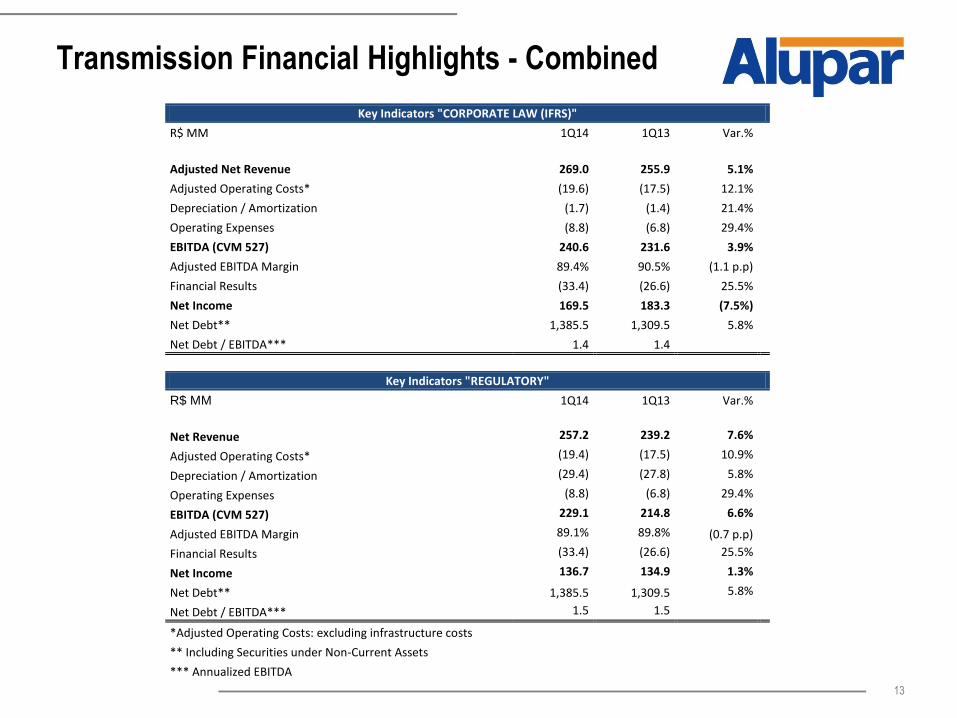
Transmission Financial Highlights - Combined
Key Indicators "CORPORATE LAW (IFRS)"
R$ MM 1Q14 1Q13 Var.%
Adjusted Net Revenue 269.0 255.9 5.1%
Adjusted Operating Costs* (19.6) (17.5) 12.1%
Depreciation / Amortization (1.7) (1.4) 21.4%
Operating Expenses (8.8) (6.8) 29.4%
EBITDA (CVM 527) 240.6 231.6 3.9%
Adjusted EBITDA Margin 89.4% 90.5% (1.1 p.p)
Financial Results (33.4) (26.6) 25.5%
Net Income 169.5 183.3 (7.5%)
Net Debt** 1,385.5 1,309.5 5.8%
Net Debt / EBITDA*** 1.4 1.4
Key Indicators "REGULATORY"
R$ MM 1Q14 1Q13 Var.%
Net Revenue 257.2 239.2 7.6%
Adjusted Operating Costs* (19.4) (17.5) 10.9%
Depreciation / Amortization (29.4) (27.8) 5.8%
Operating Expenses (8.8) (6.8) 29.4%
EBITDA (CVM 527) 229.1 214.8 6.6%
Adjusted EBITDA Margin 89.1% 89.8% (0.7 p.p)
Financial Results (33.4) (26.6) 25.5%
Net Income 136.7 134.9 1.3%
Net Debt** 1,385.5 1,309.5 5.8%
Net Debt / EBITDA*** 1.5 1.5
*Adjusted Operating Costs: excluding infrastructure costs
** Including Securities under Non-Current Assets
*** Annualized EBITDA
14
100/156/243
127 / 127 / 127
12/65/154
217 / 217 / 217
235/137/27
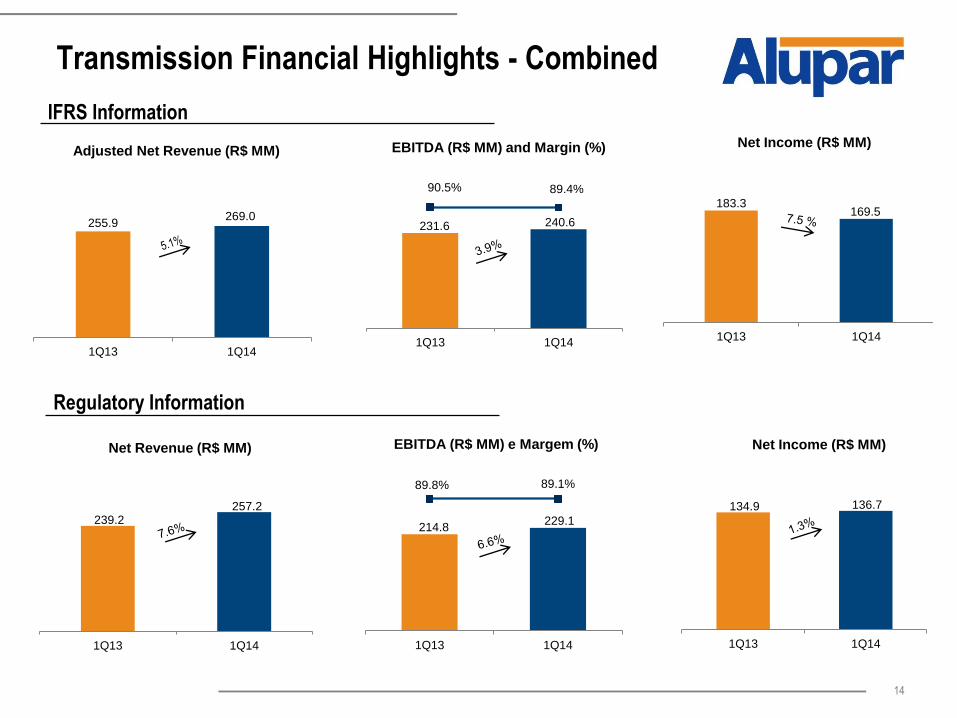
Transmission Financial Highlights - Combined
IFRS Information
255.9 269.0
1Q13 1Q14
Adjusted Net Revenue (R$ MM)
239.2 257.2
1Q13 1Q14
Net Revenue (R$ MM)
134.9 136.7
1Q13 1Q14
Net Income (R$ MM)
Regulatory Information
231.6 240.6
90.5% 89.4%
1Q13 1Q14
EBITDA (R$ MM) and Margin (%)
214.8 229.1
89.8% 89.1%
1Q13 1Q14
EBITDA (R$ MM) e Margem (%)
183.3 169.5
1Q13 1Q14
Net Income (R$ MM)
15
100/156/243
127 / 127 / 127
12/65/154
217 / 217 / 217
235/137/27
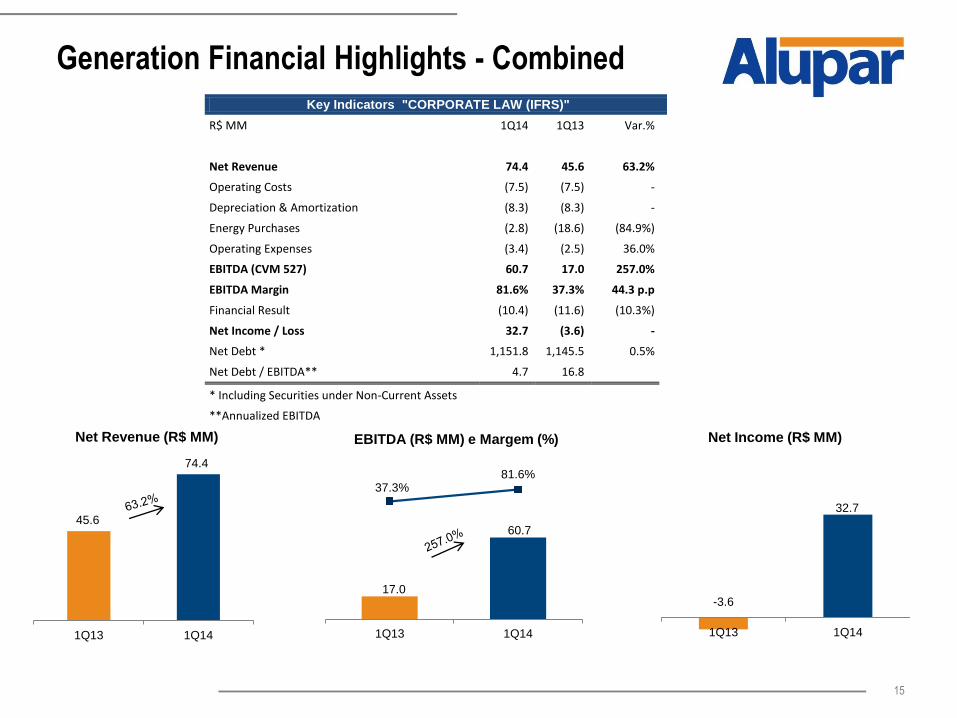
Generation Financial Highlights - Combined
45.6
74.4
1Q13 1Q14
Net Revenue (R$ MM)
-3.6
32.7
1Q13 1Q14
Net Income (R$ MM)
17.0
60.7
37.3% 81.6%
1Q13 1Q14
EBITDA (R$ MM) e Margem (%)
Key Indicators "CORPORATE LAW (IFRS)"
R$ MM 1Q14 1Q13 Var.%
Net Revenue 74.4 45.6 63.2%
Operating Costs (7.5) (7.5) -
Depreciation & Amortization (8.3) (8.3) -
Energy Purchases (2.8) (18.6) (84.9%)
Operating Expenses (3.4) (2.5) 36.0%
EBITDA (CVM 527) 60.7 17.0 257.0%
EBITDA Margin 81.6% 37.3% 44.3 p.p
Financial Result (10.4) (11.6) (10.3%)
Net Income / Loss 32.7 (3.6) -
Net Debt * 1,151.8 1,145.5 0.5%
Net Debt / EBITDA** 4.7 16.8
* Including Securities under Non-Current Assets
**Annualized EBITDA
16
100/156/243
127 / 127 / 127
12/65/154
217 / 217 / 217
235/137/27
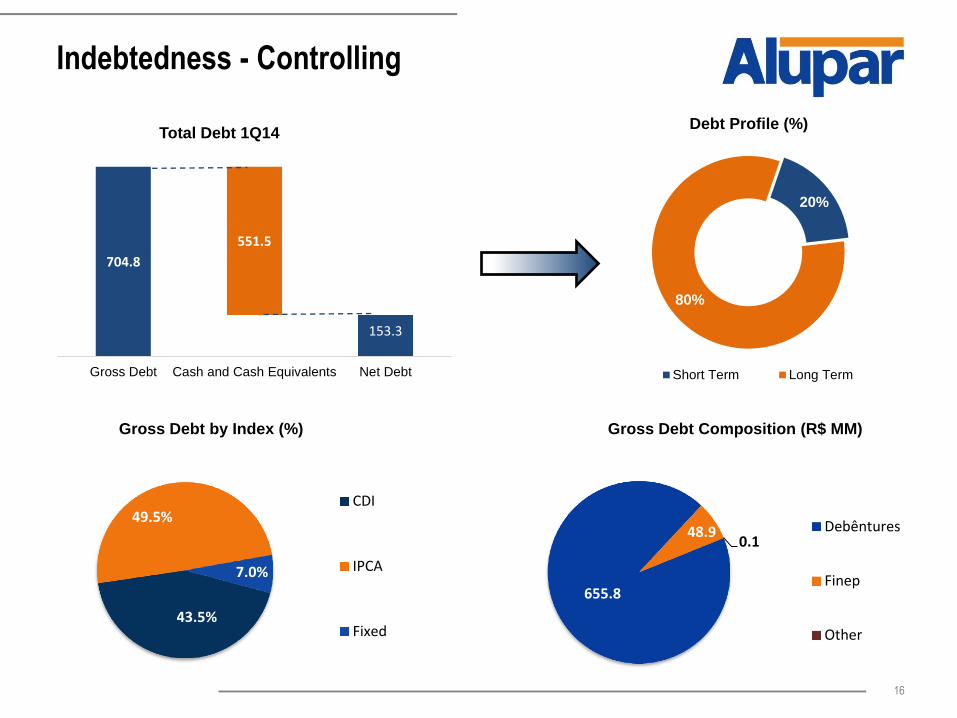
Indebtedness - Controlling
20%
80%
Debt Profile (%)
Short Term Long Term
704.8
153.3
551.5
Gross Debt Cash and Cash Equivalents Net Debt
Total Debt 1Q14
43.5%
49.5%
7.0%
CDI
IPCA
Fixed
Gross Debt by Index (%)
655.8
48.9 0.1
Debêntures
Finep
Other
Gross Debt Composition (R$ MM)
17
100/156/243
127 / 127 / 127
12/65/154
217 / 217 / 217
235/137/27
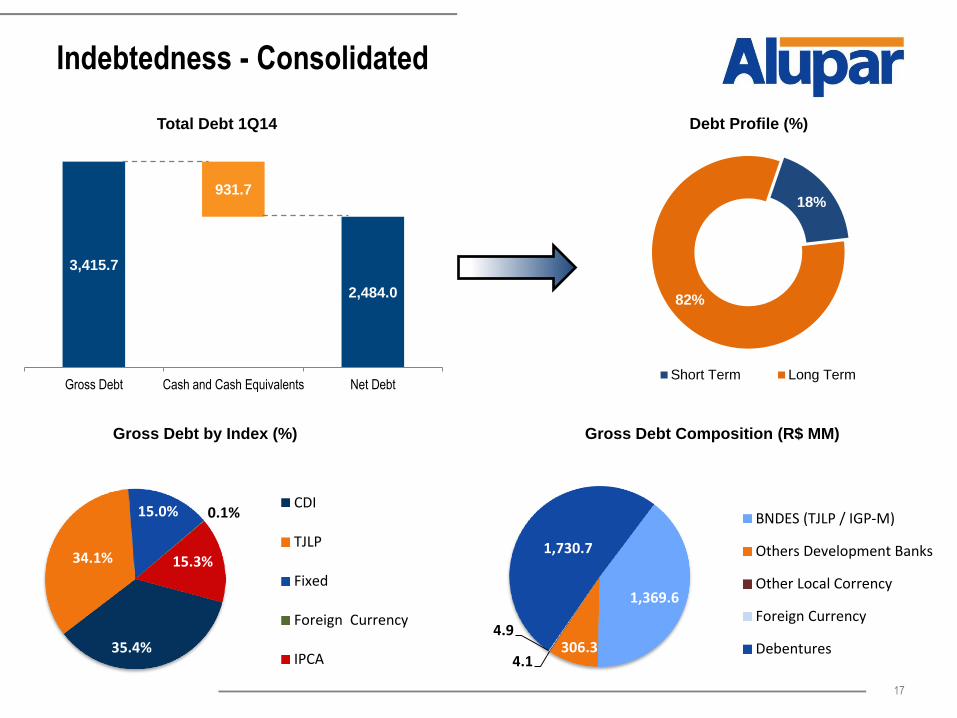
Indebtedness - Consolidated
18%
82%
Debt Profile (%)
Short Term Long Term
3,415.7
931.7
2,484.0
Gross Debt Cash and Cash Equivalents Net Debt
Total Debt 1Q14
35.4%
34.1%
15.0% 0.1%
15.3%
CDI
TJLP
Fixed
Foreign Currency
IPCA
Gross Debt by Index (%)
1,369.6
306.3 4.1
4.9
1,730.7
BNDES (TJLP / IGP-M)
Others Development Banks
Other Local Corrency
Foreign Currency
Debentures
Gross Debt Composition (R$ MM)
18
100/156/243
127 / 127 / 127
12/65/154
217 / 217 / 217
235/137/27
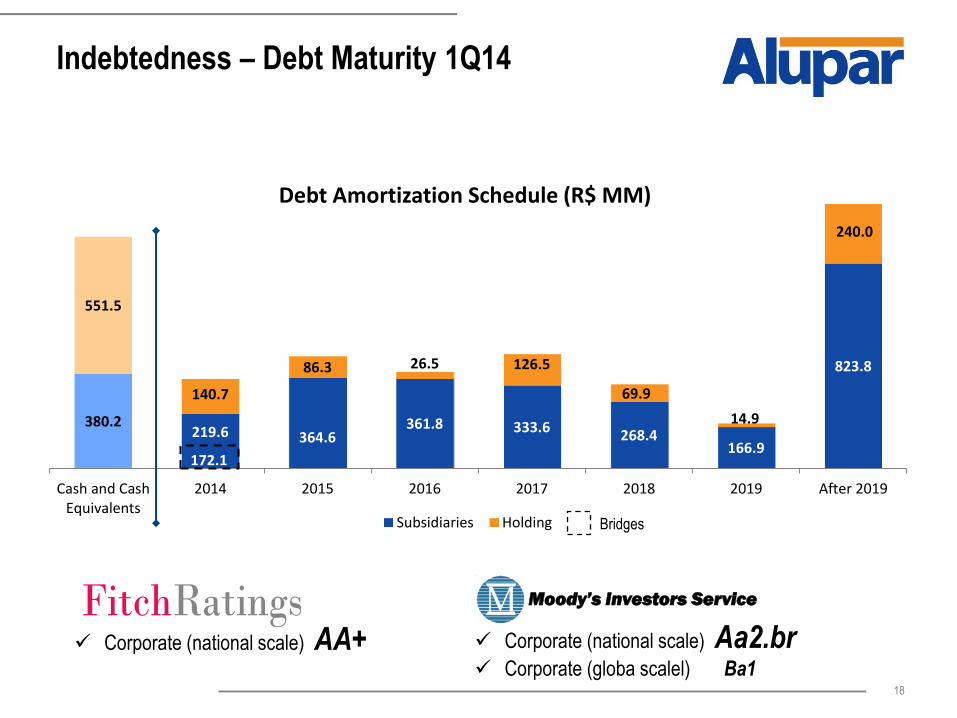
Indebtedness – Debt Maturity 1Q14
Moody’s Investors Service
Corporate (national scale) AA+ Corporate (national scale) Aa2.br Corporate (globa scalel) Ba1
380.2 219.6 364.6
361.8 333.6 268.4
166.9
823.8
551.5
140.7
86.3 26.5 126.5
69.9
14.9
240.0
Cash and CashEquivalents
2014 2015 2016 2017 2018 2019 After 2019
Debt Amortization Schedule (R$ MM)
Subsidiaries Holding
172.1
Bridges
IR Contacts
Marcelo Costa
IRO
Luiz Coimbra
Kássia Orsi Amendola
IR Analyst
Tel.: (011) 2184-9600
May, 12th, 2014


![1Q14 RESULTS PRESENTATION - NOS · 1Q14 RESULTS PRESENTATION Monthly Bill per Unique Corporate, SME and SoHo subscribers [Euros] 0 ä 200 ä 1Q13 2Q13 3Q13 4Q13 1Q14 Monthly Bill](https://img.pdfslide.us/doc/110x75/5f4bf904fbd0f2207a556b26/1q14-results-presentation-nos-1q14-results-presentation-monthly-bill-per-unique.jpg)