Embed Size (px)
Citation preview
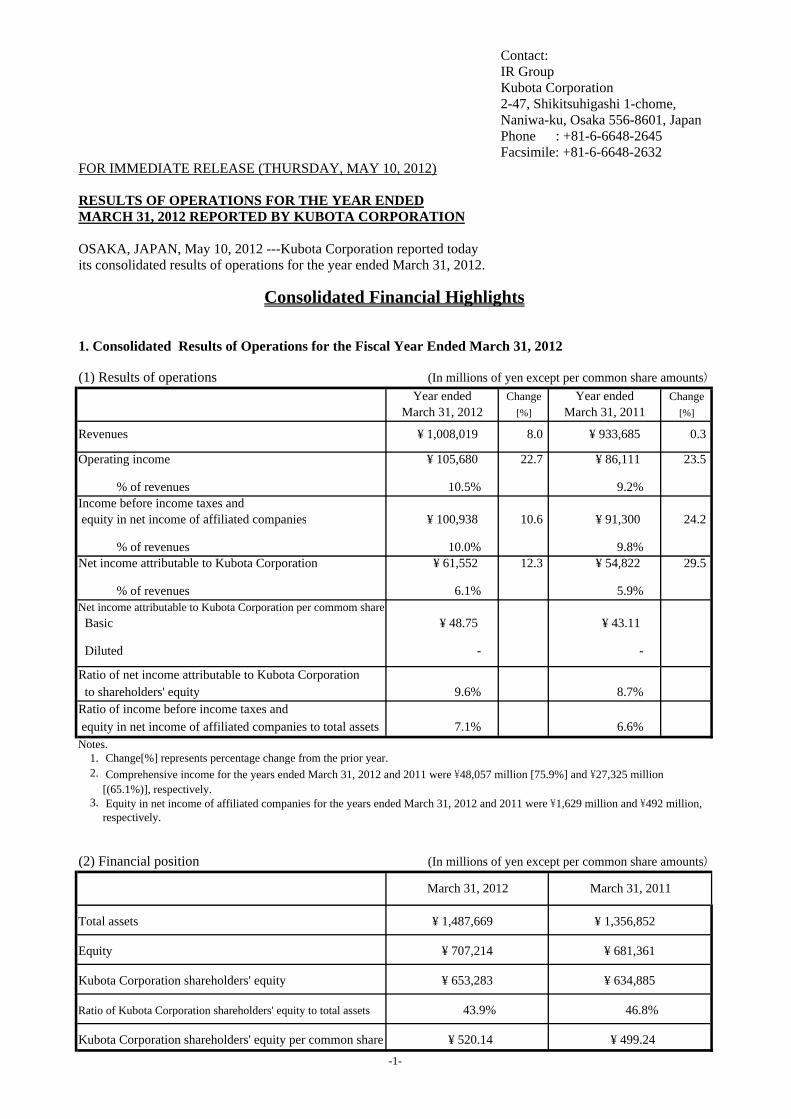
Contact:IR GroupKubota Corporation2-47, Shikitsuhigashi 1-chome,Naniwa-ku, Osaka 556-8601, JapanPhone : +81-6-6648-2645Facsimile: +81-6-6648-2632
FOR IMMEDIATE RELEASE (THURSDAY, MAY 10, 2012)
RESULTS OF OPERATIONS FOR THE YEAR ENDEDMARCH 31, 2012 REPORTED BY KUBOTA CORPORATION
OSAKA, JAPAN, May 10, 2012 ---Kubota Corporation reported today its consolidated results of operations for the year ended March 31, 2012.
(1) Results of operationsYear ended Change Year ended Change
March 31, 2012 [%] March 31, 2011 [%]
Revenues ¥ 1,008,019 8.0 ¥ 933,685 0.3
Operating income ¥ 105,680 22.7 ¥ 86,111 23.5
% of revenues 10.5% 9.2%Income before income taxes and equity in net income of affiliated companies ¥ 100,938 10.6 ¥ 91,300 24.2
% of revenues 10.0% 9.8%Net income attributable to Kubota Corporation ¥ 61,552 12.3 ¥ 54,822 29.5
% of revenues 6.1% 5.9%Net income attributable to Kubota Corporation per commom share
Basic ¥ 48.75 ¥ 43.11
Diluted - -
Ratio of net income attributable to Kubota Corporation to shareholders' equity 9.6% 8.7%Ratio of income before income taxes and equity in net income of affiliated companies to total assets 7.1% 6.6%Notes.
1. Change[%] represents percentage change from the prior year.2.
3.respectively.
(2) Financial position (In millions of yen except per common share amounts)
Total assets
Equity
Kubota Corporation shareholders' equity
Ratio of Kubota Corporation shareholders' equity to total assets
Kubota Corporation shareholders' equity per common share
46.8%
¥ 499.24
43.9%
¥ 520.14
¥ 653,283 ¥ 634,885
Consolidated Financial Highlights
(In millions of yen except per common share amounts)
1. Consolidated Results of Operations for the Fiscal Year Ended March 31, 2012
¥ 681,361¥ 707,214
¥ 1,356,852¥ 1,487,669
Comprehensive income for the years ended March 31, 2012 and 2011 were \48,057 million [75.9%] and \27,325 million[(65.1%)], respectively.
March 31, 2012 March 31, 2011
Equity in net income of affiliated companies for the years ended March 31, 2012 and 2011 were \1,629 million and \492 million,
-1-
Kubota Corporation and Subsidiaries
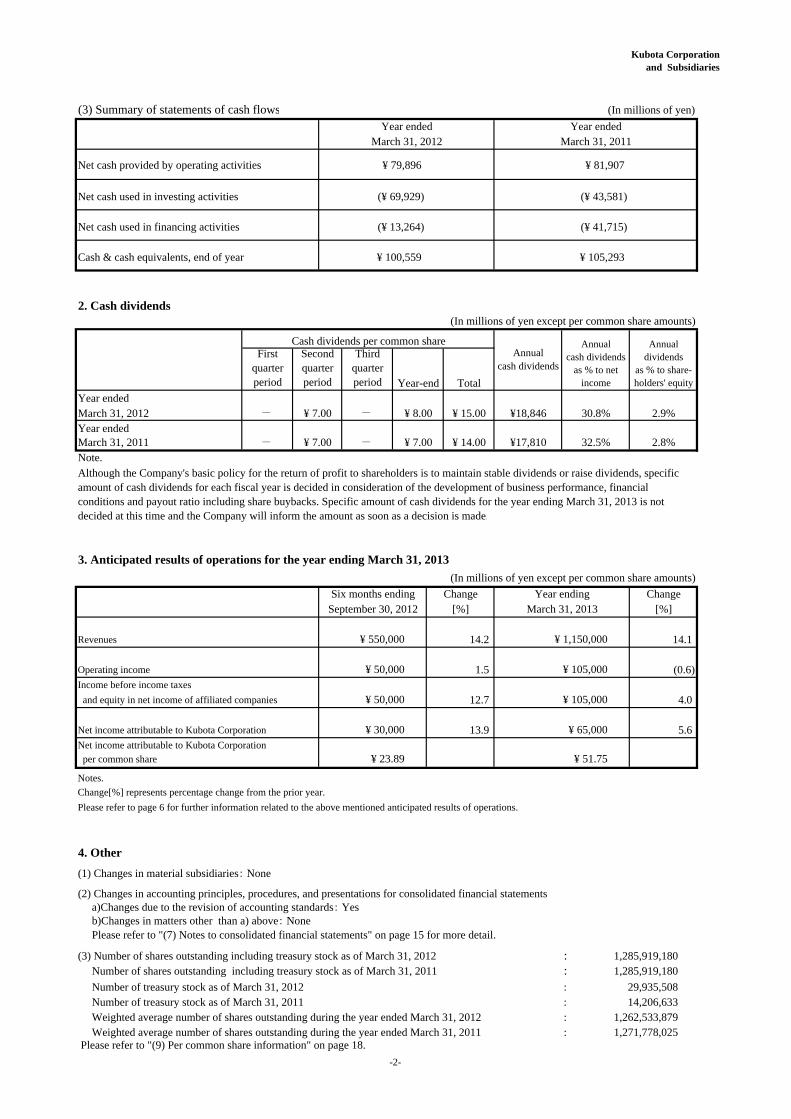
(3) Summary of statements of cash flows (In millions of yen)
Net cash provided by operating activities
Net cash used in investing activities
Net cash used in financing activities
Cash & cash equivalents, end of year
2. Cash dividends (In millions of yen except per common share amounts)
Year endedMarch 31, 2012Year endedMarch 31, 2011Note.
3. Anticipated results of operations for the year ending March 31, 2013
(In millions of yen except per common share amounts)
Revenues
Operating income
Income before income taxes
and equity in net income of affiliated companies
Net income attributable to Kubota Corporation
Net income attributable to Kubota Corporation
per common share
Notes.
Change[%] represents percentage change from the prior year.
Please refer to page 6 for further information related to the above mentioned anticipated results of operations.
4. Other
(1) Changes in material subsidiaries: None
(2) Changes in accounting principles, procedures, and presentations for consolidated financial statements a)Changes due to the revision of accounting standards: Yes b)Changes in matters other than a) above: None Please refer to "(7) Notes to consolidated financial statements" on page 15 for more detail.
(3) Number of shares outstanding including treasury stock as of March 31, 2012 : Number of shares outstanding including treasury stock as of March 31, 2011 : Number of treasury stock as of March 31, 2012 : Number of treasury stock as of March 31, 2011 : Weighted average number of shares outstanding during the year ended March 31, 2012 : Weighted average number of shares outstanding during the year ended March 31, 2011 : Please refer to "(9) Per common share information" on page 18.
13.9
32.5%¥ 14.00 2.8%
12.7
1.5
¥ 23.89
¥ 30,000
¥ 50,000
Firstquarterperiod
Thirdquarterperiod
Secondquarterperiod
-¥ 7.00
-
¥ 550,000
¥ 8.00
September 30, 2012
¥ 7.00
¥ 15.00- ¥ 7.00
-
Although the Company's basic policy for the return of profit to shareholders is to maintain stable dividends or raise dividends, specificamount of cash dividends for each fiscal year is decided in consideration of the development of business performance, financialconditions and payout ratio including share buybacks. Specific amount of cash dividends for the year ending March 31, 2013 is notdecided at this time and the Company will inform the amount as soon as a decision is made.
ChangeSix months ending[%]
¥ 105,000¥ 50,000 (0.6)
14.1
4.0¥ 105,000
¥ 65,000
Year endedMarch 31, 2012
Year endedMarch 31, 2011
1,262,533,8791,271,778,025
1,285,919,1801,285,919,180
29,935,50814,206,633
¥ 51.75
Annualcash dividends
as % to netincome
2.9%
Total
¥18,846
Cash dividends per common share
(¥ 69,929)
(¥ 13,264)
¥ 100,559
Annualcash dividends
¥ 79,896
5.6
Year endingMarch 31, 2013
Change[%]
14.2
¥ 81,907
Year-end
¥ 1,150,000
30.8%
¥17,810
Annualdividends
as % to share-holders' equity
(¥ 43,581)
(¥ 41,715)
¥ 105,293
-2-
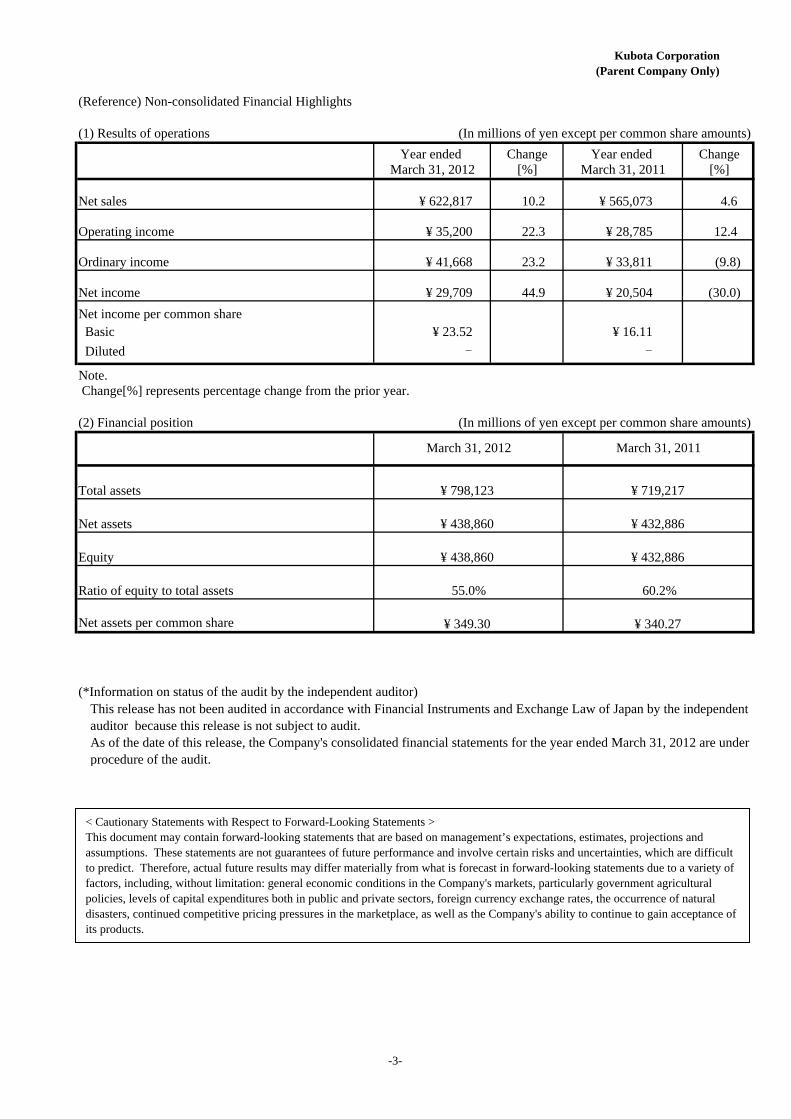
Kubota Corporation(Parent Company Only)
(Reference) Non-consolidated Financial Highlights
(1) Results of operations (In millions of yen except per common share amounts)
Change Change[%] [%]
Net sales ¥ 622,817 10.2 ¥ 565,073 4.6
Operating income ¥ 35,200 22.3 ¥ 28,785 12.4
Ordinary income ¥ 41,668 23.2 ¥ 33,811 (9.8)
Net income ¥ 29,709 44.9 ¥ 20,504 (30.0)
Net income per common share Basic ¥ 23.52 ¥ 16.11
Diluted - -
Note. Change[%] represents percentage change from the prior year.
(2) Financial position (In millions of yen except per common share amounts)
Total assets
Net assets
Equity
Ratio of equity to total assets
Net assets per common share
(*Information on status of the audit by the independent auditor)
This release has not been audited in accordance with Financial Instruments and Exchange Law of Japan by the independentauditor because this release is not subject to audit.As of the date of this release, the Company's consolidated financial statements for the year ended March 31, 2012 are underprocedure of the audit.
¥ 438,860
¥ 340.27
55.0%
¥ 349.30
¥ 438,860 ¥ 432,886
Year ended
¥ 719,217
¥ 432,886
60.2%
March 31, 2012
Year ended March 31, 2012 March 31, 2011
March 31, 2011
¥ 798,123
< Cautionary Statements with Respect to Forward-Looking Statements >This document may contain forward-looking statements that are based on management’s expectations, estimates, projections andassumptions. These statements are not guarantees of future performance and involve certain risks and uncertainties, which are difficultto predict. Therefore, actual future results may differ materially from what is forecast in forward-looking statements due to a variety offactors, including, without limitation: general economic conditions in the Company's markets, particularly government agriculturalpolicies, levels of capital expenditures both in public and private sectors, foreign currency exchange rates, the occurrence of naturaldisasters, continued competitive pricing pressures in the marketplace, as well as the Company's ability to continue to gain acceptance ofits products.
-3-
Kubota Corporationand Subsidiaries
1. Review of operations and financial condition ・・・・・・・・・・・・・・・・・・・・・・・・・・・・・・・・・・・・・・・・・・・・・・・・・・・・・・・・・・・・・・・・・・・ 5
(1) Review of operations ・・・・・・・・・・・・・・・・・・・・・・・・・・・・・・・・・・・・・・・・・・・・・・・・・・・・・・・・・・・・・・・・・・・・・・・・・・・・・・・・・・・・・・・・ 5
(2) Financial condition ・・・・・・・・・・・・・・・・・・・・・・・・・・・・・・・・・・・・・・・・・・・・・・・・・・・・・・・・・・・・・・・・・・・・・・・・・・・・・・・・・・・・・・・・・・・ 6
2. Management policies ・・・・・・・・・・・・・・・・・・・・・・・・・・・・・・・・・・・・・・・・・・・・・・・・・・・・・・・・・・・・・・・・・・・・・・・・・・・・・・・・・・・・・・・・・・・・・・ 8
(1) Basic management policy ・・・・・・・・・・・・・・・・・・・・・・・・・・・・・・・・・・・・・・・・・・・・・・・・・・・・・・・・・・・・・・・・・・・・・・・・・・・・・・・・・・・ 8
(2) Principal business policies for medium-to-long term growth in profit ・・・・・・・・・・・・・・・・・・・・・・・・・・・・・・・・・・ 8
3. Consolidated financial statements ・・・・・・・・・・・・・・・・・・・・・・・・・・・・・・・・・・・・・・・・・・・・・・・・・・・・・・・・・・・・・・・・・・・・・・・・・・・・・・・・ 10
(1) Consolidated balance sheets ・・・・・・・・・・・・・・・・・・・・・・・・・・・・・・・・・・・・・・・・・・・・・・・・・・・・・・・・・・・・・・・・・・・・・・・・・・・・・・・・ 10
(2) Consolidated statements of income ・・・・・・・・・・・・・・・・・・・・・・・・・・・・・・・・・・・・・・・・・・・・・・・・・・・・・・・・・・・・・・・・・・・・・・・・・ 12
(3) Consolidated statements of comprehensive income ・・・・・・・・・・・・・・・・・・・・・・・・・・・・・・・・・・・・・・・・・・・・・・・・・・・・・・ 13
(4) Consolidated statements of changes in equity ・・・・・・・・・・・・・・・・・・・・・・・・・・・・・・・・・・・・・・・・・・・・・・・・・・・・・・・・・・・・・ 13
(5) Consolidated statements of cash flows ・・・・・・・・・・・・・・・・・・・・・・・・・・・・・・・・・・・・・・・・・・・・・・・・・・・・・・・・・・・・・・・・・・・・・ 14
(6) Notes to assumptions for going concern ・・・・・・・・・・・・・・・・・・・・・・・・・・・・・・・・・・・・・・・・・・・・・・・・・・・・・・・・・・・・・・・・・・・ 15
(7) Notes to consolidated financial statements ・・・・・・・・・・・・・・・・・・・・・・・・・・・・・・・・・・・・・・・・・・・・・・・・・・・・・・・・・・・・・・・・ 15
(8) Consolidated segment information ・・・・・・・・・・・・・・・・・・・・・・・・・・・・・・・・・・・・・・・・・・・・・・・・・・・・・・・・・・・・・・・・・・・・・・・・・ 16
(9) Per common share information ・・・・・・・・・・・・・・・・・・・・・・・・・・・・・・・・・・・・・・・・・・・・・・・・・・・・・・・・・・・・・・・・・・・・・・・・・・・・・ 18
(10) Subsequent events ・・・・・・・・・・・・・・・・・・・・・・・・・・・・・・・・・・・・・・・・・・・・・・・・・・・・・・・・・・・・・・・・・・・・・・・・・・・・・・・・・・・・・・・・・・・ 18
(11) Consolidated revenues by reporting segments ・・・・・・・・・・・・・・・・・・・・・・・・・・・・・・・・・・・・・・・・・・・・・・・・・・・・・・・・・・・・ 19
(12) Anticipated consolidated revenues by reporting segments ・・・・・・・・・・・・・・・・・・・・・・・・・・・・・・・・・・・・・・・・・・・・・・・ 20
4. The results of operations for the three months ended March 31, 2012 ・・・・・・・・・・・・・・・・・・・・・・・・・・・・・・・・・・・・・・・ 21
(1) Consolidated statements of income ・・・・・・・・・・・・・・・・・・・・・・・・・・・・・・・・・・・・・・・・・・・・・・・・・・・・・・・・・・・・・・・・・・・・・・・・・ 21
(2) Consolidated segment information ・・・・・・・・・・・・・・・・・・・・・・・・・・・・・・・・・・・・・・・・・・・・・・・・・・・・・・・・・・・・・・・・・・・・・・・・・ 22
(3) Consolidated revenues by reporting segments ・・・・・・・・・・・・・・・・・・・・・・・・・・・・・・・・・・・・・・・・・・・・・・・・・・・・・・・・・・・・ 23
5. Other ・・・・・・・・・・・・・・・・・・・・・・・・・・・・・・・・・・・・・・・・・・・・・・・・・・・・・・・・・・・・・・・・・・・・・・・・・・・・・・・・・・・・・・・・・・・・・・・・・・・・・・・・・・・・・・・・ 24
(1) Notice of changes of management (Effective as of June 22, 2012) ・・・・・・・・・・・・・・・・・・・・・・・・・・・・・・・・・・・・・ 24
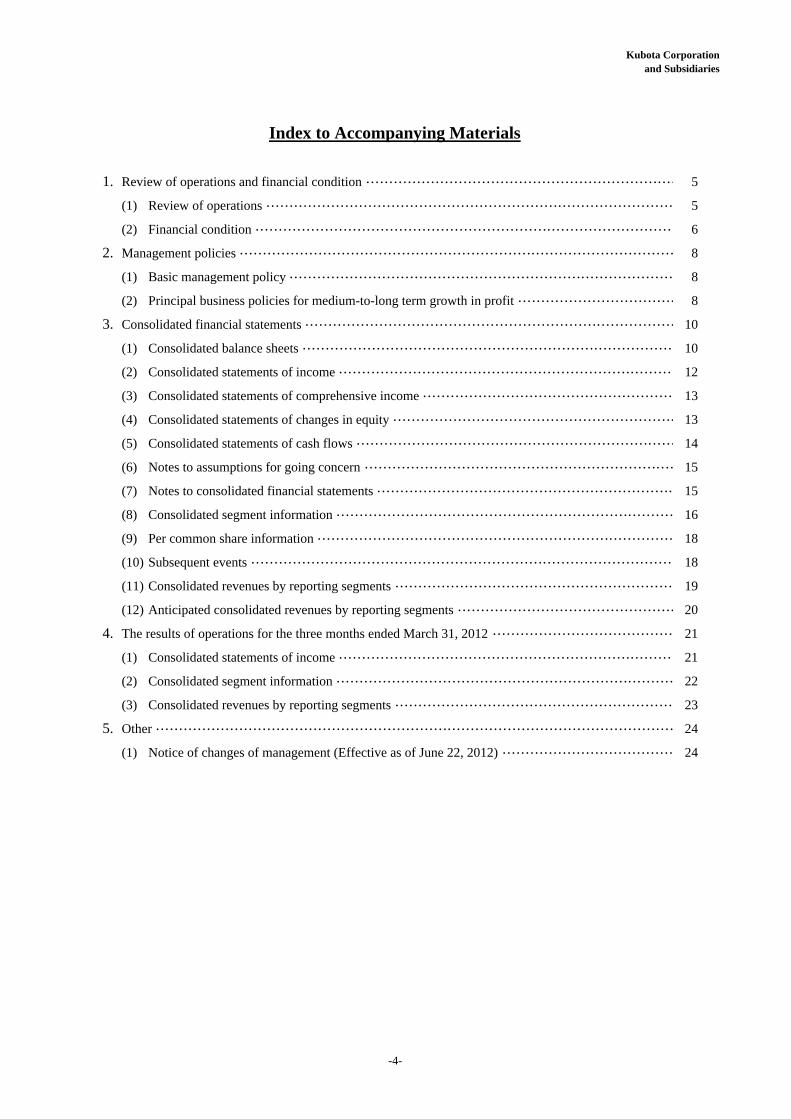
Index to Accompanying Materials
-4-
Kubota Corporation and Subsidiaries
-5-
1. Review of operations and financial condition
(1) Review of operations a) Summary of the results of operations for the year under review
For the year ended March 31, 2012, revenues of the Company increased ¥74.3 billion (8.0%) from the prior
year, to ¥1,008.0 billion.
In the domestic market, revenues increased ¥20.8 billion (4.3%) from the prior year, to ¥498.7 billion、 due to
increased revenues in all reporting segments. Domestic revenues in Farm & Industrial Machinery increased due to
favorable sales of construction machinery and other products, and revenues in Water & Environment Systems
increased due to steady sales of products related to public works. Revenues in Social Infrastructure and Other also
rose, thus resulting in an overall increase in domestic revenues.
In overseas markets, revenues increased ¥53.6 billion (11.8%) from the prior year, to ¥509.3 billion. Revenues
in Farm & Industrial Machinery posted a major increase due to steady demand in North America and Europe, and
revenues in Social Infrastructure also increased. However, revenues in Water & Environment Systems and Other
decreased. The ratio of overseas revenues to consolidated revenues was 50.5%, 1.7 percentage points higher than in
the prior year.
Operating income increased ¥19.6 billion (22.7%) from the prior year, to ¥105.7 billion, due to an increase in
overseas revenues in Farm & Industrial Machinery, company-wide cost reductions and gain on sales of land. Income
before income taxes and equity in net income of affiliated companies was ¥100.9 billion, ¥9.6 billion (10.6%) higher
than in the prior year, because of decreases in gain on sales of securities-net and gain on nonmonetary exchange of
securities, which partly offset an increase in operating income. Income taxes were ¥36.5 billion, and equity in net
income of affiliated companies was ¥1.6 billion. Accordingly, net income increased ¥4.9 billion (8.0%), to ¥66.0
billion. After deducting ¥4.5 billion of net income attributable to noncontrolling interests, net income attributable to
Kubota Corporation was ¥61.6 billion, ¥6.7 billion (12.3%) higher than in the prior year.
b) Review of operations by reporting segment
1) Farm & Industrial Machinery
Farm & Industrial Machinery comprises farm equipment, engines and construction machinery.
Revenues in this segment increased 9.6% from the prior year, to ¥713.9 billion and accounted for 70.8% of
consolidated revenues.
Domestic revenues increased 4.0%, to ¥235.4 billion. Domestic sales of farm equipment were at almost the
same level as in the prior year. Sales of farm equipment decreased in the area affected by the Great East Japan
Earthquake, while they increased in other areas. On the other hand, sales of construction machinery substantially
increased due to the market recovery. Sales of engines also increased steadily.
Overseas revenues increased 12.6%, to ¥478.5 billion. In North America, sales of tractors increased due to a
gain in market share of the Company, and sales of construction machinery significantly increased owing to market
recovery and the effect of launching new products. Sales of engines also increased steadily supported by firm demand.
In Europe, sales of construction machinery and engines increased substantially due to an expansion of demand, while
sales of tractors were at approximately the same level as the prior year. In Asia outside Japan, sales of farm
equipment showed only slight increases, mainly due to the floods in Thailand.
Operating income in Farm & Industrial Machinery increased 13.1%, to ¥97.8 billion, due to increased
overseas revenues and cost reduction.
Kubota Corporation and Subsidiaries
-6-
2) Water & Environment Systems
Water & Environment Systems comprises pipe-related products (ductile iron pipes, plastic pipes, valves and
other products) and environment-related products (environmental plants, pumps and other products).
Revenues in this segment increased 3.0%, to ¥198.5 billion from the prior year, and accounted for 19.7% of
consolidated revenues.
Domestic revenues increased 3.3%, to ¥184.6 billion. Sales of environment-related products, such as waste
water treatment equipment and plants increased. Sales of pipe-related products were at almost the same level as the
prior year. Overseas revenues decreased 1.4%, to ¥13.9 billion.
Operating income in Water & Environment Systems increased 13.0%, to ¥14.8 billion, supported by steady
domestic revenues.
3) Social Infrastructure
Social Infrastructure comprises industrial castings, spiral welded steel pipes, vending machines, electronic
equipped machinery and air-conditioning equipment.
Revenues in this segment increased 7.2%, to ¥64.8 billion from the prior year, and accounted for 6.4% of
consolidated revenues.
Domestic revenues increased 8.6%, to ¥48.1 billion. Although sales of spiral welded steel pipes, electronic
equipped machinery and air-conditioning equipment increased, sales of industrial castings and vending machines
decreased from the prior year. Overseas revenues increased 3.4%, to ¥16.7 billion, mainly owing to increased sales of
industrial castings.
Operating income in Social Infrastructure increased 7.6%, to ¥2.7 billion, mainly due to increased revenues.
4) Other
Other comprises construction, services and other business.
Revenues in this segment increased 6.3%, to ¥30.8 billion from the prior year, and accounted for 3.1% of
consolidated revenues. Sales of other business increased, while sales of construction decreased.
Operating income in Other increased 16.9%, to ¥2.5 billion.
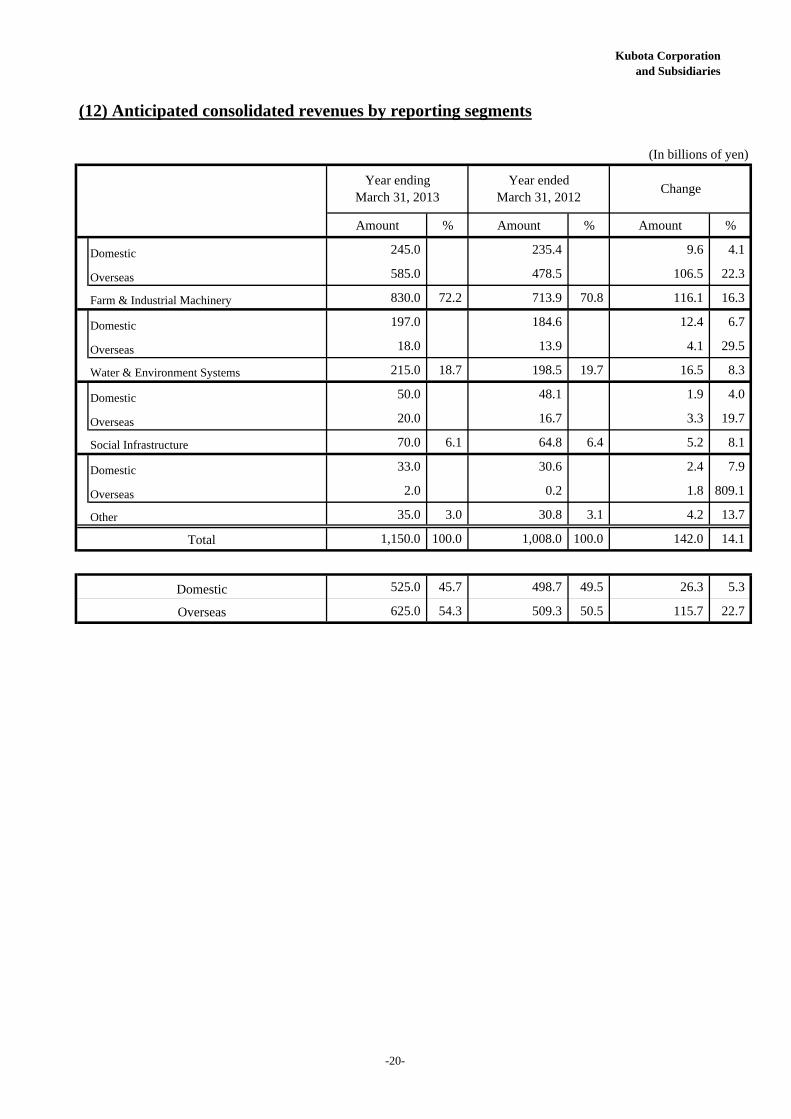
c) Prospects for the fiscal year ending March 31, 2013 The Company forecasts consolidated revenues for the year ending March 31, 2013 at ¥1,150.0 billion, ¥142.0
billion higher than during the year under review. Domestic revenues are forecast to increase due to increases in
revenues in all reporting segments. Overseas revenues are forecast to increase substantially due to higher revenues in
Farm & Industrial Machinery. Among revenues in this segment, revenues in Asia outside Japan will increase sharply
and revenues in North America and Europe are also expected to increase.
The Company forecasts operating income of ¥105.0 billion, a decrease of ¥0.7 billion from the year under
review. Although operating income is forecast to increase because of the rise in revenues, higher pension costs, a
decrease in gain on sales of land and an increase in accrual of amortization related to acquired businesses are forecast
to offset this increase in revenues. The Company expects income from continuing operations before income taxes and
equity in net income of affiliated companies for the next fiscal year to be ¥105.0 billion, an increase of ¥4.1 billion
from the year under review. Net income attributable to Kubota Corporation is forecast to be ¥65.0 billion, an increase
of ¥3.4 billion from the year under review. (These forecasts are based on the assumption of exchange rates of
¥80=US$1 and ¥105=1 Euro.)
(2) Financial condition a) Assets, liabilities and equity
Total assets at the end of March 2012 amounted to ¥1,487.7 billion, an increase of ¥130.8 billion from the
prior fiscal year-end. As for assets, notes and accounts receivable, inventories and intangible assets increased due to
Kubota Corporation and Subsidiaries
-7-
higher revenues and acquisition of businesses. Turning next to liabilities, current liabilities, such as trade accounts payable and income taxes payable,
increased substantially.
Equity increased because recorded net income compensated for increases in treasury stock and accumulated
other comprehensive loss deteriorated. The shareholders’ equity ratio was 43.9%, 2.9 percentage points lower than at
the prior fiscal year-end.
b) Cash flows Net cash provided by operating activities during the year under review was ¥79.9 billion, representing a
decrease of ¥2.0 billion in cash inflow compared with the prior year. Net cash provided by operating activities was at
almost the same level as in the prior year, due to an increase in trade notes and accounts payable and an increase in
income taxes payable, while notes and accounts receivable increased, mainly due to the rise in revenues.
Net cash used in investing activities was ¥69.9 billion, an increase of ¥26.3 billion in cash outflow compared
with the prior year. This increase in cash outflow was mainly due to the acquisition of businesses, while proceeds
from sales of property, plant and equipment (land) increased.
Net cash used in financing activities was ¥13.3 billion, representing a decrease of ¥28.5 billion in cash
outflow compared with the prior year. This decrease was mainly due to an increase of proceeds from the issuance of
long-term debt, while purchases of treasury stock increased.
Including the effect of exchange rate fluctuations, cash and cash equivalents at the end of March 31, 2012
were ¥100.6 billion, a decrease of ¥4.7 billion from the prior fiscal year-end.
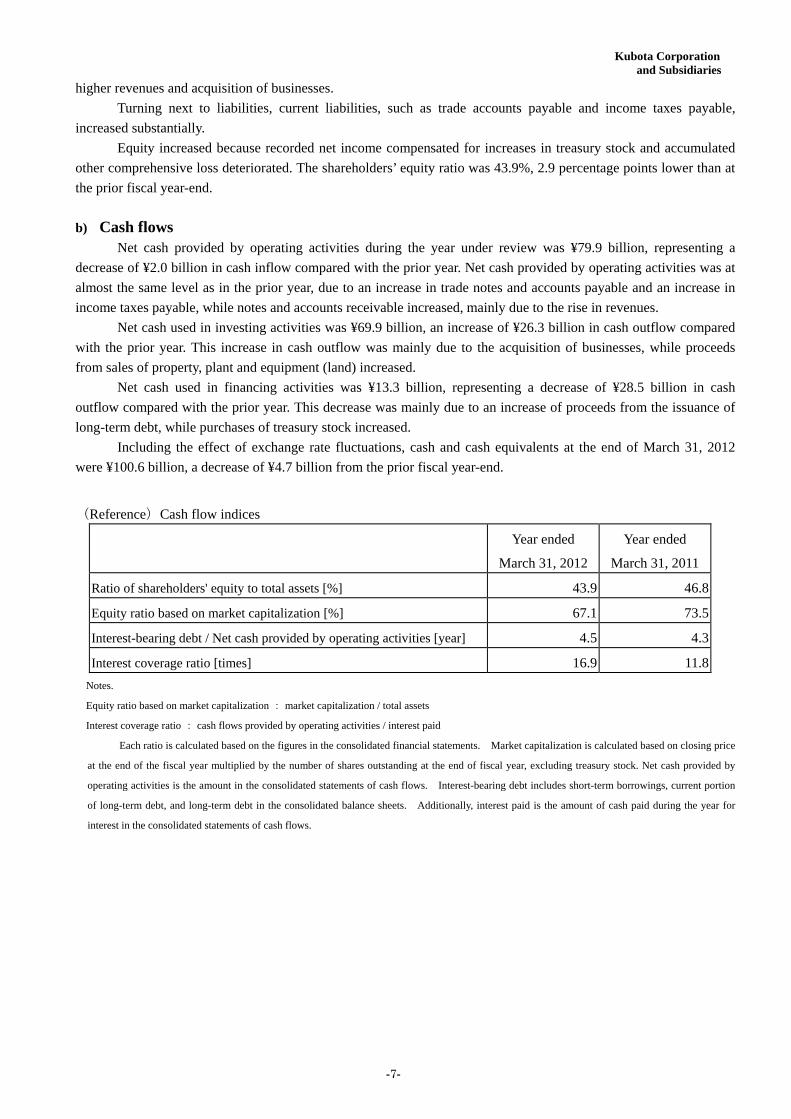
(Reference)Cash flow indices
Year ended
March 31, 2012
Year ended
March 31, 2011
Ratio of shareholders' equity to total assets [%] 43.9 46.8
Equity ratio based on market capitalization [%] 67.1 73.5
Interest-bearing debt / Net cash provided by operating activities [year] 4.5 4.3
Interest coverage ratio [times] 16.9 11.8
Notes.
Equity ratio based on market capitalization : market capitalization / total assets
Interest coverage ratio : cash flows provided by operating activities / interest paid
Each ratio is calculated based on the figures in the consolidated financial statements. Market capitalization is calculated based on closing price
at the end of the fiscal year multiplied by the number of shares outstanding at the end of fiscal year, excluding treasury stock. Net cash provided by
operating activities is the amount in the consolidated statements of cash flows. Interest-bearing debt includes short-term borrowings, current portion
of long-term debt, and long-term debt in the consolidated balance sheets. Additionally, interest paid is the amount of cash paid during the year for
interest in the consolidated statements of cash flows.
Kubota Corporation and Subsidiaries
-8-
2. Management policies (1) Basic management policy
For more than a century since its founding, the Company has continued to contribute to society through
helping to improve people’s quality of life, by offering products and services—including farm equipment, pipes for
water supply and sewage systems and environmental control plants.
And now, here in the 21st century, the Company is developing its business globally under the corporate
principle “Contribute to social development and the conservation of the global environment through products,
technology and services that support both comfortable lifestyles and the foundation of our societies” with the aim of
solving the worldwide problems of food, water and the environment.
In the years to come, the Company will strive to attain an even higher enterprise value, through improvement
of its capabilities for responding with flexibility to changes in society by emphasizing agility in its operations,
strengthening its global operational presence, and relentlessly working to transform itself.
(2) Principal business policies for medium- to-long-term growth in profit The Company is aiming to respond flexibly to severe changes in the corporate environment and become a
“sustainable company” that can continue to develop sustainably for the long term. To realize this objective, the
Company is strengthening the initiatives it has taken thus far of pursuing “management emphasizing the front-line of
business, with focus on technology and manufacturing capabilities,” and “enhancing CSR management,” as it also
implements the following policies.
1) Growth and expansion of overseas business The Company’s overseas business activities have generally continued to grow and expand steadily, despite
some temporary slowdowns as a result of economic downturns. The expansion of overseas business is indispensable
for the Company’s further development, and the expansion of business in the emerging markets is one of the
highest-priority issues. The Company is currently establishing production sites for engines in Thailand and
construction machinery in China with the aim of leveraging the output of these sites to substantially expand its
business activities in China and the rest of Asia. In addition, outside the emerging countries, the Company is
establishing a new tractor plant in North America, and, looking forward, the Company will continue to expand its
overseas production to manufacture market-oriented products.
The Company is also working to establish regional business operating systems that will make it easy to
achieve the effective use of resources at the regional level and plan and implement management measures and
policies that are suited to local conditions. With the establishment of a regional management company in China last
year as a first move in this direction, the Company will strive to upgrade and strengthen its regional management
functions going forward.
2) Formulation and implementation of long-term growth strategies in the fields of food, water and the environment
The Company is implementing a new growth strategy aimed at long-term business development, which is
focused around the fields of food, water and the environment. In the field of food, the Company is accelerating its
efforts to become a comprehensive manufacturer of agricultural machinery and is working to enter the production of
large-scale agricultural machinery for dry-field farming. During the fiscal year under review, the Company moved
forward with the adoption of large-scale machinery and acquired Kverneland ASA, a Norwegian manufacturer of
agri-implements. Looking forward, the Company will accelerate its initiatives in this direction. On the other hand, in
the fields of water and the environment, the Company has clearly defined its priority markets and is moving to secure
new growth opportunities by formulating and implementing business strategies to strengthen its position in these
markets. In Asia especially, where rapid growth is anticipated, the Company will aggressively expand its business
Kubota Corporation and Subsidiaries
-9-
activities, not only in China, which is a market the Company has already entered, but also in other countries in the
region.
3) Implementation of structural reforms As the Company works to grow and expand its overseas business, it will implement structural reforms related
to its products and businesses in the domestic market, which is diminishing in size. In the domestic market, the
Company will take measures to strength its position in fields where growth is possible. However, in those fields
where shrinkage and decline will be unavoidable because of economic and social changes, the Company will make
drastic structural reforms. By implementing thorough structural reforms, the Company will secure its performance in
the medium-to-long term and reallocate its resources to growth fields.
4) Organizational realignment for globalization of management and business expansion To accelerate the globalization and expansion of its business activities from an organizational perspective, the
Company implemented major organizational changes effective on April 1, 2012. These included eliminating its
previous consolidated division system and realigning the 14 operating divisions that existed under the consolidated
division system into 7 business divisions. The elimination of the consolidated division system is aimed at creating a
flatter organizational structure that will facilitate rapid decision making and, thereby, strengthen the Company’s
ability to respond to changes in the operating environment. The realignment of the operating divisions has the
objectives of expanding the scale of these divisions to make it possible to use their resources more efficiently and
realize synergies among businesses. In addition, to promote the development of solutions to address issues and
themes that cross over business divisions, the Company has introduced the business domain concept. Two such
domains have been established: the Farm & Industrial Machinery Domain and the Water & Environment Domain,
and members of the Board of Directors have been appointed to take overall charge of them. Moreover, staff
administrative departments in various divisions that perform similar functions have been integrated into the
headquarters organization in the Corporate Staff section with the aims of strengthening Group business support
functions and governance functions. These realignments of administrative functions, together with the previously
mentioned regional management functions, will support growth from an organizational standpoint.
< Cautionary Statements with Respect to Forward-Looking Statements >
This document may contain forward-looking statements that are based on management’s expectations, estimates, projections and
assumptions. These statements are not guarantees of future performance and involve certain risks and uncertainties, which are difficult to
predict. Therefore, actual future results may differ materially from what is forecast in forward-looking statements due to a variety of factors,
including, without limitation: general economic conditions in the Company's markets, particularly government agricultural policies, levels of
capital expenditures both in public and private sectors, foreign currency exchange rates, the occurrence of natural disasters, continued competitive
pricing pressures in the marketplace, as well as the Company's ability to continue to gain acceptance of its products.
Kubota Corporationand Subsidiaries3. Consolidated financial statements
(1) Consolidated balance sheets
Assets
Amount % Amount % Amount
100,559 105,293 (4,734)
Trade notes 71,713 56,185 15,528
Trade accounts 321,451 300,229 21,222
Less: Allowance for doubtful notes and accounts receivable (2,404) (2,806) 402
Total notes and accounts receivable, net 390,760 353,608 37,152
Short-term finance receivables-net 108,160 100,437 7,723
202,070 174,217 27,853
64,463 43,649 20,814
Total current assets 866,012 58.2 777,204 57.3 88,808
17,971 16,569 1,402
101,705 100,498 1,207
204,272 199,829 4,443
323,948 21.8 316,896 23.4 7,052
89,529 89,435 94
226,598 217,738 8,860
361,433 352,064 9,369
8,079 9,631 (1,552)
685,639 668,868 16,771
(460,572) (451,510) (9,062)
225,067 15.1 217,358 16.0 7,709
Other assets:
Goodwill and intangible assets 26,904 7,441 19,463
Long-term trade accounts receivable 31,409 27,487 3,922
Other 15,204 11,398 3,806
Less: Allowance for doubtful receivables (875) (932) 57
72,642 4.9 45,394 3.3 27,248
1,487,669 100.0 1,356,852 100.0 130,817
Total other assets
Total
Total
Land
Buildings
Property, plant, and equipment:
Total investments and long-term finance receivables
Construction in progress
Net property, plant, and equipment
Long-term finance receivables-net
March 31, 2011
Machinery and equipment
March 31, 2012
Notes and accounts receivable:
(In millions of yen)
Accumulated depreciation
Inventories
Other current assets
Investments in and loan receivables from affiliated companie
Other investments
Investments and long-term finance receivables:
Change
Current assets:
Cash and cash equivalents
-10-
Kubota Corporationand Subsidiaries
Liabilities and equity (In millions of yen)
Amount % Amount % Amount
Short-term borrowings 69,623 76,642 (7,019)
Trade notes payable 16,905 13,978 2,927
Trade accounts payable 199,072 150,825 48,247
Advances received from customers 6,983 3,270 3,713
Notes and accounts payable for capital expenditures 13,817 9,800 4,017
Accrued payroll costs 30,830 26,847 3,983
Accrued expenses 33,617 29,616 4,001
Income taxes payable 16,449 4,702 11,747
Other current liabilities 41,477 33,892 7,585
Current portion of long-term debt 107,210 85,556 21,654
535,983 36.0 435,128 32.1 100,855
Long-term debt 184,402 191,760 (7,358)
Accrued retirement and pension costs 41,882 35,285 6,597
Other long-term liabilities 18,188 13,318 4,870
244,472 16.4 240,363 17.7 4,109
Kubota Corporation shareholders' equity:
Common stock 84,070 84,070 -
Capital surplus 88,834 89,140 (306)
Legal reserve 19,539 19,539 -
Retained earnings 560,710 516,858 43,852
Accumulated other comprehensive loss (80,542) (65,381) (15,161)
Treasury stock (19,328) (9,341) (9,987)
Total Kubota Corporation shareholders' equity 653,283 43.9 634,885 46.8 18,398
Noncontrolling interests 53,931 3.7 46,476 3.4 7,455
707,214 47.6 681,361 50.2 25,853
1,487,669 100.0 1,356,852 100.0 130,817
Equity:
Total
Current liabilities:
Long-term liabilities:
Total current liabilities
Total long-term liabilities
Total equity
March 31, 2012 March 31, 2011 Change
-11-
Kubota Corporationand Subsidiaries
(2) Consolidated statements of income
Amount % Amount % Amount %
1,008,019 100.0 933,685 100.0 74,334 8.0
735,836 73.0 678,653 72.7 57,183 8.4
170,252 16.9 165,407 17.7 4,845 2.9
(3,749) ( 0.4 ) 3,514 0.4 (7,263) -
Operating income 105,680 10.5 86,111 9.2 19,569 22.7
Interest and dividend income 3,760 3,429 331
Interest expense (1,892) (1,632) (260)
Gain on sales of securities-net 105 4,845 (4,740)
Valuation loss on other investments (2,570) (1,758) (812)
Gain on nonmonetary exchange of securities - 2,774 (2,774)
Foreign exchange loss-net (7,609) (1,640) (5,969)
Other-net 3,464 (829) 4,293
Other income (expneses), net (4,742) 5,189 (9,931)
Income before income taxes and
equity in net income of affiliated companies 100,938 10.0 91,300 9.8 9,638 10.6
Current 35,594 27,137 8,457
Deferred 954 3,547 (2,593)
Total income taxes 36,548 30,684 5,864
Equity in net income of affiliated companies 1,629 492 1,137
Net income 66,019 6.5 61,108 6.5 4,911 8.0
4,467 6,286 (1,819)
Net income attributable to Kubota Corporation 61,552 6.1 54,822 5.9 6,730 12.3
Less: Net income attributable to the noncontrolling interests
(In millions of yen)
ChangeYear ended Year ended
Revenues
Cost of revenues
March 31, 2012 March 31, 2011
Income taxes:
Selling, general, and administrative expenses
Other income (expenses):
Other operaing expenses (income)
-12-
Kubota Corporationand Subsidiaries
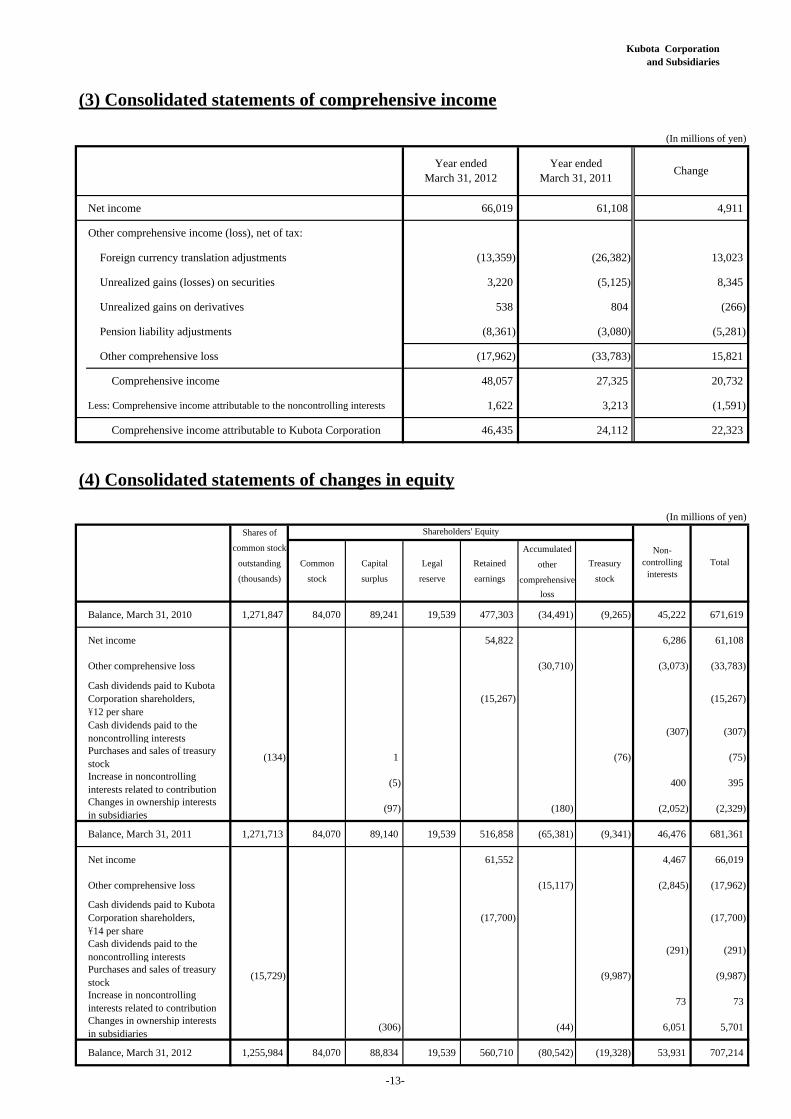
(3) Consolidated statements of comprehensive income
(In millions of yen)
Net income 66,019 61,108 4,911
Other comprehensive income (loss), net of tax:
Foreign currency translation adjustments (13,359) (26,382) 13,023
Unrealized gains (losses) on securities 3,220 (5,125) 8,345
Unrealized gains on derivatives 538 804 (266)
Pension liability adjustments (8,361) (3,080) (5,281)
Other comprehensive loss (17,962) (33,783) 15,821
Comprehensive income 48,057 27,325 20,732
Less: Comprehensive income attributable to the noncontrolling interests 1,622 3,213 (1,591)
Comprehensive income attributable to Kubota Corporation 46,435 24,112 22,323
(4) Consolidated statements of changes in equity
(In millions of yen)
Shares of
common stock Accumulated
outstanding Common Capital Legal Retained other Treasury
(thousands) stock surplus reserve earnings comprehensive stock
loss
Balance, March 31, 2010 1,271,847 84,070 89,241 19,539 477,303 (34,491) (9,265) 45,222 671,619
Net income 54,822 6,286 61,108
Other comprehensive loss (30,710) (3,073) (33,783)
Cash dividends paid to KubotaCorporation shareholders,\12 per share
(15,267) (15,267)
Cash dividends paid to thenoncontrolling interests
(307) (307)
Purchases and sales of treasurystock
(134) 1 (76) (75)
Increase in noncontrollinginterests related to contribution
(5) 400 395
Changes in ownership interestsin subsidiaries
(97) (180) (2,052) (2,329)
Balance, March 31, 2011 1,271,713 84,070 89,140 19,539 516,858 (65,381) (9,341) 46,476 681,361
Net income 61,552 4,467 66,019
Other comprehensive loss (15,117) (2,845) (17,962)
Cash dividends paid to KubotaCorporation shareholders,\14 per share
(17,700) (17,700)
Cash dividends paid to thenoncontrolling interests
(291) (291)
Purchases and sales of treasurystock
(15,729) (9,987) (9,987)
Increase in noncontrollinginterests related to contribution
73 73
Changes in ownership interestsin subsidiaries
(306) (44) 6,051 5,701
Balance, March 31, 2012 1,255,984 84,070 88,834 19,539 560,710 (80,542) (19,328) 53,931 707,214
Year endedMarch 31, 2012
Year endedMarch 31, 2011
Total
Change
Shareholders' Equity
Non-controlling
interests
-13-
Kubota Corporationand Subsidiaries
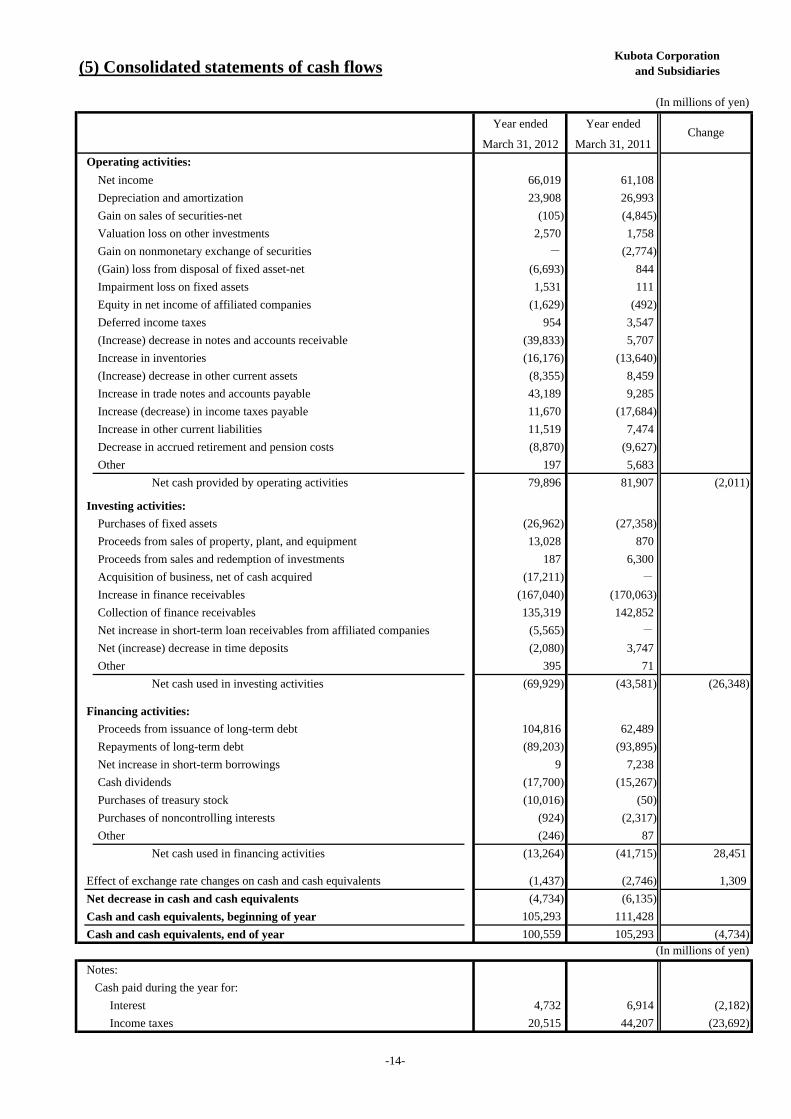
(In millions of yen)
Year ended Year ended
March 31, 2012 March 31, 2011
Net income 66,019 61,108
Depreciation and amortization 23,908 26,993
Gain on sales of securities-net (105) (4,845)
Valuation loss on other investments 2,570 1,758
Gain on nonmonetary exchange of securities - (2,774)
(Gain) loss from disposal of fixed asset-net (6,693) 844
Impairment loss on fixed assets 1,531 111
Equity in net income of affiliated companies (1,629) (492)
Deferred income taxes 954 3,547
(Increase) decrease in notes and accounts receivable (39,833) 5,707
Increase in inventories (16,176) (13,640)
(Increase) decrease in other current assets (8,355) 8,459
Increase in trade notes and accounts payable 43,189 9,285
Increase (decrease) in income taxes payable 11,670 (17,684)
Increase in other current liabilities 11,519 7,474
Decrease in accrued retirement and pension costs (8,870) (9,627)
Other 197 5,683
Net cash provided by operating activities 79,896 81,907 (2,011)
Investing activities:
Purchases of fixed assets (26,962) (27,358)
Proceeds from sales of property, plant, and equipment 13,028 870
Proceeds from sales and redemption of investments 187 6,300
Acquisition of business, net of cash acquired (17,211) -
Increase in finance receivables (167,040) (170,063)
Collection of finance receivables 135,319 142,852
Net increase in short-term loan receivables from affiliated companies (5,565) -
Net (increase) decrease in time deposits (2,080) 3,747
Other 395 71
Net cash used in investing activities (69,929) (43,581) (26,348)
Financing activities:
Proceeds from issuance of long-term debt 104,816 62,489
Repayments of long-term debt (89,203) (93,895)
Net increase in short-term borrowings 9 7,238
Cash dividends (17,700) (15,267)
Purchases of treasury stock (10,016) (50)
Purchases of noncontrolling interests (924) (2,317)
Other (246) 87
Net cash used in financing activities (13,264) (41,715) 28,451
Effect of exchange rate changes on cash and cash equivalents (1,437) (2,746) 1,309
Net decrease in cash and cash equivalents (4,734) (6,135)
Cash and cash equivalents, beginning of year 105,293 111,428
Cash and cash equivalents, end of year 100,559 105,293 (4,734)(In millions of yen)
Notes:
Cash paid during the year for:
Interest 4,732 6,914 (2,182)
Income taxes 20,515 44,207 (23,692)
(5) Consolidated statements of cash flows
Operating activities:
Change
-14-
Kubota Corporation and Subsidiaries
-15-
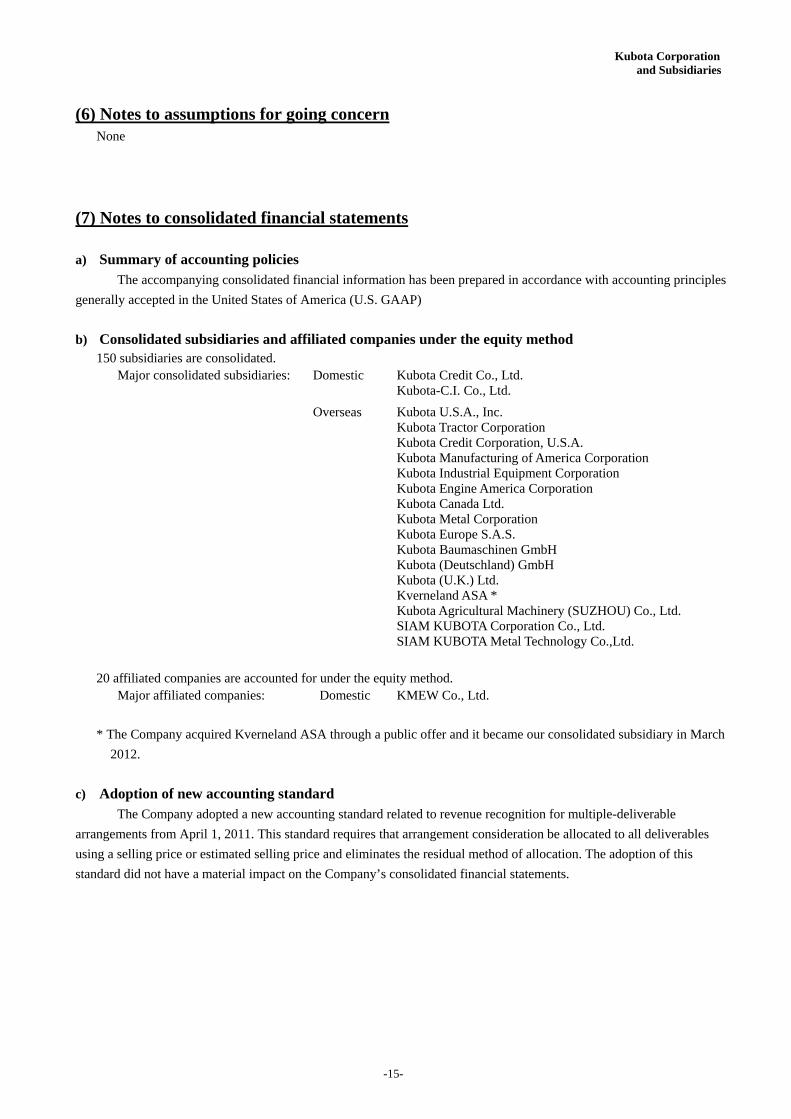
(6) Notes to assumptions for going concern None
(7) Notes to consolidated financial statements
a) Summary of accounting policies The accompanying consolidated financial information has been prepared in accordance with accounting principles
generally accepted in the United States of America (U.S. GAAP)
b) Consolidated subsidiaries and affiliated companies under the equity method 150 subsidiaries are consolidated.
Domestic
Kubota Credit Co., Ltd. Kubota-C.I. Co., Ltd.
Major consolidated subsidiaries:
Overseas Kubota U.S.A., Inc. Kubota Tractor Corporation Kubota Credit Corporation, U.S.A. Kubota Manufacturing of America Corporation Kubota Industrial Equipment Corporation Kubota Engine America Corporation Kubota Canada Ltd. Kubota Metal Corporation Kubota Europe S.A.S. Kubota Baumaschinen GmbH Kubota (Deutschland) GmbH Kubota (U.K.) Ltd. Kverneland ASA * Kubota Agricultural Machinery (SUZHOU) Co., Ltd. SIAM KUBOTA Corporation Co., Ltd. SIAM KUBOTA Metal Technology Co.,Ltd.
20 affiliated companies are accounted for under the equity method. Major affiliated companies: Domestic KMEW Co., Ltd.
* The Company acquired Kverneland ASA through a public offer and it became our consolidated subsidiary in March
2012.
c) Adoption of new accounting standard The Company adopted a new accounting standard related to revenue recognition for multiple-deliverable
arrangements from April 1, 2011. This standard requires that arrangement consideration be allocated to all deliverables
using a selling price or estimated selling price and eliminates the residual method of allocation. The adoption of this
standard did not have a material impact on the Company’s consolidated financial statements.
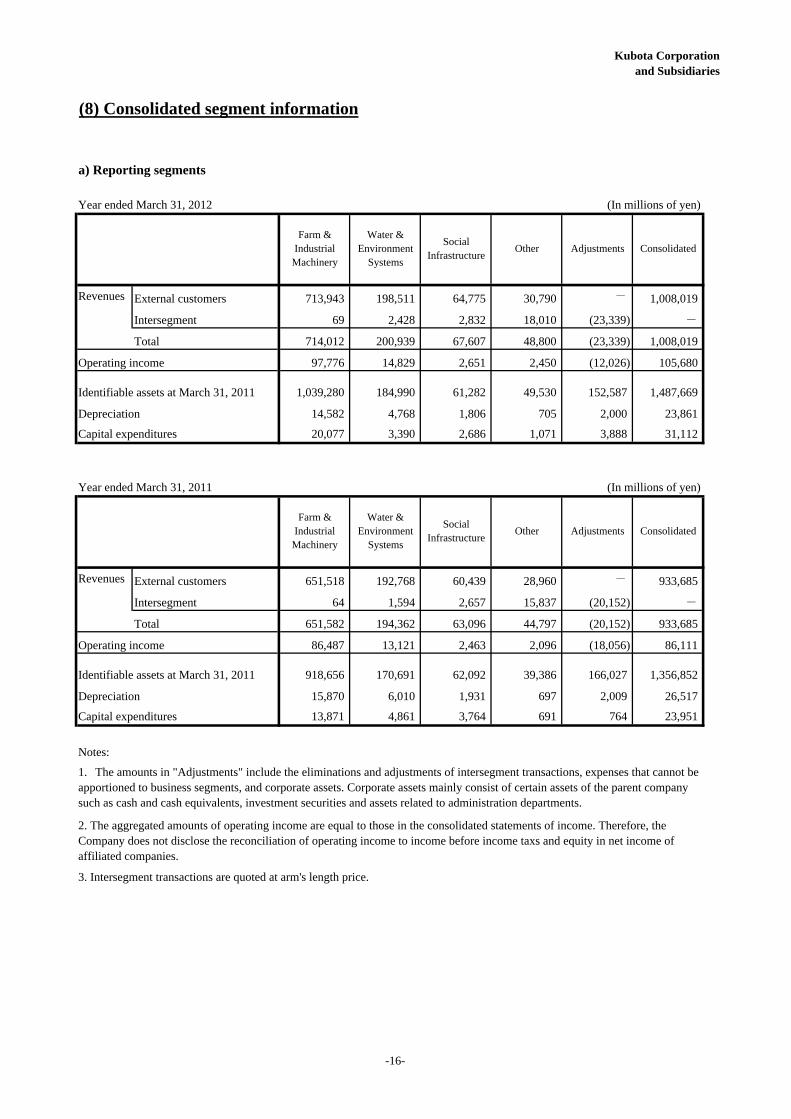
Kubota Corporationand Subsidiaries
a) Reporting segments
Year ended March 31, 2012
Revenues External customers 713,943 198,511 64,775 30,790 - 1,008,019
Intersegment 69 2,428 2,832 18,010 (23,339) -
Total 714,012 200,939 67,607 48,800 (23,339) 1,008,019
Operating income 97,776 14,829 2,651 2,450 (12,026) 105,680
Identifiable assets at March 31, 2011 1,039,280 184,990 61,282 49,530 152,587 1,487,669
Depreciation 14,582 4,768 1,806 705 2,000 23,861
Capital expenditures 20,077 3,390 2,686 1,071 3,888 31,112
Year ended March 31, 2011
Revenues External customers 651,518 192,768 60,439 28,960 - 933,685
Intersegment 64 1,594 2,657 15,837 (20,152) -
Total 651,582 194,362 63,096 44,797 (20,152) 933,685
Operating income 86,487 13,121 2,463 2,096 (18,056) 86,111
Identifiable assets at March 31, 2011 918,656 170,691 62,092 39,386 166,027 1,356,852
Depreciation 15,870 6,010 1,931 697 2,009 26,517
Capital expenditures 13,871 4,861 3,764 691 764 23,951
Notes:
3. Intersegment transactions are quoted at arm's length price.
(8) Consolidated segment information
Adjustments Consolidated
(In millions of yen)
(In millions of yen)
ConsolidatedAdjustments
1. The amounts in "Adjustments" include the eliminations and adjustments of intersegment transactions, expenses that cannot beapportioned to business segments, and corporate assets. Corporate assets mainly consist of certain assets of the parent companysuch as cash and cash equivalents, investment securities and assets related to administration departments.
2. The aggregated amounts of operating income are equal to those in the consolidated statements of income. Therefore, theCompany does not disclose the reconciliation of operating income to income before income taxs and equity in net income ofaffiliated companies.
Other
Farm &IndustrialMachinery
Farm &IndustrialMachinery
OtherWater &
EnvironmentSystems
SocialInfrastructure
Water &Environment
Systems
SocialInfrastructure
-16-
Kubota Corporationand Subsidiaries
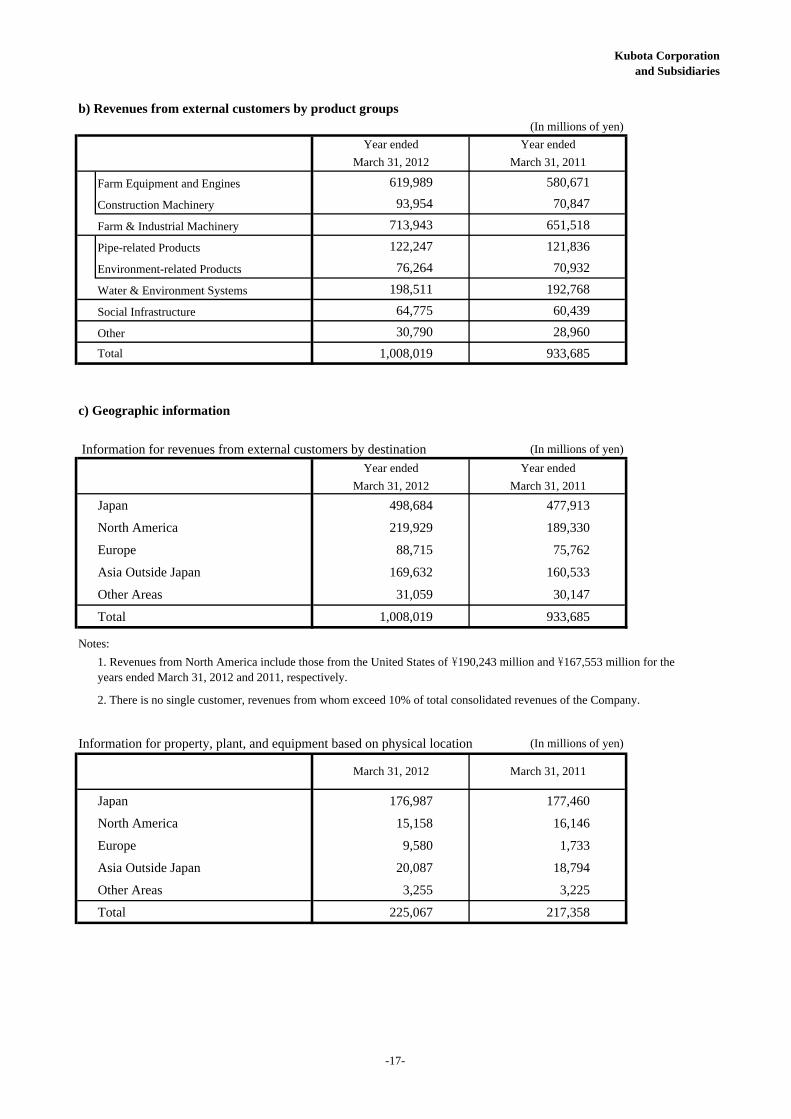
b) Revenues from external customers by product groups(In millions of yen)
Farm Equipment and Engines 619,989 580,671
Construction Machinery 93,954 70,847
Farm & Industrial Machinery 713,943 651,518
Pipe-related Products 122,247 121,836
Environment-related Products 76,264 70,932
Water & Environment Systems 198,511 192,768
Social Infrastructure 64,775 60,439
Other 30,790 28,960
Total 1,008,019 933,685
c) Geographic information
Information for revenues from external customers by destination (In millions of yen)
Japan 498,684 477,913
North America 219,929 189,330
Europe 88,715 75,762
Asia Outside Japan 169,632 160,533
Other Areas 31,059 30,147
Total 1,008,019 933,685
Notes:
Information for property, plant, and equipment based on physical location (In millions of yen)
Japan 176,987 177,460
North America 15,158 16,146
Europe 9,580 1,733
Asia Outside Japan 20,087 18,794
Other Areas 3,255 3,225
Total 225,067 217,358
March 31, 2012 March 31, 2011
2. There is no single customer, revenues from whom exceed 10% of total consolidated revenues of the Company.
March 31, 2012 March 31, 2011
Year ended
1. Revenues from North America include those from the United States of \190,243 million and \167,553 million for theyears ended March 31, 2012 and 2011, respectively.
Year ended
March 31, 2011
Year ended
Year ended
March 31, 2012
-17-
Kubota Corporationand Subsidiaries
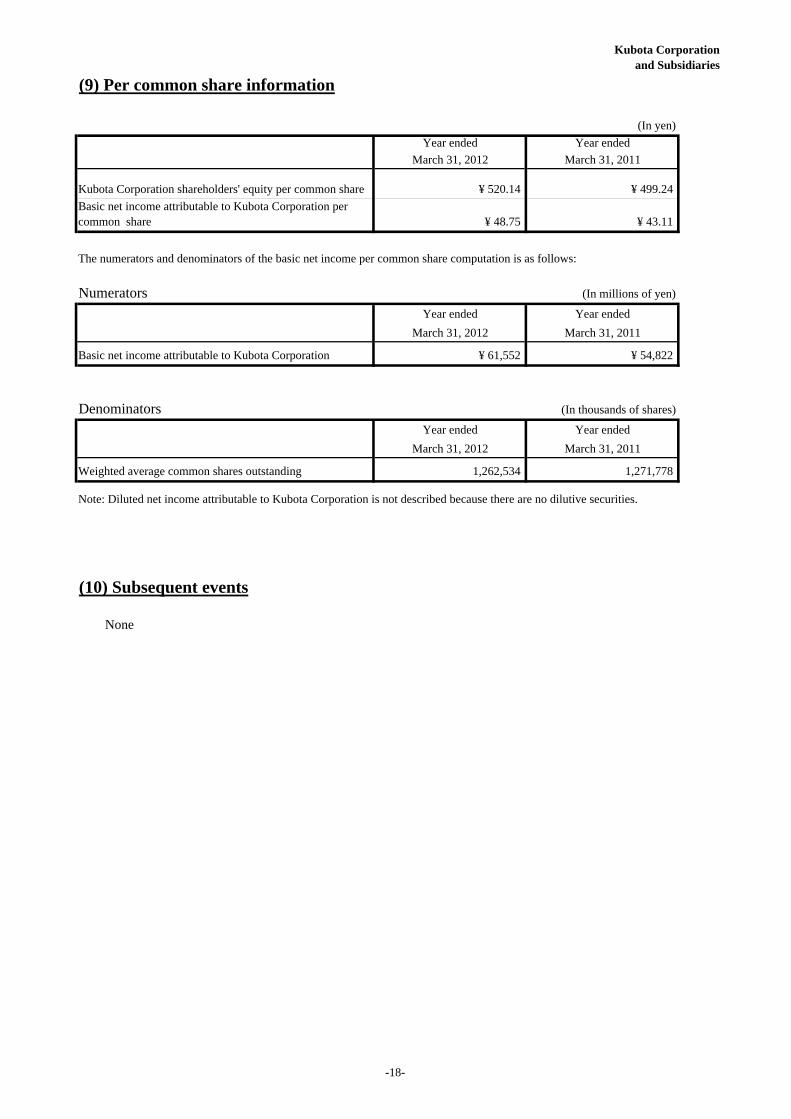
(9) Per common share information
(In yen)
The numerators and denominators of the basic net income per common share computation is as follows:
Numerators (In millions of yen)
Basic net income attributable to Kubota Corporation
Denominators (In thousands of shares)
Weighted average common shares outstanding
(10) Subsequent events
None
Note: Diluted net income attributable to Kubota Corporation is not described because there are no dilutive securities.
Year ended
March 31, 2011
Year ended
March 31, 2011
Year ended
¥ 61,552
Year ended
March 31, 2012 March 31, 2011
Year ended
¥ 499.24
¥ 43.11 ¥ 48.75
Year ended
¥ 520.14
1,271,778
Kubota Corporation shareholders' equity per common share
Basic net income attributable to Kubota Corporation percommon share
March 31, 2012
March 31, 2012
¥ 54,822
1,262,534
-18-
Kubota Corporationand Subsidiaries
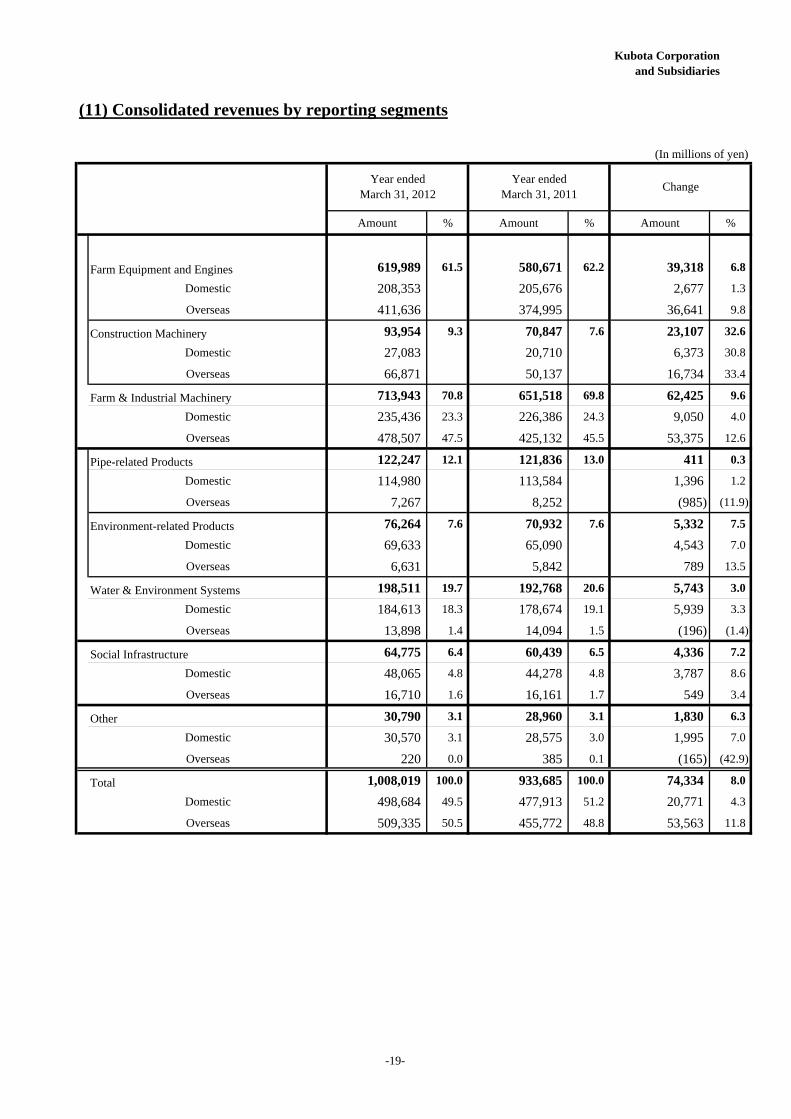
(11) Consolidated revenues by reporting segments
Amount % Amount % Amount %
Farm Equipment and Engines 619,989 61.5 580,671 62.2 39,318 6.8
Domestic 208,353 205,676 2,677 1.3
Overseas 411,636 374,995 36,641 9.8
Construction Machinery 93,954 9.3 70,847 7.6 23,107 32.6
Domestic 27,083 20,710 6,373 30.8
Overseas 66,871 50,137 16,734 33.4
Farm & Industrial Machinery 713,943 70.8 651,518 69.8 62,425 9.6
Domestic 235,436 23.3 226,386 24.3 9,050 4.0
Overseas 478,507 47.5 425,132 45.5 53,375 12.6
Pipe-related Products 122,247 12.1 121,836 13.0 411 0.3
Domestic 114,980 113,584 1,396 1.2
Overseas 7,267 8,252 (985) (11.9)
Environment-related Products 76,264 7.6 70,932 7.6 5,332 7.5
Domestic 69,633 65,090 4,543 7.0
Overseas 6,631 5,842 789 13.5
Water & Environment Systems 198,511 19.7 192,768 20.6 5,743 3.0
Domestic 184,613 18.3 178,674 19.1 5,939 3.3
Overseas 13,898 1.4 14,094 1.5 (196) (1.4)
Social Infrastructure 64,775 6.4 60,439 6.5 4,336 7.2
Domestic 48,065 4.8 44,278 4.8 3,787 8.6
Overseas 16,710 1.6 16,161 1.7 549 3.4
Other 30,790 3.1 28,960 3.1 1,830 6.3
Domestic 30,570 3.1 28,575 3.0 1,995 7.0
Overseas 220 0.0 385 0.1 (165) (42.9)
Total 1,008,019 100.0 933,685 100.0 74,334 8.0
Domestic 498,684 49.5 477,913 51.2 20,771 4.3
Overseas 509,335 50.5 455,772 48.8 53,563 11.8
(In millions of yen)
Year endedMarch 31, 2012
Year endedMarch 31, 2011
Change
-19-
Kubota Corporationand Subsidiaries
(12) Anticipated consolidated revenues by reporting segments
(In billions of yen)
Amount % Amount % Amount %
Domestic 245.0 235.4 9.6 4.1
Overseas 585.0 478.5 106.5 22.3
Farm & Industrial Machinery 830.0 72.2 713.9 70.8 116.1 16.3
Domestic 197.0 184.6 12.4 6.7
Overseas 18.0 13.9 4.1 29.5
Water & Environment Systems 215.0 18.7 198.5 19.7 16.5 8.3
Domestic 50.0 48.1 1.9 4.0
Overseas 20.0 16.7 3.3 19.7
Social Infrastructure 70.0 6.1 64.8 6.4 5.2 8.1
Domestic 33.0 30.6 2.4 7.9
Overseas 2.0 0.2 1.8 809.1
Other 35.0 3.0 30.8 3.1 4.2 13.7
1,150.0 100.0 1,008.0 100.0 142.0 14.1
525.0 45.7 498.7 49.5 26.3 5.3
625.0 54.3 509.3 50.5 115.7 22.7Overseas
Year endingMarch 31, 2013
Year endedMarch 31, 2012
Change
Total
Domestic
-20-
Kubota Corporationand Subsidiaries
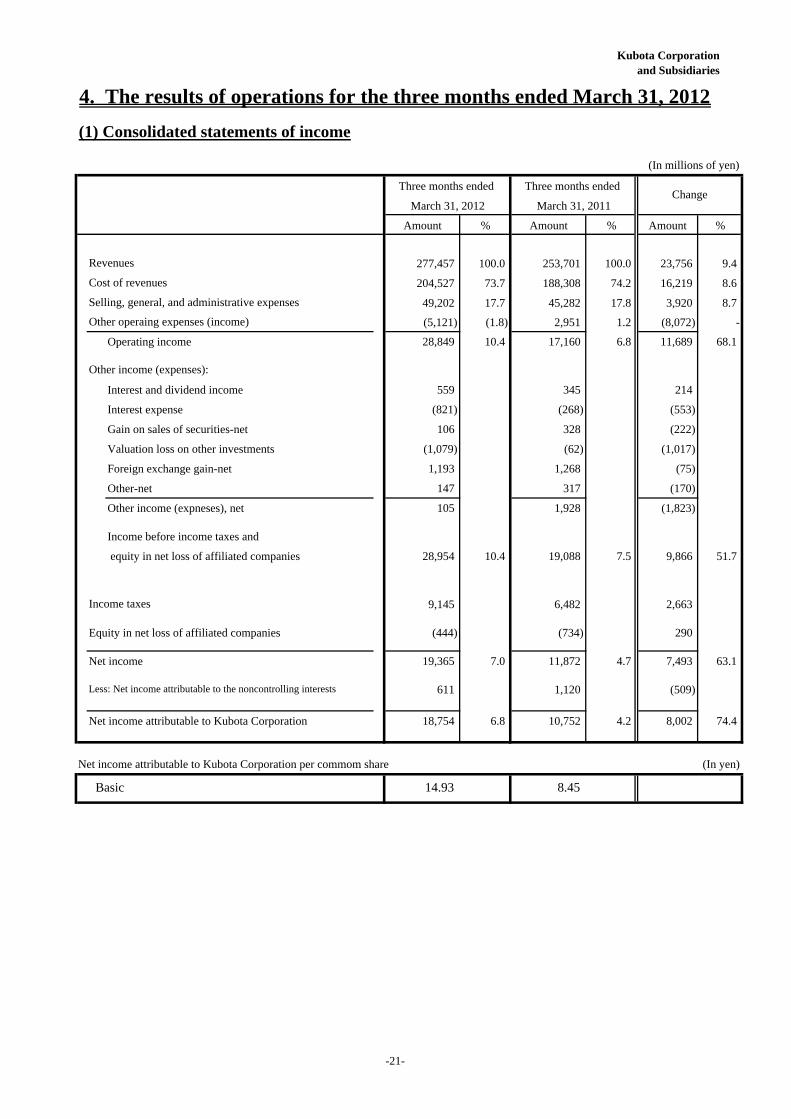
4. The results of operations for the three months ended March 31, 2012
(1) Consolidated statements of income
Amount % Amount % Amount %
277,457 100.0 253,701 100.0 23,756 9.4
204,527 73.7 188,308 74.2 16,219 8.6
49,202 17.7 45,282 17.8 3,920 8.7
(5,121) (1.8) 2,951 1.2 (8,072) -
Operating income 28,849 10.4 17,160 6.8 11,689 68.1
Interest and dividend income 559 345 214
Interest expense (821) (268) (553)
Gain on sales of securities-net 106 328 (222)
Valuation loss on other investments (1,079) (62) (1,017)
Foreign exchange gain-net 1,193 1,268 (75)
Other-net 147 317 (170)
Other income (expneses), net 105 1,928 (1,823)
Income before income taxes and
equity in net loss of affiliated companies 28,954 10.4 19,088 7.5 9,866 51.7
9,145 6,482 2,663
Equity in net loss of affiliated companies (444) (734) 290
Net income 19,365 7.0 11,872 4.7 7,493 63.1
611 1,120 (509)
Net income attributable to Kubota Corporation 18,754 6.8 10,752 4.2 8,002 74.4
Net income attributable to Kubota Corporation per commom share (In yen)
Basic 14.93 8.45
Income taxes
Selling, general, and administrative expenses
Other income (expenses):
Other operaing expenses (income)
Less: Net income attributable to the noncontrolling interests
(In millions of yen)
ChangeThree months ended Three months ended
Revenues
Cost of revenues
March 31, 2012 March 31, 2011
-21-
Kubota Corporationand Subsidiaries
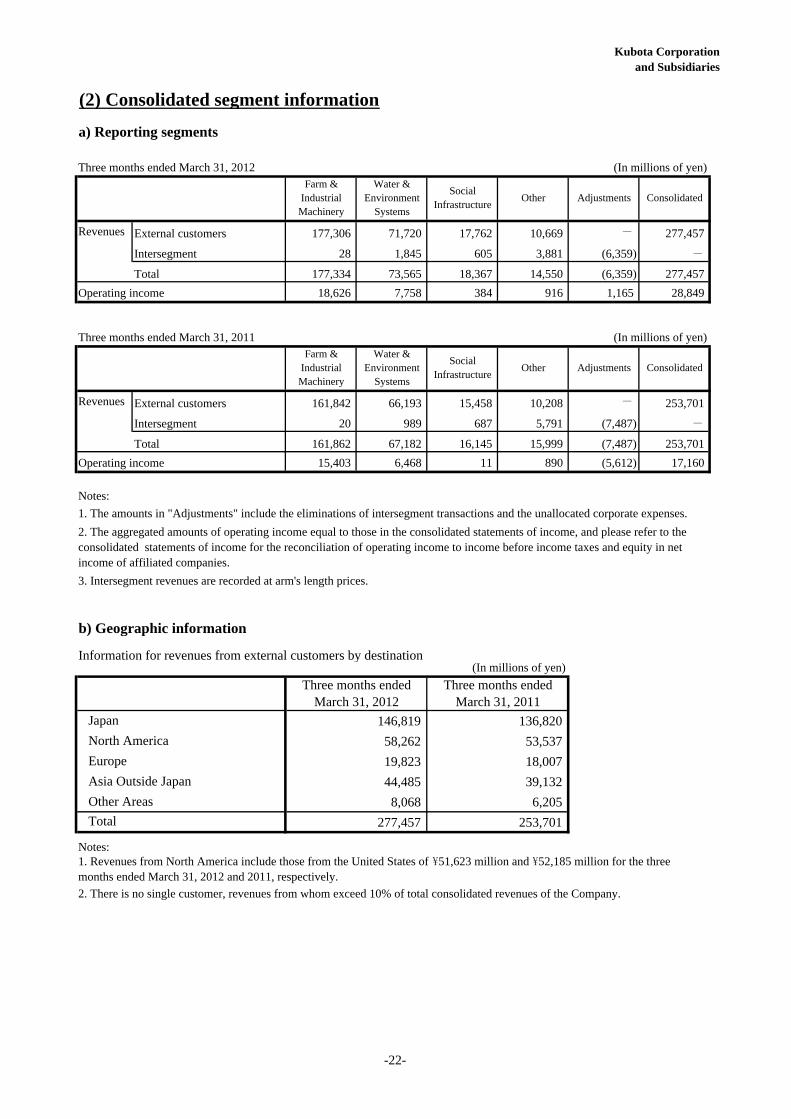
(2) Consolidated segment information
a) Reporting segments
Three months ended March 31, 2012
Revenues External customers 177,306 71,720 17,762 10,669 - 277,457
Intersegment 28 1,845 605 3,881 (6,359) -
Total 177,334 73,565 18,367 14,550 (6,359) 277,457
Operating income 18,626 7,758 384 916 1,165 28,849
Three months ended March 31, 2011
Revenues External customers 161,842 66,193 15,458 10,208 - 253,701
Intersegment 20 989 687 5,791 (7,487) -
Total 161,862 67,182 16,145 15,999 (7,487) 253,701
Operating income 15,403 6,468 11 890 (5,612) 17,160
Notes:
3. Intersegment revenues are recorded at arm's length prices.
b) Geographic information
Information for revenues from external customers by destination
146,819 136,820
58,262 53,537
19,823 18,007
44,485 39,132
8,068 6,205
277,457 253,701
Notes:
2. There is no single customer, revenues from whom exceed 10% of total consolidated revenues of the Company.
1. Revenues from North America include those from the United States of \51,623 million and \52,185 million for the threemonths ended March 31, 2012 and 2011, respectively.
Three months endedMarch 31, 2012
Total
Other Areas
Japan
North America
Other
Europe
Adjustments Consolidated
Three months endedMarch 31, 2011
1. The amounts in "Adjustments" include the eliminations of intersegment transactions and the unallocated corporate expenses.
2. The aggregated amounts of operating income equal to those in the consolidated statements of income, and please refer to theconsolidated statements of income for the reconciliation of operating income to income before income taxes and equity in netincome of affiliated companies.
Farm &IndustrialMachinery
Water &Environment
Systems
SocialInfrastructure
(In millions of yen)
Asia Outside Japan
(In millions of yen)Farm &
IndustrialMachinery
Water &Environment
Systems
(In millions of yen)
ConsolidatedSocial
InfrastructureOther Adjustments
-22-
Kubota Corporationand Subsidiaries
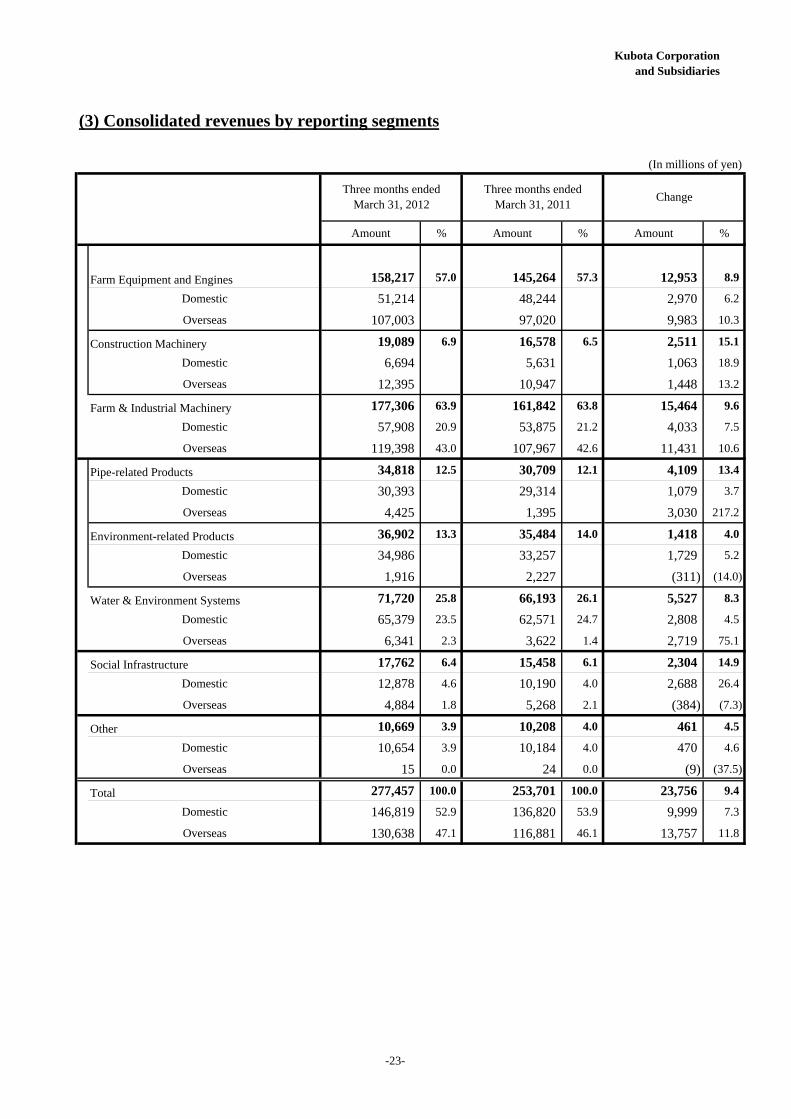
(3) Consolidated revenues by reporting segments
Amount % Amount % Amount %
Farm Equipment and Engines 158,217 57.0 145,264 57.3 12,953 8.9
Domestic 51,214 48,244 2,970 6.2
Overseas 107,003 97,020 9,983 10.3
Construction Machinery 19,089 6.9 16,578 6.5 2,511 15.1
Domestic 6,694 5,631 1,063 18.9
Overseas 12,395 10,947 1,448 13.2
Farm & Industrial Machinery 177,306 63.9 161,842 63.8 15,464 9.6
Domestic 57,908 20.9 53,875 21.2 4,033 7.5
Overseas 119,398 43.0 107,967 42.6 11,431 10.6
Pipe-related Products 34,818 12.5 30,709 12.1 4,109 13.4
Domestic 30,393 29,314 1,079 3.7
Overseas 4,425 1,395 3,030 217.2
Environment-related Products 36,902 13.3 35,484 14.0 1,418 4.0
Domestic 34,986 33,257 1,729 5.2
Overseas 1,916 2,227 (311) (14.0)
Water & Environment Systems 71,720 25.8 66,193 26.1 5,527 8.3
Domestic 65,379 23.5 62,571 24.7 2,808 4.5
Overseas 6,341 2.3 3,622 1.4 2,719 75.1
Social Infrastructure 17,762 6.4 15,458 6.1 2,304 14.9
Domestic 12,878 4.6 10,190 4.0 2,688 26.4
Overseas 4,884 1.8 5,268 2.1 (384) (7.3)
Other 10,669 3.9 10,208 4.0 461 4.5
Domestic 10,654 3.9 10,184 4.0 470 4.6
Overseas 15 0.0 24 0.0 (9) (37.5)
Total 277,457 100.0 253,701 100.0 23,756 9.4
Domestic 146,819 52.9 136,820 53.9 9,999 7.3
Overseas 130,638 47.1 116,881 46.1 13,757 11.8
(In millions of yen)
Three months endedMarch 31, 2012
Three months endedMarch 31, 2011
Change
-23-
Kubota Corporation and Subsidiaries
-24-
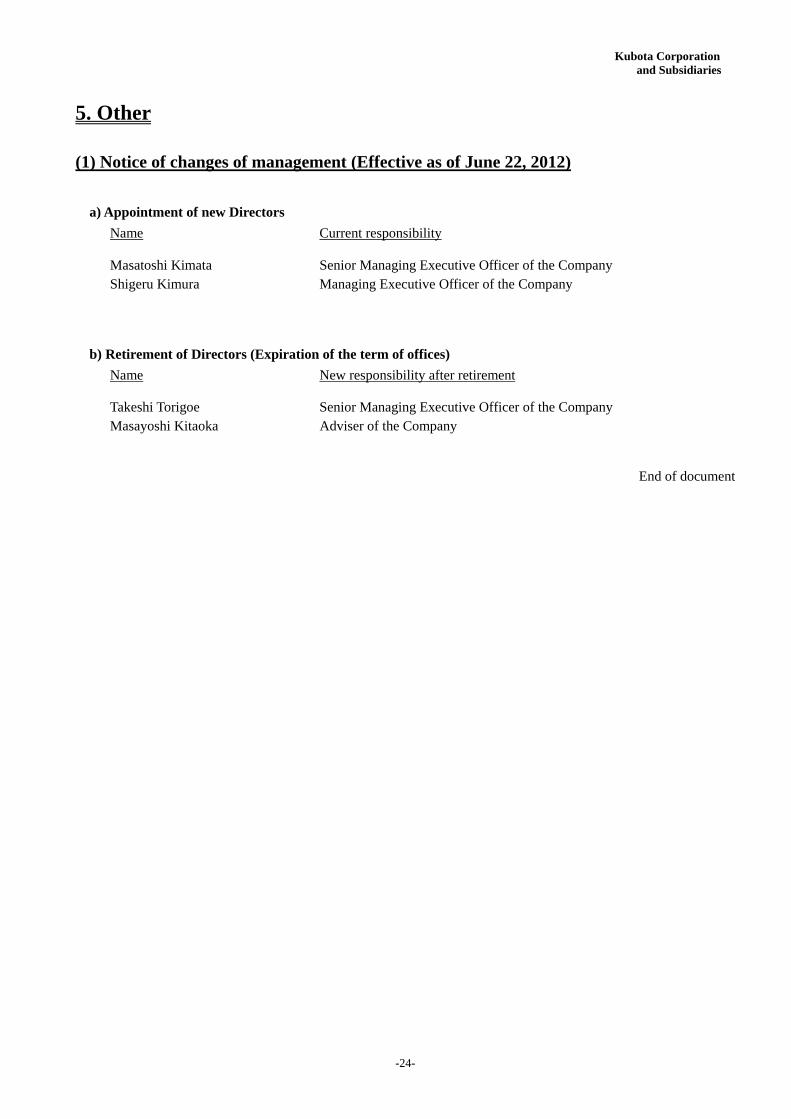
5. Other
(1) Notice of changes of management (Effective as of June 22, 2012)
a) Appointment of new Directors
Name
Current responsibility
Masatoshi Kimata Senior Managing Executive Officer of the Company Shigeru Kimura Managing Executive Officer of the Company
b) Retirement of Directors (Expiration of the term of offices)
Name
New responsibility after retirement
Takeshi Torigoe Senior Managing Executive Officer of the Company Masayoshi Kitaoka Adviser of the Company
End of document