Embed Size (px)
DESCRIPTION
IISTE international journals call for paper http://www.iiste.org/Journals
Citation preview
Journal of Biology, Agriculture and Healthcare www.iiste.org ISSN 2224-3208 (Paper) ISSN 2225-093X (Online) Vol 2, No.1, 2012
17
Diagnosing the financial health of Selected Pharmaceutical
Companies in Bangladesh
Md. Tofael Hossain Majumder, Mohammed Mizanur Rahman
School of Business and Economics Atish Dipankar University of Science and Technology
Dhaka, Bangladesh. Email: [email protected]
Abstract
In a developing country like Bangladesh the Pharmaceutical industry as a whole play a vital role in the
progress of economicdevelopment. But the net profit of this industry has decreased for the last few years. In
this paper we have tried to analyze the financial performance of Selected Pharmaceutical Companies
in Bangladesh which is measured in terms of Ratio (Profitability, Liquidity, Solvency and Activity ratio)
Analysis and in terms of Testing Financial Soundness by using Multivariate Discriminate Analysis (MDA) as
developed by Prof. Altman. For the source of data mainly relied on Annual Reports and official records. It
was observed from the study of the financial statement of the Pharmaceutical industry that the profit earning
capacity, liquidity position, financial position and the performance of the most of the Pharmaceuticals are not
in sound position and it was also observed that the most of the Pharmaceuticals has a lower level position of
bankruptcy. The reasons behind this position of the industry are inefficiency of financial management,
absence of realistic goals, strict government regulation and increased cost of raw-materials, labor and
overhead. The financial performance should be improved immediately. Therefore, the appropriate authority
should take measures for the removal of the above problems. Keywords: Financial Performance, Ratio Analysis, Pharmaceuticals Industry, Multivariate Discriminate
Analysis (MDA).
1. Introduction
Publicly traded companies are the economic pulse of a nation. Their birth, prosperity and demise generally
reflect the financial condition of the country. A fairly reliable index of an economy in its process of growth
and development is the rate of growth and decline of publicly traded companies. With the rapid growth of
trade, commerce and industries, the numbers of publicly traded companies are considerably increasing
in Bangladesh. These companies play a vital role on the economy of the country. Pharmaceutical is an
important adjunct of industrialization in the country. Analyzing the Industrial Life Cycle, it has been found
that all of the listed companies have just reached the middle stage. No company could reach the maturity
stage. In a word, the Pharmaceutical industry of the country is just improving. It is well known that this
industry is one of the key to earning foreign currency and it plays an important role on the export of the
country. On the other hand, most of the internal demand for drugs is fulfilled by the domestic Pharmaceutical
Journal of Biology, Agriculture and Healthcare www.iiste.org ISSN 2224-3208 (Paper) ISSN 2225-093X (Online) Vol 2, No.1, 2012
18
industry of the country. But Pharmaceutical industry of Bangladesh depends on foreign country for
raw-material and technology. Now the time to make the Pharmaceutical firms self sufficient for the
betterment of the country. At this time, performance of manufacturing enterprise, like Pharmaceutical, needs
to be measured and analyzed. But evaluation of performance is not a regular practice in the country. Against
this backdrop this study is an attempt to evaluate performance of some selected Pharmaceuticals for the
period under study. To evaluate the financial performance of the Pharmaceuticals, the technique of financial
analysis has been applied. Among the various tools of financial analysis the most important one is the ratio
analysis. It is very helpful to gain valuable insight into the financial position, operation and financial
problems of a particulars enterprise. Moreover, Multivariate Discriminate Analysis (MDA) is used which is
developed by Professor Altman to examine the overall financial soundness. Some statistical tools like mean,
standard deviation, and T-test are used to evaluate the performance.
2. Objectives of the study
The study is designed to achieve the following objectives:
(i) To assess the financial performance of the selected Pharmaceuticals firms.
(ii) To test the financial strengths and weaknesses of selected Pharmaceuticals firms.
(iii) To pinpoint the causes of poor financial performance and suggest some measures to overcome the
problems.
3. Hypothesis
The research is based on following hypothesis.
H0: There is no significant difference between the industry mean and the individual firm’s ratio.
H1: There is significant difference between the industry mean and the individual firm’s ratio.
4. Methodology of the study
Data has been taken from a sample of 9 Pharmaceuticals in Bangladesh. For the study only A and B category
Pharmaceuticals are considered. “A” category Pharmaceutical includes those Pharmaceuticals that hold
annual general meeting (AGM) and declare minimum 10% dividend regularly. The trading time of “A”
category Pharmaceutical’s share is T+3. “B” category Pharmaceutical includes those Pharmaceuticals that
hold annual general meeting (AGM) regularly but declare dividend at a rate below 10% on a regular basis.
The trading time of “B” category Pharmaceutical’s share is also T+3. “Z” category Pharmaceutical includes
those Pharmaceuticals that neither hold annual general meeting (AGM) nor declare dividend on a regular
basis. The trading time of “Z” category Pharmaceutical’s share is T+7. Moreover, the size of the
Pharmaceuticals, availability of information, and year of establishment are also considered for selecting the
Journal of Biology, Agriculture and Healthcare www.iiste.org ISSN 2224-3208 (Paper) ISSN 2225-093X (Online) Vol 2, No.1, 2012
19
Pharmaceuticals. The study covers a three year period from 2005-06 to 2007-08. This study is based on
secondary data. Secondary data are the annual reports of the selected Pharmaceuticals firms and various
studies made available through library work. The collected data have been tabulated, analyzed and
interpreted with the help of different financial ratios, Multivariate Discriminate Analysis (MDA) and
statistical tools like mean, S.D. and T-test, etc. The hypothesis has been tested statistically to arrive at
conclusion and policy implication.
5. Literature Review
Financial statements analysis is mainly concerned with the understanding of company accounts and
interpretation of the published financial statements to enable legitimate users to make informed economic
decisions. Financial analysis is the process of identifying the financial strengths and weaknesses of the firm
by properly establishing relationship between the items of the balance sheet and the profit and loss account
(Pandey, 1991). Analysis of financial statements is of interest to lenders, security analysts, managers and
others (Prasanna, 1995). Trade creditors are interested in the firm’s ability to meet their claims. Their analysis
will therefore, confine to the evaluation of the firm’s liquidity position. The suppliers are concerned with the
firm’s solvency and survival. They analyze the firm’s profitability over time. Long term creditors place more
emphasis on the firm’s solvency and profitability. The investors are most concerned about the firm’s earnings.
So, they concentrate on the analysis of the firm’s present and future profitability as well as earning ability and
risk (Abu Sina, 1998). Financial ratios are the simplest tools for evaluating the financial performance of the
firm (Chin-Feng, 2005). One can employ financial ratios to determine a firm’s liquidity, profitability,
solvency, capital structure and asset turnover. Hannan (1998) used financial ratios to show the financial
position and performance analysis of Bangladesh Shilpa Bank. He showed that techniques of financial
analysis can be used in the evaluation of financial position and performance of financial institution as well as
non financial institutions even Development Financial Institutions (DFI). Altman (1968) used financial ratios
to predict corporate bankruptcy. He found that the bankruptcy model has an accuracy rate of 93% and is very
successful in predicting failed and non-failed firms. Sina (1998) used financial ratios to test the financial
strengths and weaknesses of Khulna Newsprint Mills Ltd. He found that due to lack of planning and control
of working capital, operational inefficiency, obsolete store, ineffective credit policy, increased cost of raw
materials, labor and overhead, the position of the company was not good. Jahur (1995) used financial ratios to
measure operational performance of limited company. He used profitability, liquidity, activity and capital
structure to measure operational performance. Jahur (1996) used Altman’s MDA model to conclude the
bankruptcy position of Chittagong Steel Mills Ltd. He found that absences of realistic goals, strict govt.
regulation are the main reasons for the lowest level of bankruptcy. Ohlson (1980) employed financial ratios to
predict a firm’s crisis. He found that there are four factors affecting a firm’s vulnerability. These factors are
the firm’s scale, financial structure, performance and liquidity. In the article “The Assessment of Financial
and Operating Performance of the Cement Industry: A Case Study of Confidence Cement Limited”, Dipak &
Milan (2001) found that the investment in cement was fairly profitable. Salauddin (2001) examined the
profitability of the Pharmaceutical Companies of Bangladesh. By using ratio analysis, mean, standard
deviation and co-efficient of variation he found that the profitability of the Pharmaceuticals sector was very
satisfactory in terms of the standard norms of return on investment. Hye & Rahman (1997) conducted a
Journal of Biology, Agriculture and Healthcare www.iiste.org ISSN 2224-3208 (Paper) ISSN 2225-093X (Online) Vol 2, No.1, 2012
20
research to assess the performance of the selected private sector general insurance companies in Bangladesh.
The study revealed that the private sector insurance companies had made substantial progress. The study
found that the insurance companies were keeping their surplus funds in the form of fixed deposits with
different commercial banks due to absence of suitable revenues for investment. Salim & Kabir (1996)
examined the financial performance of Bangladesh Shipping Corporation. They found that conversion of
long-term debt to equity may improve the financial performance of Bangladesh Shipping Corporation to a
greater extent. These studies show that the ratio analysis and MDA are the good method to evaluate firm
performance. The researcher uses these tools to measure the financial performance of 9 selected
Pharmaceutical firms in this paper.
6. Theoretical discussion of Financial Ratio
Financial analysis offers a system of appraisal and evaluation of a firm’s performance and operations; it is the
analysis of the financial statement of an enterprise. The analysis of financial statement can be best done by
various yardsticks of which, the important is known as ratio or percentage analysis. Ratio is a numerical or an
arithmetical relation between two figures. It is expressed when one figure is divided by another. Accounting
ratios show inter-relationship which exist among various accounting data. Accounting ratio can be expressed
in various ways such as, a pure ratio, a rate or a percentage. Ratio analysis is certainly a very admirable device
because it is simple and it has a predictive value. Management and other users thus, rely substantially on the
financial ratios based on accounting data for making assessments and predictions of past performance,
present position and probable future potentials. One important way for diagnosing the financial health is to
measure the profitability, liquidity, activity and solvency and the level of the bankruptcy of enterprise.
6.1 Profitability Ratio
Profitability is a measure of efficiency. The profitability ratios measure the performance of profit of an
enterprise. In other words the profitability ratios are designed to provide answers to questions such as what is
the rate of profit?. What is EPS? What is the rate of investment? What is the rate of equity? Is the profit
earned by the enterprise adequate? What is the dividend payout ratio? What is retention ratio and so on? The
analysis of the profitability ratio is important for the shareholders, creditors, prospective investors, bankers
and the government alike. Gross profit margin ratio, return on investment, net profit margin ratio and
operating profit ratio can be used to measure the profitability position of the enterprise.
6.2 Liquidity Ratio
The liquidity ratios measure the ability of an enterprise to meet its short-term obligations and reflect the
short-term financial strength of an enterprise. Liquidity is a pre-requisite for the very survival of an enterprise.
Analysis of liquidity is very important in knowing the liquidity status, movement of funds, idle fund (if any)
which will not only help financial management to keep the liquidity position of the company in order but
also make sure of payment to short-term creditors, interested in short-term solvency of the company.
Liquidity ratios reveal the rate at which fixed and working assets are being converted into cash and the time
Journal of Biology, Agriculture and Healthcare www.iiste.org ISSN 2224-3208 (Paper) ISSN 2225-093X (Online) Vol 2, No.1, 2012
21
when the cash will be required. Current ratio, quick ratio and working capital to total asset ratio can be used to
measure the liquidity position of the enterprise.
6.3 Activity Ratio
Activity ratios indicate the effectiveness of an enterprise with which different assets are managed and utilized
in a business. The efficiency in assets management is measured by activity ratio which involves the
comparisons between the level of sales and investment in various assets accounts, inventories, bills
receivable, fixed assets and others. The activity can be measured by the use of activity ratios such as
inventory turnover, fixed assets turnover and total assets turnover.
6.4 Solvency Ratio
The long-term solvency of a company is an important aspect to the present and future long-term creditors,
banks, debenture holders etc. Before sanctioning loan or buying a debenture or preference share, they are
interested to see whether the company has ability to pay the interest regularly as well as repay the installment
of the principal on due date or in one lump sum at the time of maturity. The long-run solvency of a company
can be measured by the use of solvency ratios named debt to total assets, the time interest earned and retained
earning to total assets.
7. Findings and Discussions
7.1 Profitability Ratio
The tables (01, 02,03,04,05 and 06) depict various financial ratios covering profitability of the selected
Pharmaceuticals for the period under study.
(Insert Table-01 here) 7.1.1 Gross Profit Margin
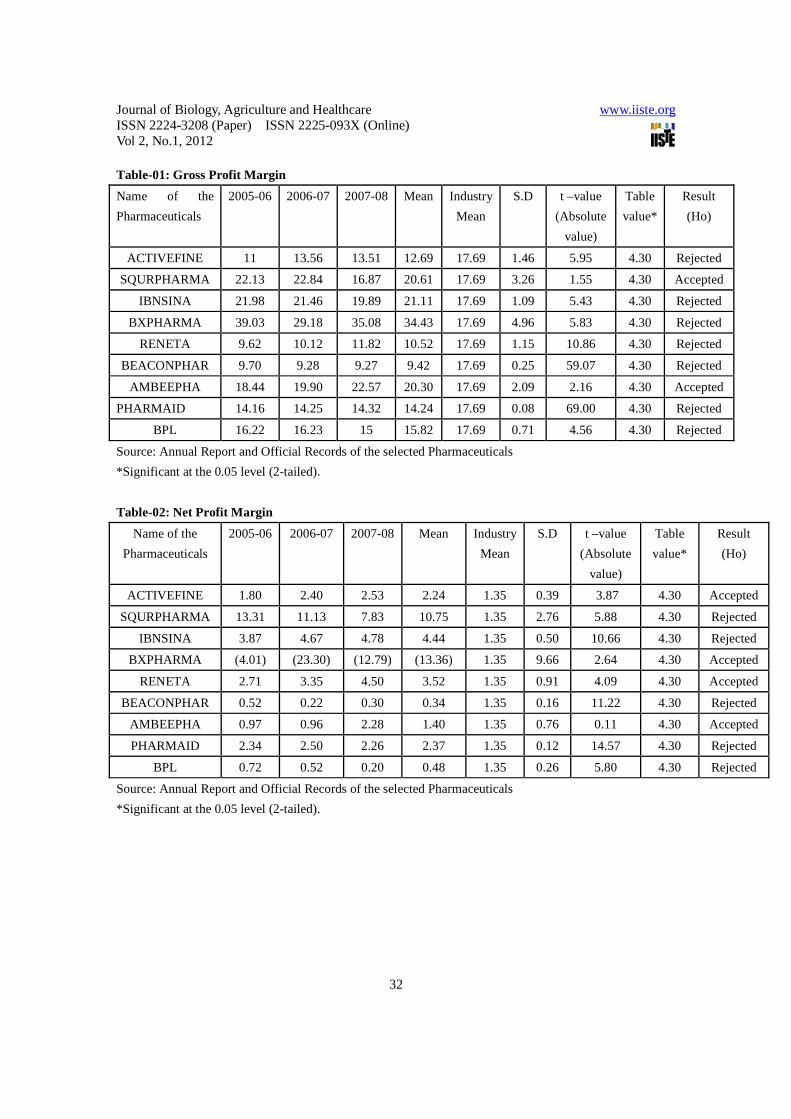
The earnings in terms of sales can be assessed through the profit margin. The gross profit margin reflects the
effectiveness of pricing policy and of production efficiency. Some authors consider that a profit margin ratio
ranging from 20% to 30% has been considered as the standard norm for any industrial enterprise. The
table-01 shows that the average gross profit ratios range from highest 34.43% in BXPHARMA to lowest
9.42% in BEACONPHAR. The study is also found that the industry average gross profit ratio was 17.69%
and the average gross profit ratio of all but five samples was below industry average. In view of standard, the
gross profit margin of SQURPHARMA, IBNSINA, BXPHARMA, and AMBEEPHA during the period was
higher than standard norm and shown an increasing trend but the ratio for ACTIVEFINE, RENETA,
BEACONPHAR, PHARMAID and BPL was lower than the standard. The higher ratio indicates favorable
purchasing and markup policies and the ability of management to develop sales volume and lower ratio
indicates unfavorable purchasing and markup policies and the inability of management to develop sales
volume. This ratio also indicates that the selected enterprise (SQURPHARMA, IBNSINA, BXPHARMA,
and AMBEEPHA) seems to be in an advantage position to service in the face of falling sales prices, rising
cost of production or decline demand for the product. From the calculated value of t it is seen that there is a
Journal of Biology, Agriculture and Healthcare www.iiste.org ISSN 2224-3208 (Paper) ISSN 2225-093X (Online) Vol 2, No.1, 2012
22
significant difference in gross profit ratio between industry average and individual pharmaceuticals firms
except SQURPHARMA and AMBEEPHA.
(Insert Table-02 here) 7.1.2 Net Profit Margin
The ratio reveals the overall profitability of the concern, that’s why it is very useful to the proprietors and
prospective investors. It also indicates management efficiency in manufacturing, administrating and selling
of the products. The table-02 shows that the net profit ratios range from highest 10.75% in SQURPHARMA
to lowest 13.36 %( negative) in BXPHARMA. SQURPHARMA earned the highest average net profit margin
(10.75%) and industry average is 1.35%. The calculated ratios in table-02 indicate that the average net profit
ratio of ACTIVEFINE, SQURPHARMA, IBNSINA, RENETA, AMBEEPHA, and PHARMAID are higher
than industry average. BXPHARMA, BEACONPHAR and BPL are below industry average. Calculated
values of t’ state that there is a significant difference in net profit ratio between industry average and 5
individual pharmaceuticals firms (SQURPHARMA, IBNSINA, BEACONPHAR, PHARMAID and BPL).
For other pharmaceuticals the difference is insignificant.
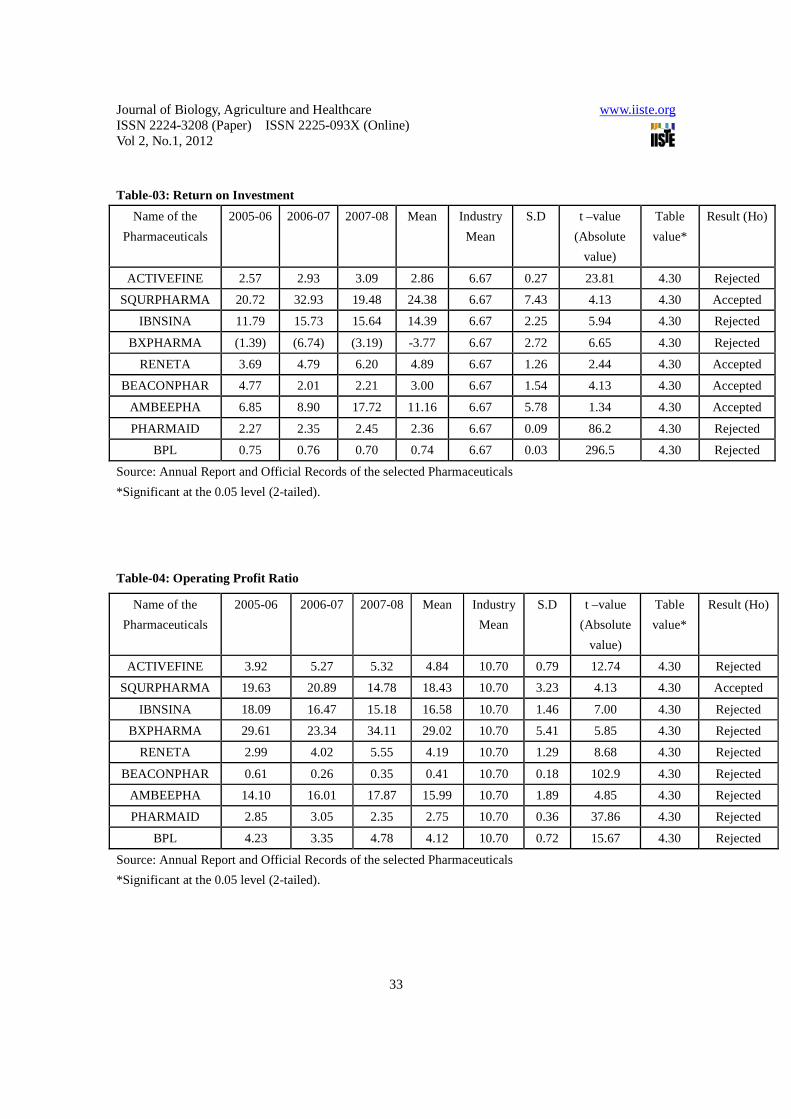
(Insert Table-03 here) 7.1.3 Return on Investment (ROI)
This ratio measures the profitability of enterprise on total investment. The Planning Commission,
Government of Bangladesh has declared that the entire existing project in the public sector would have to
guarantee a fixed return to 7.5% of the investment. This may be considered as the standard norm for the
industrial enterprise. The table-03 shows that the return on investment on an average for the period under
study varies from maximum 24.38% in SQURPHARMA to minimum 3.77% (negative) in BPL and the
industry average is 6.67% which is lower than the standard norm of 7.5% . The ratio for BXPHARMA is
negative. It is seen from the table that ACTIVEFINE, BXPHARMA, RENETA, BEACONPHAR,
PHARMAID and BPL have a low ratio as compared to the industry average and standard norm, which is
indicative of poor earning in terms of investment, the return on investment for SQURPHARMA(24.38%),
IBNSINA (14.39%) and AMBEEPHA (11.16%) should be considered as extremely satisfactory as they are
more than the industry average ratio and as well as the standard norm and this ratios are indicative of very
good profitability in terms of investment. ACTIVEFINE, BXPHARMA, RENETA, BEACONPHAR,
PHARMAID and BPL show a declining trend which indicates the inefficiency of the business as a whole.
From the calculated value of t it is observed that there is a significant difference in return on investment
between industry average and 5 individual pharmaceuticals firms (ACTIVEFINE, IBNSINA, BXPHARMA
PHARMAID and BPL). For other pharmaceuticals the difference is insignificant.
(Insert Table-04 here)
Journal of Biology, Agriculture and Healthcare www.iiste.org ISSN 2224-3208 (Paper) ISSN 2225-093X (Online) Vol 2, No.1, 2012
23
7.1.4 Operating Profit Ratio
Operating Profit refers to the profit of an enterprise, which is obtained after deducting all operating expenses
from gross profit. This ratio establishes the relationship between operating profit and sales. It represents the
overall earnings of an enterprise and one can get a clear idea about the efficiency of an enterprise from its
operating profit ratio. The higher the ratio, the better is the overall efficiency of the enterprise. Operating
profit ratio ranging 4% to 6% is considered norm for the purpose of comparison and control by some authors
(Jain and Narang, Jahur, Hye). The table-04 shows that the average operating profit ratio of the sample
pharmaceuticals ranges from highest 29.02% in BXPHARMA to lowest 0.41% in BEACONPHAR. The
industry average operating profit ratio is 10.70% and most of the companies (5 out of 9) failed to attain the
average but most of the companies’(4 out of 9) operating profit ratio is more than standard. From the
calculated value of t it is observed that there is a significant difference in operating profit ratio between
industry average and almost all individual pharmaceuticals firms except SQURPHARMA.
(Insert Table-05 here)
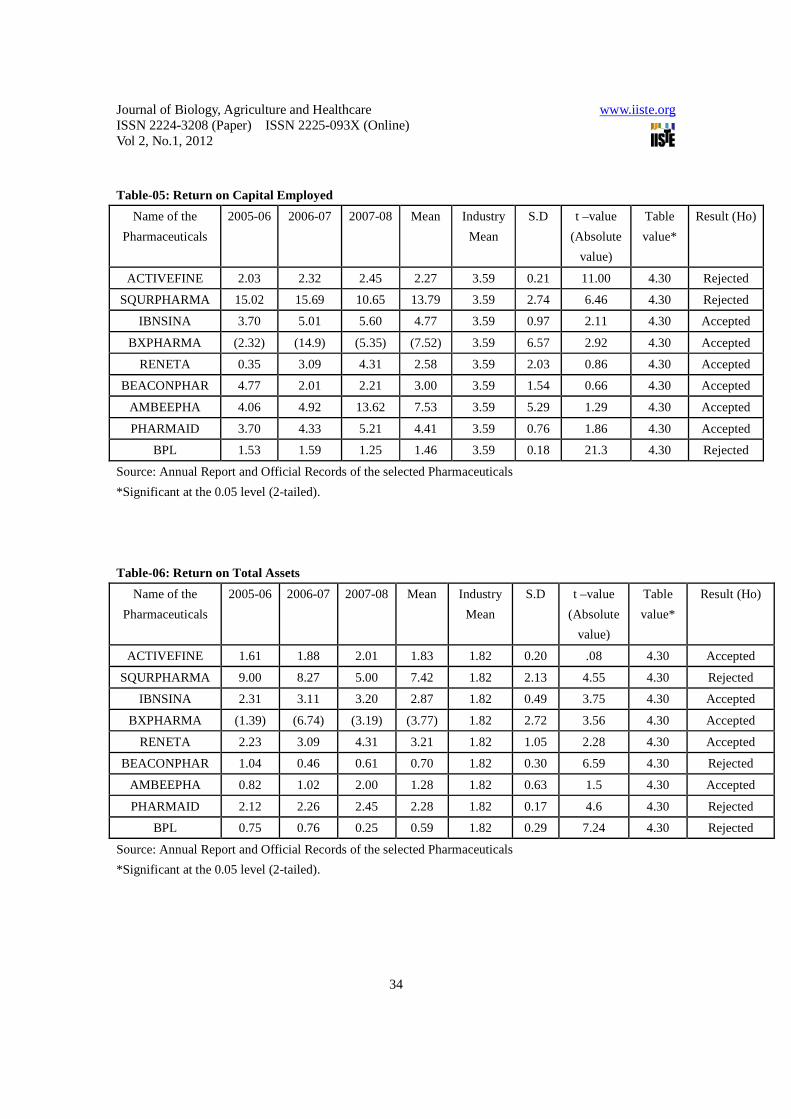
7.1.5 Return on Capital Employed
The most independent ratio for assessment of profitability is the return on capital employed. It reflects the
overall efficiency with which capital is used. Here, Capital Employed=Equity share capital + Preference
share capital+ Undistributed profit+ Reserve and Surplus+ Long term Liabilities- Fictitious Assets. A rate of
return ranging from 11% to 12% on Capital employed may be considered as reasonable for a selected
enterprise. The table-05 represents the return on capital employed ratio of the sample pharmaceuticals for the
study period. The table shows that the average returns on capital employed ranges from 1.46% in BPL to
13.79% in SQURPHARMA and the average ratio is negative for BXPHARMA (-7.52%). It appears from
the table that the industry average return on capital employed is 3.59% which is not satisfactory in terms of
the standard norm. It is seen from the table that SQURPHARMA has a high ratio as compared with standard
norm, IBNSINA, AMBEEPHA and PHARMAID have a high ratio as compared to industry average.
ACTIVEFINE, BXPHARMA, RENETA, BEACONPHAR and BPL have a lower ratio than industry
average, which is indicative of poor earning in terms of capital employed. From the calculated value of t it is
observed that there is a significant difference in return on capital employed between industry average and 4
individual pharmaceuticals firms (ACTIVEFINE, SQURPHARMA, and BPL). For other pharmaceuticals
the difference is insignificant.
(Insert Table-06 here) 7.1.6 Return on Total Assets
This ratio is calculated to measure the profit after the tax against the amount invested in total assets to
ascertain whether assets are being utilized properly or not. Some authors consider 10% to 12% rate of return
on total assets as reasonable norm for a profitable firms and this may be considered as reasonable norm for the
selected enterprises. Table -06 shows that the average return on total assets ranges from 3.77% (negative) in
BXPHARMA to 7.42% in SQURPHARMA and the average return on total assets for BXPHARMA is
Journal of Biology, Agriculture and Healthcare www.iiste.org ISSN 2224-3208 (Paper) ISSN 2225-093X (Online) Vol 2, No.1, 2012
24
negative. It is seen from the table that the average return on total assets is 1.82% which is far away from
standard norm. The average returns on total assets of all pharmaceuticals are below the standard norm which
cannot be considered as satisfactory and desirable. The average return on total assets of BEACONPHAR
(0.70%), BXPHARMA (-3.77%), AMBEEPHA (1.28%) and BPL (0.59%) are below the industry average.
The calculated ratios show a decreasing trend for most of the pharmaceuticals during the period of study and
lower ratios indicate the assets were not being utilized properly during the period. The calculated values of t
state that there is a significant difference in return on total assets between industry average and 4 individual
pharmaceuticals firms (SQURPHARMA, BEACONPHAR, PHARMAID and BPL). For other
pharmaceuticals the difference is insignificant.
7.2 Liquidity Ratio
The Current Ratio and Quick Ratio, Current Assets to Fixed Assets and Net Working Capital to Total Assets
are used to assess liquidity position of an enterprise. The tables (07, 08, 09, and10) depict various financial
ratios covering liquidity of the selected pharmaceuticals for the period under study.
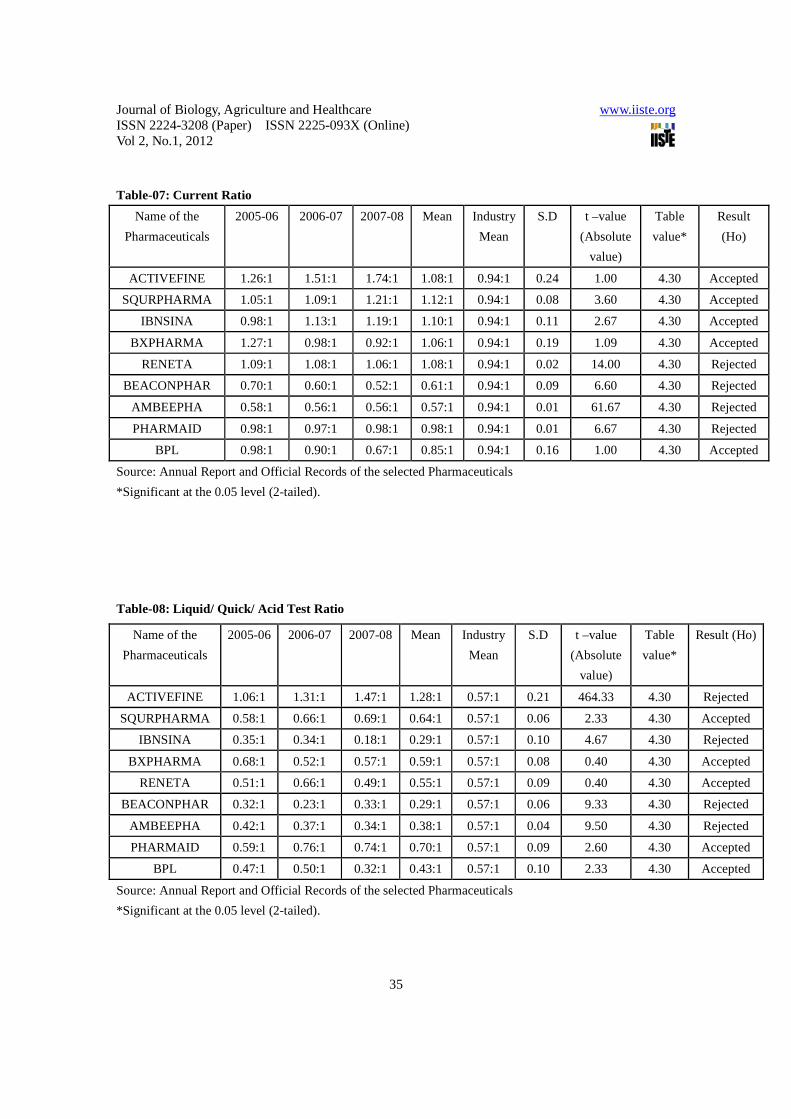
(Insert Table-07 here) 7.2.1 Current Ratio
This ratio is a measure of the firm’s short term solvency of the firm’s liquidity. It indicates the ability of the
company to meet its current obligations. If the current ratio is too low, the firm may have difficulty in meeting
short run commitment. If the ratio is too high the firm may have an excessive investment in current assets or
be under utilizing short term credit. Some authors consider 2:1 as standard norm for current ratio. Table-07
shows that the industry average current ratio is 0.94:1 which indicates that the industry is not able to meet its
current obligations from its current assets. The average current ratio ranges from 0.57:1 in AMBEEPHA to
1.12:1 in SQURPHARMA. The average current ratios of BEACONPHAR (0.61:1), AMBEEPHA (0.57:1)
and BPL (0.85:1) are below the industry average as well as below the standard norm. The average current
ratios of ACTIVEFINE (1.08:1), SQURPHARMA (1.12:1), IBNSINA (1.10:1), BXPHARMA (1.06:1),
RENETA (1.08:1) and PHARMAID (0.98:1) are above the industry average but below the standard norm. It
is seen from the table that all these ratios are far from standard norm. Therefore it can be said that the liquidity
in terms of current ratio had been quite inadequate in all the years under study for all the pharmaceuticals. The
downward trend of current ratios of BXPHARMA, RENETA, BEACONPHAR, AMBEEPHA, PHARMAID
and BPL indicate the inefficient liquidity management in case of the selected pharmaceuticals, the financial
position is very unsatisfactory and the companies’ short term solvency is threatened. From the calculated
value of t it is seen that there is a significant difference in current ratio between industry average and 4
individual pharmaceuticals firms (RENETA, BEACONPHAR, AMBEEPHA, and PHARMAID). For other
pharmaceuticals the difference is insignificant.
(Insert Table-08 here)
7.2.2 Liquid (Quick or Acid Test) Ratio
Journal of Biology, Agriculture and Healthcare www.iiste.org ISSN 2224-3208 (Paper) ISSN 2225-093X (Online) Vol 2, No.1, 2012
25
It measures the firm’s ability to meet short term obligations from its most liquid assets. Table-08 shows that
the industry average of liquid ratio is 0.57:1 which is very lower than the standard (1:1) ratio. The table
reveals that the average liquid ratio ranges from 0.29:1 in IBNSINA and in BEACONPHAR to 1.28:1 in
ACTIVEFINE. The average liquid ratios of IBNSINA (0.29:1), RENETA (0.55:1), BEACONPHAR
(0.29:1), AMBEEPHA (0.38:1) and BPL (0.43:1) are below the industry average as well as far away from
standard norm and the average ratios of SQURPHARMA (0.64:1), BXPHARMA (0.59:1), and PHARMAID
(0.70:1) are above the industry average but below the standard norm. It indicates that all pharmaceuticals
except ACTIVEFINE (average liquid ratio is 1.28:1) are financially very weak and have no ability to pay its
most immediate liabilities. It is also observed that this position is declining for most of the pharmaceuticals
and it is the dangerous signal for the companies. From the calculated value of t it is observed that there is a
significant difference in liquid ratio between industry average and 4 individual pharmaceuticals firms
(ACTIVEFINE, IBNSINA, BEACONPHAR and AMBEEPHA). For other pharmaceuticals the difference is
insignificant.
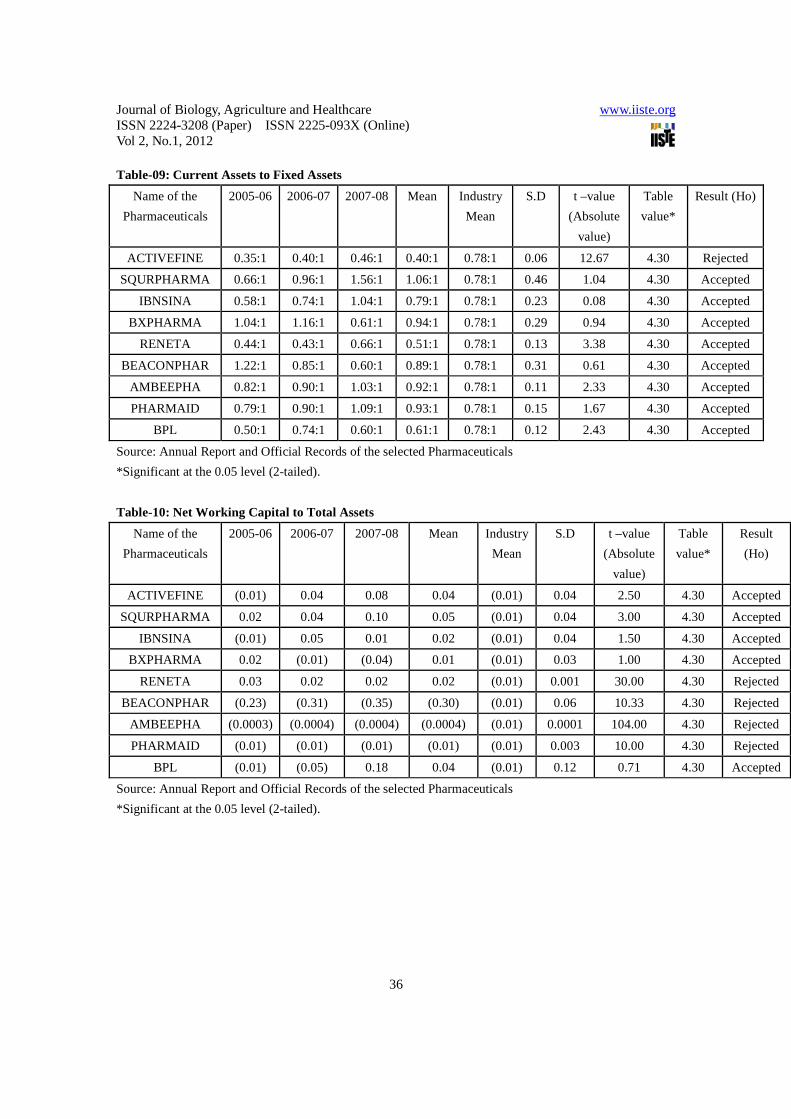
(Insert Table-09 here) 7.2.3 Current Assets to Fixed Assets Another criterion for liquidity assessment is the ratio between current assets to fixed assets. This ratio will
differ from industry to industry and, therefore, no standard can be laid down. The table-09 shows that the
industry average current asset to fixed assets is 0.78:1. It is seen from the table that the average current assets
to fixed assets ratio ranges from 0.40:1 in ACTIVEFINE to 1.06:1 in SQURPHARMA and the average ratio
for ACTIVEFINE (0.40:1), RENETA (0.51:1) and BPL (0.61:1) is lower than industry average and the
average ratio for SQURPHARMA (1.06:1), IBNSINA (0.79:01),BXPHARMA(0.94:1), BEACONPHAR
(0.89:1), AMBEEPHA (0.92:1) and PHARMAID (0.93:1) is higher than the industry average. The calculated
ratios show a decreasing trend for some pharmaceuticals which mean that trading is slack or more
mechanization has been put through in that pharmaceuticals. From the calculated value of t it is observed that
there is a significant difference in current assets to fixed assets between industry average and 01 individual
pharmaceuticals firms (ACTIVEFINE). For all other pharmaceuticals the difference is insignificant.
(Insert Table-10 here)
7.2.4 Net Working Capital to Total Assets
Table-10 shows net working capital to total assets ratios for the selected pharmaceuticals for the study period.
It is seen from the table that the industry average of net working capital to total assets ratio is -0.01. The table
reveals that the average net working capital to total assets ratios of ACTIVEFINE (0.04), SQURPHARMA
(0.05), IBNSINA (0.02), BXPHARMA (0.01), RENETA (0.02) and BPL (0.04) are higher than industry
average and the average ratio of BEACONPHAR (-0.30), AMBEEPHA (-0.0004), PHARMAID (-0.01), are
Journal of Biology, Agriculture and Healthcare www.iiste.org ISSN 2224-3208 (Paper) ISSN 2225-093X (Online) Vol 2, No.1, 2012
26
lower than or equal industry average. From the calculated ratios it is clearly seen that the net working capital
to total assets ratios are very small and for three pharmaceuticals the ratio is negative. Such state of affairs
indicates the inability and inadequacy of net working capital to cover the total assets of the selected enterprise
for the period under review. From the value of t it is observed that there is a significant difference in net
working capital to total assets between industry average and 4 individual pharmaceuticals firms (RENETA,
BEACONPHAR, AMBEEPHA and PHARMAID). For other pharmaceuticals the difference is insignificant.
7.3 Activity Ratios
Activity ratios show the intensity with which the firm uses its assets in generation sales. These ratios indicate
whether the firm’s investments in current and long-term assets are too small or too large. The objective is to
have “enough” assets but not “too many”. The tables (11, 12, and13) depict various activity ratios of the
selected pharmaceuticals for the period under study.
(Insert Table-11 here)
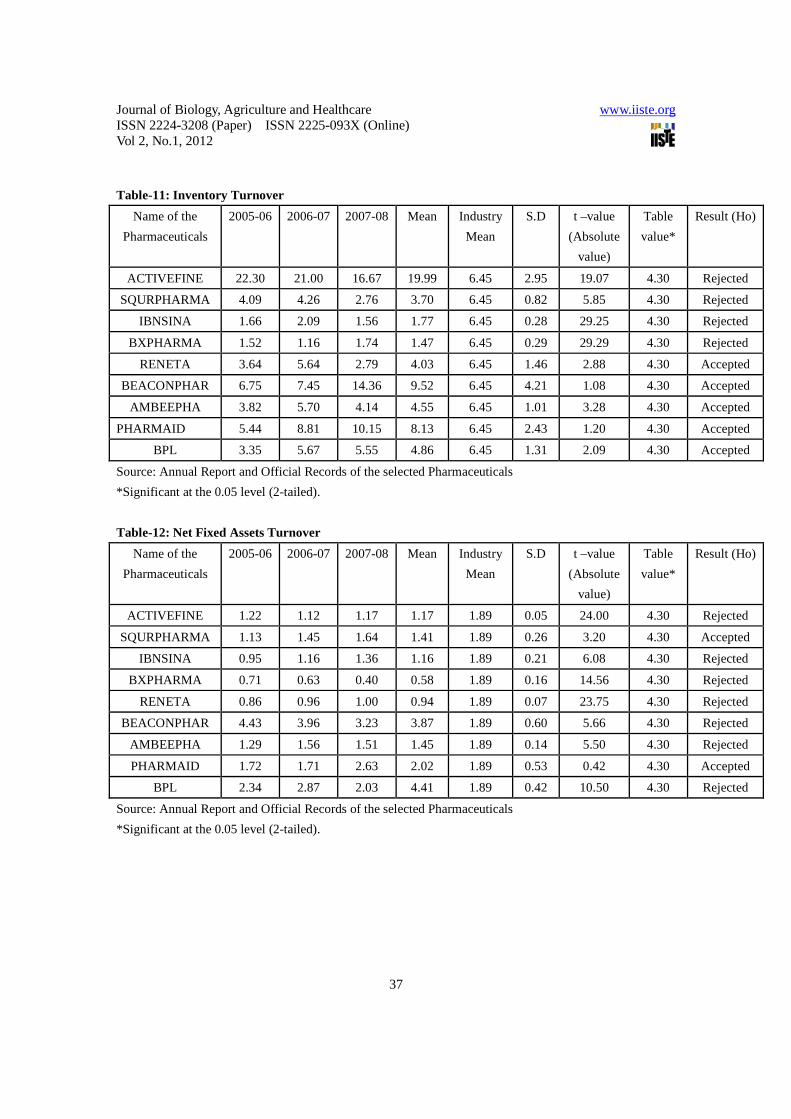
7.3.1 Inventory Turnover Ratio
This ratio is also known as stock turnover ratio, establishes relationship between sales (or cost of goods sold)
and the total inventory (or average inventory). A low inventory turnover may indicate an excessive
investment in inventories a high ratio often means that the firm is running out of stock, resulting in poor
service to customers. It assists the financial manager in evaluating inventory policy to avoid any danger of
over stocking as a prelude to the effective utilization of the resources of the firm. Higher the ratio the better it
is because it shows that stock is rapidly turned over. The table-11 shows that the industry average inventory
turnover is 6.45 times. It is seen from the table that the average inventory turnover ratio ranges from 1.47
times in BXPHARMA to 19.99 times in ACTIVEFINE. Some authors consider 8 to 9 times of inventory
turnover ratio as the reasonable norm for an efficient concern. From the study it is seen that the average
inventory turnover for all selected pharmaceuticals except three pharmaceuticals, ACTIVEFINE(19.99
times), BEACONPHAR (9.52), PHARMAID (8.13), is lower than the industry average as well as standard
norm which implies excessive inventory levels or a slow moving or obsolete inventories. If it is the obsolete
inventories then it has to be written off. This will adversely affect the working capital and liquidity position of
the firm. The calculated ratios indicate that the sale management of the selected pharmaceuticals can’t be said
to be efficient to sell its product. The values of t state that there is a significant difference in inventory
turnover between industry average and 4 individual pharmaceuticals firms (ACTIVEFINE, SQURPHARMA,
IBNSINA and BXPHARMA). For other pharmaceuticals the difference is insignificant.
(Insert Table-12 here)
7.3.2 Net Fixed Assets Turnover
The ratio indicates the extent of generating sales volume in terms of net fixed assets. Some authors consider
that an ideal fixed assets turnover for an enterprise should be 5 times of net fixed assets and hence this may
also be considered so far over selected case. Table-12 shows the net fixed assets turnover ratios for the
Journal of Biology, Agriculture and Healthcare www.iiste.org ISSN 2224-3208 (Paper) ISSN 2225-093X (Online) Vol 2, No.1, 2012
27
selected pharmaceuticals for the study period. From the calculated ratios it is seen that the industry average
net fixed assets turnover is 1.89 which is far away from the standard. The average ratio ranges from 0.58
times in BXPHARMA to 4.41 times in BPL. The average ratio of ACTIVEFINE (1.17times),
SQURPHARMA (1.41times), IBNSINA (1.16 times), BXPHARMA (0.58 times), RENETA (0.94 times)
and AMBEEPHA (1.45 times) is lower than industry average as well as very lower than standard. Only three
pharmaceuticals, BEACONPHAR (3.87 times), PHARMAID (2.02 times), BPL (4.41 times), have average
ratio more than industry average but lower than standard. This low level of ratio indicates poor sales volume
in terms of fixed assets. This indicates an inefficient use of fixed capital. From the calculated value of t it is
observed that there is a significant difference in net fixed assets turnover between industry average and 7
individual pharmaceuticals firms (ACTIVEFINE, IBNSINA, BXPHARMA, RENETA, BEACONPHAR,
AMBEEPHA, and BPL). For other pharmaceuticals the difference is insignificant.
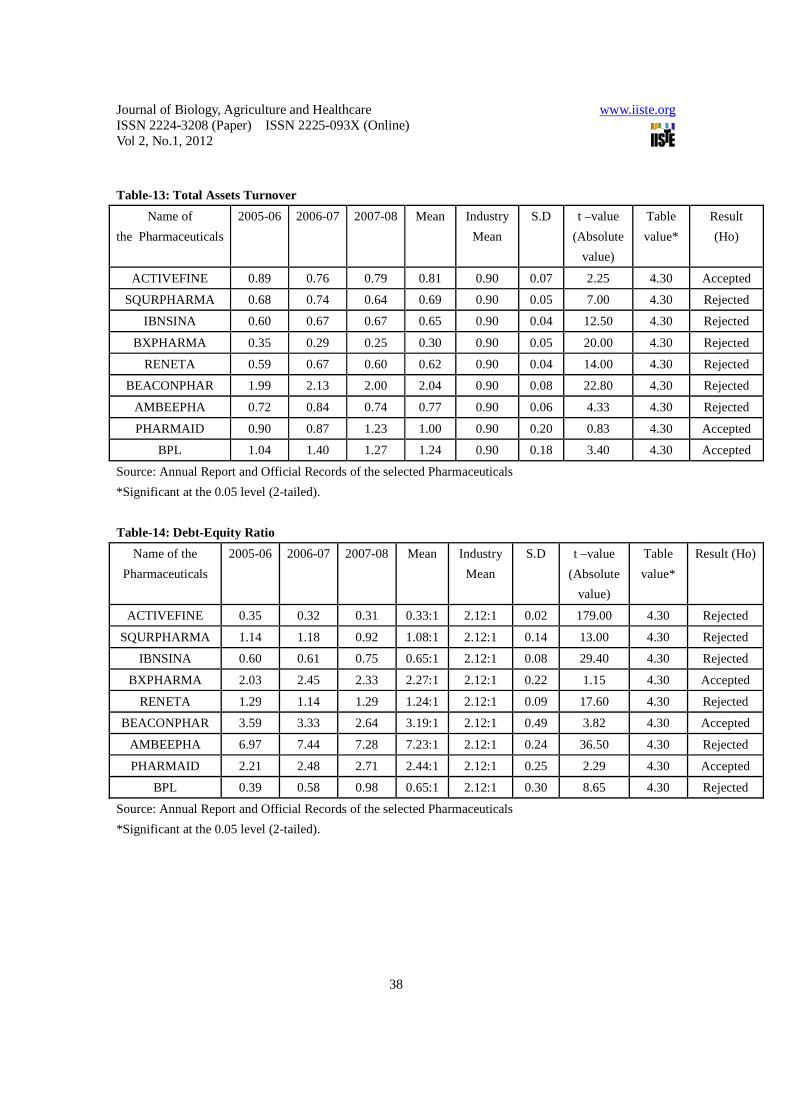
(Insert Table-13 here) 7.3.3 Total Assets Turnover
Another activity ratio is total assets turnover. This is a measure of the extent of generating sales in terms of
the total assets. A standard norm of 200% (i.e. 2 times) of this ratio is considered norm by some authors for an
industrial enterprise. This may also be taken as such for our selected pharmaceuticals. Table-13 reveals that
the average total assets turnover ratio ranges from 0.30 times in BXPHARMA to 2.04 times in
BEACONPHAR and the industry average is 0.90 times which is very lower than standard norm. It is seen
from the table that the average ratio of ACTIVEFINE (0.81 times), SQURPHARMA (0.69 times), IBNSINA
(0.65 times), BXPHARMA (0.30 times), RENETA (0.62 times) and AMBEEPHA (0.77 times) is lower than
the industry average as well as standard norm, but the average ratio of BEACONPHAR (2.04 times),
PHARMAID (1.00 time), BPL (1.24 times) is higher than industry average as well as standard norm. From
the calculated value of t it is observed that there is a significant difference in total assets turnover between
industry average and 6 individual pharmaceuticals firms (SQURPHARMA, IBNSINA, BXPHARMA,
RENETA, AMBEEPHA and BEACONPHAR). For other pharmaceuticals the difference is insignificant.
7.4 Solvency Ratios
Debt-Equity ratio and Debt to Total Assets ratio are commonly used solvency ratios. The tables (14 and 15)
depict various solvency ratios of the selected pharmaceuticals for the period under study.
(Insert Table-14 here)
7.4.1 Debt-Equity Ratio
Equity represents a “cushion” for share-holders. This is a ratio calculated to measure the relative proportions
of outsiders’ funds and shareholder’ funds invested in the company. This ratio is also known as
external-internal equity ratio. The standard ratio is 2:1. The table-14 shows the debt-equity ratio for the
selected pharmaceuticals for the study period. It is revealed from the table that the average debt-equity ratio is
2.12:1. The debt-equity ratio ranges from 0.33:1 in ACTIVEFINE to 7.23:1 in AMBEEPHA. It is seen from
Journal of Biology, Agriculture and Healthcare www.iiste.org ISSN 2224-3208 (Paper) ISSN 2225-093X (Online) Vol 2, No.1, 2012
28
the table that the average ratio of ACTIVEFINE (0.33:1), SQURPHARMA (1.08:1), IBNSINA (0.65:1),
RENETA (1.24:1) and BPL (0.65:1) is lower than the industry average as well as standard norm, but the
average ratio of BXPHARMA (2.27:1), BEACONPHAR (3.19:1), AMBEEPHA (7.23:1) and PHARMAID
(2.44:1) is higher than the industry average as well as standard norm. These low levels of debt-equity ratio of
ACTIVEFINE, SQURPHARMA, IBNSINA, RENETA and BPL mean that the claims of creditors are lower
than those of owners and the company has not liberally used debt to finance its assets. It indicates an
inefficient financial management. On the other hand the position is strong for BXPHARMA,
BEACONPHAR, AMBEEPHA and PHARMAID. From the calculated value of t it is seen that there is a
significant difference in debt-equity ratio between industry average and 7 individual pharmaceuticals firms
except BXPHARMA and BEACONPHAR.
(Insert Table-15 here)
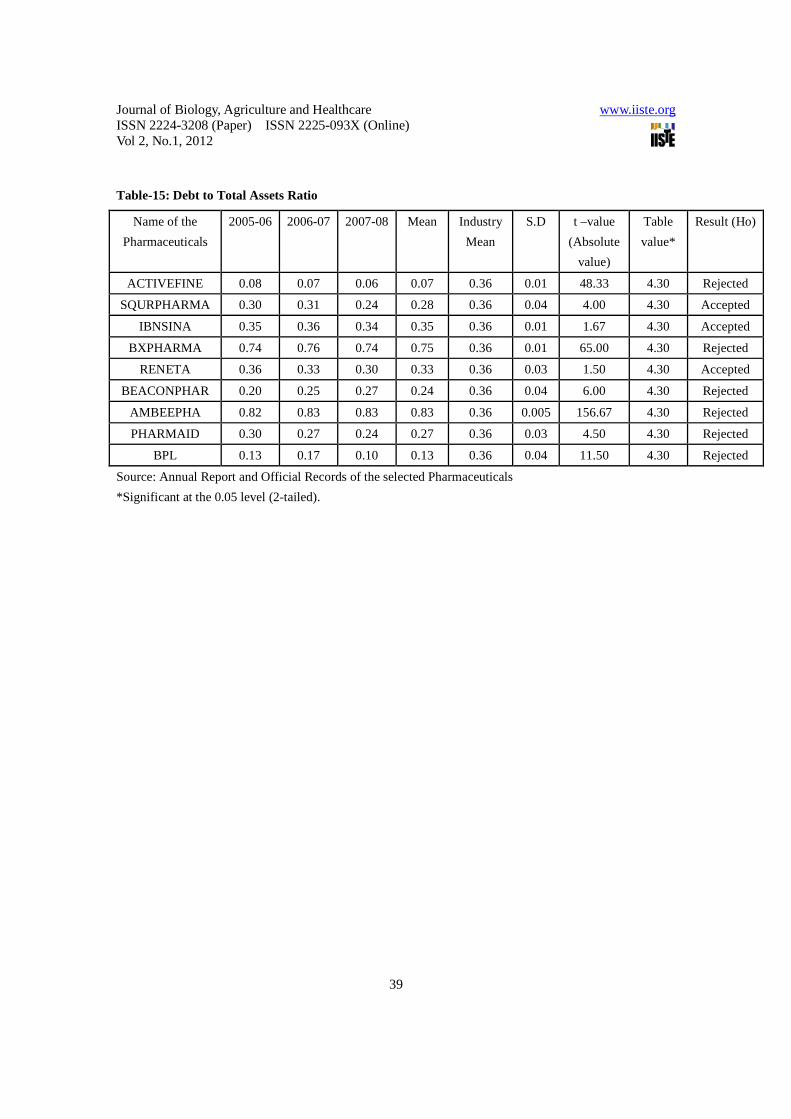
7.4.2 Debt to Total Assets Ratio
The objective of this ratio is to assign what portion of total assets (debt + equity) is collected from debt. Some
authors consider that debt to total assets ratio should be 50% for an industrial enterprise. The table-15 shows
the debt to total assets ratio for the selected pharmaceuticals for the study period. It is observed from the table
that the industry average debt equity ratio is 36% which is lower than the standard norm. It is also seen from
the table that the average ratio ranges from 7% in ACTIVEFINE to 83% in AMBEEPHA. The calculated
ratios indicate the claim of creditors is about to very small in percentage to the shareholders of ACTIVEFINE
(7%), SQURPHARMA (28%), IBNSINA (35%), RENETA (33%), and BEACONPHAR (24%),
PHARMAID (27% and BPL (13%) Such a lower ratio of debts to total assets of selected pharmaceuticals
reveals the fact that they are less dependent on debt rather than on their own capital for financing their
projects. On the other hand the average ratio of BXPHARMA (75%) and AMBEEPHA (83%) is higher than
the average as well as the standard norm which indicates that BXPHARMA and AMBEEPHA are more
dependent on debt rather than their own capital for financing project. From the calculated value of t it is
observed that there is a significant difference in debt to total assets between industry average and 6 individual
pharmaceuticals firms (ACTIVEFINE, BXPHARMA, BEACONPHAR, AMBEEPHA, PHARMAID and
BPL). For other pharmaceuticals the difference is insignificant.
8. Testing financial soundness of selected Pharmaceutical Companies:
After examining profitability, liquidity, activity and solvency of selected Pharmaceutical Companies, now it
is necessary to examine the overall financial soundness of these companies during the study period. In this
context Multivariate Discriminate Analysis (MDA) model as developed by Prof. Altman may be considered
worth while. The said model can give some rough idea about the financial soundness of the selected
Pharmaceuticals. He developed the following equation for judging the financial soundness of an enterprise:
Z = 0.012T1 + 0.014T2 + 0.033T3 + 0.006T4 + 0.999T5
Where;
T1: Working Capital / Total Assets
Journal of Biology, Agriculture and Healthcare www.iiste.org ISSN 2224-3208 (Paper) ISSN 2225-093X (Online) Vol 2, No.1, 2012
29
T2: Retained earnings / Total Assets
T3: Earning before interest & taxes / Total Assets
T4: Market value of equity / Total debt
T5: Sales / Total Assets
Z: Overall index
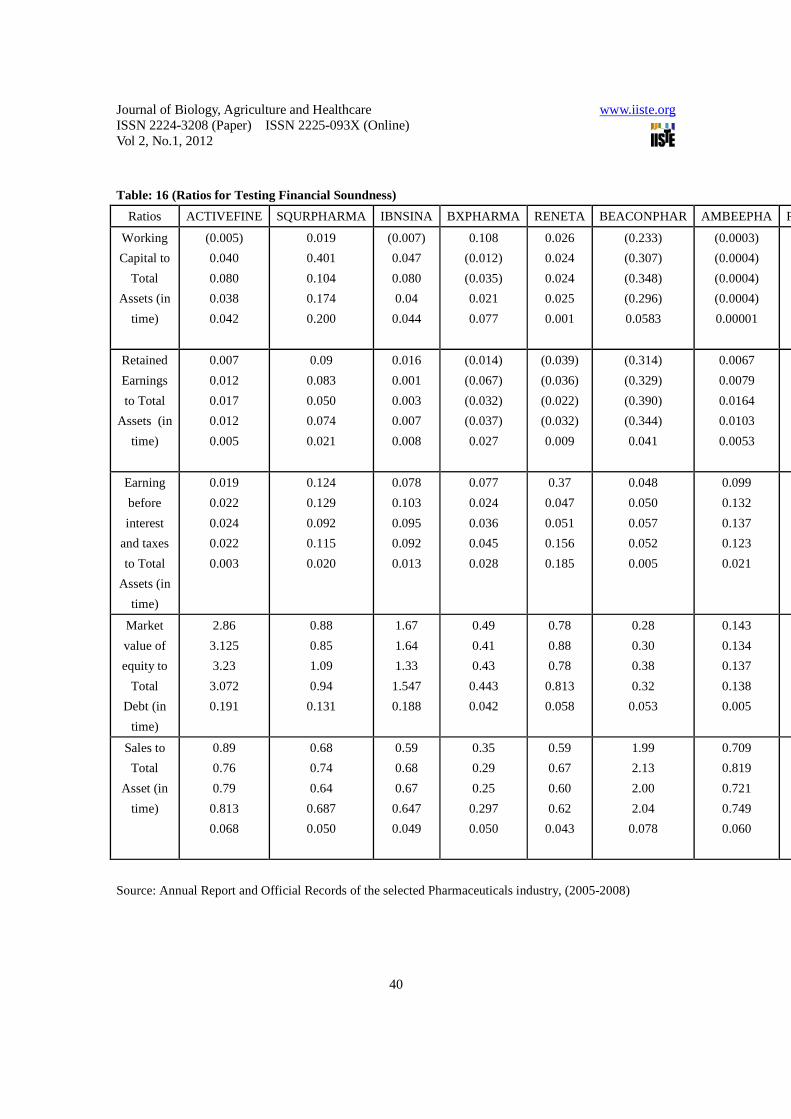
In order to test the overall financial soundness of the selected pharmaceuticals, it needs to calculate the ratios
of working capital to total assets, retained earnings to total assets, earning before interest & taxes to total
assets, market value of equity to book value of total debt and sales to total assets.
(Insert Table-16 here) The table-16 depicts the year wise as well as average position of the ratios of working capital to total assets,
retained earnings to total assets, earning before interest and taxes to total assets, market value of equity to
total debt and sales to total assets. (Insert Table-17 here)
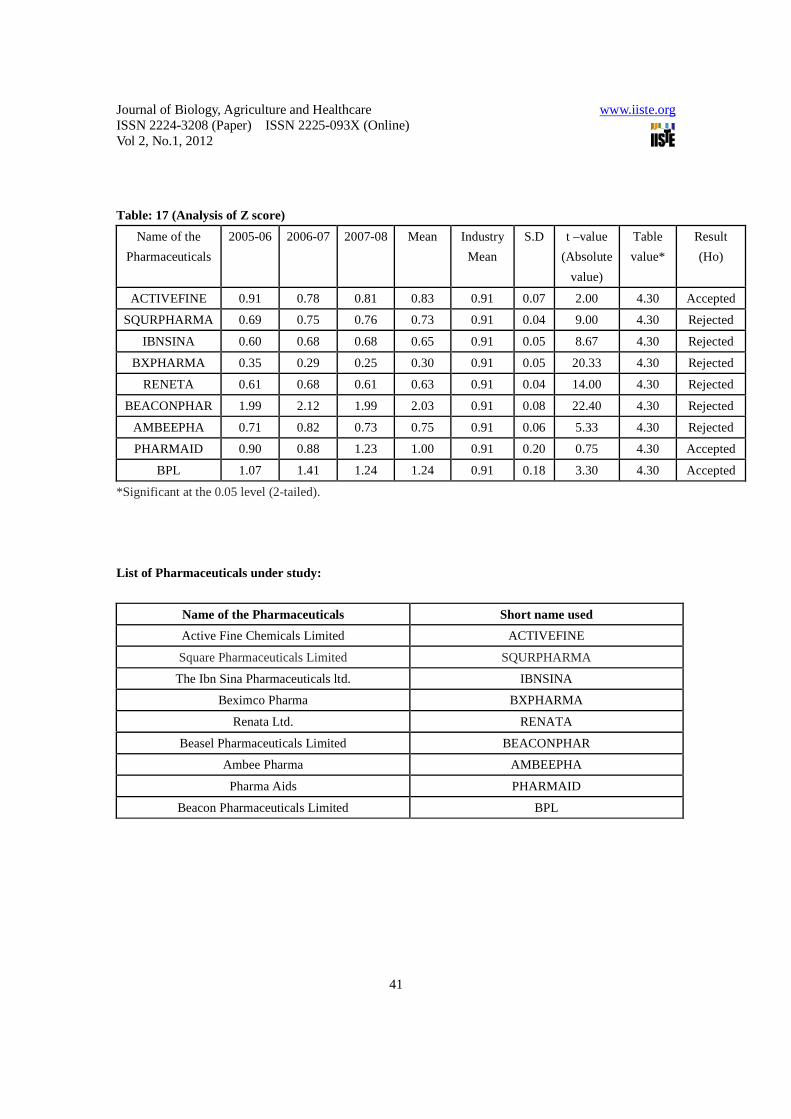
The Table-17 shows the year-wise as well as average position of Z’s score of the sample pharmaceuticals
during the study period. After putting the respective average values of T1, T2, T3, T4 and T5, in the aforesaid
equations as developed by Prof. Altman, Z score was estimated. The average Z score ranges from 0.30 in
BXPHARMA to 2.03 in BEACONPHAR and the industry average Z score is 0.91 comparing with Prof.
Altman’s conclusion that firms with Z score above 2.99 were solvent while those below Z score of 1.81 were
bankrupt. Average Z score of sample pharmaceutical ACTIVEFINE (0.83), SQURPHARMA (0.73),
IBNSINA (0.65), BXPHARMA (0.30), RENETA (0.63), AMBEEPHA (0.75) are lower than the industry
average as well as the range provided by Prof. Altman. On the other hand average Z score of sample
pharmaceuticals of PHARMAID (1.00) and BPL (1.24) are higher than the industry average but lower than
the range provided by Prof. Altman. Only Z score of BEACONPHAR (2.03) exists within the range provided
by Prof. Altman. The table shows the position of bankruptcy at a lower level during the period for all the
selected pharmaceuticals except BEACONPHAR.
It can be concluded that the overall financial soundness of the sample Industry during the study period had
been worst leading to total bankruptcy of the industry. From the calculated value of t it is observed that there
is a significant difference in Z score between industry average and 6 individual pharmaceuticals firms
(SQURPHARMA, IBNSINA, BXPHARMA, RENETA, BEACONPHAR and AMBEEPHA). For other
pharmaceuticals the difference is insignificant.
Journal of Biology, Agriculture and Healthcare www.iiste.org ISSN 2224-3208 (Paper) ISSN 2225-093X (Online) Vol 2, No.1, 2012
30
9. Conclusions
From the discussion it can be concluded that the financial position and operational performance of the most of
the selected pharmaceuticals were not satisfactory. The inefficiency of financial management may be a major
cause for such a poor position of the state of affairs. By applying Prof. Altman’s MDA model it is seen that
the overall financial position of the sample pharmaceuticals was at the lower level of bankruptcy except only
one pharmaceuticals (BEACONPHAR). The main reasons attributed to such a situation were reported to be
poor market demands, scarcity of raw materials, high competition, vanished quota system, management in
attention, lack of realistic goals, strict government regulations, political instability, increased price of raw
materials and others adverse environmental factors etc. In order to save the pharmaceuticals from total
bankruptcy the financial performance of the sample pharmaceuticals should be improved as early as possible.
The followings are the recommendations:
i. The financial management specially purchase, sales and inventory management have to be motivated,
so that they act all the tasks cordially, efficiently and honestly.
ii. The Pharmaceuticals should regularly make use of ratio analysis and measure should be taken to
improve undesirable ratios at least as to the point of industry’s average.
iii. Qualified, trained and experienced management personnel should be appointed.
iv. Government regulations should be flexible and policy should be realistic.
v. Operational efficiency should be increased by reducing cost and wastage and improving operating and
management performance. Supply of working capital should be adequate.
vi. Liquidity position of the selected Pharmaceuticals should be improved by reducing current liabilities.
vii. A reasonable credit policy should be implemented, so that the main portion of profit does not spend in
payment of fixed charges.
viii. Accountability and motivation for achievement of performance should be fixed up.
10. References
Altman, E.I. (1968). “Financial Ratios, Discriminate Analysis and the Prediction of Corporate
Bankruptcy”, The Journal of Finance, Vol.4, pp. 589-609
Chandra, Prasanna (1995). The Investment Game, New Delhi, Mc Graw Hill Publishing Co. Ltd. p.172
Dutta, D. D. Kanti. & Bhattacharjee, D. M. Kumar (2001). “The assessment of financial and operating
performance of the cement industry: A case study of confidence cement ltd.” The Chittagong University
Journal of Commerce, volume 16, pp. 1-16
Journal of Biology, Agriculture and Healthcare www.iiste.org ISSN 2224-3208 (Paper) ISSN 2225-093X (Online) Vol 2, No.1, 2012
31
Hye,D.M.A. & Rahman, M.A. (1997). “Performance of Selected Private Sector General Insurance
Companies in Bangladesh”, Chittagong University Studies (Commerce), Vol. 13, pp. 137-160
Jahur, Mohammad Saleh & Uddin, Mohammad Mohi (1995). “Measurement of operational performance
through ratio analysis – A case study of Usmania Glass Sheet Factory Ltd.
Chittagong”, Chittagong University Studies (Commerce), vol XI, pp. 245-255
Jahur, Mohammad Saleh & Parveen, Jannat Ara. (1996). “An analysis of financial performance of public
enterprises- A case study of Chittagong Steel Mills Ltd.”, Chittagong University Studies (Commerce), Vol.
12, pp. 173-184
Jain, S.P. & Narang, K.L. Financial Accounting, Kalyani Publishers, Ludhiana, New Delhi, pp V1/27 –
V1/44.
LIN, Wen-Cheng, LIU, Chin-Feng, CHU, Ching-Wu (2005). “Performance efficiency evaluation of
the Taiwan’s shipping Industry: An application of DEA”, Proceeding of the Transportation Studies, Vol.5,
pp. 467-476
Ohlson, J.A. (1980). “Financial Ratios and the Probabilitistic Prediction of Bankruptcy”, Journal of
Accounting Research, Vol.19, No. 1, pp. 61-80
Pandey, I.M. (1979). Financial Management, Vikas Publishing House Pvt. Ltd, New Delhi, pp. 109-116.
Salauddin, A. (2001). “Profitability of Pharmaceutical companies
of Bangladesh”. The Chittagong University Journal of Commerce, Volume 16, pp. 54-64
Shaikh, Dr. Md. Abdul Hannan & Shaheed, Miah, Muhammad Abdus (1979). “Financial Position and
Performance analysis of Bangladesh Shilpa Bank”, Islamic University Studies (part C), Vol. 1, No. 2,
December,p p. 207-225.
Sina, Md. Abu & Matubber, Md. Arshed Ali (1998). “Financial Statement Analysis of Khulna Newsprint
Mills Ltd.”, Islamic University Studies (part C), Vol. 1, No. 2, December, pp179-189.
Journal of Biology, Agriculture and Healthcare www.iiste.org ISSN 2224-3208 (Paper) ISSN 2225-093X (Online) Vol 2, No.1, 2012
32
Table-01: Gross Profit Margin Name of the
Pharmaceuticals 2005-06 2006-07 2007-08 Mean Industry
Mean S.D t –value
(Absolute
value)
Table
value* Result
(Ho)
ACTIVEFINE 11 13.56 13.51 12.69 17.69 1.46 5.95 4.30 Rejected SQURPHARMA 22.13 22.84 16.87 20.61 17.69 3.26 1.55 4.30 Accepted
IBNSINA 21.98 21.46 19.89 21.11 17.69 1.09 5.43 4.30 Rejected BXPHARMA 39.03 29.18 35.08 34.43 17.69 4.96 5.83 4.30 Rejected
RENETA 9.62 10.12 11.82 10.52 17.69 1.15 10.86 4.30 Rejected BEACONPHAR 9.70 9.28 9.27 9.42 17.69 0.25 59.07 4.30 Rejected
AMBEEPHA 18.44 19.90 22.57 20.30 17.69 2.09 2.16 4.30 Accepted PHARMAID 14.16 14.25 14.32 14.24 17.69 0.08 69.00 4.30 Rejected
BPL 16.22 16.23 15 15.82 17.69 0.71 4.56 4.30 Rejected Source: Annual Report and Official Records of the selected Pharmaceuticals *Significant at the 0.05 level (2-tailed). Table-02: Net Profit Margin
Name of the
Pharmaceuticals 2005-06 2006-07 2007-08 Mean Industry
Mean S.D t –value
(Absolute
value)
Table
value* Result
(Ho)
ACTIVEFINE 1.80 2.40 2.53 2.24 1.35 0.39 3.87 4.30 Accepted SQURPHARMA 13.31 11.13 7.83 10.75 1.35 2.76 5.88 4.30 Rejected
IBNSINA 3.87 4.67 4.78 4.44 1.35 0.50 10.66 4.30 Rejected BXPHARMA (4.01) (23.30) (12.79) (13.36) 1.35 9.66 2.64 4.30 Accepted
RENETA 2.71 3.35 4.50 3.52 1.35 0.91 4.09 4.30 Accepted BEACONPHAR 0.52 0.22 0.30 0.34 1.35 0.16 11.22 4.30 Rejected
AMBEEPHA 0.97 0.96 2.28 1.40 1.35 0.76 0.11 4.30 Accepted PHARMAID 2.34 2.50 2.26 2.37 1.35 0.12 14.57 4.30 Rejected
BPL 0.72 0.52 0.20 0.48 1.35 0.26 5.80 4.30 Rejected Source: Annual Report and Official Records of the selected Pharmaceuticals *Significant at the 0.05 level (2-tailed).
Journal of Biology, Agriculture and Healthcare www.iiste.org ISSN 2224-3208 (Paper) ISSN 2225-093X (Online) Vol 2, No.1, 2012
33
Table-03: Return on Investment
Name of the
Pharmaceuticals 2005-06 2006-07 2007-08 Mean Industry
Mean S.D t –value
(Absolute
value)
Table
value* Result (Ho)
ACTIVEFINE 2.57 2.93 3.09 2.86 6.67 0.27 23.81 4.30 Rejected SQURPHARMA 20.72 32.93 19.48 24.38 6.67 7.43 4.13 4.30 Accepted
IBNSINA 11.79 15.73 15.64 14.39 6.67 2.25 5.94 4.30 Rejected
BXPHARMA (1.39) (6.74) (3.19) -3.77 6.67 2.72 6.65 4.30 Rejected RENETA 3.69 4.79 6.20 4.89 6.67 1.26 2.44 4.30 Accepted
BEACONPHAR 4.77 2.01 2.21 3.00 6.67 1.54 4.13 4.30 Accepted AMBEEPHA 6.85 8.90 17.72 11.16 6.67 5.78 1.34 4.30 Accepted PHARMAID 2.27 2.35 2.45 2.36 6.67 0.09 86.2 4.30 Rejected
BPL 0.75 0.76 0.70 0.74 6.67 0.03 296.5 4.30 Rejected Source: Annual Report and Official Records of the selected Pharmaceuticals *Significant at the 0.05 level (2-tailed).
Table-04: Operating Profit Ratio
Name of the
Pharmaceuticals 2005-06 2006-07 2007-08 Mean Industry
Mean S.D t –value
(Absolute
value)
Table
value* Result (Ho)
ACTIVEFINE 3.92 5.27 5.32 4.84 10.70 0.79 12.74 4.30 Rejected SQURPHARMA 19.63 20.89 14.78 18.43 10.70 3.23 4.13 4.30 Accepted
IBNSINA 18.09 16.47 15.18 16.58 10.70 1.46 7.00 4.30 Rejected BXPHARMA 29.61 23.34 34.11 29.02 10.70 5.41 5.85 4.30 Rejected
RENETA 2.99 4.02 5.55 4.19 10.70 1.29 8.68 4.30 Rejected
BEACONPHAR 0.61 0.26 0.35 0.41 10.70 0.18 102.9 4.30 Rejected AMBEEPHA 14.10 16.01 17.87 15.99 10.70 1.89 4.85 4.30 Rejected PHARMAID 2.85 3.05 2.35 2.75 10.70 0.36 37.86 4.30 Rejected
BPL 4.23 3.35 4.78 4.12 10.70 0.72 15.67 4.30 Rejected Source: Annual Report and Official Records of the selected Pharmaceuticals *Significant at the 0.05 level (2-tailed).
Journal of Biology, Agriculture and Healthcare www.iiste.org ISSN 2224-3208 (Paper) ISSN 2225-093X (Online) Vol 2, No.1, 2012
34
Table-05: Return on Capital Employed
Name of the
Pharmaceuticals 2005-06 2006-07 2007-08 Mean Industry
Mean S.D t –value
(Absolute
value)
Table
value* Result (Ho)
ACTIVEFINE 2.03 2.32 2.45 2.27 3.59 0.21 11.00 4.30 Rejected SQURPHARMA 15.02 15.69 10.65 13.79 3.59 2.74 6.46 4.30 Rejected
IBNSINA 3.70 5.01 5.60 4.77 3.59 0.97 2.11 4.30 Accepted
BXPHARMA (2.32) (14.9) (5.35) (7.52) 3.59 6.57 2.92 4.30 Accepted RENETA 0.35 3.09 4.31 2.58 3.59 2.03 0.86 4.30 Accepted
BEACONPHAR 4.77 2.01 2.21 3.00 3.59 1.54 0.66 4.30 Accepted AMBEEPHA 4.06 4.92 13.62 7.53 3.59 5.29 1.29 4.30 Accepted PHARMAID 3.70 4.33 5.21 4.41 3.59 0.76 1.86 4.30 Accepted
BPL 1.53 1.59 1.25 1.46 3.59 0.18 21.3 4.30 Rejected Source: Annual Report and Official Records of the selected Pharmaceuticals *Significant at the 0.05 level (2-tailed). Table-06: Return on Total Assets
Name of the
Pharmaceuticals 2005-06 2006-07 2007-08 Mean Industry
Mean S.D t –value
(Absolute
value)
Table
value* Result (Ho)
ACTIVEFINE 1.61 1.88 2.01 1.83 1.82 0.20 .08 4.30 Accepted SQURPHARMA 9.00 8.27 5.00 7.42 1.82 2.13 4.55 4.30 Rejected
IBNSINA 2.31 3.11 3.20 2.87 1.82 0.49 3.75 4.30 Accepted BXPHARMA (1.39) (6.74) (3.19) (3.77) 1.82 2.72 3.56 4.30 Accepted
RENETA 2.23 3.09 4.31 3.21 1.82 1.05 2.28 4.30 Accepted BEACONPHAR 1.04 0.46 0.61 0.70 1.82 0.30 6.59 4.30 Rejected
AMBEEPHA 0.82 1.02 2.00 1.28 1.82 0.63 1.5 4.30 Accepted PHARMAID 2.12 2.26 2.45 2.28 1.82 0.17 4.6 4.30 Rejected
BPL 0.75 0.76 0.25 0.59 1.82 0.29 7.24 4.30 Rejected Source: Annual Report and Official Records of the selected Pharmaceuticals *Significant at the 0.05 level (2-tailed).
Journal of Biology, Agriculture and Healthcare www.iiste.org ISSN 2224-3208 (Paper) ISSN 2225-093X (Online) Vol 2, No.1, 2012
35
Table-07: Current Ratio
Name of the
Pharmaceuticals 2005-06 2006-07 2007-08 Mean Industry
Mean S.D t –value
(Absolute
value)
Table
value* Result
(Ho)
ACTIVEFINE 1.26:1 1.51:1 1.74:1 1.08:1 0.94:1 0.24 1.00 4.30 Accepted SQURPHARMA 1.05:1 1.09:1 1.21:1 1.12:1 0.94:1 0.08 3.60 4.30 Accepted
IBNSINA 0.98:1 1.13:1 1.19:1 1.10:1 0.94:1 0.11 2.67 4.30 Accepted
BXPHARMA 1.27:1 0.98:1 0.92:1 1.06:1 0.94:1 0.19 1.09 4.30 Accepted RENETA 1.09:1 1.08:1 1.06:1 1.08:1 0.94:1 0.02 14.00 4.30 Rejected
BEACONPHAR 0.70:1 0.60:1 0.52:1 0.61:1 0.94:1 0.09 6.60 4.30 Rejected AMBEEPHA 0.58:1 0.56:1 0.56:1 0.57:1 0.94:1 0.01 61.67 4.30 Rejected PHARMAID 0.98:1 0.97:1 0.98:1 0.98:1 0.94:1 0.01 6.67 4.30 Rejected
BPL 0.98:1 0.90:1 0.67:1 0.85:1 0.94:1 0.16 1.00 4.30 Accepted Source: Annual Report and Official Records of the selected Pharmaceuticals *Significant at the 0.05 level (2-tailed).
Table-08: Liquid/ Quick/ Acid Test Ratio
Name of the
Pharmaceuticals 2005-06 2006-07 2007-08 Mean Industry
Mean S.D t –value
(Absolute
value)
Table
value* Result (Ho)
ACTIVEFINE 1.06:1 1.31:1 1.47:1 1.28:1 0.57:1 0.21 464.33 4.30 Rejected SQURPHARMA 0.58:1 0.66:1 0.69:1 0.64:1 0.57:1 0.06 2.33 4.30 Accepted
IBNSINA 0.35:1 0.34:1 0.18:1 0.29:1 0.57:1 0.10 4.67 4.30 Rejected
BXPHARMA 0.68:1 0.52:1 0.57:1 0.59:1 0.57:1 0.08 0.40 4.30 Accepted RENETA 0.51:1 0.66:1 0.49:1 0.55:1 0.57:1 0.09 0.40 4.30 Accepted
BEACONPHAR 0.32:1 0.23:1 0.33:1 0.29:1 0.57:1 0.06 9.33 4.30 Rejected
AMBEEPHA 0.42:1 0.37:1 0.34:1 0.38:1 0.57:1 0.04 9.50 4.30 Rejected PHARMAID 0.59:1 0.76:1 0.74:1 0.70:1 0.57:1 0.09 2.60 4.30 Accepted
BPL 0.47:1 0.50:1 0.32:1 0.43:1 0.57:1 0.10 2.33 4.30 Accepted
Source: Annual Report and Official Records of the selected Pharmaceuticals *Significant at the 0.05 level (2-tailed).
Journal of Biology, Agriculture and Healthcare www.iiste.org ISSN 2224-3208 (Paper) ISSN 2225-093X (Online) Vol 2, No.1, 2012
36
Table-09: Current Assets to Fixed Assets Name of the
Pharmaceuticals 2005-06 2006-07 2007-08 Mean Industry
Mean S.D t –value
(Absolute
value)
Table
value* Result (Ho)
ACTIVEFINE 0.35:1 0.40:1 0.46:1 0.40:1 0.78:1 0.06 12.67 4.30 Rejected SQURPHARMA 0.66:1 0.96:1 1.56:1 1.06:1 0.78:1 0.46 1.04 4.30 Accepted
IBNSINA 0.58:1 0.74:1 1.04:1 0.79:1 0.78:1 0.23 0.08 4.30 Accepted BXPHARMA 1.04:1 1.16:1 0.61:1 0.94:1 0.78:1 0.29 0.94 4.30 Accepted
RENETA 0.44:1 0.43:1 0.66:1 0.51:1 0.78:1 0.13 3.38 4.30 Accepted BEACONPHAR 1.22:1 0.85:1 0.60:1 0.89:1 0.78:1 0.31 0.61 4.30 Accepted
AMBEEPHA 0.82:1 0.90:1 1.03:1 0.92:1 0.78:1 0.11 2.33 4.30 Accepted PHARMAID 0.79:1 0.90:1 1.09:1 0.93:1 0.78:1 0.15 1.67 4.30 Accepted
BPL 0.50:1 0.74:1 0.60:1 0.61:1 0.78:1 0.12 2.43 4.30 Accepted Source: Annual Report and Official Records of the selected Pharmaceuticals *Significant at the 0.05 level (2-tailed). Table-10: Net Working Capital to Total Assets
Name of the
Pharmaceuticals 2005-06 2006-07 2007-08 Mean Industry
Mean S.D t –value
(Absolute
value)
Table
value* Result
(Ho)
ACTIVEFINE (0.01) 0.04 0.08 0.04 (0.01) 0.04 2.50 4.30 Accepted SQURPHARMA 0.02 0.04 0.10 0.05 (0.01) 0.04 3.00 4.30 Accepted
IBNSINA (0.01) 0.05 0.01 0.02 (0.01) 0.04 1.50 4.30 Accepted BXPHARMA 0.02 (0.01) (0.04) 0.01 (0.01) 0.03 1.00 4.30 Accepted
RENETA 0.03 0.02 0.02 0.02 (0.01) 0.001 30.00 4.30 Rejected BEACONPHAR (0.23) (0.31) (0.35) (0.30) (0.01) 0.06 10.33 4.30 Rejected
AMBEEPHA (0.0003) (0.0004) (0.0004) (0.0004) (0.01) 0.0001 104.00 4.30 Rejected PHARMAID (0.01) (0.01) (0.01) (0.01) (0.01) 0.003 10.00 4.30 Rejected
BPL (0.01) (0.05) 0.18 0.04 (0.01) 0.12 0.71 4.30 Accepted Source: Annual Report and Official Records of the selected Pharmaceuticals *Significant at the 0.05 level (2-tailed).
Journal of Biology, Agriculture and Healthcare www.iiste.org ISSN 2224-3208 (Paper) ISSN 2225-093X (Online) Vol 2, No.1, 2012
37
Table-11: Inventory Turnover
Name of the
Pharmaceuticals 2005-06 2006-07 2007-08 Mean Industry
Mean S.D t –value
(Absolute
value)
Table
value* Result (Ho)
ACTIVEFINE 22.30 21.00 16.67 19.99 6.45 2.95 19.07 4.30 Rejected SQURPHARMA 4.09 4.26 2.76 3.70 6.45 0.82 5.85 4.30 Rejected
IBNSINA 1.66 2.09 1.56 1.77 6.45 0.28 29.25 4.30 Rejected
BXPHARMA 1.52 1.16 1.74 1.47 6.45 0.29 29.29 4.30 Rejected RENETA 3.64 5.64 2.79 4.03 6.45 1.46 2.88 4.30 Accepted
BEACONPHAR 6.75 7.45 14.36 9.52 6.45 4.21 1.08 4.30 Accepted AMBEEPHA 3.82 5.70 4.14 4.55 6.45 1.01 3.28 4.30 Accepted
PHARMAID 5.44 8.81 10.15 8.13 6.45 2.43 1.20 4.30 Accepted BPL 3.35 5.67 5.55 4.86 6.45 1.31 2.09 4.30 Accepted
Source: Annual Report and Official Records of the selected Pharmaceuticals *Significant at the 0.05 level (2-tailed). Table-12: Net Fixed Assets Turnover
Name of the
Pharmaceuticals 2005-06 2006-07 2007-08 Mean Industry
Mean S.D t –value
(Absolute
value)
Table
value* Result (Ho)
ACTIVEFINE 1.22 1.12 1.17 1.17 1.89 0.05 24.00 4.30 Rejected SQURPHARMA 1.13 1.45 1.64 1.41 1.89 0.26 3.20 4.30 Accepted
IBNSINA 0.95 1.16 1.36 1.16 1.89 0.21 6.08 4.30 Rejected BXPHARMA 0.71 0.63 0.40 0.58 1.89 0.16 14.56 4.30 Rejected
RENETA 0.86 0.96 1.00 0.94 1.89 0.07 23.75 4.30 Rejected BEACONPHAR 4.43 3.96 3.23 3.87 1.89 0.60 5.66 4.30 Rejected
AMBEEPHA 1.29 1.56 1.51 1.45 1.89 0.14 5.50 4.30 Rejected PHARMAID 1.72 1.71 2.63 2.02 1.89 0.53 0.42 4.30 Accepted
BPL 2.34 2.87 2.03 4.41 1.89 0.42 10.50 4.30 Rejected Source: Annual Report and Official Records of the selected Pharmaceuticals *Significant at the 0.05 level (2-tailed).
Journal of Biology, Agriculture and Healthcare www.iiste.org ISSN 2224-3208 (Paper) ISSN 2225-093X (Online) Vol 2, No.1, 2012
38
Table-13: Total Assets Turnover
Name of
the Pharmaceuticals 2005-06 2006-07 2007-08 Mean Industry
Mean S.D t –value
(Absolute
value)
Table
value* Result
(Ho)
ACTIVEFINE 0.89 0.76 0.79 0.81 0.90 0.07 2.25 4.30 Accepted SQURPHARMA 0.68 0.74 0.64 0.69 0.90 0.05 7.00 4.30 Rejected
IBNSINA 0.60 0.67 0.67 0.65 0.90 0.04 12.50 4.30 Rejected
BXPHARMA 0.35 0.29 0.25 0.30 0.90 0.05 20.00 4.30 Rejected RENETA 0.59 0.67 0.60 0.62 0.90 0.04 14.00 4.30 Rejected
BEACONPHAR 1.99 2.13 2.00 2.04 0.90 0.08 22.80 4.30 Rejected AMBEEPHA 0.72 0.84 0.74 0.77 0.90 0.06 4.33 4.30 Rejected PHARMAID 0.90 0.87 1.23 1.00 0.90 0.20 0.83 4.30 Accepted
BPL 1.04 1.40 1.27 1.24 0.90 0.18 3.40 4.30 Accepted Source: Annual Report and Official Records of the selected Pharmaceuticals *Significant at the 0.05 level (2-tailed). Table-14: Debt-Equity Ratio
Name of the
Pharmaceuticals 2005-06 2006-07 2007-08 Mean Industry
Mean S.D t –value
(Absolute
value)
Table
value* Result (Ho)
ACTIVEFINE 0.35 0.32 0.31 0.33:1 2.12:1 0.02 179.00 4.30 Rejected SQURPHARMA 1.14 1.18 0.92 1.08:1 2.12:1 0.14 13.00 4.30 Rejected
IBNSINA 0.60 0.61 0.75 0.65:1 2.12:1 0.08 29.40 4.30 Rejected BXPHARMA 2.03 2.45 2.33 2.27:1 2.12:1 0.22 1.15 4.30 Accepted
RENETA 1.29 1.14 1.29 1.24:1 2.12:1 0.09 17.60 4.30 Rejected BEACONPHAR 3.59 3.33 2.64 3.19:1 2.12:1 0.49 3.82 4.30 Accepted
AMBEEPHA 6.97 7.44 7.28 7.23:1 2.12:1 0.24 36.50 4.30 Rejected PHARMAID 2.21 2.48 2.71 2.44:1 2.12:1 0.25 2.29 4.30 Accepted
BPL 0.39 0.58 0.98 0.65:1 2.12:1 0.30 8.65 4.30 Rejected Source: Annual Report and Official Records of the selected Pharmaceuticals *Significant at the 0.05 level (2-tailed).
Journal of Biology, Agriculture and Healthcare www.iiste.org ISSN 2224-3208 (Paper) ISSN 2225-093X (Online) Vol 2, No.1, 2012
39
Table-15: Debt to Total Assets Ratio
Name of the
Pharmaceuticals 2005-06 2006-07 2007-08 Mean Industry
Mean S.D t –value
(Absolute
value)
Table
value* Result (Ho)
ACTIVEFINE 0.08 0.07 0.06 0.07 0.36 0.01 48.33 4.30 Rejected SQURPHARMA 0.30 0.31 0.24 0.28 0.36 0.04 4.00 4.30 Accepted
IBNSINA 0.35 0.36 0.34 0.35 0.36 0.01 1.67 4.30 Accepted BXPHARMA 0.74 0.76 0.74 0.75 0.36 0.01 65.00 4.30 Rejected
RENETA 0.36 0.33 0.30 0.33 0.36 0.03 1.50 4.30 Accepted BEACONPHAR 0.20 0.25 0.27 0.24 0.36 0.04 6.00 4.30 Rejected
AMBEEPHA 0.82 0.83 0.83 0.83 0.36 0.005 156.67 4.30 Rejected PHARMAID 0.30 0.27 0.24 0.27 0.36 0.03 4.50 4.30 Rejected
BPL 0.13 0.17 0.10 0.13 0.36 0.04 11.50 4.30 Rejected Source: Annual Report and Official Records of the selected Pharmaceuticals *Significant at the 0.05 level (2-tailed).
Journal of Biology, Agriculture and Healthcare www.iiste.org ISSN 2224-3208 (Paper) ISSN 2225-093X (Online) Vol 2, No.1, 2012
40
Table: 16 (Ratios for Testing Financial Soundness)
Ratios ACTIVEFINE SQURPHARMA IBNSINA BXPHARMA RENETA BEACONPHAR AMBEEPHA PHARMAID
Working
Capital to
Total
Assets (in
time)
(0.005) 0.040 0.080 0.038 0.042
0.019 0.401 0.104 0.174 0.200
(0.007) 0.047 0.080 0.04 0.044
0.108 (0.012) (0.035) 0.021 0.077
0.026 0.024 0.024 0.025 0.001
(0.233) (0.307) (0.348) (0.296) 0.0583
(0.0003) (0.0004) (0.0004) (0.0004) 0.00001
Retained
Earnings
to Total
Assets (in
time)
0.007 0.012 0.017 0.012 0.005
0.09 0.083 0.050 0.074 0.021
0.016 0.001 0.003 0.007 0.008
(0.014) (0.067) (0.032) (0.037) 0.027
(0.039) (0.036) (0.022) (0.032) 0.009
(0.314) (0.329) (0.390) (0.344) 0.041
0.0067 0.0079 0.0164 0.0103 0.0053
Earning
before
interest
and taxes
to Total
Assets (in
time)
0.019 0.022 0.024 0.022 0.003
0.124 0.129 0.092 0.115 0.020
0.078 0.103 0.095 0.092 0.013
0.077 0.024 0.036 0.045 0.028
0.37 0.047 0.051 0.156 0.185
0.048 0.050 0.057 0.052 0.005
0.099 0.132 0.137 0.123 0.021
Market
value of
equity to
Total
Debt (in
time)
2.86 3.125 3.23 3.072 0.191
0.88 0.85 1.09 0.94 0.131
1.67 1.64 1.33 1.547 0.188
0.49 0.41 0.43 0.443 0.042
0.78 0.88 0.78 0.813 0.058
0.28 0.30 0.38 0.32 0.053
0.143 0.134 0.137 0.138 0.005
Sales to
Total
Asset (in
time)
0.89 0.76 0.79 0.813 0.068
0.68 0.74 0.64 0.687 0.050
0.59 0.68 0.67 0.647 0.049
0.35 0.29 0.25 0.297 0.050
0.59 0.67 0.60 0.62 0.043
1.99 2.13 2.00 2.04 0.078
0.709 0.819 0.721 0.749 0.060
Source: Annual Report and Official Records of the selected Pharmaceuticals industry, (2005-2008)
Journal of Biology, Agriculture and Healthcare www.iiste.org ISSN 2224-3208 (Paper) ISSN 2225-093X (Online) Vol 2, No.1, 2012
41
Table: 17 (Analysis of Z score)
Name of the
Pharmaceuticals 2005-06 2006-07 2007-08 Mean Industry
Mean S.D t –value
(Absolute
value)
Table
value* Result
(Ho)
ACTIVEFINE 0.91 0.78 0.81 0.83 0.91 0.07 2.00 4.30 Accepted SQURPHARMA 0.69 0.75 0.76 0.73 0.91 0.04 9.00 4.30 Rejected
IBNSINA 0.60 0.68 0.68 0.65 0.91 0.05 8.67 4.30 Rejected BXPHARMA 0.35 0.29 0.25 0.30 0.91 0.05 20.33 4.30 Rejected
RENETA 0.61 0.68 0.61 0.63 0.91 0.04 14.00 4.30 Rejected BEACONPHAR 1.99 2.12 1.99 2.03 0.91 0.08 22.40 4.30 Rejected
AMBEEPHA 0.71 0.82 0.73 0.75 0.91 0.06 5.33 4.30 Rejected PHARMAID 0.90 0.88 1.23 1.00 0.91 0.20 0.75 4.30 Accepted
BPL 1.07 1.41 1.24 1.24 0.91 0.18 3.30 4.30 Accepted *Significant at the 0.05 level (2-tailed). List of Pharmaceuticals under study:
Name of the Pharmaceuticals Short name used Active Fine Chemicals Limited ACTIVEFINE
Square Pharmaceuticals Limited SQURPHARMA The Ibn Sina Pharmaceuticals ltd. IBNSINA
Beximco Pharma BXPHARMA Renata Ltd. RENATA
Beasel Pharmaceuticals Limited BEACONPHAR Ambee Pharma AMBEEPHA Pharma Aids PHARMAID
Beacon Pharmaceuticals Limited BPL
International Journals Call for Paper
The IISTE, a U.S. publisher, is currently hosting the academic journals listed below. The peer review process of the following journals
usually takes LESS THAN 14 business days and IISTE usually publishes a qualified article within 30 days. Authors should
send their full paper to the following email address. More information can be found in the IISTE website : www.iiste.org
Business, Economics, Finance and Management PAPER SUBMISSION EMAIL
European Journal of Business and Management [email protected]
Research Journal of Finance and Accounting [email protected]
Journal of Economics and Sustainable Development [email protected]
Information and Knowledge Management [email protected]
Developing Country Studies [email protected]
Industrial Engineering Letters [email protected]
Physical Sciences, Mathematics and Chemistry PAPER SUBMISSION EMAIL
Journal of Natural Sciences Research [email protected]
Chemistry and Materials Research [email protected]
Mathematical Theory and Modeling [email protected]
Advances in Physics Theories and Applications [email protected]
Chemical and Process Engineering Research [email protected]
Engineering, Technology and Systems PAPER SUBMISSION EMAIL
Computer Engineering and Intelligent Systems [email protected]
Innovative Systems Design and Engineering [email protected]
Journal of Energy Technologies and Policy [email protected]
Information and Knowledge Management [email protected]
Control Theory and Informatics [email protected]
Journal of Information Engineering and Applications [email protected]
Industrial Engineering Letters [email protected]
Network and Complex Systems [email protected]
Environment, Civil, Materials Sciences PAPER SUBMISSION EMAIL
Journal of Environment and Earth Science [email protected]
Civil and Environmental Research [email protected]
Journal of Natural Sciences Research [email protected]
Civil and Environmental Research [email protected]
Life Science, Food and Medical Sciences PAPER SUBMISSION EMAIL
Journal of Natural Sciences Research [email protected]
Journal of Biology, Agriculture and Healthcare [email protected]
Food Science and Quality Management [email protected]
Chemistry and Materials Research [email protected]
Education, and other Social Sciences PAPER SUBMISSION EMAIL
Journal of Education and Practice [email protected]
Journal of Law, Policy and Globalization [email protected]
New Media and Mass Communication [email protected]
Journal of Energy Technologies and Policy [email protected]
Historical Research Letter [email protected]
Public Policy and Administration Research [email protected]
International Affairs and Global Strategy [email protected]
Research on Humanities and Social Sciences [email protected]
Developing Country Studies [email protected]
Arts and Design Studies [email protected]
[Type a quote from the document or the
summary of an interesting point. You can
position the text box anywhere in the
document. Use the Drawing Tools tab to change
the formatting of the pull quote text box.]
Global knowledge sharing:
EBSCO, Index Copernicus, Ulrich's
Periodicals Directory, JournalTOCS, PKP
Open Archives Harvester, Bielefeld
Academic Search Engine, Elektronische
Zeitschriftenbibliothek EZB, Open J-Gate,
OCLC WorldCat, Universe Digtial Library ,
NewJour, Google Scholar.
IISTE is member of CrossRef. All journals
have high IC Impact Factor Values (ICV).
![11.[17-41]Diagnosing the Financial Health of Selected Pharmaceutical Companies in Bangladesh](https://img.pdfslide.us/doc/110x75/577d1e601a28ab4e1e8e65d2/1117-41diagnosing-the-financial-health-of-selected-pharmaceutical-companies.jpg)