Embed Size (px)
Citation preview

0http://www.fhi.co.jp/english/ir/index.html
Presentation of Business Resultsfor the 1st Half of FYE2013
Fuji Heavy Industries Ltd.October 30, 2012

1http://www.fhi.co.jp/english/ir/index.html
A Summary of Business ResultsA Summary of Business ResultsA Summary of Business Results

2http://www.fhi.co.jp/english/ir/index.html
+83.1276.4193.3Overseas total
+7.726.618.9China
+5.722.016.4Australia
+1.616.314.7Canada
+50.8164.4113.5U.S.
-0.672.072.6Domestic total
-10.126.636.7Minicar
Actual Results1st Half
FYE March 2012
Actual Results1st Half
FYE March 2013
Increase /Decrease
Passenger car 35.9 45.4 +9.5
Russia 5.6 11.1 +5.5Europe 14.6 25.4 +10.8
Others 9.7 10.7 +1.0
Total 265.9 348.4 +82.5
(Thousand Units)
1st Half : Consolidated Automobile Sales
* Canada figures of FYE2012 and China figures of FYE2013 are consolidated on the calendar year basis from Jan. to Jun.

3http://www.fhi.co.jp/english/ir/index.html
-¥0/US$¥80/US$¥80/US$FHI exchange rate
+237453216Ordinary income
+245433188Operating income
+1,5775,8834,305Overseas
+8533,0982,245Domestic
Actual Results1st Half
FYE March 2012
Actual Results1st Half
FYE March 2013
Increase /Decrease
Net sales 6,550 8,980 +2,430
Income before income taxes and minority interests
402 459 +57
Net income 328 404 +77
1st Half : Consolidated Statements Income
(100 Million Yen)

4http://www.fhi.co.jp/english/ir/index.html
188
433
-432
-20-43
144
596
Improvementof sales
volume &mixture and
others
Reductionin cost
Increase ofSG&A
expensesand others
Loss oncurrencyexchange
Increaseof R&D
expenses
Operating Income1st Half
FYE March 2012
Operating Income1st Half
FYE March 2013+24.5 billion yen
(100 Million Yen)
1st Half : Analysis of Increase and Decreasein Operating Income Changes (Consolidated)
Domestic : Improvement of volume & mixtureOverseas : Improvement of volume & mixture
US$ : -8EURO : -20CA$ : -10Currency exchange adjustment : -5
FHI : +132SIA : +12
Increase of fixed cost, SG&A expenses and warranty claims

5http://www.fhi.co.jp/english/ir/index.html
Actual Results1st Half
FYE March 2013
8,980
96
163
417
8,304
1.1%0.9%
1.8%2.6%
4.6%5.7%
92.5%90.7%
+2,4306,550Total
+42374Aerospace
Actual Results1st Half
FYE March 2012
Increase /Decrease
Automobile5,943 +2,361
Industrial products
173 -11
Other59 +37
(100 Million Yen / Percentage of Total Sales)
1st Half : Consolidated Net Sales by Business Segment

6http://www.fhi.co.jp/english/ir/index.html
+143Industrialproducts
433
2
10
19
397
+245188Total
+910Aerospace
Actual Results1st Half
FYE March 2012
Actual Results1st Half
FYE March 2013
Increase /Decrease
Automobile 171 +226
Other 4 +7Elimination andcorporate 1 +2
1st Half : Consolidated Operating Income by Business Segment
(100 Million Yen)

7http://www.fhi.co.jp/english/ir/index.html
8,980
860
3,745
4,376
9.6%3.6%
41.7%42.3%
48.7%54.1%
+2,4306,550Total
+9732,772North America
Actual Results1st Half
FYE March 2012
Actual Results1st Half
FYE March 2013
Increase /Decrease
Japan3,544 +832
Other234 +626
1st Half : Consolidated Net Sales by Geographic Area <Appendix>
(100 Million Yen / Percentage of Total Sales)

8http://www.fhi.co.jp/english/ir/index.html
433
3
-1
87
344
+245188Total
-15102North America
Actual Results1st Half
FYE March 2012
Actual Results1st Half
FYE March 2013
Increase /Decrease
Japan 26 +318
Other 2 -4
Elimination andcorporate 58 -55
1st Half : Consolidated Operating Income by Geographic Area <Appendix>
(100 Million Yen)
9http://www.fhi.co.jp/english/ir/index.html
5,883
569
578
719
4,017
9.7%10.8%
9.8%9.1%
12.2%10.7%
68.3%69.5%
+1,5774,305Total
+260459Europe
Actual Results1st Half
FYE March 2012
Actual Results1st Half
FYE March 2013
Increase /Decrease
North America2,991 +1,026
Asia390 +188
Other465 +104
1st Half : Overseas Net Sales <Appendix>
(100 Million Yen / Percentage of Total Sales)

10http://www.fhi.co.jp/english/ir/index.html
+18.787.368.6Subaru production(Thousand units)
SIAActual Results
1st HalfFYE March 2012
Actual Results1st Half
FYE March 2013
Increase /Decrease
Net sales 1,552 1,995 +443Operating income -6 18 +24Net income -3 11 +14
(million US$)
+36.5164.4127.9Retail sales(Thousand units)
SOAActual Results
1st HalfFYE March 2012
Actual Results1st Half
FYE March 2013
Increase /Decrease
Net sales 2,861 4,074 +1,213Operating income 105 100 -5Net income 68 64 -4
1st Half : Operating Results of Subsidiaries in U.S.

11http://www.fhi.co.jp/english/ir/index.html
-21819Interest expenses
-103444FOREX effects
-38-51-13Net of FOREX gains and losses
-82028Net
+248257Non-operating expenses
-415Equity in earnings of affiliates
+2119Interest & dividends income
Actual Results1st Half
FYE March 2012
Actual Results1st Half
FYE March 2013
Increase /Decrease
Non-Operating income 86 102 +17
Financial revenue and expenditure -10 -6 +4
Net of gain and loss onvaluation of derivatives 57 85 +28
(100 Million Yen)
1st Half : Consolidated Non-Operating Income and Expenses

12http://www.fhi.co.jp/english/ir/index.html
+1717-Loss on reduction of noncurrent assets
+1717-State subsidy
-001Impairment loss
+33-Gain on sale of loans receivable
-552985Extraordinary loss
-1806186Net
+186Loss on sales and retirement of noncurrent assets
+671Other
-245Gain on sales of investment securities
-2604265Gain on sales of noncurrent assets
Actual Results1st Half
FYE March 2012
Actual Results1st Half
FYE March 2013
Increase /Decrease
Extraordinary income 271 35 -235
Loss on disaster 73 - -73
Other 5 4 -1
(100 Million Yen)
1st Half : Consolidated ExtraordinaryIncome and Expenses

13http://www.fhi.co.jp/english/ir/index.html
+2714,7874,516Net assets
+0.9%34.2%33.3%Shareholder’s equity to total assets
+3692,2551,885Retained earnings
-1093,3013,410Interest bearing debt
-215,8795,900Noncurrent assets
+4478,0727,625Current assets
As of March 31,
2012
As ofSeptember 30,
2012
Increase /Decrease
Total assets 13,525 13,951 +426
Shareholder’s equity 4,503 4,773 +270
D/E ratio 0.76 0.69 -0.07
Consolidated Balance Sheets
(100 Million Yen)

14http://www.fhi.co.jp/english/ir/index.html
+2132130Increase (decrease) in cash and cash equivalents resulting from change of scope of consolidation
73177847Free cash flows
-848-327522Net cash provided by (used in) financing activities
-0-53-53Effect of exchange rate change on cash and cash equivalents
-464-324140Net cash provided by (used in) investing activities
Actual Results1st Half
FYE March 2012
Actual Results1st Half
FYE March 2013
Increase /Decrease
Net cash provided by (used in) operating activities -92 1,103 +1,195
Net increase (decrease) in cash and cash equivalents 516 398 -117
Cash and cash equivalents at end of period 2,793 3,192 +399
(100 Million Yen)
1st Half : Consolidated Statementof Cash Flows

15http://www.fhi.co.jp/english/ir/index.html
+74.6188.8114.2Number of vehicles exported
+85.3348.4263.1Total
+14.387.072.7Components for overseas production
-13.025.238.2Minicar
+9.447.438.1Passenger car
-3.672.676.2Domestic sales
Actual Results1st Half
FYE March 2012
Actual Results1st Half
FYE March 2013
Increase /Decrease
Domestic production 178.0 272.5 +94.5
(Thousand units)
1st Half : Non-Consolidated Automobile Sales<Appendix>
* Domestic Production figures include Toyota 86.
16http://www.fhi.co.jp/english/ir/index.html
Net Sales & Operating Income <Appendix>
Operating Income(¥100M)
Net Sales(¥100M)
3,703
4,337
3,7064,059
3,004
3,5463,744
4,8774,691
4,289
347
259
173161
9181
107107
161
226
0
1,000
2,000
3,000
4,000
5,000
6,000
1Q 2Q 3Q 4Q 1Q 2Q 3Q 4Q 1Q 2Q0
50
100
150
200
250
300
350
400
FY2013FY2012FY2011
¥81/$¥82/$¥83/$¥83$¥88/$ ¥79/$¥78/$¥79/$¥79/$¥92/$
17http://www.fhi.co.jp/english/ir/index.html
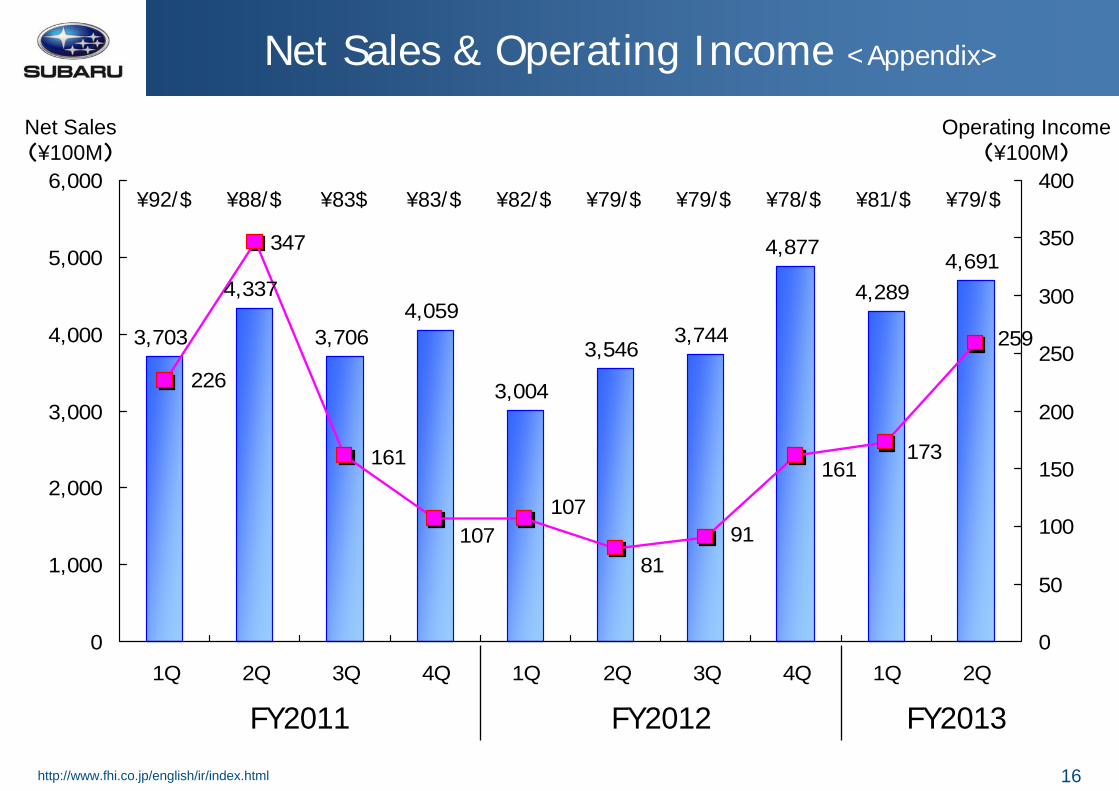
(1,000 Cars)
Complete Cars Production & Retail Sales <Appendix>
Production Retail
* Production figures include Toyota 86.
162 161 164
196 196182 178174 172
136
111
138
167
191
158150147
162156160
0
50
100
150
200
Apr.-Jun.
Jul.-Sep. Oct.-Dec.
Jan.-Mar.
Apr.-Jun.
Jul.-Sep. Oct.-Dec.
Jan.-Mar.
Apr.-Jun.
Jul.-Sep.
201220112010

18http://www.fhi.co.jp/english/ir/index.html
Shareholder’s Equityto Total Assets
FCF(¥100M)
Free Cash Flows & Shareholder’s Equity to Total Assets <Appendix>
246
640
397
78 47
-42
283221
778871
34.2%
33.7%
33.6% 33.3%33.7%34.2%34.7%34.7%35.4%
31.9%
-100
100
300
500
700
900
1,100
1Q 2Q 3Q 4Q 1Q 2Q 3Q 4Q 1Q 2Q0%
7%
14%
21%
29%
36%
43%
FY2013FY2012FY2011

19http://www.fhi.co.jp/english/ir/index.html
D/E RatioInterest Bearing Debt(¥100M)
Interest Bearing Debts & D/E Ratio <Appendix>
3,473 3,3673,179
3,306
3,965 3,8663,688
3,410 3,381 3,301
0.690.74
0.820.76
0.850.89
0.91
0.80.76
0.89
0
500
1,000
1,500
2,000
2,500
3,000
3,500
4,000
4,500
1Q 2Q 3Q 4Q 1Q 2Q 3Q 4Q 1Q 2Q0.0
0.2
0.4
0.6
0.8
1.0
1.2
1.4
FY2013FY2012FY2011

20http://www.fhi.co.jp/english/ir/index.html
+35.7141.4105.8Overseas total
+2.915.913.0China
+0.810.29.4Australia
+3.89.65.8Canada
+20.281.961.7U.S.
-0.741.141.8Domestic total
-8.213.421.6Minicar
Actual Results2nd Quarter
FYE March 2012
Actual Results2nd Quarter
FYE March 2013
Increase /Decrease
Passenger car 20.2 27.7 +7.5
Russia 3.9 5.5 +1.6Europe 6.9 12.7 +5.9
Others 5.1 5.6 +0.5
Total 147.6 182.5 +35.0
2nd Quarter : Consolidated Automobile Sales<Appendix>
(Thousand Units)
* Canada figures of FYE2012 and China figures of FYE2013 are consolidated on the calendar year basis from Apr. to Jun.

21http://www.fhi.co.jp/english/ir/index.html
+¥0/US$¥79/US$¥79/US$FHI exchange rate
+16326299Ordinary income
+17825981Operating income
+7313,0202,290Overseas
+4141,6711,257Domestic
Actual Results2nd Quarter
FYE March 2012
Actual Results2nd Quarter
FYE March 2013
Increase /Decrease
Net sales 3,546 4,691 +1,145
Income before income taxes and minority interests
79 269 +190
Net income 43 241 +198
2nd Quarter : Consolidated Statements Income<Appendix>
(100 Million Yen)

22http://www.fhi.co.jp/english/ir/index.html
81
259
4
-6
-186104
262
Improvementof sales
volume &mixture and
others
Reductionin cost
Increase ofSG&A
expensesand others
Loss oncurrencyexchange
Decreaseof R&D
expenses
Operating Income2nd Quarter
FYE March 2012
Operating Income2nd Quarter
FYE March 2013+17.8 billion yen
(100 Million Yen)
2nd Quarter : Analysis of Increase and Decreasein Operating Income Changes (Consolidated) <Appendix>
Domestic : Improvement of mixtureOverseas : Improvement of volume & mixture
US$ : +10EURO : -8CA$ : -6Currency exchangeadjustment : -2
FHI : +95SIA : +9
Increase of fixed cost, SG&A expenses and warranty claims

23http://www.fhi.co.jp/english/ir/index.html
Outlook for the term Ending March 2013Outlook for the term Ending March 2013Outlook for the term Ending March 2013

24http://www.fhi.co.jp/english/ir/index.html
+86.6554.1467.5Overseas total
-8.040.348.3China
+4.841.736.9Australia
+5.233.428.2Canada
+68.5348.8280.4U.S.
-12.1160.3172.3Domestic total
-40.152.192.2Minicar
Actual ResultsFYE March 2012
PlanFYE March 2013
Increase /Decrease
Passenger car 80.2 108.1 +28.0
Russia 15.9 17.3 +1.4Europe 39.1 49.0 +9.9
Others 18.7 23.7 +4.9
Total 639.9 714.4 +74.6
(Thousand Units)
Full year : Consolidated Automobile Sales
* Canada figures of FYE2012 and China figures of FYE2013 are consolidated on the calendar year basis from Jan. to Dec.

25http://www.fhi.co.jp/english/ir/index.html
+¥1/US$¥79/US$¥79/US$FHI exchange rate
+437810373Ordinary income
+380820440Operating income
+1,64311,83010,186Overseas
+1,5866,5704,985Domestic
Actual ResultsFYE March 2012
PlanFYE March 2013
Increase /Decrease
Net sales 15,171 18,400 +3,229
Income before income taxes and minority interests
529 780 +251
Net income 385 670 +285
Full year : Consolidated Statements Income
(100 Million Yen)

26http://www.fhi.co.jp/english/ir/index.html
440820
-637
-19-70
274
832
(100 Million Yen)
Operating IncomeFYE March 2012
Operating IncomeFYE March 2013
Full Year : Analysis of Increase and Decrease in Operating Income Changes (Consolidated)
Improvementof sales
volume &mixture and
others
Reductionin cost
Increase ofSG&A
expensesand others
Increaseof R&D
expenses
+38.0 billion yen
Domestic : Improvement of volume & mixtureOverseas : Improvement of volume & mixture
FHI : +236SIA : +38
Increase of fixed cost and SG&A expenses Decrease of warranty claims
Loss oncurrencyexchange
US$ : +5EURO : -28CA$ : -1Currency exchange adjustment : -46

27http://www.fhi.co.jp/english/ir/index.html
+5.0175.6170.6Subaru production(Thousand units)
SIA Actual ResultsFYE March 2012
PlanFYE March 2013
Increase /Decrease
Net sales 3,845 4,031 +186Operating income 82 44 -38Net income 51 26 -25
(million US$)
+50.8330.0279.2Retail sales(Thousand units)
SOA Actual ResultsFYE March 2012
PlanFYE March 2013
Increase /Decrease
Net sales 6,923 8,340 +1,417Operating income 105 111 +6Net income 74 73 -1
Full Year : Operating Results of Subsidiaries in U.S.

28http://www.fhi.co.jp/english/ir/index.html
3,866
229
254
276
Actual Results1st HalfFYE2012
3,410
481
537
543
Actual Results
FYE2012 (a)
+63600247Depreciation
-1103,3003,301Interest bearing debt
Actual Results1st HalfFYE2013
Plan
FYE2013 (b)
Increase/Decrease(b) - (a)
Capex 339 720 +177
R&D 249 500 +19
Capex / Depreciation / R&D / Interest Bearing Debt<Appendix>
(100 Million Yen)

29http://www.fhi.co.jp/english/ir/index.html
+3.5277.7274.2Overseas total
-15.713.729.4China
-0.919.620.6Australia
+3.617.113.6Canada
+17.6184.5166.8U.S.
-11.588.399.8Domestic total
-29.925.555.5Minicar
Actual Results2nd Half
FYE March 2012
Plan2nd Half
FYE March 2013
Increase /Decrease
Passenger car 44.3 62.8 +18.5
Russia 10.3 6.2 -4.1Europe 24.5 23.6 -0.9
Others 9.0 13.0 +4.0
Total 373.9 366.0 -7.9
(Thousand Units)
2nd Half : Consolidated Automobile Sales <Appendix>
* Canada figures of FYE2012 and China figures of FYE2013 are consolidated on the calendar year basis from Jul. to Dec.

30http://www.fhi.co.jp/english/ir/index.html
+¥1/US$¥78/US$¥77/US$FHI exchange rate
+200357157Ordinary income
+135387252Operating income
+665,9475,881Overseas
+7333,4732,740Domestic
Actual Results2nd Half
FYE March 2012
Plan2nd Half
FYE March 2013
Increase /Decrease
Net sales 8,621 9,420 +799
Income before income taxes and minority interests
127 321 +194
Net income 57 266 +209
2nd Half : Consolidated Statements Income <Appendix>
(100 Million Yen)

31http://www.fhi.co.jp/english/ir/index.html
252387
1
-27
-205130
236
(100 Million Yen)
Operating Income2nd Half
FYE March 2012
Operating Income2nd Half
FYE March 2013
2nd Half : Analysis of Increase and Decrease in Operating Income Changes (Consolidated) <Appendix>
Improvementof sales
volume &mixture and
others
Reductionin cost
Increase ofSG&A
expensesand others
Decreaseof R&D
expenses
+13.5 billion yen
Domestic : Improvement of volume & mixtureOverseas : Deterioration of volume & mixture
FHI : +104SIA : +26
Increase of fixed cost and SG&A expenses Decrease of warranty claims
Loss oncurrencyexchange
US$ : +13EURO : -8CA$ : +9Currency exchange adjustment : -41

32http://www.fhi.co.jp/english/ir/index.html
AppendixAppendixAppendix

33http://www.fhi.co.jp/english/ir/index.html
-4.3276.4280.8Overseas total
-1.526.628.1China
+0.722.021.4Australia
+1.216.315.1Canada
-0.2164.4164.6U.S.
-3.272.075.2Domestic total
-1.226.627.8Minicar
Plan1st Half
FYE March 2013
Actual Results1st Half
FYE March 2013
Increase /Decrease
Passenger car 47.4 45.4 -2.0
Russia 12.5 11.1 -1.4Europe 27.3 25.4 -2.0
Others 11.8 10.7 -1.1
Total 355.9 348.4 -7.5
(Thousand Units)
1st Half : Consolidated Automobile SalesPlan vs. Actual Results <Appendix>
* China figures are consolidated on the calendar year basis from Jan. to Jun.

34http://www.fhi.co.jp/english/ir/index.html
+¥0/US$¥80/US$¥80/US$FHI exchange rate
+153453300Ordinary income
+113433320Operating income
-895,8835,971Overseas
-313,0983,129Domestic
Plan1st Half
FYE March 2013
Actual Results1st Half
FYE March 2013
Increase /Decrease
Net sales 9,100 8,980 -120
Income before income taxes and minority interests
290 459 +169
Net income 230 404 +174
1st Half : Consolidated Statements IncomePlan vs. Actual Results <Appendix>
(100 Million Yen)
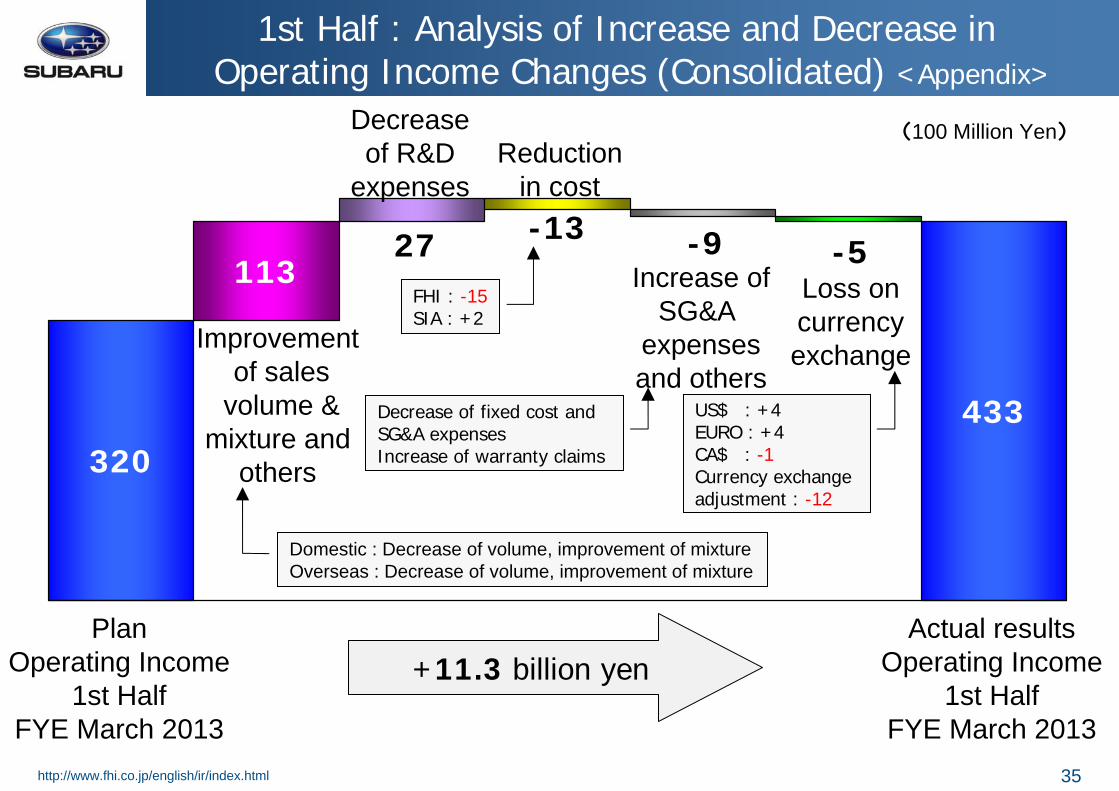
35http://www.fhi.co.jp/english/ir/index.html
320433
-13-5-927
113
(100 Million Yen)
PlanOperating Income
1st HalfFYE March 2013
Actual resultsOperating Income
1st HalfFYE March 2013
1st Half : Analysis of Increase and Decrease in Operating Income Changes (Consolidated) <Appendix>
Improvementof sales
volume &mixture and
others
Reductionin cost
Increase ofSG&A
expensesand others
Loss oncurrencyexchange
Decreaseof R&D
expenses
+11.3 billion yen
Domestic : Decrease of volume, improvement of mixtureOverseas : Decrease of volume, improvement of mixture
US$ : +4EURO : +4CA$ : -1Currency exchange adjustment : -12
FHI : -15SIA : +2
Decrease of fixed cost and SG&A expensesIncrease of warranty claims

36http://www.fhi.co.jp/english/ir/index.html
-21.3554.1575.4Overseas total
-21.740.362.0China
-2.241.743.9Australia
+1.733.431.7Canada
+24.8348.8324.0U.S.
+14.9160.3145.4Domestic total
+1.652.150.5Minicar
Previous PlanFYE March 2013
Revised PlanFYE March 2013
Increase /Decrease
Passenger car 94.9 108.1 +13.3
Russia 23.3 17.3 -6.0Europe 59.2 49.0 -10.2
Others 31.2 23.7 -7.6
Total 720.8 714.4 -6.4
(Thousand Units)
Full year : Consolidated Automobile SalesPrevious Plan vs. Revised Plan <Appendix>
* China figures are consolidated on the calendar year basis from Jan. to Dec.

37http://www.fhi.co.jp/english/ir/index.html
-¥1/US$¥79/US$¥80/US$FHI exchange rate
+180810630Ordinary income
+150820670Operating income
-49211,83012,322Overseas
+2926,5706,278Domestic
Previous PlanFYE March 2013
Revised PlanFYE March 2013
Increase /Decrease
Net sales 18,600 18,400 -200
Income before income taxes and minority interests
600 780 +180
Net income 480 670 +190
Full year : Consolidated Statements IncomePrevious Plan vs. Actual Results <Appendix>
(100 Million Yen)

38http://www.fhi.co.jp/english/ir/index.html
670820
11
-69
-14030318
(100 Million Yen)
Previous PlanOperating IncomeFYE March 2013
Revised PlanOperating IncomeFYE March 2013
Full year : Analysis of Increase and Decrease in Operating Income Changes (Consolidated) <Appendix>
Improvementof sales
volume &mixture and
others
Reductionin cost
Increase ofSG&A
expensesand others Loss on
currencyexchange
Decreaseof R&D
expenses
+15.0 billion yen
Domestic : Improvement of volume & mixtureOverseas : Decrease of volume, improvement of mixture
US$ : -73EURO : +13CA$ : +2Currency exchange adjustment : -11
FHI : -6SIA : +17
Increase of fixed cost, SG&A expenses andwarranty claims

39http://www.fhi.co.jp/english/ir/index.html
Thank you !


![index [exhibitors.productronica.com] · 2019-08-08 · HOLDER FUJI NXT N610071334AA FUJI NXT H04 SMT N610059928AA WPH2030 FUJI Filter XH00400 N610071334AA DCPH0630 FUJI CP7 FILTER](https://img.pdfslide.us/doc/110x75/5e9f95a3be23337fb22f1412/index-2019-08-08-holder-fuji-nxt-n610071334aa-fuji-nxt-h04-smt-n610059928aa.jpg)