Embed Size (px)
Citation preview

Q2 2015
Vehicle Equity: Managing the Risk AheadAT A GLANCE■■ Used vehicle depreciation forecast
■■ How depreciation will affect equity gains
■■ Impact of long-term loans on vehicle equity
■■ Using metrics to navigate the road ahead

Vehicle Equity: Managing the Risk Ahead
866.976.6232 | nada.com/b2b | 2
IntroCredit and the sales of new and used vehicles are basically joined at the hip. After all, automaker captive finance companies were created to provide credit to consumers so more new vehicles could be bought and produced. Among many things, the Great Recession and the years since have reaffirmed the lesson that as credit conditions go, so go new and used sales.
Credit availability dropped dramatically following 2008’s financial collapse, dragging down new and used vehicle sales with it. Recovery took years. Consumers gradually shed billions of dollars in debt, auto loan defaults dropped to a level not seen in more than a decade and interest rates fell to unprecedented lows.
This lower-risk environment caused lenders to loosen credit standards and provide the capital necessary to fuel the recovery in new and used vehicle sales. Lending activity was also supported
by an exceptionally low rate of used vehicle depreciation. On average, used vehicles lost 16% of their value per year in the decade leading up to the recession, but in the years that immediately followed (2010–2011), depreciation plummeted to less than 5% per year. Used vehicle depreciation has risen somewhat over the past three years, but at 13%, annual losses have remained incredibly low nonetheless (figure 1).
The combination of cheap money and slower depreciation pushed borrowers into positive equity territory at the fastest pace in decades, providing them with additional cash for purchasing new and used cars and trucks. As for lenders, the improvement in equity not only helped support loan origination growth, but also reduced losses when a vehicle had to be repossessed.
But while times have been good, history tells us they won’t stay that way forever. Interest rates are set to rise soon, and vehicle depreciation is
-23%
-20%
-18%
-15%
-13%
-10%
-8%
-5%
-3%
0%
1997 1998 1999 2000 2001 2002 2003 2004 2005 2006 2007 2008 2009 2010 2011 2012 2013 2014
ANNU
AL R
ATE
OF D
EPRE
CIAT
ION
Historical Used Vehicle Depreciation Annual change in used vehicle prices. Vehicles up to eight years in age.
CALENDAR YEARHistorical Used Vehicle Depreciation | Source: NADA Used Car Guide
Figure 1

Vehicle Equity: Managing the Risk Ahead
866.976.6232 | nada.com/b2b | 3
expected to pick up speed. These factors, combined with the trend toward longer loan terms, mean it will take longer for borrowers to chip away at loan balances — which will make it harder for lenders to improve top-line growth while managing future risk.
This report details why — and how quickly — used vehicles are expected to depreciate in the coming years, the equity consequences posed by longer-term loans and steeper depreciation, and how insightful metrics can help lenders more effectively navigate the road ahead.
Vehicle Depreciation Set to Pick Up SpeedWhen new vehicle sales dropped from a pre-recession annual average of more than 16 million units to a low point of 10.4 million in 2009, the resulting decline in used vehicle supply played a major role in the substantial 18% increase in used vehicle prices that has occurred since 2007. But
now that new vehicle sales have been in growth mode for the better part of five years, used vehicle supply is quickly heading back to pre-recession levels.
The renewed appetite for leasing (lease volume reached 3.2 million units in 2014, second only to 1999’s total of 3.3 million) is accelerating used supply growth because leased vehicles return to the market faster than purchased ones. Combined, late-model used vehicle supply (up to five years in age) is expected to rise by more than 2 million units through 2017 to a total of 14.1 million, placing supply within striking distance of 2007’s 14.6 million units. This expanding pool of used vehicles will steadily compress prices as time passes (figure 2).
Two other significant factors are expected to put downward pressure on used vehicle prices.
First, we expect credit conditions to worsen. However, this is a bit like saying things will be worse for the
USE
D VE
HIC
LE S
UPP
LY (
IN M
ILLI
ONS)
NADA Used Vehicle Supply Forecast Vehicles up to five years in age.
14.6 13.8
12.9 12.0 11.6
11.0 10.8 11.1 12.0
13.1 14.1
2007 2008 2009 2010 2011 2012 2013 2014 2015 2016 2017 0
2
4
6
8
10
12
14
16
CALENDAR YEARNADA Used Vehicle Supply Forecast | Source: NADA Used Car Guide
Figure 2
Vehicle Equity: Managing the Risk Ahead
866.976.6232 | nada.com/b2b | 4
lottery winner who will win only $1 million this year instead of the $2 million they won last year. The Federal Reserve decision to raise short-term interest rates expected in Q3 2015 will push auto loan rates higher for the first time in a decade, although rates will likely rise slowly over an extended period. Credit conditions will continue to be favorable for some time, but not at quite the same unprecedented level.
Lastly, we expect slowing new sales growth to increase pricing competition among manufacturers. Automakers tend to be optimistic about their new sales prospects, especially following periods of growth like the one the market recently experienced. The effort to meet manufacturers’ new sales expectations will result in a level of production unlikely to clear the market without price reductions.
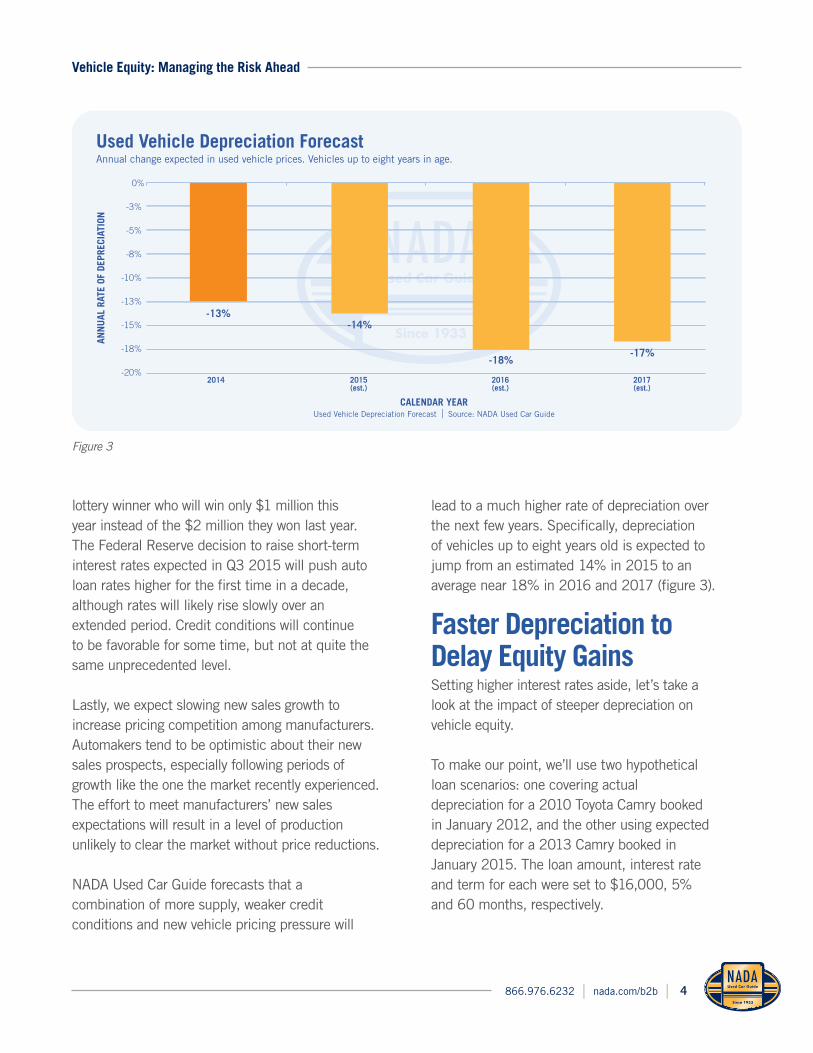
NADA Used Car Guide forecasts that a combination of more supply, weaker credit conditions and new vehicle pricing pressure will
lead to a much higher rate of depreciation over the next few years. Specifically, depreciation of vehicles up to eight years old is expected to jump from an estimated 14% in 2015 to an average near 18% in 2016 and 2017 (figure 3).
Faster Depreciation to Delay Equity GainsSetting higher interest rates aside, let’s take a look at the impact of steeper depreciation on vehicle equity.
To make our point, we’ll use two hypothetical loan scenarios: one covering actual depreciation for a 2010 Toyota Camry booked in January 2012, and the other using expected depreciation for a 2013 Camry booked in January 2015. The loan amount, interest rate and term for each were set to $16,000, 5% and 60 months, respectively.
ANN
UAL
RAT
E OF
DEP
RECI
ATIO
N
Used Vehicle Depreciation Forecast Annual change expected in used vehicle prices. Vehicles up to eight years in age.
CALENDAR YEARUsed Vehicle Depreciation Forecast | Source: NADA Used Car Guide
2014 2015(est.)
2016(est.)
2017(est.)
-13%-14%
-18%-17%
-20%
-18%
-15%
-13%
-10%
-8%
-5%
-3%
0%
Figure 3
Vehicle Equity: Managing the Risk Ahead
866.976.6232 | nada.com/b2b | 5
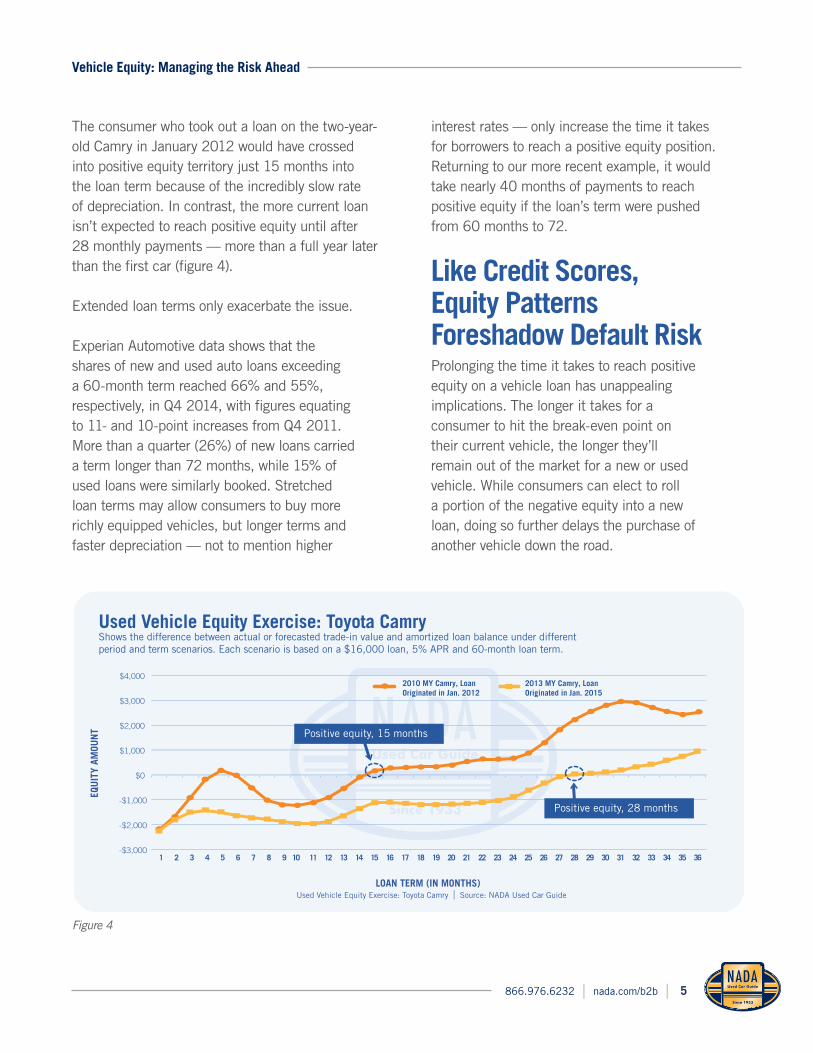
The consumer who took out a loan on the two-year-old Camry in January 2012 would have crossed into positive equity territory just 15 months into the loan term because of the incredibly slow rate of depreciation. In contrast, the more current loan isn’t expected to reach positive equity until after 28 monthly payments — more than a full year later than the first car (figure 4).
Extended loan terms only exacerbate the issue.
Experian Automotive data shows that the shares of new and used auto loans exceeding a 60-month term reached 66% and 55%, respectively, in Q4 2014, with figures equating to 11- and 10-point increases from Q4 2011. More than a quarter (26%) of new loans carried a term longer than 72 months, while 15% of used loans were similarly booked. Stretched loan terms may allow consumers to buy more richly equipped vehicles, but longer terms and faster depreciation — not to mention higher
interest rates — only increase the time it takes for borrowers to reach a positive equity position. Returning to our more recent example, it would take nearly 40 months of payments to reach positive equity if the loan’s term were pushed from 60 months to 72.
Like Credit Scores, Equity Patterns Foreshadow Default RiskProlonging the time it takes to reach positive equity on a vehicle loan has unappealing implications. The longer it takes for a consumer to hit the break-even point on their current vehicle, the longer they’ll remain out of the market for a new or used vehicle. While consumers can elect to roll a portion of the negative equity into a new loan, doing so further delays the purchase of another vehicle down the road.
EQU
ITY
AMOU
NT
Used Vehicle Equity Exercise: Toyota Camry Shows the difference between actual or forecasted trade-in value and amortized loan balance under differentperiod and term scenarios. Each scenario is based on a $16,000 loan, 5% APR and 60-month loan term.
2010 MY Camry, Loan Originated in Jan. 2012
2013 MY Camry, Loan Originated in Jan. 2015
1 2 3 4 5 6 7 8 9 10 11 12 13 14 15 16 17 18 19 20 21 22 23 24 25 26 27 28 29 30 31 32 33 34 35 36
LOAN TERM (IN MONTHS) Used Vehicle Equity Exercise: Toyota Camry | Source: NADA Used Car Guide
-$3,000
-$2,000
-$1,000
$0
$1,000
$2,000
$3,000
$4,000
Positive equity, 15 months
Positive equity, 28 months
Figure 4

Vehicle Equity: Managing the Risk Ahead
866.976.6232 | nada.com/b2b | 6
Evidence also suggests that equity plays an important role in influencing loan defaults.
Lenders focus on the borrower’s credit history to determine future default risk. Does the individual have the income to meet their financial obligations if they take on a new loan? Do they tend to pay their debts on time? Has the person left a lender high and dry before? Answers to these questions indicate the level of risk a borrower presents and form the basis for the loan terms they’re offered.
To varying degrees, many lenders also consider the risk posed by the vehicle borrowed against, with an eye toward minimizing losses if the consumer defaults. This is a prudent practice, but NADA Used Car Guide research suggests that the vehicle can also help predict if a default will occur in the first place.
To illustrate this idea, we’ll use another hypothetical loan scenario predicated on NADA Used Car Guide’s
depreciation forecast. Figure 5 follows two vehicle groups: one comprising top-performing models in terms of expected depreciation over the next three years, and the other comprising models expected to depreciate the most. The same loan terms apply to each vehicle group — $28,000 loan amount, 3% interest rate and 72-month loan term. To keep things simple, we’ve made the loan amount and market value at time of purchase the same (so equity at the start of the loan is zero).
The top-performing group will reach a break-even point after just 20 months, and after three years borrowers will have the comfort of knowing they’ve accrued almost $2,000 of equity in their asset. By comparison, the bottom-performing group will be some $5,000 in the hole at the 36-month mark, and owners won’t reach the break-even point until 60 months into the loan term. Wholesale value once the loan is paid off will be roughly $3,500–$6,000 less than the top group’s value.
LOAN TERM (IN MONTHS) Used Vehicle Equity Outlook: Top- and Bottom-performing Vehicles | Source: NADA Used Car Guide
EQU
ITY
POSI
TION
ESTIMATED PROBABILITY OF VEHICLE REPOSSESSION BASED ON EQUITY POSITION
Used Vehicle Equity Outlook: Top- and Bottom-performing Vehicles The difference between amortized loan balance and NADA's wholesale price forecast.
0 12 24 36 48 60 72 -$8,000
-$6,000
-$4,000
-$2,000
$0
$2,000
$4,000
$6,000
$8,000
$10,000
$12,000 Top Performer Bottom Performer
Top performer reachespositive equity at 20 months.
Bottom performer reachespositive equity at 60 months.
Figure 5
Vehicle Equity: Managing the Risk Ahead
866.976.6232 | nada.com/b2b | 7
PROB
ABIL
ITY
OF R
EPOS
SESS
ION
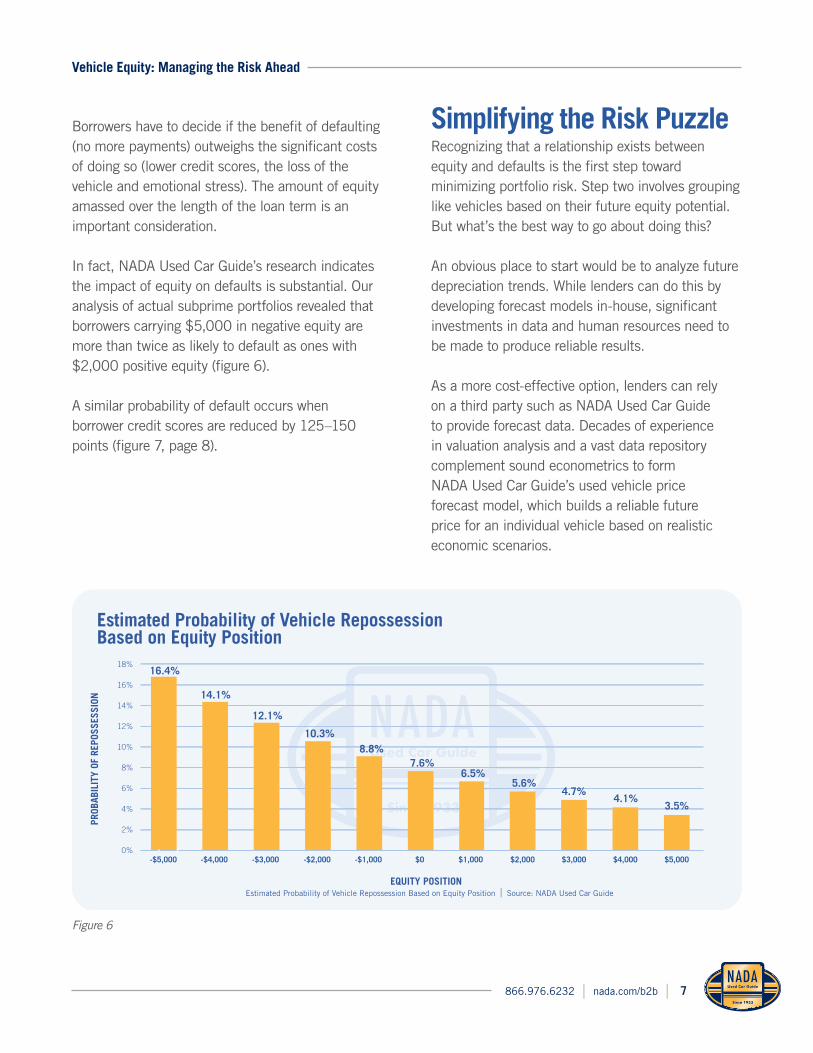
Estimated Probability of Vehicle Repossession Based on Equity Position
16.4%
14.1%
12.1%
10.3% 8.8%
7.6% 6.5%
5.6% 4.7%
4.1% 3.5%
18%
16%
14%
12%
10%
8%
6%
4%
2%
0%-$5,000 -$4,000 -$3,000 -$2,000 -$1,000 $0 $1,000 $2,000 $3,000 $4,000 $5,000
EQUITY POSITIONEstimated Probability of Vehicle Repossession Based on Equity Position | Source: NADA Used Car Guide
Figure 6
Borrowers have to decide if the benefit of defaulting (no more payments) outweighs the significant costs of doing so (lower credit scores, the loss of the vehicle and emotional stress). The amount of equity amassed over the length of the loan term is an important consideration.
In fact, NADA Used Car Guide’s research indicates the impact of equity on defaults is substantial. Our analysis of actual subprime portfolios revealed that borrowers carrying $5,000 in negative equity are more than twice as likely to default as ones with $2,000 positive equity (figure 6).
A similar probability of default occurs when borrower credit scores are reduced by 125–150 points (figure 7, page 8).
Simplifying the Risk PuzzleRecognizing that a relationship exists between equity and defaults is the first step toward minimizing portfolio risk. Step two involves grouping like vehicles based on their future equity potential. But what’s the best way to go about doing this?
An obvious place to start would be to analyze future depreciation trends. While lenders can do this by developing forecast models in-house, significant investments in data and human resources need to be made to produce reliable results.
As a more cost-effective option, lenders can rely on a third party such as NADA Used Car Guide to provide forecast data. Decades of experience in valuation analysis and a vast data repository complement sound econometrics to form NADA Used Car Guide’s used vehicle price forecast model, which builds a reliable future price for an individual vehicle based on realistic economic scenarios.

Vehicle Equity: Managing the Risk Ahead
866.976.6232 | nada.com/b2b | 8
Acting as an extension of our forecast data, we’ve also created a more straightforward assessment of future risk called the Vehicle Risk Score (VRS), which considers both a vehicle’s depreciation and volatility characteristics.
Gasoline price movement clearly illustrates the importance of accounting for volatility when
assessing risk. In the past, we’ve seen how rapidly rising and falling gasoline prices push compact and hybrid car prices up and then down by thousands of dollars over a short period of time. The level of risk for loans that originated at the peak of the cycle was much higher than it was for those booked at the valley of the cycle.
PROB
ABIL
ITY
OF R
EPOS
SESS
ION
Estimated Probability of Vehicle Repossession Based on Credit Score
CREDIT SCOREEstimated Probability of Vehicle Repossession Based on Credit Score | Source: NADA Used Car Guide
22%
20%
18%
16%
14%
12%
10%
8%
6%
4%
2%
0%
19.8%
16.8%
14.3%
12.2% 10.3%
8.8% 7.4%
6.3% 5.4%
4.5% 3.9% 3.3% 2.8%
400 425 450 475 500 525 550 575 600 625 650 675 700
Figure 7
* Based on actual subprime portfolios. Table shows repossession sale price plus payments collected, minus amount originally financed.
Risk Tier VRS Range Risk Outlook Sample Repossession Performance*
A 80–99 Very Low Risk $3,189 Above Average
B 60–79 Risk Slightly Better Than Average $24 Above Average
C 40–59 Risk Slightly Worse Than Average $777 Below Average
D Up to 39 Very High Risk $2,544 Below Average
NADA Used Car Guide Vehicle Risk Score (VRS) An easy-to-understand measure of vehicle risk.
Table 1
Vehicle Equity: Managing the Risk Ahead
866.976.6232 | nada.com/b2b | 9
Similar to a credit score, NADA Used Car Guide’s VRS makes it easy to identify a vehicle’s level of equity risk. Vehicles that are very likely to lead to loans with substantial negative equity, and thus are more prone to default, receive low scores, while those that are likely to accrue positive equity faster receive high scores. Scores are then grouped together and assigned a letter grade from A to D to simplify risk identification even further (table 1, page 8).
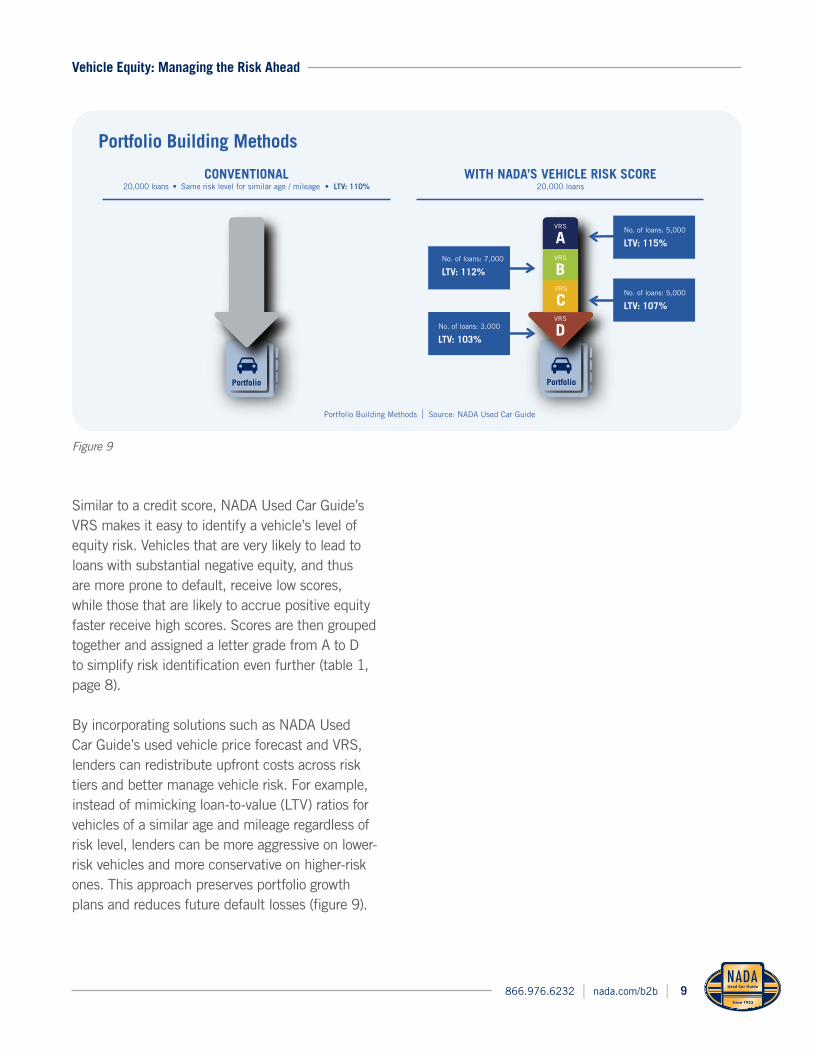
By incorporating solutions such as NADA Used Car Guide’s used vehicle price forecast and VRS, lenders can redistribute upfront costs across risk tiers and better manage vehicle risk. For example, instead of mimicking loan-to-value (LTV) ratios for vehicles of a similar age and mileage regardless of risk level, lenders can be more aggressive on lower-risk vehicles and more conservative on higher-risk ones. This approach preserves portfolio growth plans and reduces future default losses (figure 9).
Portfolio
VRS
AVRS
BVRS
CVRS
D
Portfolio Building Methods
No. of loans: 5,000
LTV: 107%
No. of loans: 7,000
LTV: 112%
No. of loans: 3,000
LTV: 103%
Portfolio
No. of loans: 5,000
LTV: 115%
WITH NADA’S VEHICLE RISK SCORE20,000 loans
Portfolio Building Methods | Source: NADA Used Car Guide
CONVENTIONAL20,000 loans • Same risk level for similar age / mileage • LTV: 110%
Figure 9
Vehicle Equity: Managing the Risk Ahead
866.976.6232 | nada.com/b2b | 10
SummaryAccording to the Federal Reserve’s most recent report on U.S. household debt, outstanding auto loan debt reached an all-time high of $955 billion in Q4 2014, up 11% from the same quarter in 2013 and 15% more than the pre-recession high set back in Q3 2005. The rise in auto debt is due to an increase in sales and vehicle prices, as well as the fact that more new and used vehicles are carrying loans. Simply put, lenders have more at stake in vehicles than ever before.
Looking ahead, lender investments will come increasingly under pressure as credit transitions from an exceptional period of low risk to one of decidedly higher risk. But while conditions will be more challenging, they don’t have to be less profitable.
By incorporating intelligent solutions such as NADA Used Car Guide’s used vehicle price forecast and VRS data, lenders can gain a more precise understanding of how future equity levels will affect risk exposure. Adopting a proactive and forward-looking approach to both borrower and vehicle risk today will drive success in the future.
NADA Used Car GuideSince 1933, NADA Used Car Guide has earned its reputation as the leading provider of
vehicle valuation products, services and information to businesses throughout the United
States and worldwide. NADA’s team collects and analyzes over one million combined
automotive and truck wholesale and retail transactions per month. Its guidebooks, auction
data, analysis and data solutions offer automotive / truck, finance, insurance and government
professionals the timely information and reliable solutions they need to make better business
decisions. Visit nada.com/b2b to learn more.
NADA Custom SolutionsNADA’s market intelligence team leverages a database of nearly 200 million automotive
transactions and more than 100 economic and automotive market-related series to describe
the factors driving current trends to help industry stakeholders make more informed
decisions. Analyzing data at both wholesale and retail levels, the team continuously provides
content that is both useful and usable to the automotive industry, financial institutions,
businesses and consumers.
Complemented by NADA’s analytics team, which maintains and advances NADA’s internal
forecasting models and develops customized forecasting solutions for automotive clients, the
market intelligence team is responsible for publishing original content in the form of blogs,
white papers and market reports. Throughout every piece of content, the team goes beyond
what is happening in the automotive industry to confidently answer why it is happening and how
it will impact the market in the future.
About NADA
For more information on this white paper or about NADA Custom Solutions, contact:JONATHAN BANKSSenior Director Vehicle Analysis & Analytics
LARRY DIXONSenior Manager Market Intelligence
STEVE STAFFORDAccount Executive Financial Industry, Accounting, Legal, OEM Captive

Used Car & Truck BlogKeep up with industry activity, get
insight into what lies ahead in the
marketplace and discover what’s
influencing the used vehicle valuation
market with NADA’s comprehensive
market overviews and data-focused
blogs. Join the conversation at
nada.com/usedcar
Commercial Truck BlogUpdated twice per week by Senior
Analyst Chris Visser, the Commercial
Truck Blog provides real-time analysis
of incoming sales data from the
industry’s leading used truck sales
database. Join the conversation at
nada.com/commercialtruck
Additional Resources
NADA GuidelinesUpdated monthly with a robust data
set from various industry sources and
NADA Used Car Guide’s own proprietary
analytical tool, Guidelines provides the
insight needed to make decisions in
today’s market. Sign up to receive NADA
Guidelines monthly at nada.com/guidelines
NADA PerspectiveLeveraging data from various industry
sources and NADA’s analysts, NADA
Used Car Guide Perspective takes a deep
dive into a range of industry trends to
determine why they are happening and
what to expect in the future. Sign up to
receive NADA Perspective monthly at
nada.com/perspective
White PapersNADA’s white papers and special reports
aim to inform industry stakeholders on
current and expected used vehicle price
movement to better maximize today’s
opportunities and manage tomorrow’s risk.
Sign up to receive white papers quarterly
at nada.com/whitepapers
Q2 2015
Vehicle Equity: Managing the Risk AheadAT A GLANCE■■ Used vehicle depreciation forecast
■■ How depreciation will affect equity gains
■■ Impact of long-term loans on vehicle equity
■■ Using metrics to navigate the road ahead
Read our blogsnada.com/usedcarnada.com/commercialtruck
Find us on Facebookfacebook.com/NADAUsedCarGuide
Follow us on Twitter@NADAUsedCarGde
Watch us on YouTubeyoutube.com/NADAUsedCarGuide