Embed Size (px)
Citation preview
THE VALUE OF A DEGREE
Institutional Research & EffectivenessAugust 2011
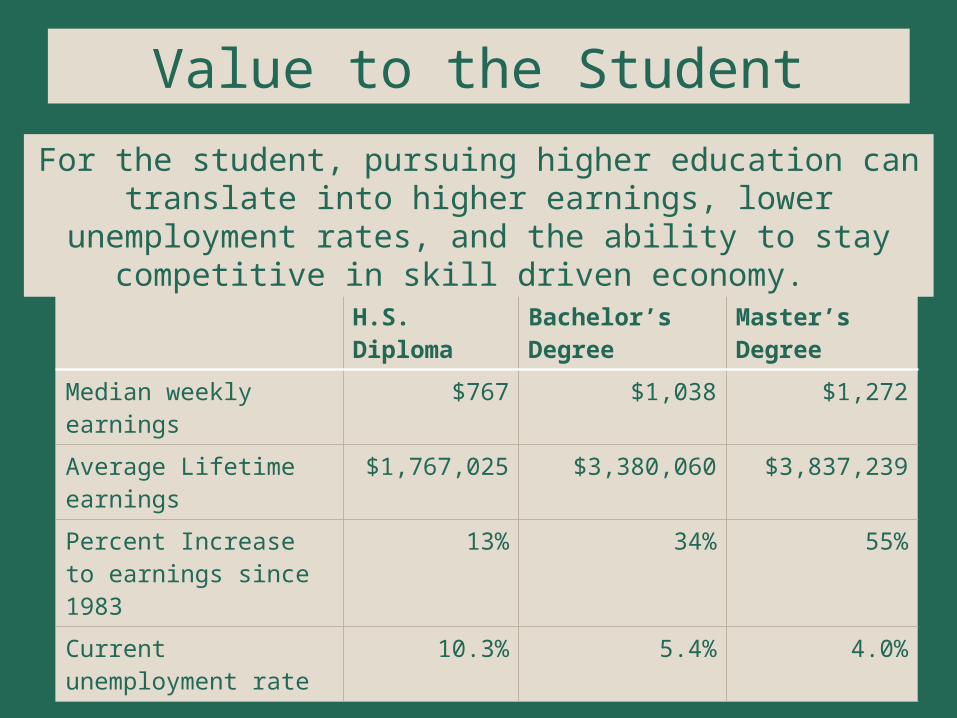
Value to the Student
H.S. Diploma Bachelor’s Degree Master’s Degree
Median weekly earnings $767 $1,038 $1,272
Average Lifetime earnings $1,767,025 $3,380,060 $3,837,239
Percent Increase to earnings since 1983
13% 34% 55%
Current unemployment rate
10.3% 5.4% 4.0%
For the student, pursuing higher education can translate into higher earnings, lower unemployment rates, and the ability to stay
competitive in skill driven economy.
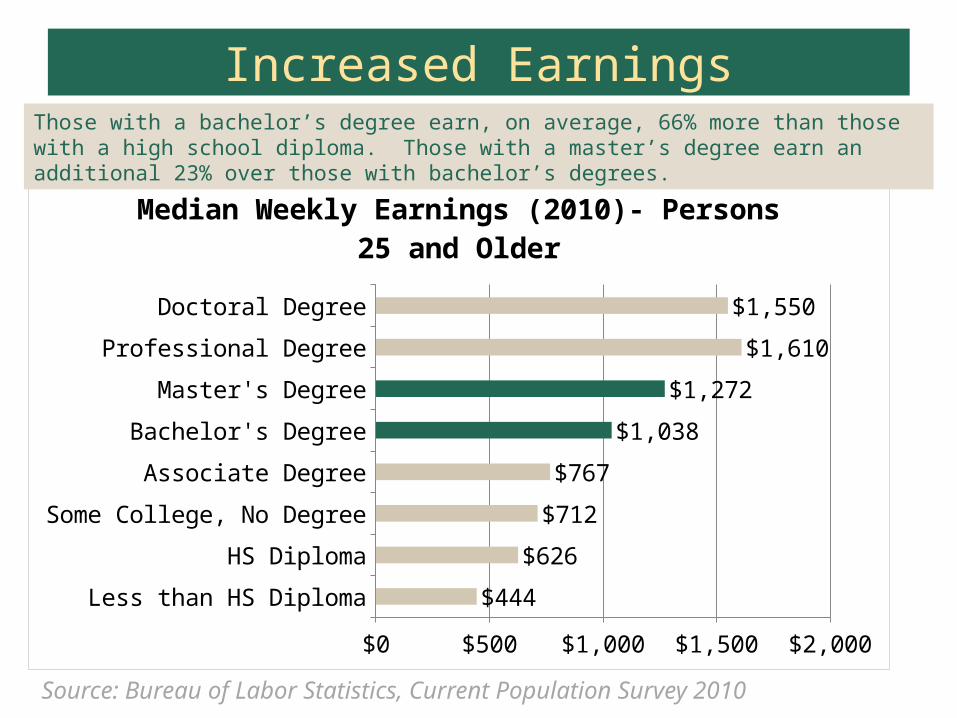
Increased Earnings
Less than HS Diploma
HS Diploma
Some College, No Degree
Associate Degree
Bachelor's Degree
Master's Degree
Professional Degree
Doctoral Degree
$0 $500 $1,000 $1,500 $2,000
$444
$626
$712
$767
$1,038
$1,272
$1,610
$1,550
Median Weekly Earnings (2010)- Persons 25 and Older
Source: Bureau of Labor Statistics, Current Population Survey 2010
Those with a bachelor’s degree earn, on average, 66% more than those with a high school diploma. Those with a master’s degree earn an additional 23% over those with bachelor’s degrees.
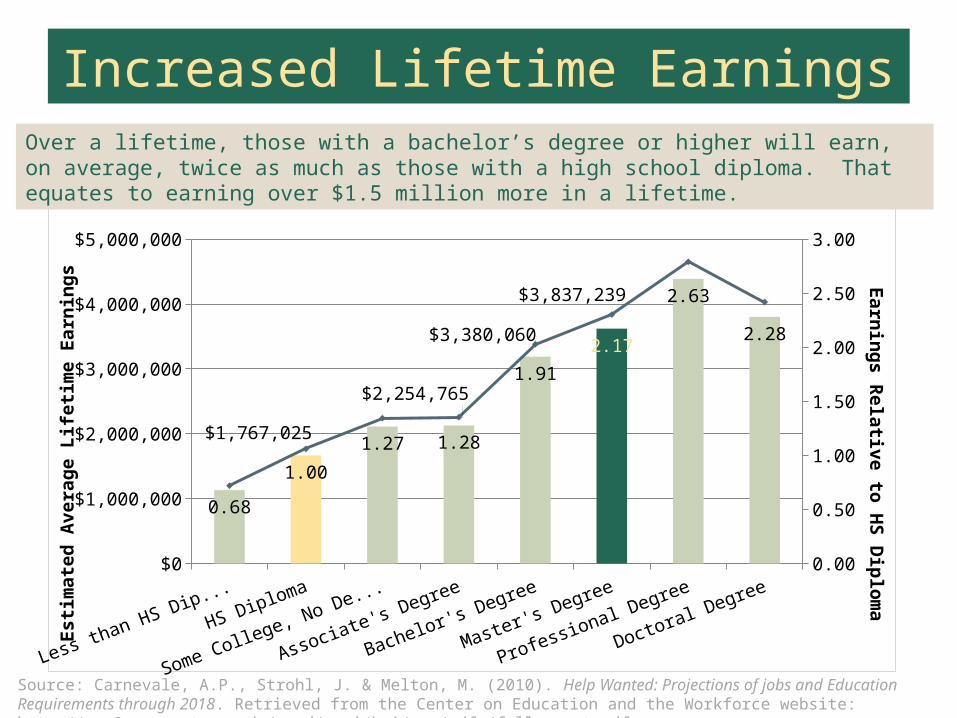
Increased Lifetime Earnings
Less than HS DiplomaHS Diploma
Some College, No Degree
Associate's Degree
Bachelor's Degree
Master's Degree
Professional Degree
Doctoral Degree$0
$1,000,000
$2,000,000
$3,000,000
$4,000,000
$5,000,000
0.00
0.50
1.00
1.50
2.00
2.50
3.00
0.68
1.00
1.27 1.28
1.91
2.17
2.63
2.28
$1,767,025
$2,254,765
$3,380,060
$3,837,239
Estim
ated
Ave
rage
Life
time
Earn
ings Earnings Relative to H
S Diplom
a
Source: Carnevale, A.P., Strohl, J. & Melton, M. (2010). Help Wanted: Projections of jobs and Education Requirements through 2018. Retrieved from the Center on Education and the Workforce website: http://www9.georgetown.edu/grad/gppi/hpi/cew/pdfs/fullreport.pdf
Over a lifetime, those with a bachelor’s degree or higher will earn, on average, twice as much as those with a high school diploma. That equates to earning over $1.5 million more in a lifetime.
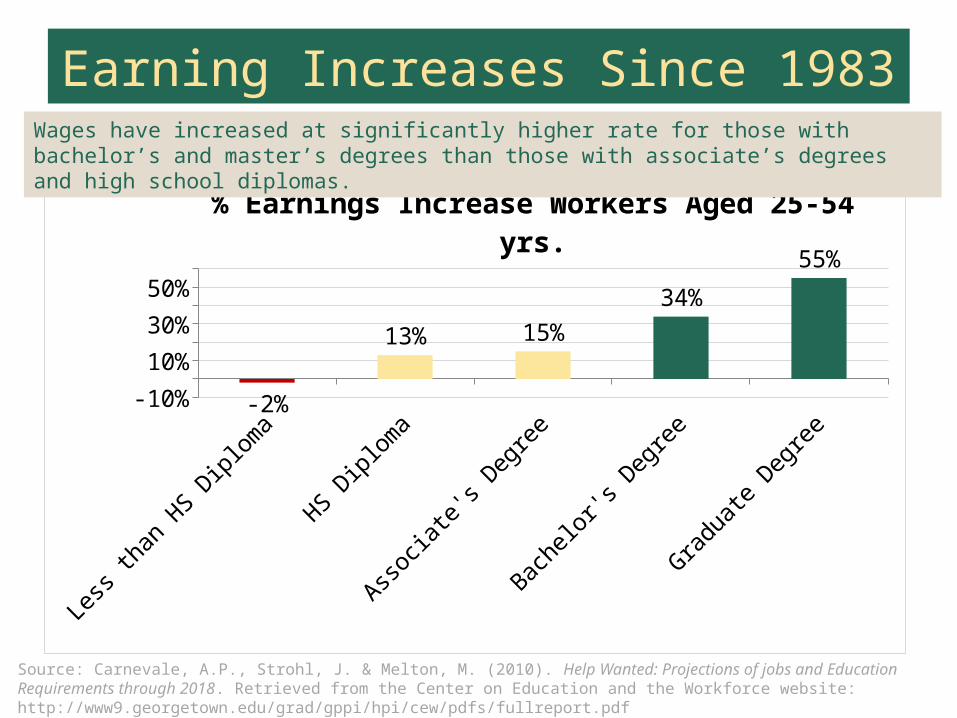
Earning Increases Since 1983
Less than HS Diploma
HS Diploma Associate's Degree
Bachelor's Degree
Graduate Degree
-10%
0%
10%
20%
30%
40%
50%
60%
-2%
13% 15%
34%
55%
% Earnings Increase Workers Aged 25-54 yrs.
Source: Carnevale, A.P., Strohl, J. & Melton, M. (2010). Help Wanted: Projections of jobs and Education Requirements through 2018. Retrieved from the Center on Education and the Workforce website: http://www9.georgetown.edu/grad/gppi/hpi/cew/pdfs/fullreport.pdf
Wages have increased at significantly higher rate for those with bachelor’s and master’s degrees than those with associate’s degrees and high school diplomas.
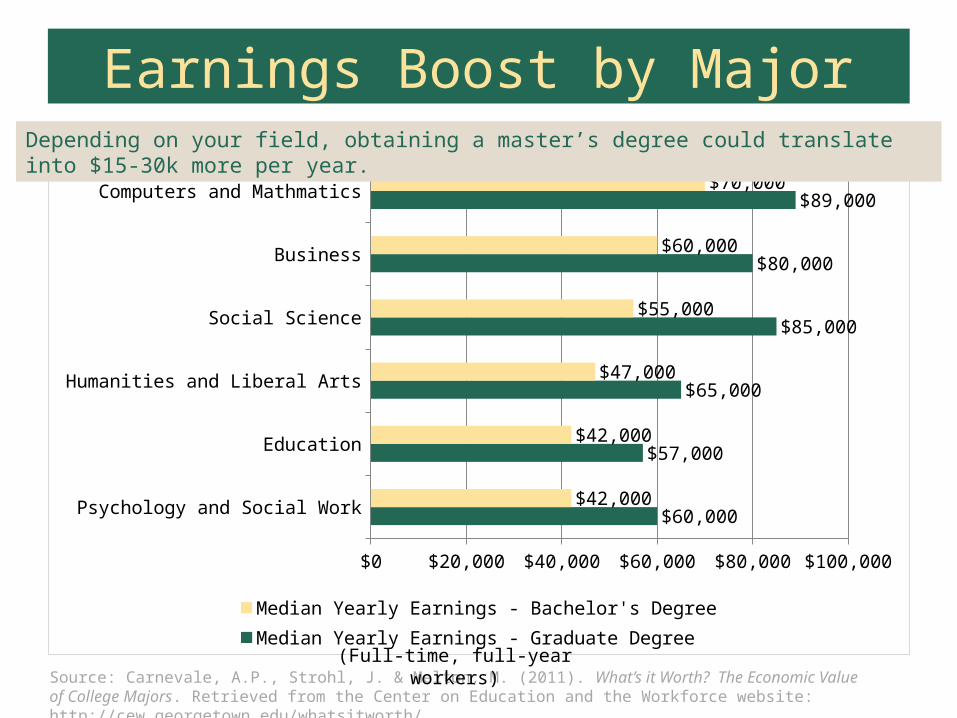
Earnings Boost by Major
Psychology and Social Work
Education
Humanities and Liberal Arts
Social Science
Business
Computers and Mathmatics
$0 $20,000 $40,000 $60,000 $80,000 $100,000
$60,000
$57,000
$65,000
$85,000
$80,000
$89,000
$42,000
$42,000
$47,000
$55,000
$60,000
$70,000
Median Yearly Earnings - Bachelor's Degree Median Yearly Earnings - Graduate Degree
Source: Carnevale, A.P., Strohl, J. & Melton, M. (2011). What’s it Worth? The Economic Value of College Majors. Retrieved from the Center on Education and the Workforce website: http://cew.georgetown.edu/whatsitworth/.
(Full-time, full-year workers)
Depending on your field, obtaining a master’s degree could translate into $15-30k more per year.
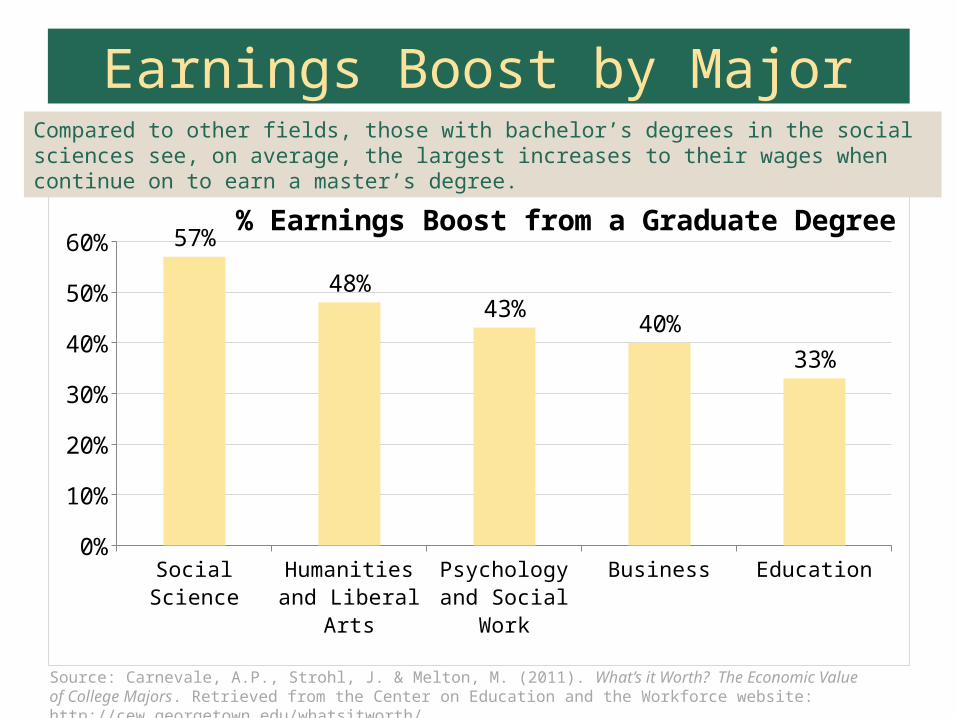
Earnings Boost by Major
Social Science Humanities and Liberal Arts
Psychology and Social Work
Business Education0%
10%
20%
30%
40%
50%
60% 57%
48%43%
40%
33%
% Earnings Boost from a Graduate Degree
Source: Carnevale, A.P., Strohl, J. & Melton, M. (2011). What’s it Worth? The Economic Value of College Majors. Retrieved from the Center on Education and the Workforce website: http://cew.georgetown.edu/whatsitworth/.
Compared to other fields, those with bachelor’s degrees in the social sciences see, on average, the largest increases to their wages when continue on to earn a master’s degree.
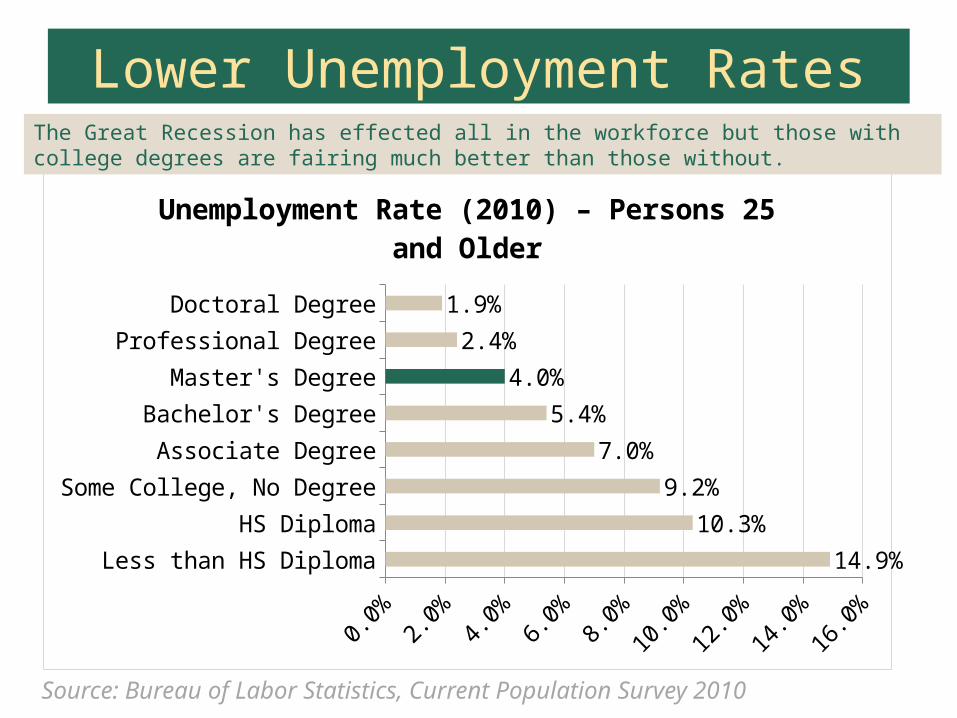
Lower Unemployment Rates
Less than HS Diploma
HS Diploma
Some College, No Degree
Associate Degree
Bachelor's Degree
Master's Degree
Professional Degree
Doctoral Degree
0.0% 2.0% 4.0% 6.0% 8.0% 10.0% 12.0% 14.0% 16.0%
14.9%
10.3%
9.2%
7.0%
5.4%
4.0%
2.4%
1.9%
Unemployment Rate (2010) – Persons 25 and Older
Source: Bureau of Labor Statistics, Current Population Survey 2010
The Great Recession has effected all in the workforce but those with college degrees are fairing much better than those without.
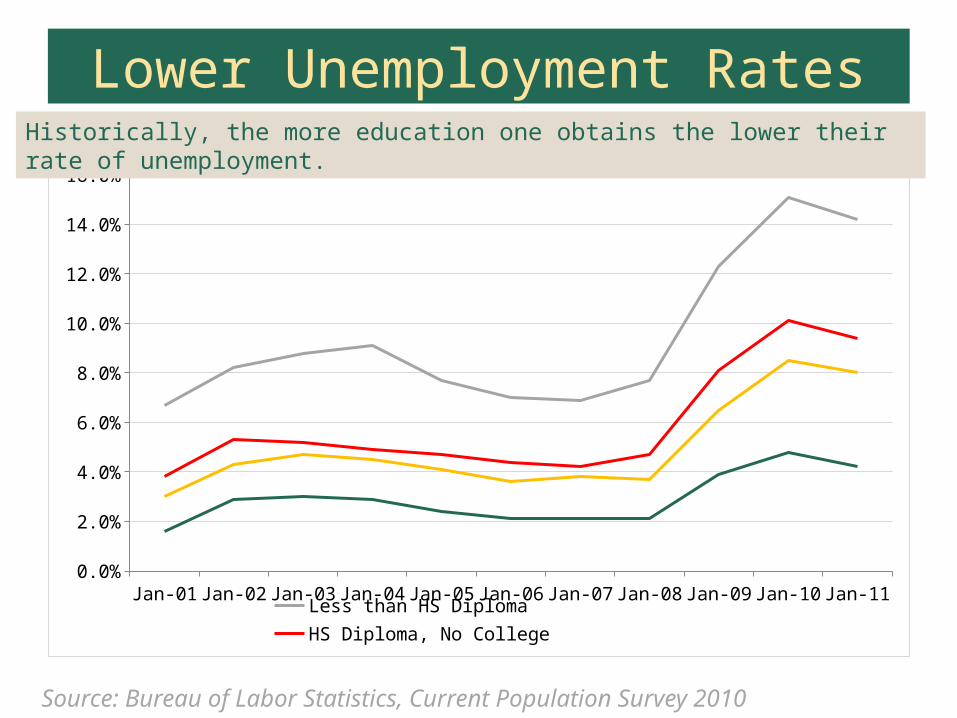
Lower Unemployment Rates
Jan-01 Jan-02 Jan-03 Jan-04 Jan-05 Jan-06 Jan-07 Jan-08 Jan-09 Jan-10 Jan-110.0%
2.0%
4.0%
6.0%
8.0%
10.0%
12.0%
14.0%
16.0%
Less than HS Diploma HS Diploma, No CollegeAssociate Degree or Some College Bachelor's Degree or Higher
Source: Bureau of Labor Statistics, Current Population Survey 2010
Historically, the more education one obtains the lower their rate of unemployment.
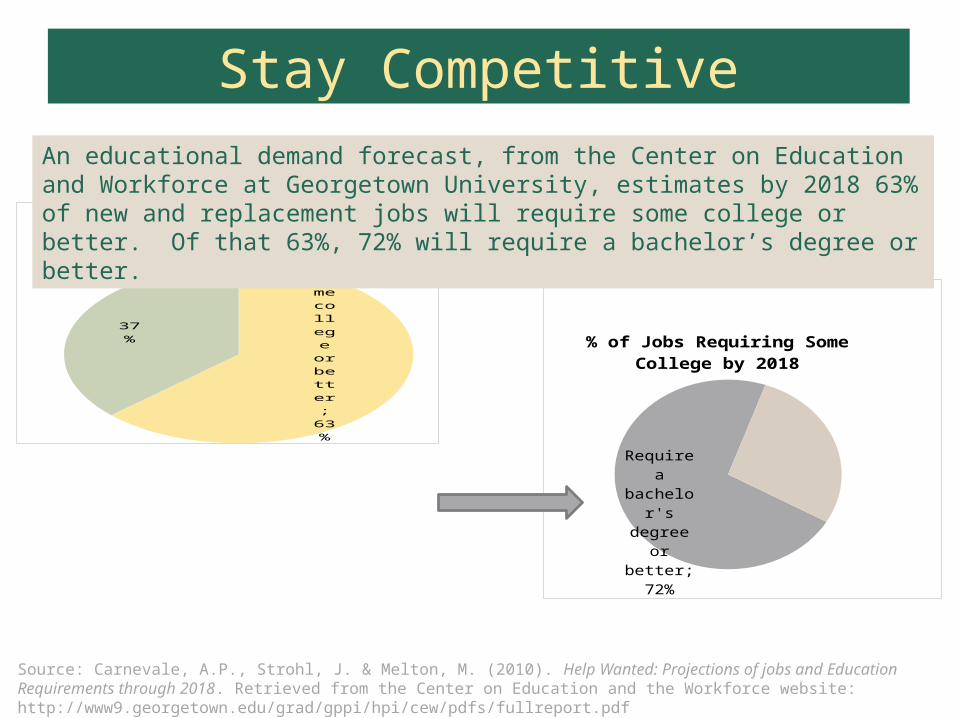
Stay Competitive
Jobs
re-quiring some col-lege or
bet-ter; 63%
37%
Educational Demand of Jobs by 2018
Require a bachelor's degree or
better; 72%
% of Jobs Requiring Some College by 2018
Source: Carnevale, A.P., Strohl, J. & Melton, M. (2010). Help Wanted: Projections of jobs and Education Requirements through 2018. Retrieved from the Center on Education and the Workforce website: http://www9.georgetown.edu/grad/gppi/hpi/cew/pdfs/fullreport.pdf
An educational demand forecast, from the Center on Education and Workforce at Georgetown University, estimates by 2018 63% of new and replacement jobs will require some college or better. Of that 63%, 72% will require a bachelor’s degree or better.
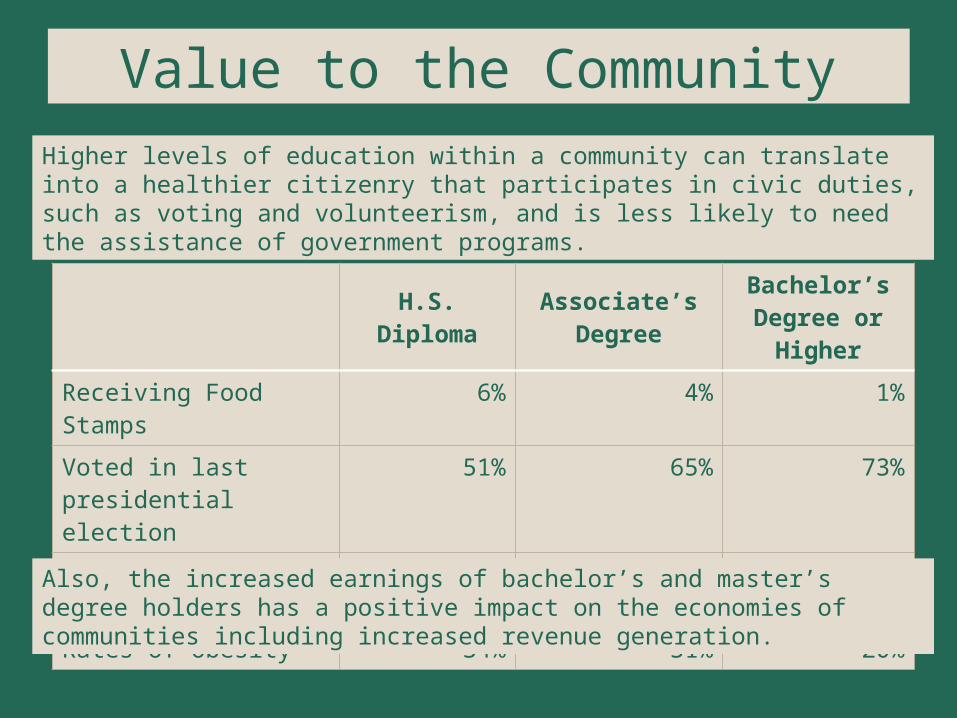
Value to the Community
H.S. Diploma Associate’s Degree Bachelor’s Degree or Higher
Receiving Food Stamps 6% 4% 1%
Voted in last presidential election
51% 65% 73%
% Volunteering in 2011 18% 29% 42%
Rates of obesity 34% 31% 20%
Higher levels of education within a community can translate into a healthier citizenry that participates in civic duties, such as voting and volunteerism, and is less likely to need the assistance of government programs.
Also, the increased earnings of bachelor’s and master’s degree holders has a positive impact on the economies of communities including increased revenue generation.
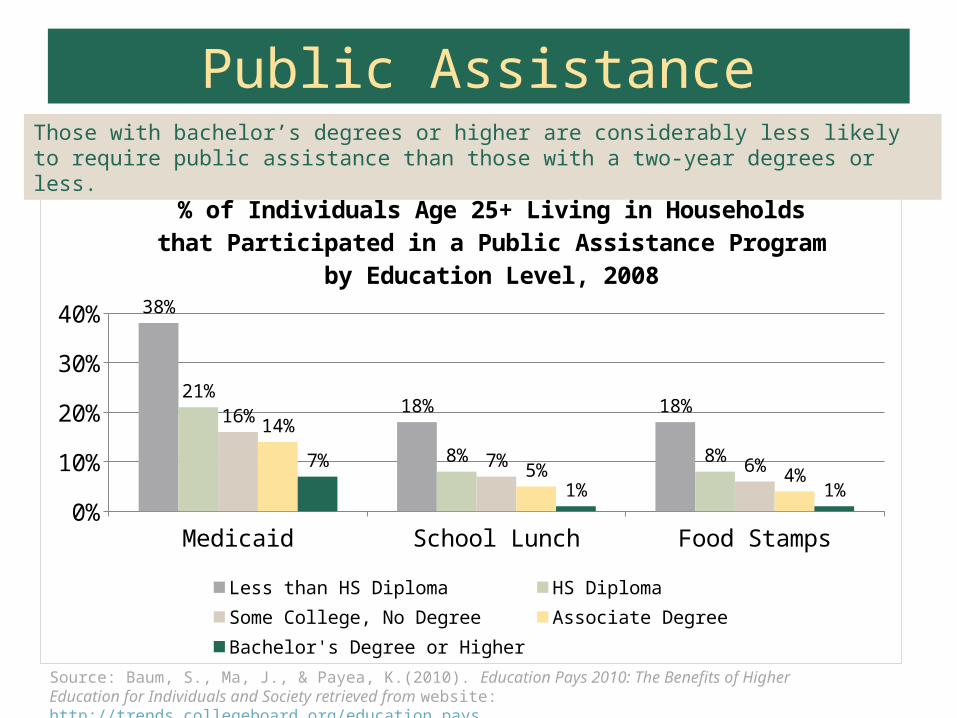
Public Assistance
Medicaid School Lunch Food Stamps0%
5%
10%
15%
20%
25%
30%
35%
40% 38%
18% 18%21%
8% 8%
16%
7% 6%
14%
5% 4%7%
1% 1%
% of Individuals Age 25+ Living in Households that Participated in a Public Assistance Program by Education Level, 2008
Less than HS Diploma HS Diploma Some College, No DegreeAssociate Degree Bachelor's Degree or Higher
Source: Baum, S., Ma, J., & Payea, K.(2010). Education Pays 2010: The Benefits of Higher Education for Individuals and Society retrieved from website: http://trends.collegeboard.org/education_pays
Those with bachelor’s degrees or higher are considerably less likely to require public assistance than those with a two-year degrees or less.
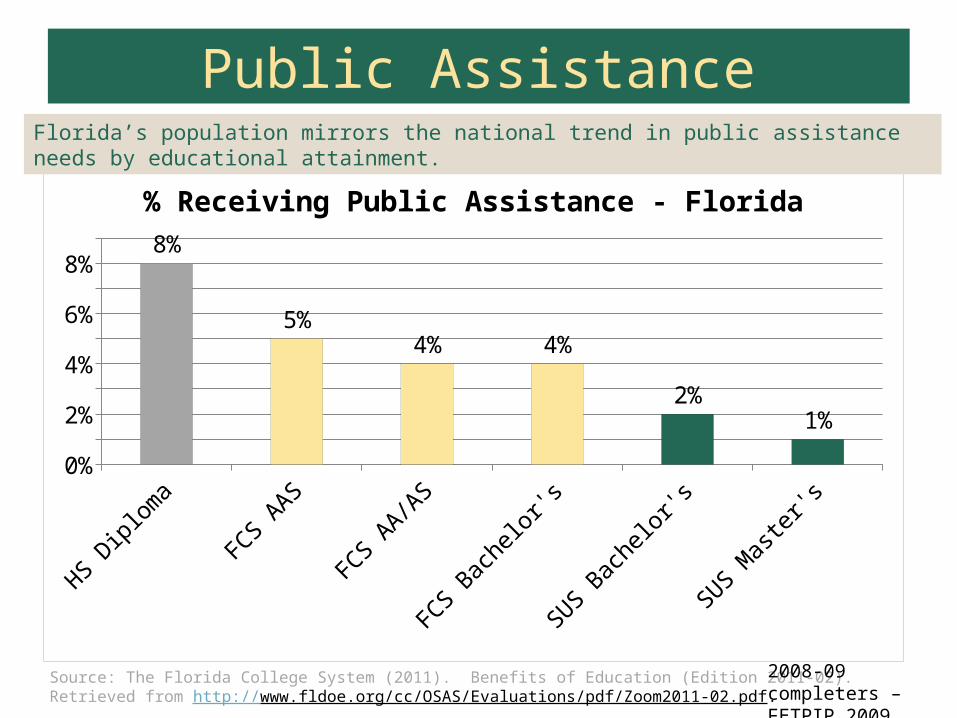
Public Assistance
HS Diploma
FCS A
AS
FCS A
A/AS
FCS B
achelor's
SUS B
achelor's
SUS M
aster's
0%1%2%3%4%5%6%7%8%9%
8%
5%4% 4%
2%1%
% Receiving Public Assistance - Florida
Source: The Florida College System (2011). Benefits of Education (Edition 2011-02). Retrieved from http://www.fldoe.org/cc/OSAS/Evaluations/pdf/Zoom2011-02.pdf.
Florida’s population mirrors the national trend in public assistance needs by educational attainment.
2008-09 completers – FETPIP 2009 data
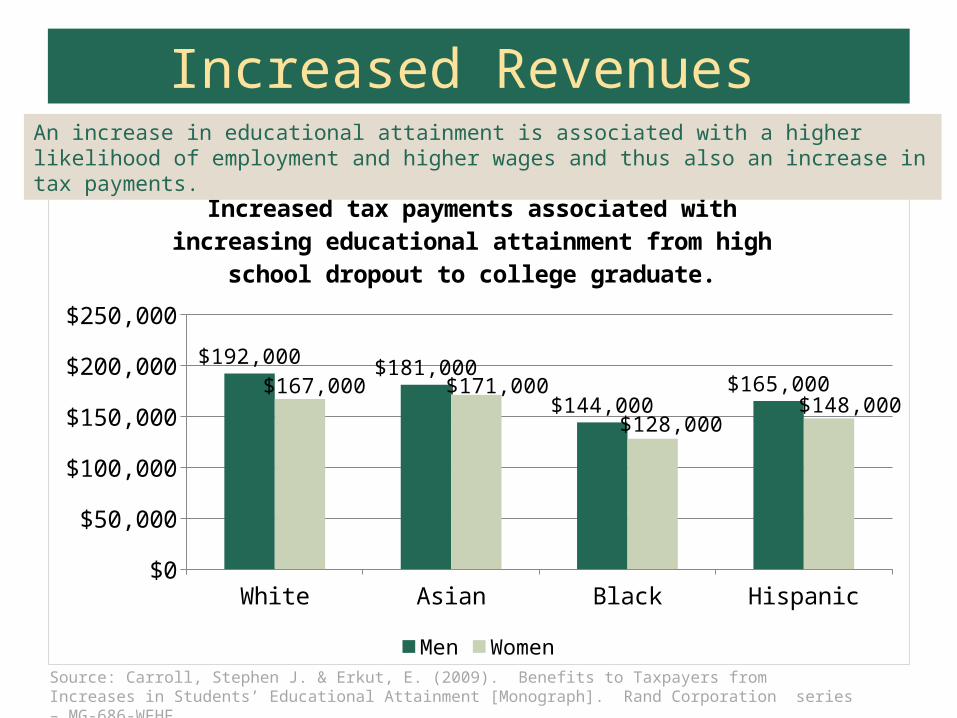
Increased Revenues
White Asian Black Hispanic$0
$50,000
$100,000
$150,000
$200,000
$250,000
$192,000$181,000
$144,000$165,000$167,000 $171,000
$128,000$148,000
Increased tax payments associated with increasing educational attainment from high school dropout to college graduate.
Men Women
An increase in educational attainment is associated with a higher likelihood of employment and higher wages and thus also an increase in tax payments.
Source: Carroll, Stephen J. & Erkut, E. (2009). Benefits to Taxpayers from Increases in Students’ Educational Attainment [Monograph]. Rand Corporation series – MG-686-WFHF.
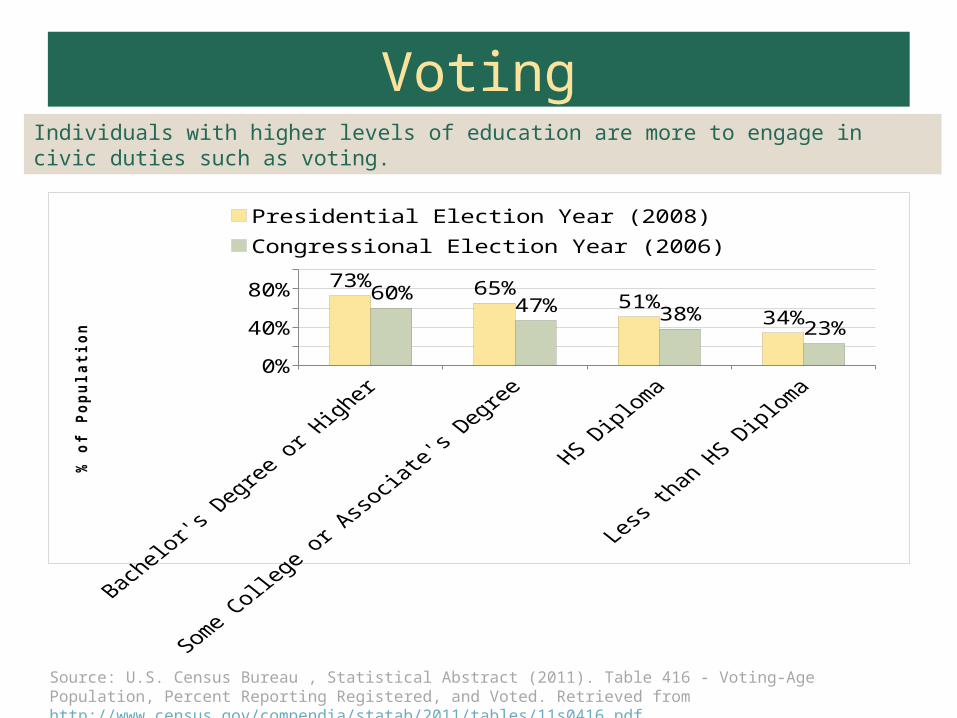
Voting
Bachelor's
Degree or H
igher
Some Colle
ge or A
ssocia
te's Degre
e
HS Diploma
Less
than
HS Diploma
0%20%40%60%80%
100%73% 65%
51%34%
60%47% 38%
23%
Presidential Election Year (2008) Congressional Election Year (2006)
% o
f Pop
ulati
on
Source: U.S. Census Bureau , Statistical Abstract (2011). Table 416 - Voting-Age Population, Percent Reporting Registered, and Voted. Retrieved from http://www.census.gov/compendia/statab/2011/tables/11s0416.pdf
Individuals with higher levels of education are more to engage in civic duties such as voting.
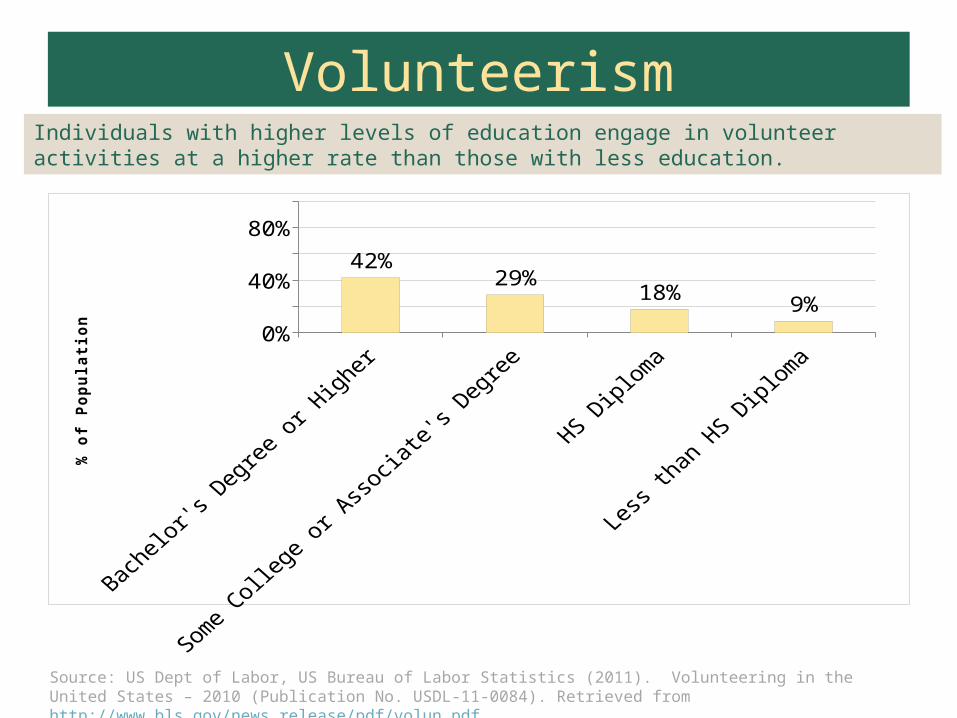
Volunteerism
Bachelor's
Degree or H
igher
Some Colle
ge or A
ssocia
te's Degre
e
HS Diploma
Less
than
HS Diploma
0%20%40%60%80%
100%
42%29%
18%9%
% o
f Pop
ulati
on
Source: US Dept of Labor, US Bureau of Labor Statistics (2011). Volunteering in the United States – 2010 (Publication No. USDL-11-0084). Retrieved from http://www.bls.gov/news.release/pdf/volun.pdf
Individuals with higher levels of education engage in volunteer activities at a higher rate than those with less education.
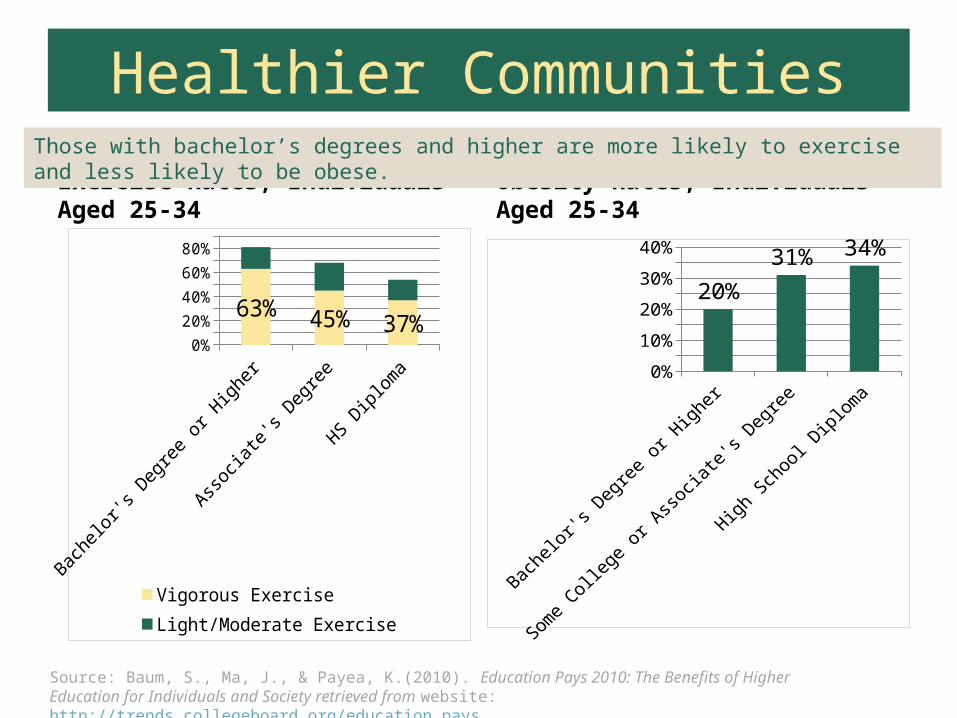
Healthier Communities
Exercise Rates, Individuals Aged 25-34
Bachelor's Degree or
Higher
Associate's Degree
HS Diploma0%
10%
20%
30%
40%
50%
60%
70%
80%
90%
63%45% 37%
Vigorous ExerciseLight/Moderate Exercise
Obesity Rates, Individuals Aged 25-34
Bachelor's
Degree or Higher
Some College or A
ssocia
te's Degree
High School D
iploma0%5%
10%15%20%25%30%35%40%
20%
31% 34%
Source: Baum, S., Ma, J., & Payea, K.(2010). Education Pays 2010: The Benefits of Higher Education for Individuals and Society retrieved from website: http://trends.collegeboard.org/education_pays
Those with bachelor’s degrees and higher are more likely to exercise and less likely to be obese.
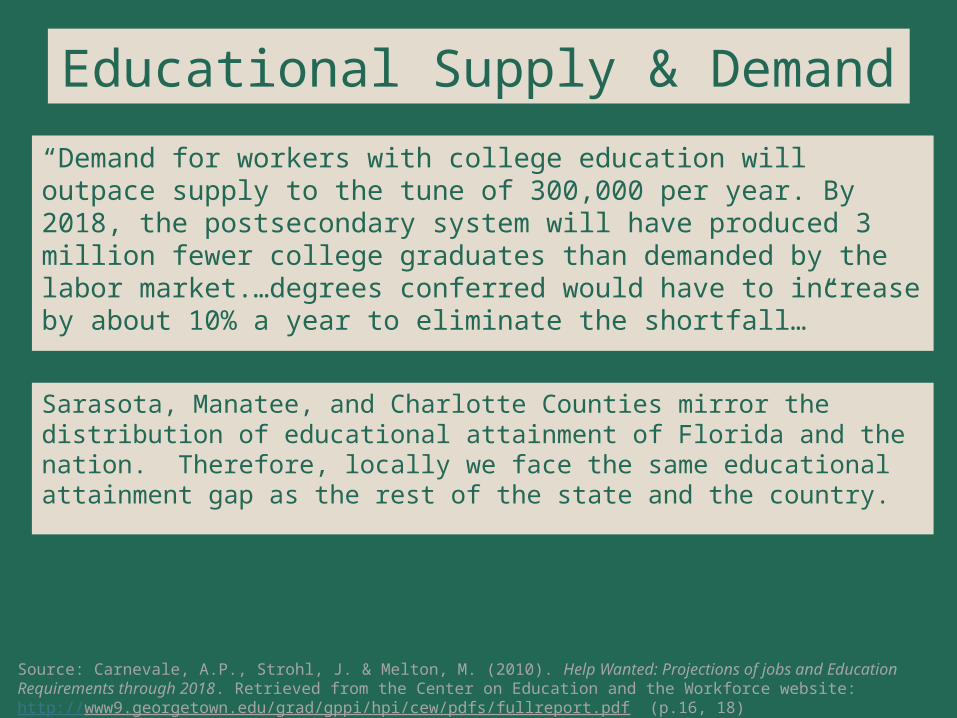
Educational Supply & Demand“Demand for workers with college education will outpace supply to the tune of 300,000 per year. By 2018, the postsecondary system will have produced 3 million fewer college graduates than demanded by the labor market.…degrees conferred would have to increase by about 10% a year to eliminate the shortfall…”
Source: Carnevale, A.P., Strohl, J. & Melton, M. (2010). Help Wanted: Projections of jobs and Education Requirements through 2018. Retrieved from the Center on Education and the Workforce website: http://www9.georgetown.edu/grad/gppi/hpi/cew/pdfs/fullreport.pdf (p.16, 18)
Sarasota, Manatee, and Charlotte Counties mirror the distribution of educational attainment of Florida and the nation. Therefore, locally we face the same educational attainment gap as the rest of the state and the country.
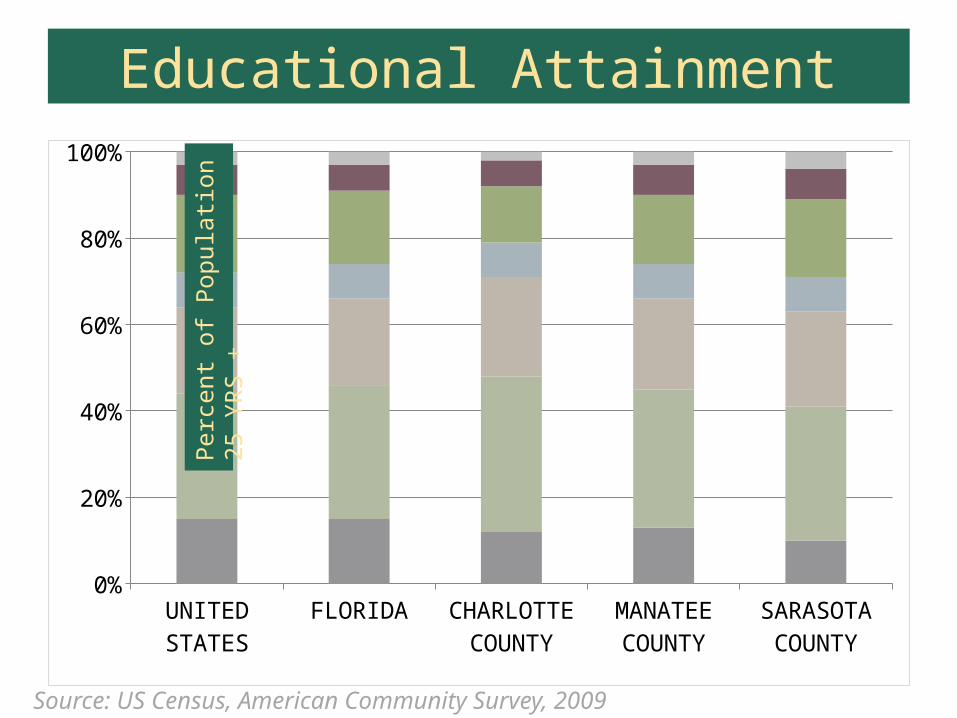
Educational Attainment
UNITED STATES FLORIDA CHARLOTTE COUNTY
MANATEE COUNTY
SARASOTA COUNTY
LESS THAN HS DIPLOMA
0.15 0.15 0.12 0.13 0.1
HS DIPLOMA 0.29 0.31 0.36 0.32 0.31
SOME COLLEGE, NO DEGREE
0.2 0.2 0.23 0.21 0.22
ASSOCIATE'S DEGREE
0.08 0.08 0.08 0.08 0.08
BACHELOR'S DEGREE
0.18 0.17 0.13 0.16 0.18
MASTER'S DE-GREE
0.07 0.06 0.06 0.07 0.07
PROF OR DOC-TORAL DEGREE
0.03 0.03 0.02 0.03 0.04
10%30%50%70%90%
Perc
ent o
f Pop
ulati
on 2
5 YR
S +
Source: US Census, American Community Survey, 2009
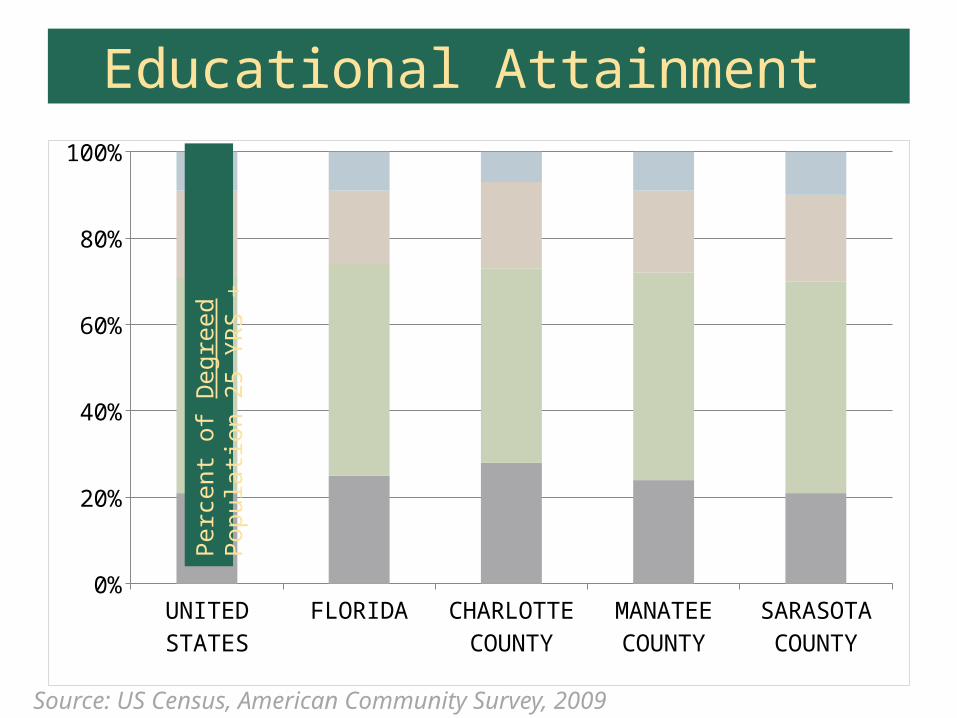
Educational Attainment
UNITED STATES FLORIDA CHARLOTTE COUNTY
MANATEE COUNTY
SARASOTA COUNTY
ASSOCIATE'S DEGREE
0.21 0.25 0.28 0.24 0.21
BACHELOR'S DEGREE
0.5 0.49 0.45 0.48 0.49
MASTER'S DE-GREE
0.2 0.17 0.2 0.19 0.2
PROF OR DOC-TORAL DEGREE
0.09 0.09 0.07 0.09 0.1
10%
30%
50%
70%
90%Pe
rcen
t of D
egre
ed P
opul
ation
25
YRS
+
Source: US Census, American Community Survey, 2009
ReferencesBaum, S., Ma, J., & Payea, K.(2010). Education Pays 2010: The Benefits of Higher Education for Individuals
and Society retrieved from website: http://trends.collegeboard.org/education_pays
Carnevale, A.P., Strohl, J. & Melton, M. (2010). Help Wanted: Projections of jobs and Education Requirements through 2018. Retrieved from the Center on Education and the Workforce website: http://www9.georgetown.edu/grad/gppi/hpi/cew/pdfs/fullreport.pdf
Carnevale, A.P., Strohl, J. & Melton, M. (2011). What’s it Worth? The Economic Value of College Majors.Retrieved from the Center on Education and the Workforce website:http://cew.georgetown.edu/whatsitworth/.
Carroll, Stephen J. & Erkut, E. (2009). Benefits to Taxpayers from Increases in Students’ EducationalAttainment [Monograph]. Rand Corporation series – MG-686-WFHF.
The Florida College System (2011). Benefits of Education (Edition 2011-02). Retrieved from http://www.fldoe.org/cc/OSAS/Evaluations/pdf/Zoom2011-02.pdf.
References
U.S. Census Bureau, 2005-2009 American Community Survey 5-Yr Estimates (2009). Retrieved from http://factfinder.census.gov/servlet/DatasetMainPageServlet?_program=ACS&_submenuId=&_lang en&_ds_name=ACS_2009_5YR_G00_&ts=
U.S. Census Bureau , Statistical Abstract (2011). Table 416 - Voting-Age Population, Percent ReportingRegistered, and Voted. Retrieved from http
://www.census.gov/compendia/statab/2011/tables/11s0416.pdf
U.S. Department of Labor, Bureau of Labor Statistics. (2010). Current PopulationSurvey, Earnings by education. Retrieved from http://www.bls.gov/webapps/legacy/cpswktab5.htm.
U.S. Department of Labor, Bureau of Labor Statistics. (2010). Current PopulationSurvey, Unemployment. Retrieved from http://www.bls.gov/cps/tables.htm#charemp.
US Dept of Labor, US Bureau of Labor Statistics (2011). Volunteering in the United States – 2010 (Publication No. USDL-11-0084). Retrieved from http://www.bls.gov/news.release/pdf/volun.pdf