Embed Size (px)
Citation preview

PRODUCTIVITY IMPROVEMENT OF GROVER
INDUSTRIES SUBMITTED BY :-
INDERPREET SINGH BEDIJAGMEET SINGH BAJAJ
JASHANDEEP SIINGH DHILLONKRITI SHARMA

PROBLEMS FACED AND PROJECT GOALS
Grover Industries is a small scale gear manufacturing company. The company has as an inefficient production system which leads to
bottlenecks, rework and scrap and hence leads to lower productivity.
Goal :- The project aims at increasing the productivity of the manufacturing process by using the various operational methodology and techniques.

OBJECTIVES
New effective production layout which would streamline the manufacturing process.
Reduce the Non-Value added activities.

MACHINERY AVAILABLE
Four CNC machines for turning and facing operations
Four Lathe machines for turning
Four Milling (Horizontal) machines for teeth cutting
Four Gear Hobbing machines for special teeth cutting (for cutting
splines and cutting sprockets )

GEAR MANUFACTURNG PROCESS
SHAFT CUTTIN
GTURNIN
GMILLIN
GGEAR
HOBBING
WELDINGHEAT
TREATMENT
FINISHINGPACKAGIN
G & SHIPPING

PRODUCT DESCRIPTIONThe company manufactures six types of products

PRODUCT CATEGORIZATIONThe products were categorized into 3 different part families
Product 1
Product 2
Product 4A
Product 3A
Product 5A
Product 4B
Product 3B
Product 6
Product 5B

OLD LAYOUT

PRODUCTIVITY IMPROVEMENT
LAYOUT DESIGN WORK REDISTRIBUTION THROUGH WORK METHOD AND TIME
STUDY BY DECREASING NON- VALUE ADDED ACTIVITIES BY APPLYING GENERAL OPERATIONAL MANAGEMENT TECHNIQUES

NEW LAYOUTBy using the principle of Group Technology and Cellular Manufacturing, the manufacturing process was streamlined and was divided into three cells for three part families.
CELL-1
CELL-2
CELL-3

NEW LAYOUT - DIFFERENTIATION

DIFFERENTIATING BETWEEN VALUE ADDED, SEMI-VALUE ADDED & NON-VALUE ADDED ACTIVITES
VALUE ADDED ACTIVITIES
SEMI-VALUE ADDED ACTIVITIES
NON-VALUE ADDED ACTIVITIES

TIME STUDY

LOAD CHART There were 17 stations before and the breakdown of the VA,SVA
and NVA is shown below :-
Lathe 1
Lathe
2
Lathe 3
Lathe 4
Shaft
cuttin
g 1
Shaft
cuttin
g 2
Shaft
cuttin
g 3
Gear Hob
bing 1
Gear Hob
bing 2
Gear Hob
bing 3
Gear Hob
bing 4
Miliing 1
Miliing 2
Miliing 3
Miliing 4
CNC 1
CNC 2
CNC 3
CNC 4
0102030405060708090
100
LOAD CHART _BEFORE
60%16%
24%
Va,sva,nva1 2 3

LOAD CHART
Shaft cutting 1
Lathe 1 Lathe 2 CNC 1 CNC 2 Miliing 1 Miliing 2 Gear Hobbing
1
Gear Hobbing
2
0102030405060708090
100
Cell 1
VA SVA NVA
Shaft cutting 2 Lathe 3 CNC 3 Miliing 3 Gear Hobbing 30
102030405060708090
100
Cell 2
VA SVA NVA
Shaft cutting 3
Lathe 4 CNC 4 Miliing 4 Gear Hobbing
4
0102030405060708090
100
Cell 3
VA SVA NVA
62%16%
22%
VA,SVA,NVA
VA SVA NVA
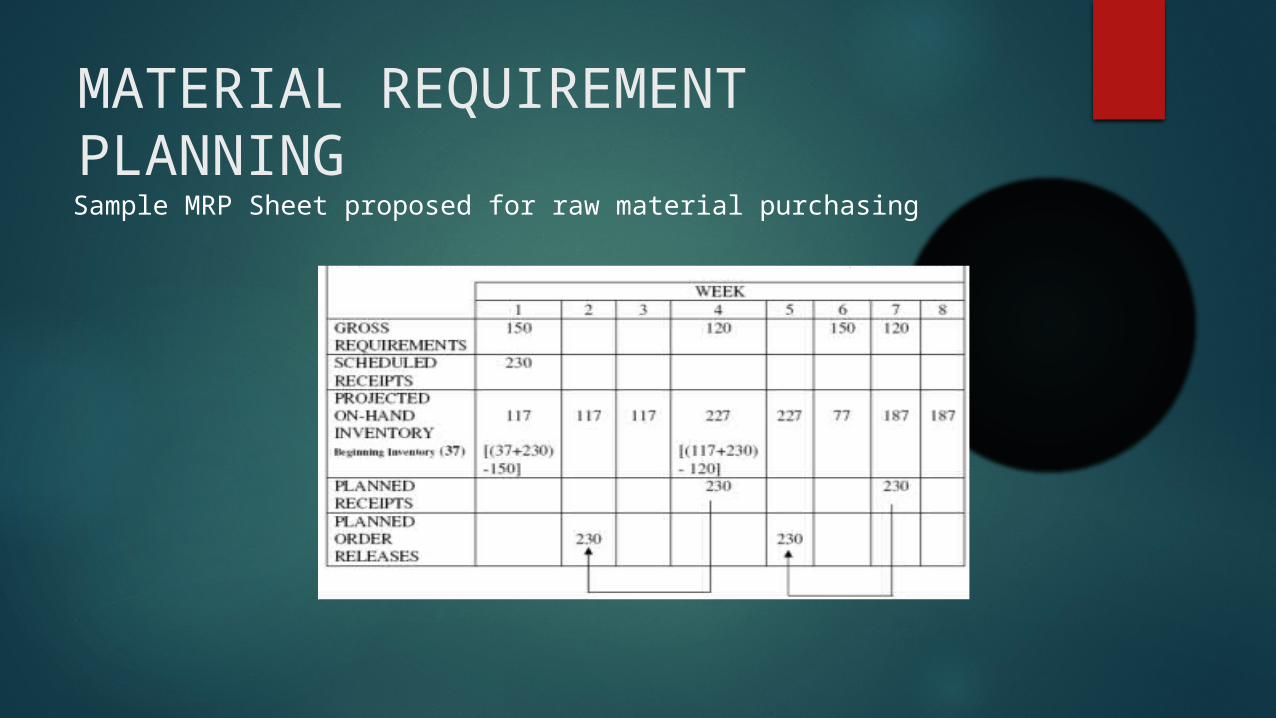
MATERIAL REQUIREMENT PLANNING
Sample MRP Sheet proposed for raw material purchasing

THANK YOU