Embed Size (px)
Citation preview

Buy here: http://homework.plus/p-8-6-dorex-inc-presented-the-following-comparative-income-statements-for-2011-2010-and-2009/ Complete the homework assignment using the Excel. Ensure your work is organized, properly labeled, and highlight your final answer. Written responses must adhere to APA format. Included attachment of questions in case they do not come out properly.
P 8-6 Dorex, Inc., presented the following comparative income statements for 2011, 2010, and
2009:
For the Years
Ended
2011 2010 2009
Net sales $1,600,000 $1,300,00
0
$1,200,00
0

Other income 22,100 21,500 21,000
1,622,100 1,321,500 1,221,000
Costs and expenses:
Material and manufacturing costs of
products sold
740,000 624,000 576,000
Research and development 90,000 78,000 71,400
General and selling 600,000 500,500 465,000
Interest 19,000 18,200 17,040
Other 14,000 13,650 13,800
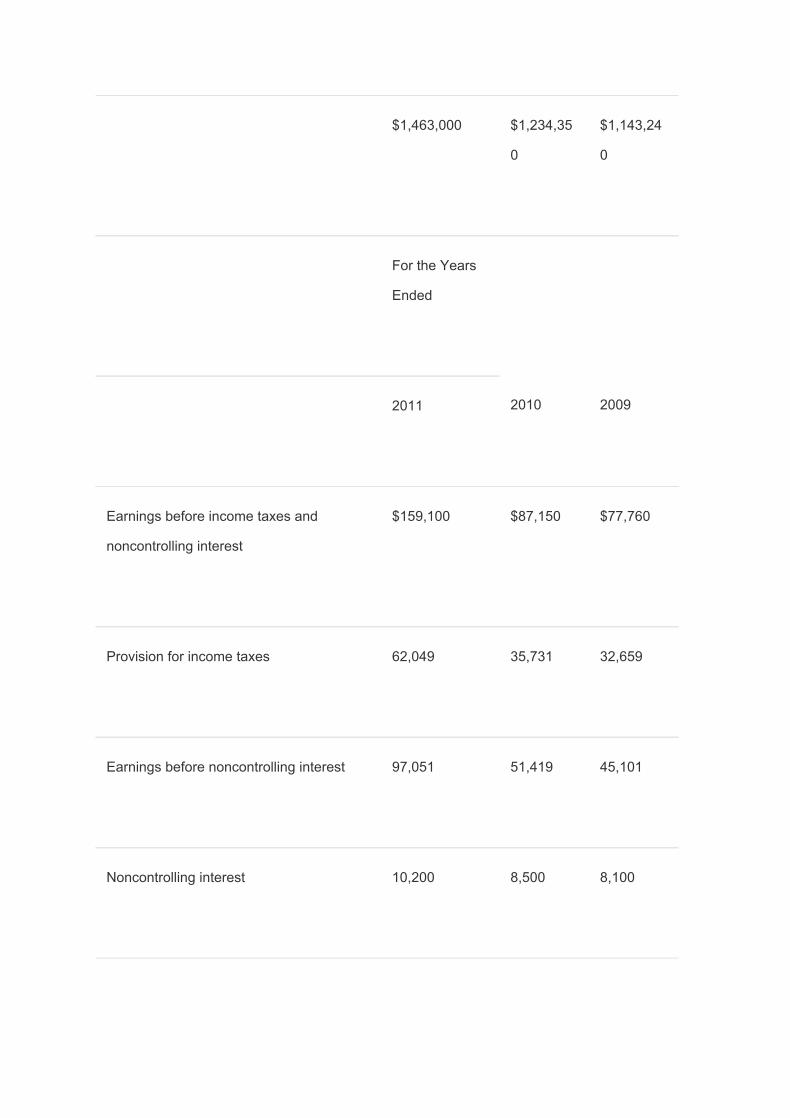
$1,463,000 $1,234,35
0
$1,143,24
0
For the Years
Ended
2011 2010 2009
Earnings before income taxes and
noncontrolling interest
$159,100 $87,150 $77,760
Provision for income taxes 62,049 35,731 32,659
Earnings before noncontrolling interest 97,051 51,419 45,101
Noncontrolling interest 10,200 8,500 8,100

Net earnings 86,851 42,919 37,001
Other relevant financial information:
Average common shares issued 29,610 29,100 28,800
Average long-term debt $ 211,100 $ 121,800 $ 214,000
Average stockholders' equity (all common) 811,200 790,100 770,000
Average total assets 1,440,600 1,220,000 1,180,000
Average operating assets 1,390,200 1,160,000 1,090,000
Required
a. Calculate the following for 2011, 2010, and 2009:

1. Net profit margin
2. Return on assets
3. Total asset turnover
4. DuPont analysis
5. Operating income margin
6. Return on operating assets
7. Operating asset turnover
8. DuPont analysis with operating ratios
9. Return on investment
10. Return on total equity
b. Based on the previous computations, summarize the trend in profitability for this firm.
● P 8-11 Transactions affect various financial statement amounts.
Total
Retained
Stockholders'

Net
Profit
Earnings
Equit
y
a. A stock dividend is declared and paid. _____ _____ ____
_
b. Merchandise is purchased on credit. _____ _____ ____
_
c. Marketable securities are sold above cost. _____ _____ ____
_
d. Accounts receivable are collected. _____ _____ ____
_
e. A cash dividend is declared and paid. _____ _____ ____
_

f. Treasury stock is purchased and recorded
at cost.
_____ _____ ____
_
g. Treasury stock is sold above cost. _____ _____ ____
_
h. Common stock is sold. _____ _____ ____
_
i. A fixed asset is sold for less than book
value.
_____ _____ ____
_
j. Bonds are converted into common stock. _____ _____ ____
_
● Required Indicate the effects of the previous transactions on each of the following: net profit, retained earnings, total stockholders' equity. Use + to indicate an increase, − to indicate a decrease, and 0 to indicate no effect.
P 9-2 A firm has earnings before interest and tax of $1,000,000, interest of $200,000, and net
income of $400,000 in Year 1.

Required
a. Calculate the degree of financial leverage in base Year 1.
b. If earnings before interest and tax increase by 10% in Year 2, what will be the new
level of earnings, assuming the same tax rate as in Year 1?
c. If earnings before interest and tax decrease to $800,000 in Year 2, what will be the
new level of earnings, assuming the same tax rate as in Year 1?
P 9-10 Smith and Jones, Inc. is primarily engaged in the worldwide production, processing,
distribution, and marketing of food products. The following information is from its 2011 annual
report:
2011 2010
Earnings per share $ 1.08 $ 1.14
Cash dividends per common
share
$ 0.80 $ 0.76
Market price per common share $ 12.94 $ 15.19

Common shares outstanding 25,380,000 25,316,000
Total assets $1,264,086,00
0
$1,173,924,00
0
Total liabilities $ 823,758,000 $ 742,499,000
Nonredeemable preferred stock $ 16,600,000 $ 16,600,000
Preferred dividends $ 4,567,000 $ 930,000
Net income $ 32,094,000 $ 31,049,000
Required
a. Based on these data, compute the following for 2011 and 2010:
1. Percentage of earnings retained
2. Price/earnings ratio
3. Dividend payout
4. Dividend yield
5. Book value per share
b. Discuss your findings from the viewpoint of a potential investor.