Embed Size (px)
Citation preview

OADA Web PresentationEconomic and Auto Outlook 2009
Presented by Carlos Gomes
Senior Economist, Scotiabank
Sponsored by LeaseBusters

Canada’s Lease-Take-Over Pioneers
Canada’s # 1 Lease-Take-Over
marketplace

Have you ever ‘walked’ a customer who wanted to buy a new vehicle but
was stuck in a lease?
Is your competition selling cars to these customers? How are they making deals when your sales staff felt that they were ‘too upside-down’?

Leasebusters.com gets300,000 visitors to our websiteevery month who are looking
for these types of leases!!!
These are YOUR customers. Please; don’t give them up to anyone!!!

We have customers looking for short term leases. You have customers who would
make a new car deal if you could get them out of their lease!
Working together by transferringleases will ‘shorten the trade cycle’and help you sell more new vehicles!!!

Leasebusters dealer programs allow you have complete control of the lease transfer process GUARANTEEING that
you will sell YOUR customer their next vehicle!!!!!

Here’s just a sampling of the successful Online-Dealers working with Leasebusters.com
•Ready Honda, Mississauga, ON•Oakridge Ford, London, ON•Ontario Chrysler, Mississauga, ON•Toronto Honda, Toronto, ON•Avante Mazda, Richmond Hill, ON•Ken Shaw Lexus Toyota, Toronto, ON•Mississauga Honda, Mississauga, ON•Camco Acura, Ottawa, ON•ToyotaTown/Lexus of London, London, ON•Town & Country BMW, Thornhill, ON•Roy Foss Chevrolet, Woodbridge, ON•Lally Ford, Tilbury, ON•Acura West, London, ON•Myers Cadillac Chevrolet, Ottawa, ON•Mazda of Toronto, Toronto, ON•Sherway Nissan, Toronto, ON•Gus Brown Pontiac Buick, Whitby, ON
Plus hundreds of other Gold and Silver Online-dealers across Canada

Find out how YOU can join these Online-dealers who sell more new and used vehicles and participate in our lead generation program!!!
Call 1-888-357-2678…TODAY and ask about our OADA approved dealer programs!

Carlos GomesSenior EconomistIndustry ResearchThe Scotiabank Group, Toronto
Presentation toPresentation to::
Ontario Automobile Ontario Automobile Dealers AssociationDealers Association
Toronto, OntarioToronto, Ontario
April 7, 2009April 7, 2009
Economic & Auto Industry Economic & Auto Industry Outlook: 2009Outlook: 2009Searching for a Bottom

Global Economic Growth United States & Western Europe
-3
-2
-1
0
1
2
3
4
5
6
7
8
9
97 98 99 00 01 02 03 04 05 06 07 08 09
-3
-2
-1
0
1
2
3
4
5
6
7
8
9yr/yr % change
0
1
2
3
4
5
6
7
8
9
97 98 99 00 01 02 03 04 05 06 07 08 09
0
1
2
3
4
5
6
7
8
9yr/yr % change
Global Growth
Global Growth Moderates
U.S. Real GDP
Euro-zone Real GDP
Emerging Markets

Gradual Improvement in Assemblies to Begin by Spring
New Domestics to Surpass Detroit Three Output in Early 2009
4
5
6
7
8
9
10
2007 2008 2009
4
5
6
7
8
9
10
8
9
10
11
12
13
14
15
16
17
2007 2008 2009
60
70
80
90
100millions of units
North American Vehicle Production
Sharp Inventory Adjustment
New Domestics
Detroit Three
U.S. Dealer Inventories
days’ supply millions of units
forecast
North American Vehicle Production

4.0
4.5
5.0
5.5
6.0
6.5
7.0
7.5
2007 2008 2009
0.30
0.35
0.40
0.45
0.50
0.55
0.60
Boom, Bust, and Early Stabilization
0
3000
6000
9000
12000
2007 2008 2009
0.90
0.92
0.94
0.96
0.98
1.00
U.S. Home Sales (LHS)
index
Coincidence to Lagging Ratio
(RHS)
ISM (RHS)
indexmillions of units
Baltic Dry Index (LHS)
U.S. Housing & Manufacturing Key Leading Indicators
index

Canadian Economy Slows…
-16
-12
-8
-4
0
4
8
12
16
98 99 00 01 02 03 04 05 06 07 08 09
-6
-4
-2
0
2
4
6yr/yr % change
Manufacturing – Canada (LHS)
Services – Canada (RHS)
Manufacturing Leads Slowdown
yr/yr % change
Employment – Canada (RHS)
5.0
5.5
6.0
6.5
7.0
7.5
8.0
8.5
9.0
00 01 02 03 04 05 06 07 08 09
5.0
5.5
6.0
6.5
7.0
7.5
8.0
8.5
9.0
… … Lifting Unemployment Unemployment
%
Unemployment Rate – Ontario
Unemployment Rate – Canada

-20
-15
-10
-5
0
5
10
15
20
88 90 92 94 96 98 00 02 04 06 08
90
100
110
120
130
140
150
160
170
180
U.S. Affordability Remains Strained
yr/yr % change
U.S. Housing U.S. Housing Affordability IndexAffordability Index
U.S. Median U.S. Median House PricesHouse Prices
U.S. House Prices Decline Spreads
index
International House Prices
-20
-15
-10
-5
0
5
10
15
20
25
04 05 06 07 08 09
-20
-15
-10
-5
0
5
10
15
20
25
U.K. House U.K. House PricesPrices
Canada – Canada – MLS PricesMLS Prices
yr/yr % change
Ontario –Ontario –MLS PricesMLS Prices

U.S. Housing Recession
0.3
0.5
0.7
0.9
1.1
1.3
1.5
00 01 02 03 04 05 06 07 08 09
4.0
4.5
5.0
5.5
6.0
6.5
7.0
7.5
Plunging U.S. Home Sales …
mn units
New Home Sales
Existing Home Sales
mn units
3
4
5
6
7
8
9
10
11
00 01 02 03 04 05 06 07 08 09
months’ supply
Existing Home Sales
… And Soaring Inventories
New Home Sales
Balanced Market

Low Rates For a Long Time
-2
-1
0
1
2
3
4
5
6
02 03 04 05 06 07 08 09 10
Canada 10-yr Gov’t. Bond
U.S. 10-yr T-Bond
% forecast
Canada-U.S. Bond Spread
-2
-1
0
1
2
3
4
5
6
02 03 04 05 06 07 08 09 10
Canada
U.S.
Canada-U.S. Central Bank Spread
% forecast
Source: Bank of Canada; Federal Reserve; Global Insight; Scotia Economics
Central Bank Rates Canadian & U.S. Bond Yields
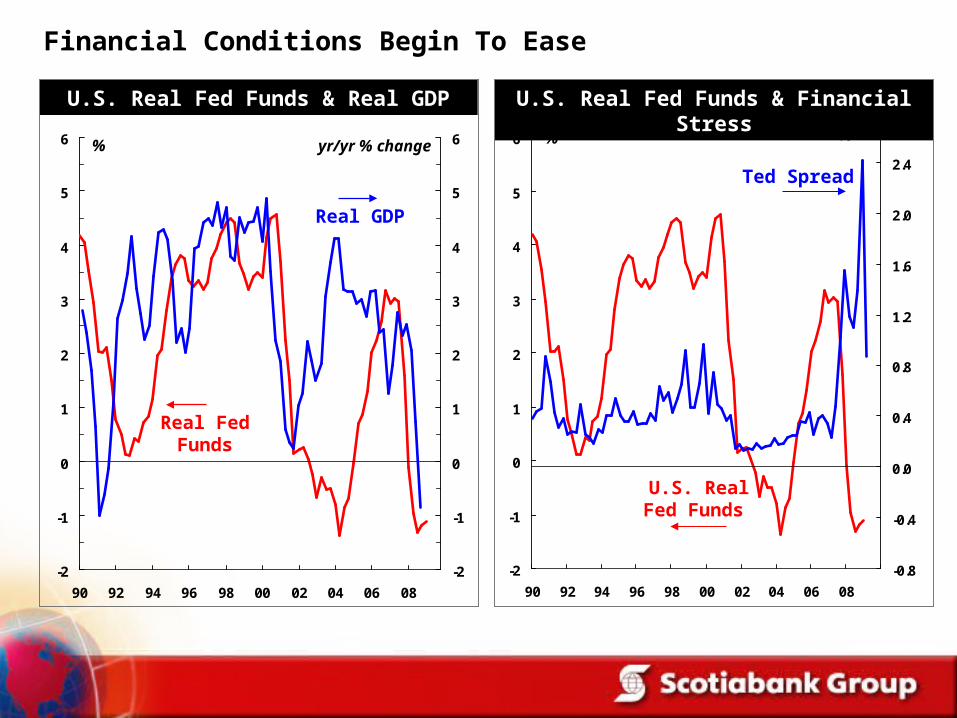
U.S. Real Fed Funds & Financial Stress
-2
-1
0
1
2
3
4
5
6
90 92 94 96 98 00 02 04 06 08
-0.8
-0.4
0.0
0.4
0.8
1.2
1.6
2.0
2.4
%
Ted Spread
U.S. Real Fed Funds
Financial Conditions Begin To Ease
-2
-1
0
1
2
3
4
5
6
90 92 94 96 98 00 02 04 06 08
-2
-1
0
1
2
3
4
5
6
U.S. Real Fed Funds & Real GDP
yr/yr % change
Real GDP
Real Fed Funds
%%

Financial Stress/Event Risk In Financial Markets
-4
-2
0
2
4
6
8
10
12
14
69 71 73 75 77 79 81 83 85 87 89 91 93 95 97 99 01 03 05 07 09
0.0
0.5
1.0
1.5
2.0
2.5
3.0
3.5
4.0
Franklin National
First Penn
Drysdale Securities/Mexican Default
Continental Illinois
Black Monday
S&L Crisis
Peso Crisis
Asian Currency
Crisis
LTCM/Russia Default
NASDAQ Bubble
Subprime Meltdown
Penn Central
Ted Spread%
Gulf War
Y2K
Silver Bubble
Latin American Debt Crisis
Ted Spread is a three month LIBOR minus three month T-bills
Lehman Bros

0
1
2
3
4
5
2007 2008 2009
400
600
800
1000
1200
1400
1600
Boom, Bust, and Stabilization
400
800
1200
1600
2007 2008 2009
4000
8000
12000
16000S&P 500 (LHS)
S&P/TSX (RHS)
TED Spread (LHS)
Emerging Markets (LHS)
index
Emerging Markets (RHS)
Stocks Stress
index index%

Fiscal Stimulus To The Rescue
0 2 4 6 8
France
U.K.
Japan
Germany
Canada
U.S.
China
Coordinated Fiscal Stimulus
% of GDP
Source: OECD, IMF, BNS.
China NA NA NA
United States 21 37 42
Canada 12 41 47
Germany 0 46 54
Japan 4 73 24
United Kingdom 15 93 -8
France 0 75 25
Timing of Package
201020092008

40
45
50
55
60
65
70
75
90 92 94 96 98 00 02 04 06 08
Canadian Households in Better Shape
Canada
U.S.
% of household real estate
16
18
20
22
24
26
90 92 94 96 98 00 02 04 06 08
Canada
U.S.
Household Debt
% of household assets
Household Equity

6
8
10
12
14
16
18
20
78 80 82 84 86 88 90 92 94 96 98 00 02 04 06 08 100.4
0.6
0.8
1.0
1.2
1.4
1.6
1.8
2.0
United States
millions of units
Auto SalesAuto Sales
Housing StartsHousing Starts
Auto & Housing Cycles
millions of units
0.7
0.9
1.1
1.3
1.5
1.7
1.9
2.1
78 80 82 84 86 88 90 92 94 96 98 00 02 04 06 08 10100
150
200
250
300
Canada
thousands of units
Auto SalesAuto Sales
Housing StartsHousing Starts
thousands of units
forecast
forecast

25
30
35
40
45
50
55
60
65
70
00 01 02 03 04 05 06 07 08 091.4
1.5
1.6
1.7
1.8
Buying Plans & Vehicle Sales
%
-2
-1
0
1
2
3
4
5
00 01 02 03 04 05 06 07 08 091.4
1.5
1.6
1.7
1.8yr/yr % change
Employment & Vehicle Sales
Canadian Vehicle Sales
Employment
millions of units millions of units
Canadian Vehicle Sales
Households Planning a Major Purchase
Employment Growth & Confidence Drive Vehicle Sales

New Car Prices Decline
U.S. New Car Prices & Employment
-3
-2
-1
0
1
2
3
4
5
6
97 98 99 00 01 02 03 04 05 06 07 08 09
-3
-2
-1
0
1
2
3
4
5
6yr/yr% change
U.S. Car Prices
U.S. Private Sector
Employment
29.0
30.0
31.0
32.0
33.0
05 06 07 08 090.7
0.8
0.8
0.9
0.9
1.0
1.0
1.1
Canadian Dollar & New Vehicle Prices
000’s of U.S. dollars
Canadian DollarCanadian Dollar
Vehicle PricesVehicle Prices
CAD/USD
08070605 09

Used Vehicle Imports Moderate, Supporting Prices
Vehicle Imports Surge as C$ Strengthens Used Car Prices are Under Pressure
-12
-10
-8
-6
-4
-2
0
2
4
6
8
00 01 02 03 04 05 06 07 08 09
-12
-10
-8
-6
-4
-2
0
2
4
6
8yr/yr% change
0
40
80
120
160
200
240
280
00 01 02 03 04 05 06 07 08 09
60
65
70
75
80
85
90
95
100thousands of units
Vehicle Imports
Scotiabank Used Car
Price Index – One-Year
Old Models
Canadian Dollar
US cents Manheim Used Vehicle Index – United States

30
35
40
45
97 98 99 00 01 02 03 04 05 06 07 08
30
35
40
45
Canada’s Vehicle Fleet…
per cent of total fleet
Vehicles 4 Years Vehicles 4 Years or Lessor Less
Vehicles 9 Years Vehicles 9 Years or Olderor Older
Source: R.L. Polk & Co and Desrosiers Automotive Consultants
Canada Vehicle Fleet
30
35
40
45
97 98 99 00 01 02 03 04 05 06 07 08
30
35
40
45
Ontario’s Vehicle FleetOntario’s Vehicle Fleet
% of total fleet
Vehicles 4 Years Vehicles 4 Years or Lessor Less
Vehicles 9 Years Vehicles 9 Years or Olderor Older

Ontario Vehicle Fleet
Ontario’s Aging Fleet … ... Has Many Vehicles At Least 11 Years Old
1.2
1.3
1.4
1.5
1.6
1.7
1.8
1.9
2.0
97 98 99 00 01 02 03 04 05 06 07 08
1.2
1.3
1.4
1.5
1.6
1.7
1.8
1.9
2.0
Vehicles 11 Years Vehicles 11 Years or Olderor Older
millions of units
1.8
2.0
2.2
2.4
2.6
2.8
3.0
97 98 99 00 01 02 03 04 05 06 07 08
1.8
2.0
2.2
2.4
2.6
2.8
3.0
Vehicles 9 Years Vehicles 9 Years or Olderor Older
Vehicles 4 Vehicles 4 Years or LessYears or Less
millions of units
Source: R.L. Polk & Co and Desrosiers Automotive Consultants

200
300
400
500
600
00 01 02 03 04 05 06 07 08 09
200
300
400
500
600
Small Cars Dominate The Canadian Markets …
thousands of units
Medium CarsMedium Cars
Small CarsSmall Cars
… But Crossover Utility Vehicles Are Growing Rapidly
50
100
150
200
250
300
350
00 01 02 03 04 05 06 07 08 09
50
100
150
200
250
300
350thousands of units
CUVsCUVs
SUVsSUVs
New Vehicle Market -- Canada
Pickup Pickup TrucksTrucks

Ontario Automobile Sales
300
400
500
600
700
1980 1985 1990 1995 2000 2005
300
400
500
600
700thousands of units
Ontario Vehicle Sales – An Historical Perspective
forecast

This Report is prepared by Scotia Economics as a resource
for the clients of Scotiabank and Scotia Capital. While the
information is from sources believed reliable, neither the
information nor the forecast shall be taken as a
representation for which The Bank of Nova Scotia or Scotia
Capital Inc. or any of their employees incur responsibility.

Carlos GomesSenior EconomistIndustry ResearchThe Scotiabank Group, Toronto
Presentation toPresentation to::
Ontario Automobile Ontario Automobile Dealers AssociationDealers Association
Toronto, OntarioToronto, Ontario
April 7, 2009April 7, 2009
Economic & Auto Industry Economic & Auto Industry Outlook: 2009Outlook: 2009Searching for a Bottom