Embed Size (px)
Citation preview
SANDEEP KARGlobal Director,
Automotive & Transportation Research
Global Medium-Heavy Duty Truck Market:
Vision 2022

Vision 2022: Big Picture
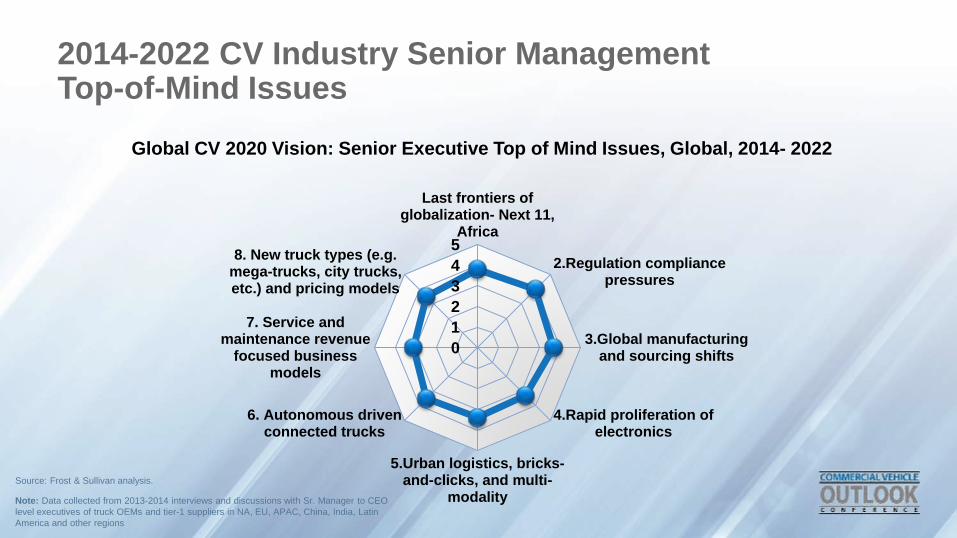
2014-2022 CV Industry Senior Management Top-of-Mind Issues
0
1
2
3
4
5
Last frontiers ofglobalization- Next 11,
Africa
2.Regulation compliancepressures
3.Global manufacturingand sourcing shifts
4.Rapid proliferation ofelectronics
5.Urban logistics, bricks-and-clicks, and multi-
modality
6. Autonomous drivenconnected trucks
7. Service andmaintenance revenue
focused businessmodels
8. New truck types (e.g.mega-trucks, city trucks,etc.) and pricing models
Global CV 2020 Vision: Senior Executive Top of Mind Issues, Global, 2014- 2022
Note: Data collected from 2013-2014 interviews and discussions with Sr. Manager to CEO
level executives of truck OEMs and tier-1 suppliers in NA, EU, APAC, China, India, Latin
America and other regions
Source: Frost & Sullivan analysis.
50
100
150
200
250
300
350
55.0
65.0
75.0
85.0
95.0
105.0
19
98
19
99
20
00
20
01
20
02
20
03
20
04
20
05
20
06
20
07
20
08
20
09
20
10
20
11
20
12
20
13
20
14
20
15
20
16
US Annual Industrial Production Index US Class 8 Actual Units Sold Used Class 8 Estimated Units Sold
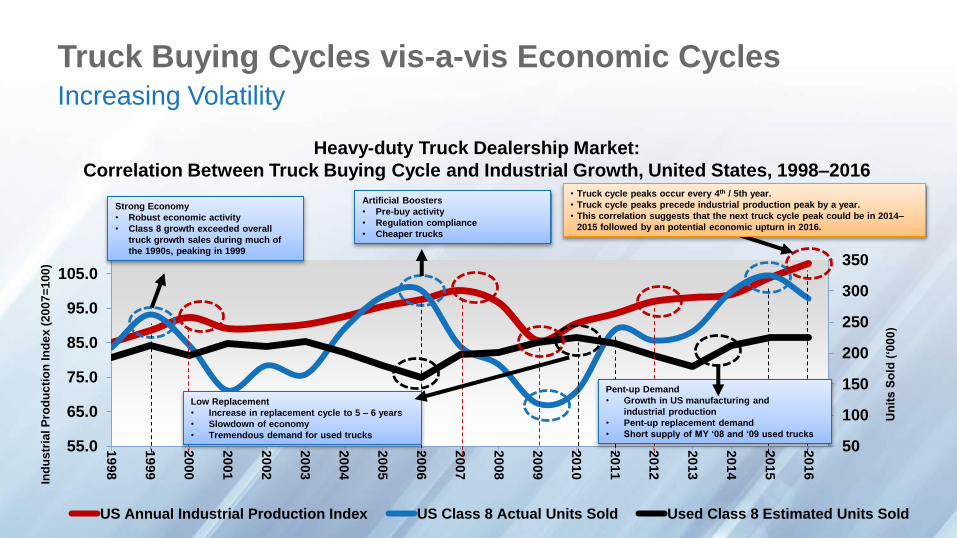
Truck Buying Cycles vis-a-vis Economic CyclesIncreasing Volatility
Heavy-duty Truck Dealership Market:
Correlation Between Truck Buying Cycle and Industrial Growth, United States, 1998–2016
Ind
us
tria
l P
rod
uc
tio
n In
de
x (
20
07
=1
00
)
Un
its
So
ld (
‘00
0)
Low Replacement
• Increase in replacement cycle to 5 – 6 years
• Slowdown of economy
• Tremendous demand for used trucks
Artificial Boosters
• Pre-buy activity
• Regulation compliance
• Cheaper trucks
Strong Economy
• Robust economic activity
• Class 8 growth exceeded overall
truck growth sales during much of
the 1990s, peaking in 1999
Pent-up Demand
• Growth in US manufacturing and
industrial production
• Pent-up replacement demand
• Short supply of MY ‘08 and ‘09 used trucks
• Truck cycle peaks occur every 4th / 5th year.
• Truck cycle peaks precede industrial production peak by a year.
• This correlation suggests that the next truck cycle peak could be in 2014–
2015 followed by an potential economic upturn in 2016.
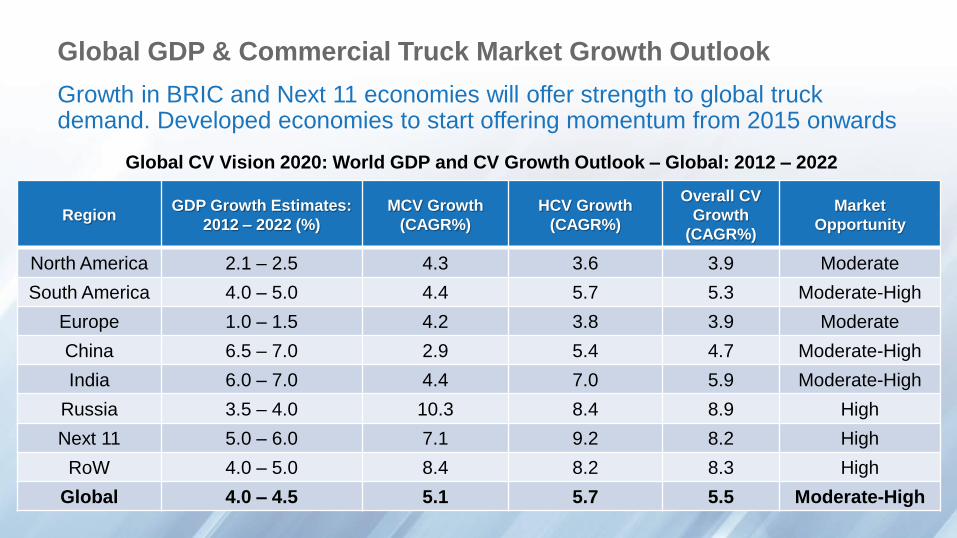
Global GDP & Commercial Truck Market Growth Outlook
Growth in BRIC and Next 11 economies will offer strength to global truck demand. Developed economies to start offering momentum from 2015 onwards
Global CV Vision 2020: World GDP and CV Growth Outlook – Global: 2012 – 2022
RegionGDP Growth Estimates:
2012 – 2022 (%)
MCV Growth
(CAGR%)
HCV Growth
(CAGR%)
Overall CV
Growth
(CAGR%)
Market
Opportunity
North America 2.1 – 2.5 4.3 3.6 3.9 Moderate
South America 4.0 – 5.0 4.4 5.7 5.3 Moderate-High
Europe 1.0 – 1.5 4.2 3.8 3.9 Moderate
China 6.5 – 7.0 2.9 5.4 4.7 Moderate-High
India 6.0 – 7.0 4.4 7.0 5.9 Moderate-High
Russia 3.5 – 4.0 10.3 8.4 8.9 High
Next 11 5.0 – 6.0 7.1 9.2 8.2 High
RoW 4.0 – 5.0 8.4 8.2 8.3 High
Global 4.0 – 4.5 5.1 5.7 5.5 Moderate-High
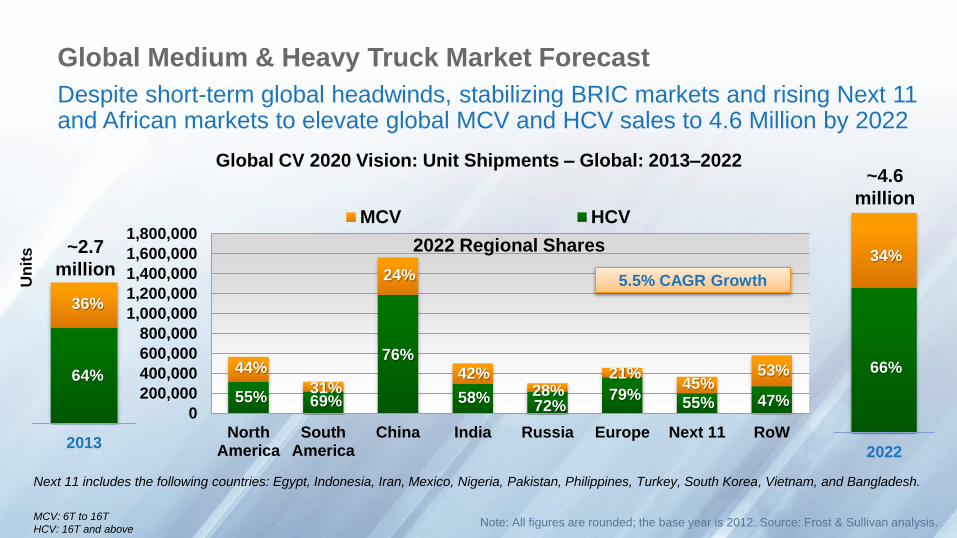
Global Medium & Heavy Truck Market Forecast
Despite short-term global headwinds, stabilizing BRIC markets and rising Next 11 and African markets to elevate global MCV and HCV sales to 4.6 Million by 2022
Global CV 2020 Vision: Unit Shipments – Global: 2013–2022
Note: All figures are rounded; the base year is 2012. Source: Frost & Sullivan analysis.
Next 11 includes the following countries: Egypt, Indonesia, Iran, Mexico, Nigeria, Pakistan, Philippines, Turkey, South Korea, Vietnam, and Bangladesh.
MCV: 6T to 16T
HCV: 16T and above
0
200,000
400,000
600,000
800,000
1,000,000
1,200,000
1,400,000
1,600,000
1,800,000
NorthAmerica
SouthAmerica
China India Russia Europe Next 11 RoW
MCV HCV
20132022
2022 Regional Shares~2.7
million
~4.6
million
34%
36%
64%66%
Un
its
44%
31%
24%
42% 21%45%
53%
55% 69%
76%
58%72%
79%55% 47%
28%
5.5% CAGR Growth
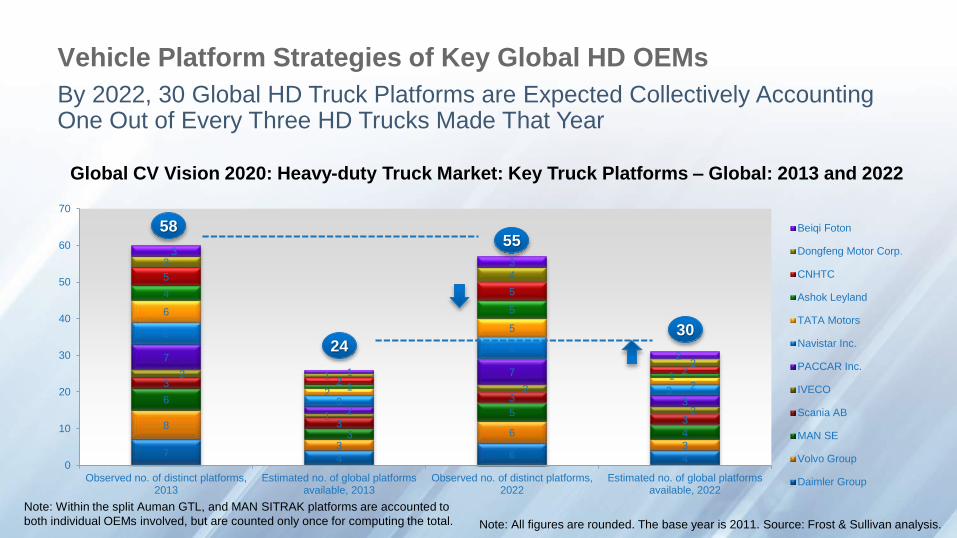
Vehicle Platform Strategies of Key Global HD OEMs
By 2022, 30 Global HD Truck Platforms are Expected Collectively Accounting One Out of Every Three HD Trucks Made That Year
Global CV Vision 2020: Heavy-duty Truck Market: Key Truck Platforms – Global: 2013 and 2022
Note: All figures are rounded. The base year is 2011. Source: Frost & Sullivan analysis.
Note: Within the split Auman GTL, and MAN SITRAK platforms are accounted to
both individual OEMs involved, but are counted only once for computing the total.
74 6 4
8
3
6
3
6
3
5
4
3
3
3
3
2
1
2
2
7
2
7
3
6
3
6
3
6
2
5
2
4
1
5
1
5
2
5
2
3
1
4
2
3
1
3
2
0
10
20
30
40
50
60
70
Observed no. of distinct platforms,2013
Estimated no. of global platformsavailable, 2013
Observed no. of distinct platforms,2022
Estimated no. of global platformsavailable, 2022
Beiqi Foton
Dongfeng Motor Corp.
CNHTC
Ashok Leyland
TATA Motors
Navistar Inc.
PACCAR Inc.
IVECO
Scania AB
MAN SE
Volvo Group
Daimler Group
58
24
55
30
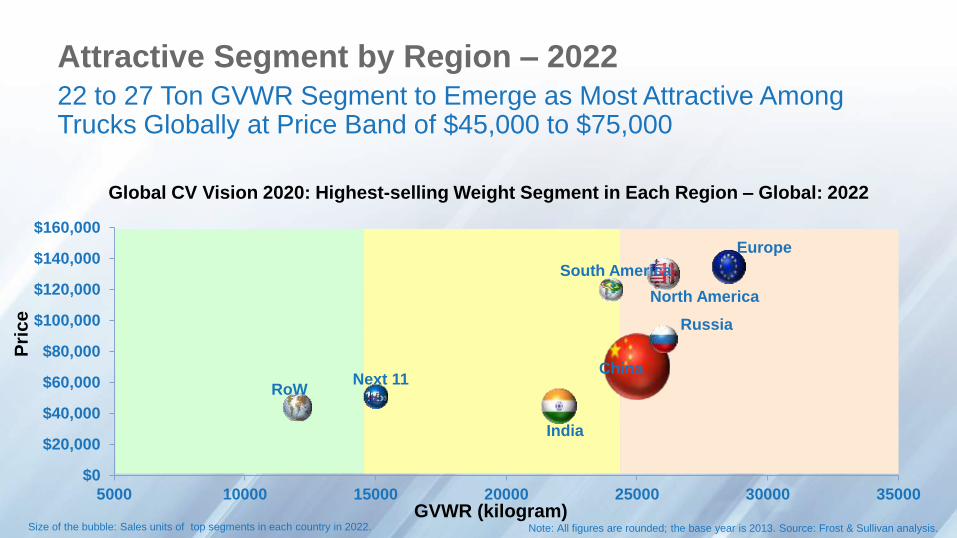
Pri
ce
Attractive Segment by Region – 202222 to 27 Ton GVWR Segment to Emerge as Most Attractive Among Trucks Globally at Price Band of $45,000 to $75,000
North America
South America
China
India
Russia
Europe
Next 11RoW
$0
$20,000
$40,000
$60,000
$80,000
$100,000
$120,000
$140,000
$160,000
5000 10000 15000 20000 25000 30000 35000
Global CV Vision 2020: Highest-selling Weight Segment in Each Region – Global: 2022
GVWR (kilogram)Size of the bubble: Sales units of top segments in each country in 2022. Note: All figures are rounded; the base year is 2013. Source: Frost & Sullivan analysis.
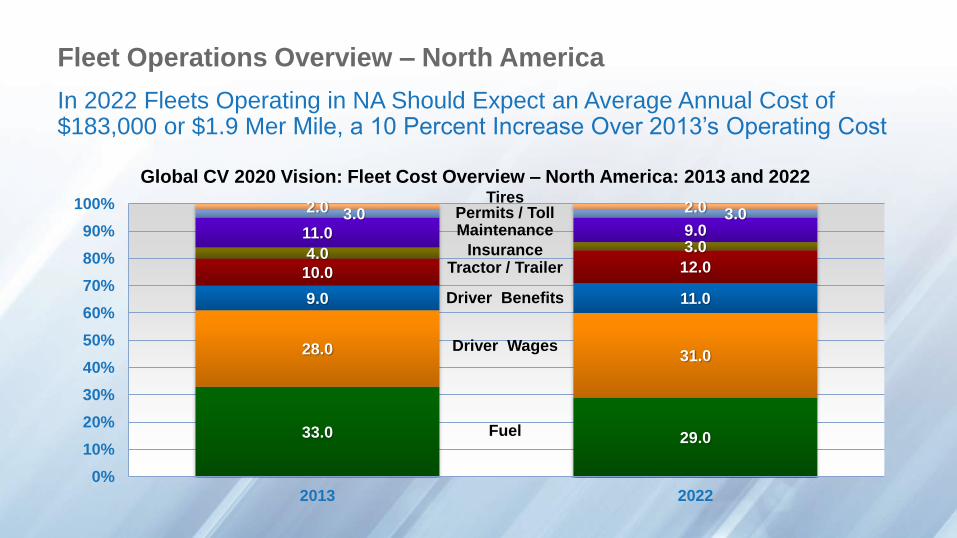
Fleet Operations Overview – North America
In 2022 Fleets Operating in NA Should Expect an Average Annual Cost of $183,000 or $1.9 Mer Mile, a 10 Percent Increase Over 2013’s Operating Cost
Global CV 2020 Vision: Fleet Cost Overview – North America: 2013 and 2022
33.0 29.0
28.0 31.0
9.0 11.0
10.0 12.04.0 3.011.0 9.0
3.0 3.02.0 2.0
0%
10%
20%
30%
40%
50%
60%
70%
80%
90%
100%
2013 2022
Fuel
Driver Wages
Driver Benefits
Tractor / TrailerInsurance
MaintenancePermits / Toll
Tires
Global Powertrain Market Outlook: 2022
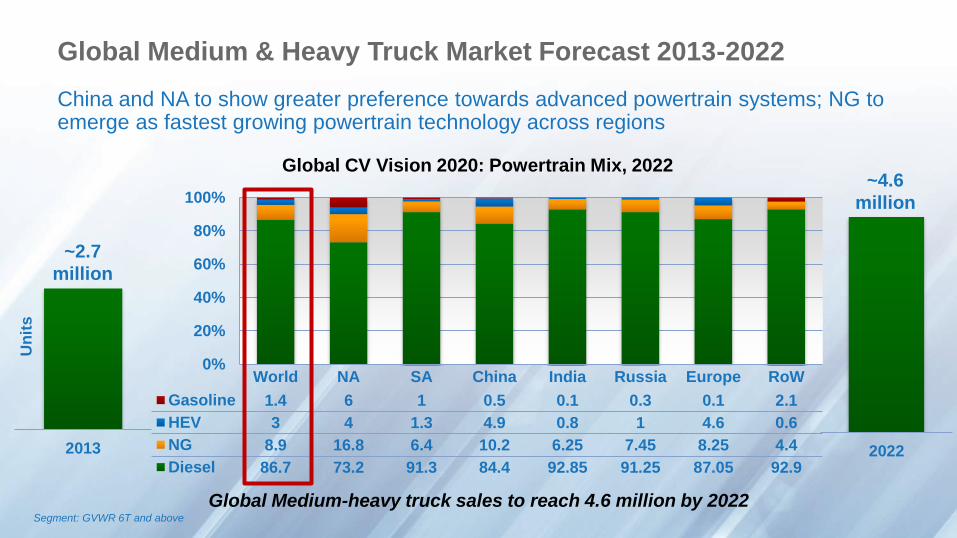
Global Medium & Heavy Truck Market Forecast 2013-2022
China and NA to show greater preference towards advanced powertrain systems; NG to emerge as fastest growing powertrain technology across regions
Segment: GVWR 6T and above
Global CV Vision 2020: Powertrain Mix, 2022
Global Medium-heavy truck sales to reach 4.6 million by 2022
0%
20%
40%
60%
80%
100%
World NA SA China India Russia Europe RoW
Gasoline 1.4 6 1 0.5 0.1 0.3 0.1 2.1
HEV 3 4 1.3 4.9 0.8 1 4.6 0.6
NG 8.9 16.8 6.4 10.2 6.25 7.45 8.25 4.4
Diesel 86.7 73.2 91.3 84.4 92.85 91.25 87.05 92.9
2013 2022
~2.7
million
Un
its
~4.6
million
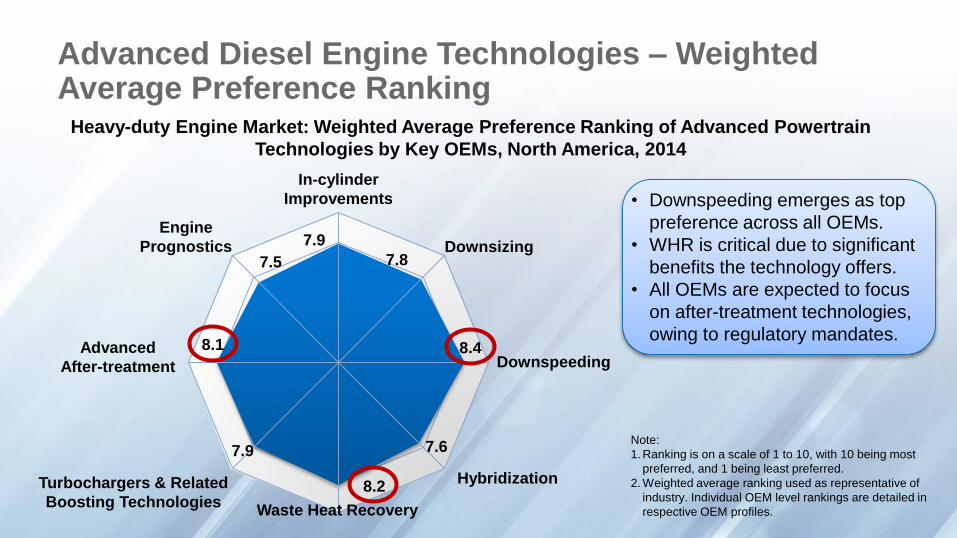
Advanced Diesel Engine Technologies – Weighted Average Preference Ranking
Heavy-duty Engine Market: Weighted Average Preference Ranking of Advanced Powertrain
Technologies by Key OEMs, North America, 2014
• Downspeeding emerges as top
preference across all OEMs.
• WHR is critical due to significant
benefits the technology offers.
• All OEMs are expected to focus
on after-treatment technologies,
owing to regulatory mandates.
Note:
1. Ranking is on a scale of 1 to 10, with 10 being most
preferred, and 1 being least preferred.
2. Weighted average ranking used as representative of
industry. Individual OEM level rankings are detailed in
respective OEM profiles.
7.9
7.8
8.4
7.6
8.2
7.9
8.1
7.5
In-cylinder
Improvements
Downsizing
Downspeeding
Waste Heat Recovery
Turbochargers & Related
Boosting Technologies
Advanced
After-treatment
Engine
Prognostics
Hybridization
NA SA China India Russia West Europe Next 11 RoW
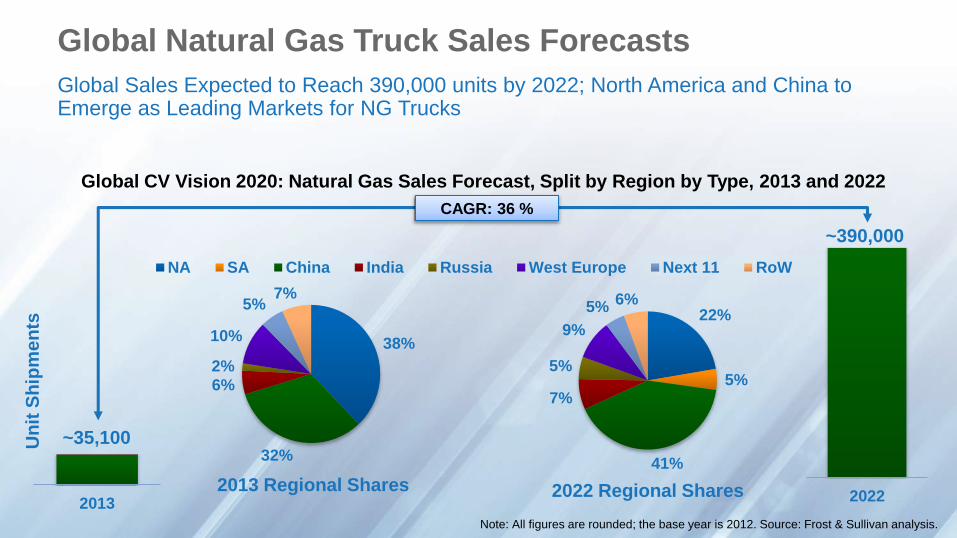
Global Natural Gas Truck Sales Forecasts
Global Sales Expected to Reach 390,000 units by 2022; North America and China to Emerge as Leading Markets for NG Trucks
Global CV Vision 2020: Natural Gas Sales Forecast, Split by Region by Type, 2013 and 2022
Note: All figures are rounded; the base year is 2012. Source: Frost & Sullivan analysis.
2013 2022
38%
32%
6%
2%
10%
5%7%
22%
5%
41%
7%
5%
9%
5%6%
2013 Regional Shares 2022 Regional Shares
Un
it S
hip
me
nts
~390,000
~35,100
CAGR: 36 %
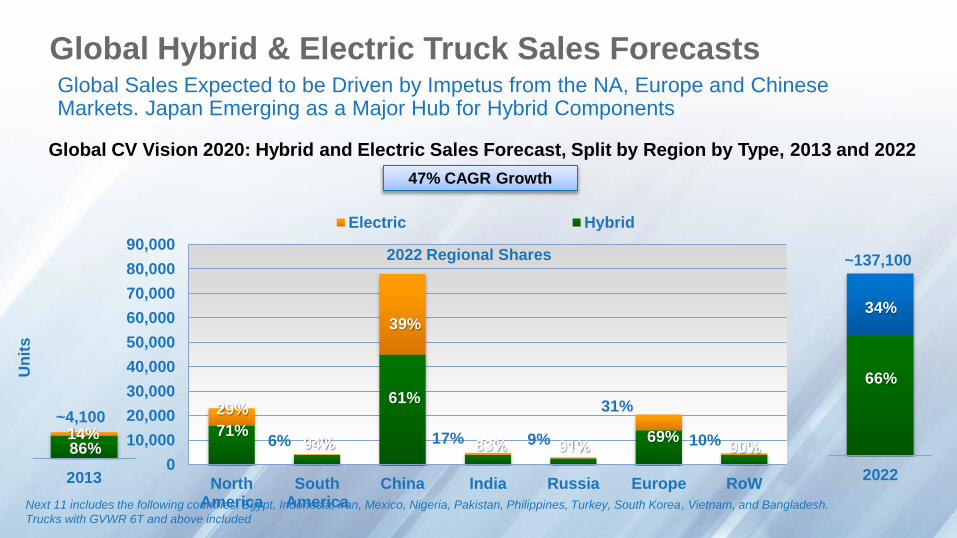
Global Hybrid & Electric Truck Sales ForecastsGlobal Sales Expected to be Driven by Impetus from the NA, Europe and Chinese Markets. Japan Emerging as a Major Hub for Hybrid Components
Global CV Vision 2020: Hybrid and Electric Sales Forecast, Split by Region by Type, 2013 and 2022
Next 11 includes the following countries: Egypt, Indonesia, Iran, Mexico, Nigeria, Pakistan, Philippines, Turkey, South Korea, Vietnam, and Bangladesh.
Trucks with GVWR 6T and above included
0
10,000
20,000
30,000
40,000
50,000
60,000
70,000
80,000
90,000
NorthAmerica
SouthAmerica
China India Russia Europe RoW
Electric Hybrid
2013 2022
47% CAGR Growth
2022 Regional Shares
~4,100
6%
39%
17% 9% 10%14%86%
29%
94%
61%
83% 91%69%
90%
Un
its
66%
34%
~137,100
31%
71%
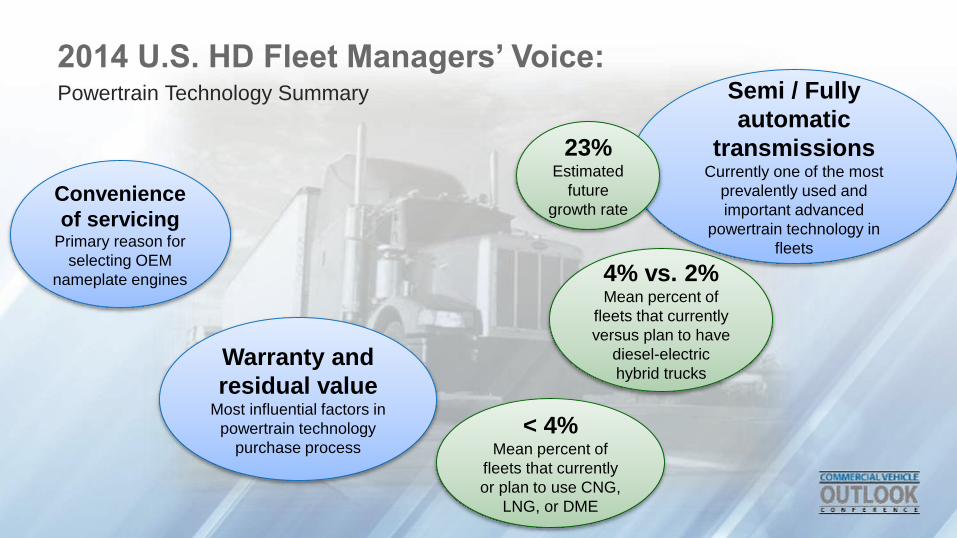
2014 U.S. HD Fleet Managers’ Voice:Powertrain Technology Summary
Warranty and
residual valueMost influential factors in
powertrain technology
purchase process
Semi / Fully
automatic
transmissions Currently one of the most
prevalently used and
important advanced
powertrain technology in
fleets
23%Estimated
future
growth rateConvenience
of servicingPrimary reason for
selecting OEM
nameplate engines 4% vs. 2%Mean percent of
fleets that currently
versus plan to have
diesel-electric
hybrid trucks
< 4%Mean percent of
fleets that currently
or plan to use CNG,
LNG, or DME
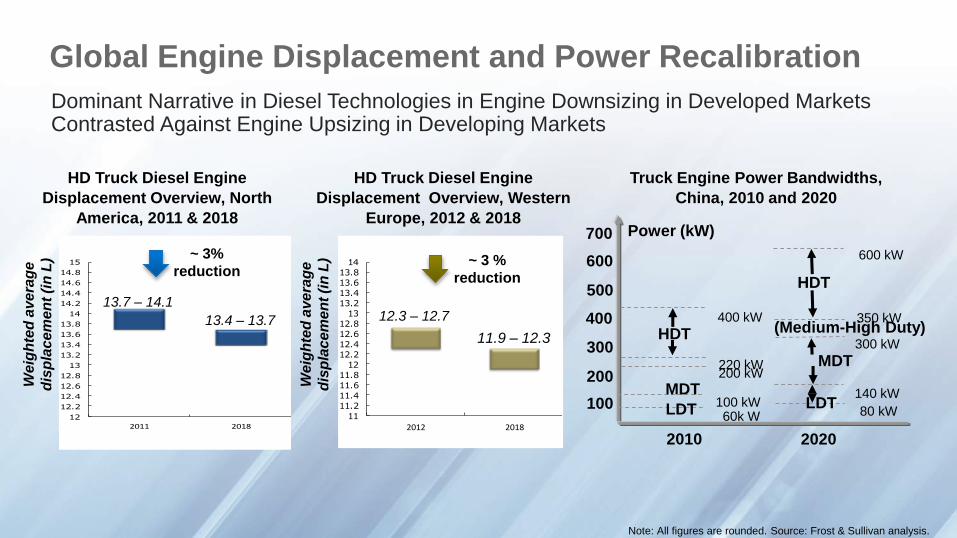
Global Engine Displacement and Power Recalibration
Dominant Narrative in Diesel Technologies in Engine Downsizing in Developed Markets Contrasted Against Engine Upsizing in Developing Markets
Truck Engine Power Bandwidths,
China, 2010 and 2020
HD Truck Diesel Engine
Displacement Overview, North
America, 2011 & 2018
HD Truck Diesel Engine
Displacement Overview, Western
Europe, 2012 & 2018
12
12.2
12.4
12.6
12.8
13
13.2
13.4
13.6
13.8
14
14.2
14.4
14.6
14.8
15
2011 2018
11
11.2
11.4
11.6
11.8
12
12.2
12.4
12.6
12.8
13
13.2
13.4
13.6
13.8
14
2012 2018
2010 2020
100
300
400
500
Power (kW)700
MDT
LDT
200 kW
100 kW60k W
HDT
220 kW
400 kW 350 kW
HDT
600 kW
MDT300 kW
140 kW
(Medium-High Duty)
LDT80 kW
200
600
Note: All figures are rounded. Source: Frost & Sullivan analysis.
~ 3%
reduction~ 3 %
reduction
13.7 – 14.1
13.4 – 13.7 12.3 – 12.7
11.9 – 12.3
We
igh
ted
ave
rag
e
dis
pla
ce
me
nt
(in
L)
We
igh
ted
ave
rag
e
dis
pla
ce
me
nt
(in
L)

Global Telematics Market Outlook 2022
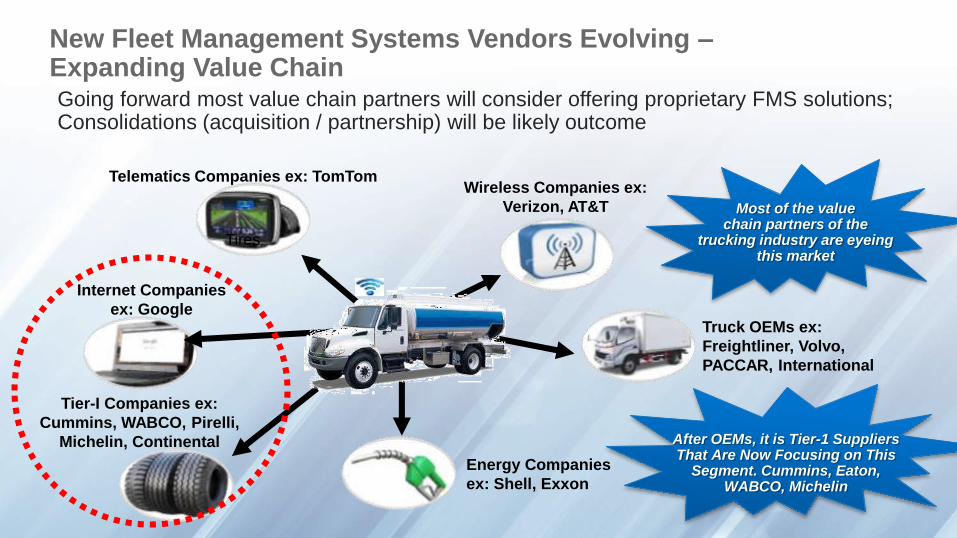
New Fleet Management Systems Vendors Evolving –Expanding Value ChainGoing forward most value chain partners will consider offering proprietary FMS solutions; Consolidations (acquisition / partnership) will be likely outcome
Most of the value chain partners of the
trucking industry are eyeing this market
Tires
Internet Companies
ex: GoogleTruck OEMs ex:
Freightliner, Volvo,
PACCAR, International
Telematics Companies ex: TomTomWireless Companies ex:
Verizon, AT&T
Energy Companies
ex: Shell, Exxon
Tier-I Companies ex:
Cummins, WABCO, Pirelli,
Michelin, Continental After OEMs, it is Tier-1 Suppliers That Are Now Focusing on This
Segment. Cummins, Eaton, WABCO, Michelin
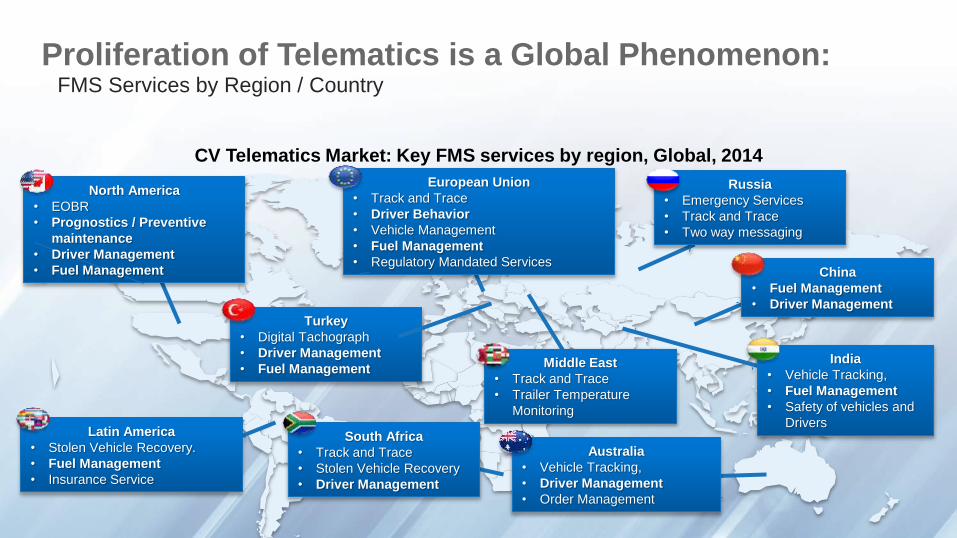
Proliferation of Telematics is a Global Phenomenon:FMS Services by Region / Country
CV Telematics Market: Key FMS services by region, Global, 2014
Turkey
• Digital Tachograph
• Driver Management
• Fuel ManagementIndia
• Vehicle Tracking,
• Fuel Management
• Safety of vehicles and
DriversLatin America
• Stolen Vehicle Recovery.
• Fuel Management
• Insurance Service
Russia
• Emergency Services
• Track and Trace
• Two way messaging
Australia
• Vehicle Tracking,
• Driver Management
• Order Management
China
• Fuel Management
• Driver Management
European Union
• Track and Trace
• Driver Behavior
• Vehicle Management
• Fuel Management
• Regulatory Mandated Services
South Africa
• Track and Trace
• Stolen Vehicle Recovery
• Driver Management
Middle East
• Track and Trace
• Trailer Temperature
Monitoring
North America
• EOBR
• Prognostics / Preventive
maintenance
• Driver Management
• Fuel Management
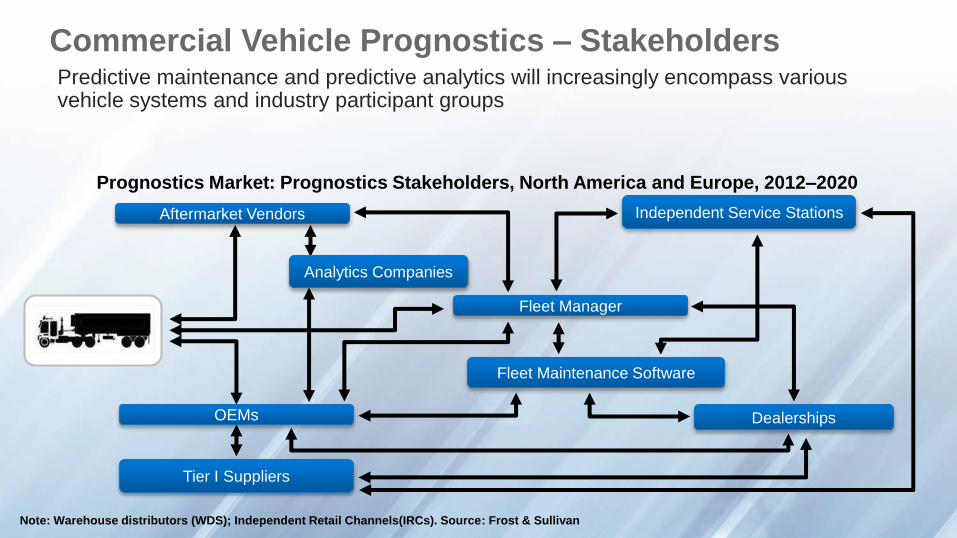
Commercial Vehicle Prognostics – StakeholdersPredictive maintenance and predictive analytics will increasingly encompass various vehicle systems and industry participant groups
Prognostics Market: Prognostics Stakeholders, North America and Europe, 2012–2020
Note: Warehouse distributors (WDS); Independent Retail Channels(IRCs). Source: Frost & Sullivan
OEMs
Tier I Suppliers
Aftermarket Vendors Independent Service Stations
Fleet Manager
Fleet Maintenance Software
Analytics Companies
Dealerships
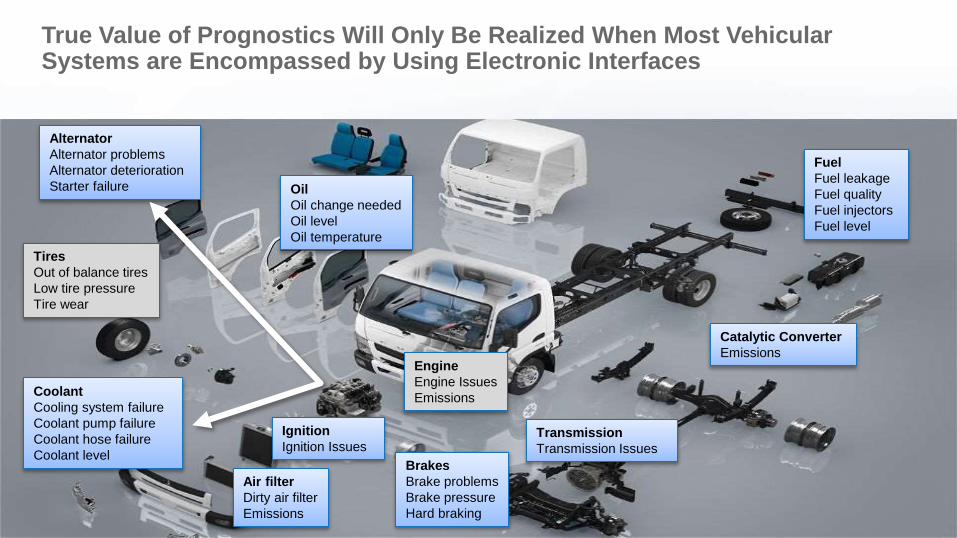
True Value of Prognostics Will Only Be Realized When Most Vehicular Systems are Encompassed by Using Electronic Interfaces
Fuel
Fuel leakage
Fuel quality
Fuel injectors
Fuel level
Catalytic Converter
Emissions
Tires
Out of balance tires
Low tire pressure
Tire wear
Transmission
Transmission Issues
Coolant
Cooling system failure
Coolant pump failure
Coolant hose failure
Coolant level
Air filter
Dirty air filter
Emissions
Alternator
Alternator problems
Alternator deterioration
Starter failure
Engine
Engine Issues
Emissions
Ignition
Ignition Issues
Brakes
Brake problems
Brake pressure
Hard braking
Oil
Oil change needed
Oil level
Oil temperature
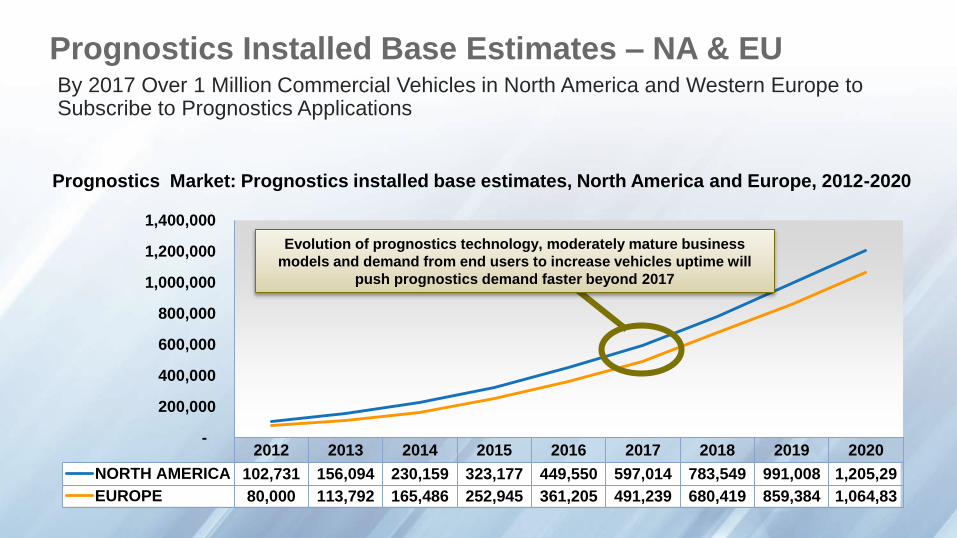
Prognostics Installed Base Estimates – NA & EUBy 2017 Over 1 Million Commercial Vehicles in North America and Western Europe to Subscribe to Prognostics Applications
2012 2013 2014 2015 2016 2017 2018 2019 2020
NORTH AMERICA 102,731 156,094 230,159 323,177 449,550 597,014 783,549 991,008 1,205,29
EUROPE 80,000 113,792 165,486 252,945 361,205 491,239 680,419 859,384 1,064,83
-
200,000
400,000
600,000
800,000
1,000,000
1,200,000
1,400,000
Prognostics Market: Prognostics installed base estimates, North America and Europe, 2012-2020
Evolution of prognostics technology, moderately mature business
models and demand from end users to increase vehicles uptime will
push prognostics demand faster beyond 2017
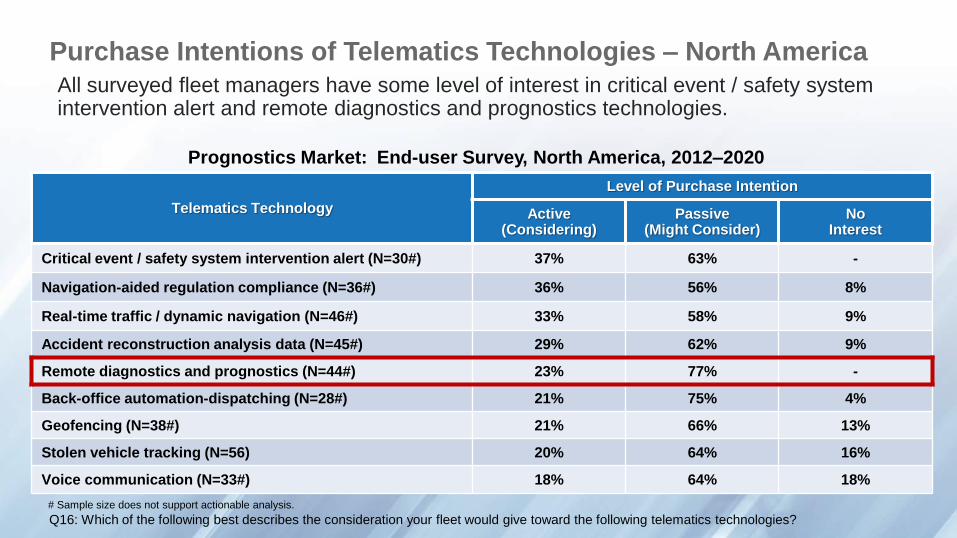
Purchase Intentions of Telematics Technologies – North America
All surveyed fleet managers have some level of interest in critical event / safety system intervention alert and remote diagnostics and prognostics technologies.
Prognostics Market: End-user Survey, North America, 2012–2020
Q16: Which of the following best describes the consideration your fleet would give toward the following telematics technologies?
# Sample size does not support actionable analysis.
Telematics Technology
Level of Purchase Intention
Active (Considering)
Passive (Might Consider)
No Interest
Critical event / safety system intervention alert (N=30#) 37% 63% -
Navigation-aided regulation compliance (N=36#) 36% 56% 8%
Real-time traffic / dynamic navigation (N=46#) 33% 58% 9%
Accident reconstruction analysis data (N=45#) 29% 62% 9%
Remote diagnostics and prognostics (N=44#) 23% 77% -
Back-office automation-dispatching (N=28#) 21% 75% 4%
Geofencing (N=38#) 21% 66% 13%
Stolen vehicle tracking (N=56) 20% 64% 16%
Voice communication (N=33#) 18% 64% 18%
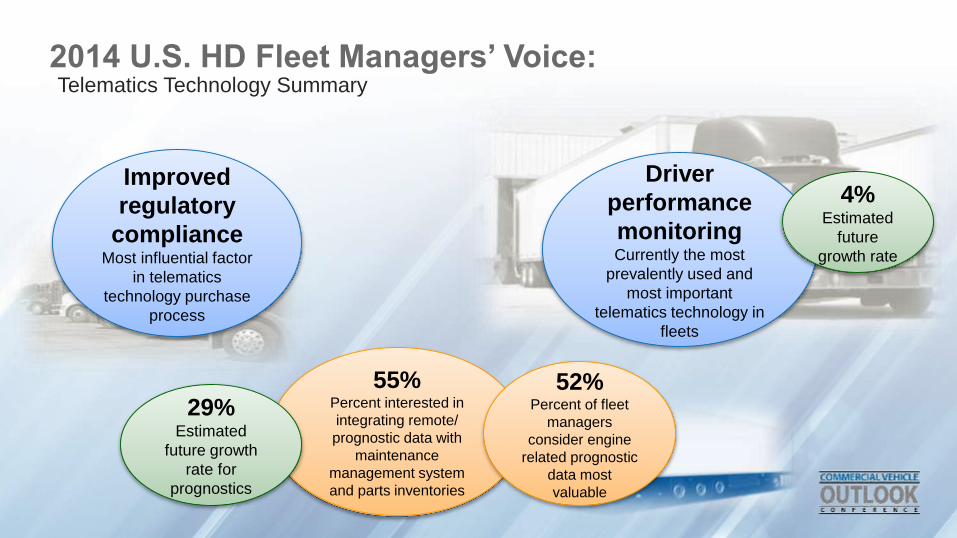
2014 U.S. HD Fleet Managers’ Voice:Telematics Technology Summary
Improved
regulatory
compliance Most influential factor
in telematics
technology purchase
process
Driver
performance
monitoring Currently the most
prevalently used and
most important
telematics technology in
fleets
4%Estimated
future
growth rate
55%Percent interested in
integrating remote/
prognostic data with
maintenance
management system
and parts inventories
52%Percent of fleet
managers
consider engine
related prognostic
data most
valuable
29%Estimated
future growth
rate for
prognostics
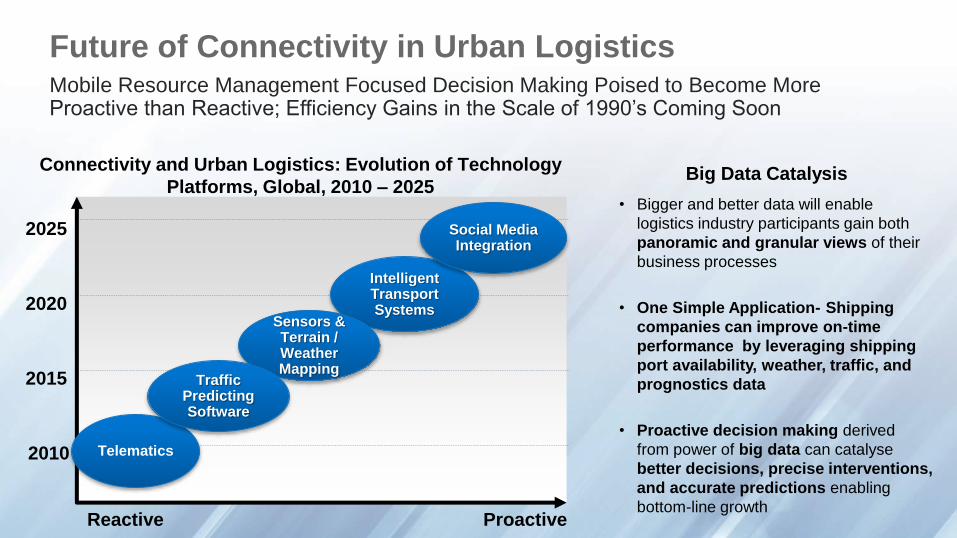
Future of Connectivity in Urban LogisticsMobile Resource Management Focused Decision Making Poised to Become More Proactive than Reactive; Efficiency Gains in the Scale of 1990’s Coming Soon
Reactive Proactive
2010
2015
2020
2025
Telematics
Intelligent Transport Systems
Social Media Integration
Sensors & Terrain / Weather Mapping
Traffic Predicting Software
Connectivity and Urban Logistics: Evolution of Technology
Platforms, Global, 2010 – 2025Big Data Catalysis
• Bigger and better data will enable
logistics industry participants gain both
panoramic and granular views of their
business processes
• One Simple Application- Shipping
companies can improve on-time
performance by leveraging shipping
port availability, weather, traffic, and
prognostics data
• Proactive decision making derived
from power of big data can catalyse
better decisions, precise interventions,
and accurate predictions enabling
bottom-line growth

Global Safety Market Outlook 2020
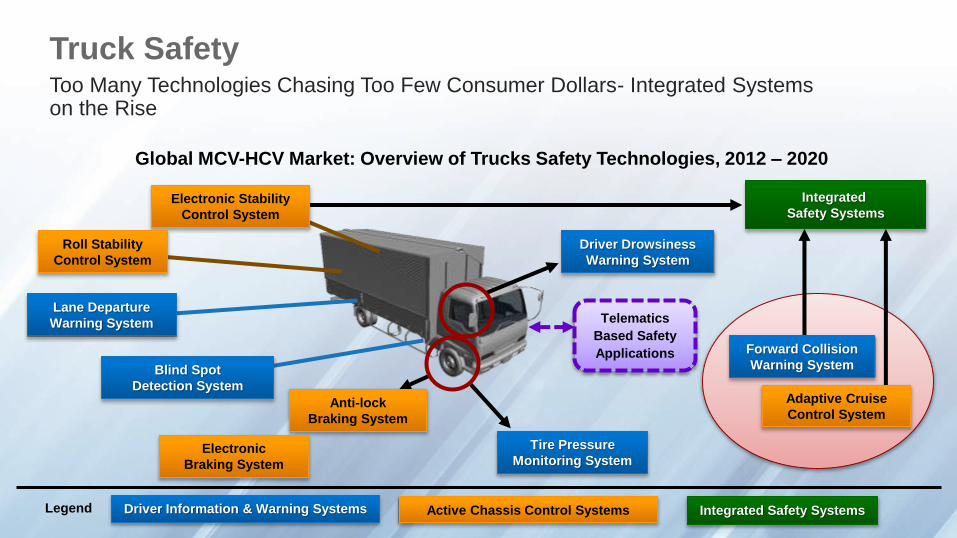
Truck SafetyToo Many Technologies Chasing Too Few Consumer Dollars- Integrated Systems on the Rise
Global MCV-HCV Market: Overview of Trucks Safety Technologies, 2012 – 2020
Driver Information & Warning Systems Active Chassis Control Systems Integrated Safety SystemsLegend
Lane Departure
Warning System
Blind Spot
Detection System
Anti-lock
Braking System
Electronic
Braking System
Forward Collision
Warning System
Adaptive Cruise
Control System
Tire Pressure
Monitoring System
Driver Drowsiness
Warning System
Electronic Stability
Control System
Roll Stability
Control System
Integrated
Safety Systems
Telematics
Based Safety
Applications
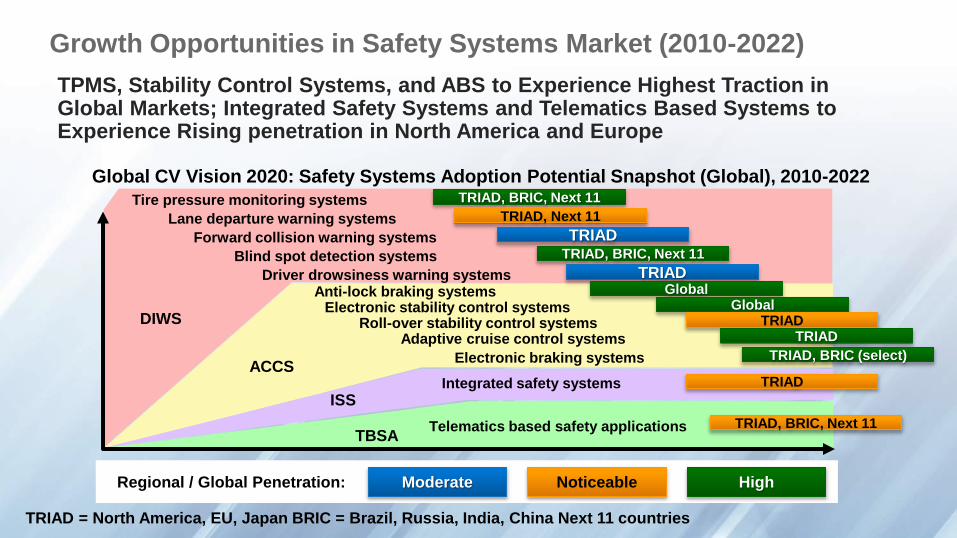
Growth Opportunities in Safety Systems Market (2010-2022)
TPMS, Stability Control Systems, and ABS to Experience Highest Traction in Global Markets; Integrated Safety Systems and Telematics Based Systems to Experience Rising penetration in North America and Europe
TRIAD = North America, EU, Japan BRIC = Brazil, Russia, India, China Next 11 countries
Moderate Noticeable HighRegional / Global Penetration:
Global CV Vision 2020: Safety Systems Adoption Potential Snapshot (Global), 2010-2022
Anti-lock braking systemsElectronic stability control systems
Roll-over stability control systemsAdaptive cruise control systems
Electronic braking systems
Integrated safety systems
Telematics based safety applications
DIWS
ACCS
ISS
TBSA
Tire pressure monitoring systems TRIAD, BRIC, Next 11
Lane departure warning systems TRIAD, Next 11
Forward collision warning systems TRIAD
Blind spot detection systems TRIAD, BRIC, Next 11
Driver drowsiness warning systems TRIADGlobal
GlobalTRIAD
TRIAD
TRIAD, BRIC (select)
TRIAD
TRIAD, BRIC, Next 11
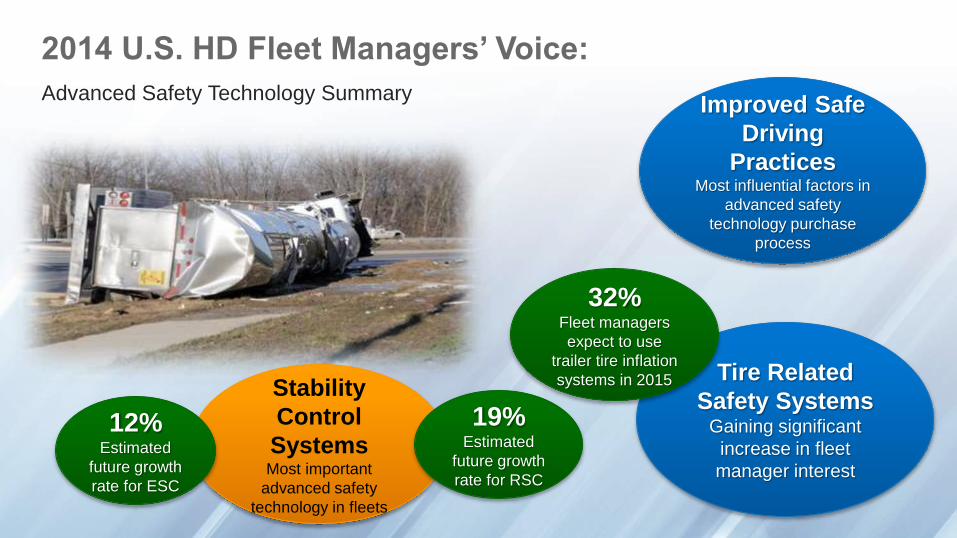
2014 U.S. HD Fleet Managers’ Voice:
Advanced Safety Technology SummaryImproved Safe
Driving
PracticesMost influential factors in
advanced safety
technology purchase
process
Tire Related
Safety Systems Gaining significant
increase in fleet
manager interest
Stability
Control
Systems Most important
advanced safety
technology in fleets
19%Estimated
future growth
rate for RSC
12%Estimated
future growth
rate for ESC
32%Fleet managers
expect to use
trailer tire inflation
systems in 2015
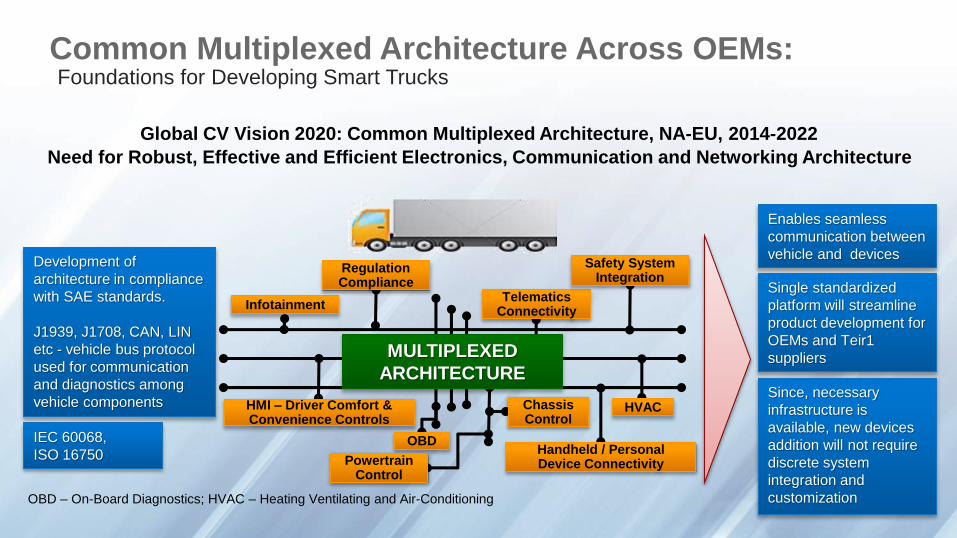
Common Multiplexed Architecture Across OEMs:Foundations for Developing Smart Trucks
Global CV Vision 2020: Common Multiplexed Architecture, NA-EU, 2014-2022
Need for Robust, Effective and Efficient Electronics, Communication and Networking Architecture
Enables seamless
communication between
vehicle and devices
Single standardized
platform will streamline
product development for
OEMs and Teir1
suppliers
Since, necessary
infrastructure is
available, new devices
addition will not require
discrete system
integration and
customizationOBD – On-Board Diagnostics; HVAC – Heating Ventilating and Air-Conditioning
Development of
architecture in compliance
with SAE standards.
J1939, J1708, CAN, LIN
etc - vehicle bus protocol
used for communication
and diagnostics among
vehicle components
Infotainment
Regulation Compliance
OBD
HMI – Driver Comfort & Convenience Controls
Handheld / Personal Device Connectivity
Telematics Connectivity
Safety System Integration
HVAC
Powertrain Control
Chassis Control
MULTIPLEXED
ARCHITECTURE
IEC 60068,
ISO 16750
Vision 2022Profit from Volume and Margins
andTruck of the Future
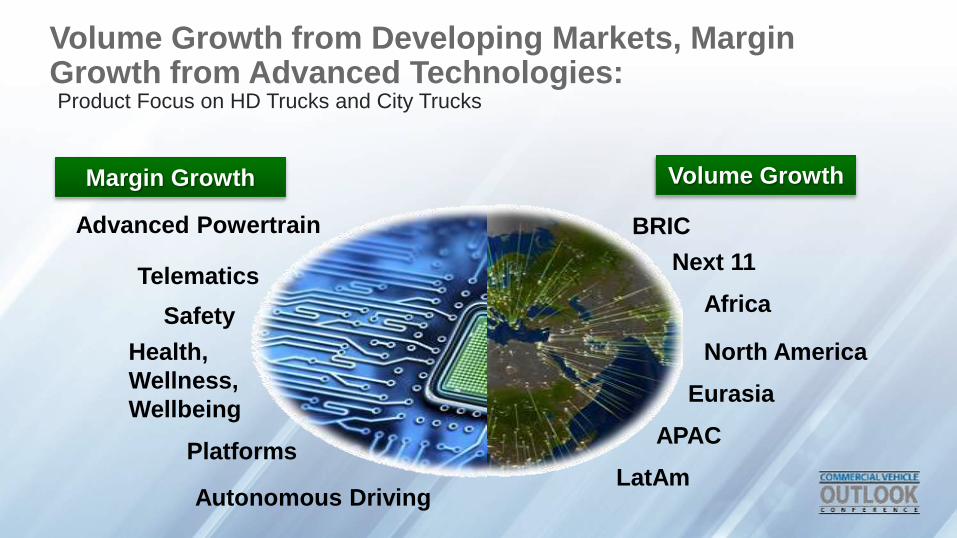
Volume Growth from Developing Markets, Margin Growth from Advanced Technologies:Product Focus on HD Trucks and City Trucks
Volume Growth
BRIC
Next 11
Africa
North America
APAC
Eurasia
LatAm
Margin Growth
Advanced Powertrain
Telematics
Safety
Health,
Wellness,
Wellbeing
Platforms
Autonomous Driving

Vision 2022:What Will be the Traits of Truck of The Future?
Green
Safe
Connected
Smart
Key Contacts
Sandeep Kar
Global Director- Automotive & Transportation Research
Direct: 416.490.7796
Fax: 416.490.1533
Email: [email protected]