Embed Size (px)
Citation preview
Global Export Market Opportunities and
End Market Growth for Plastics
Presented By:
Michael D. Taylor
Vice President, International Affairs and Trade
SPI South Regional Workshop
BMW Performance Center
Greer, South Carolina
September 15, 2015
Agenda Overview of the U.S. Economy and Manufacturing
U.S. Plastics Industry
Trade Flows & Global Market Opportunities
SPI’s Plastics Market Watch Series
Focus on Automotive, Medical & Packaging End Markets
Q&A
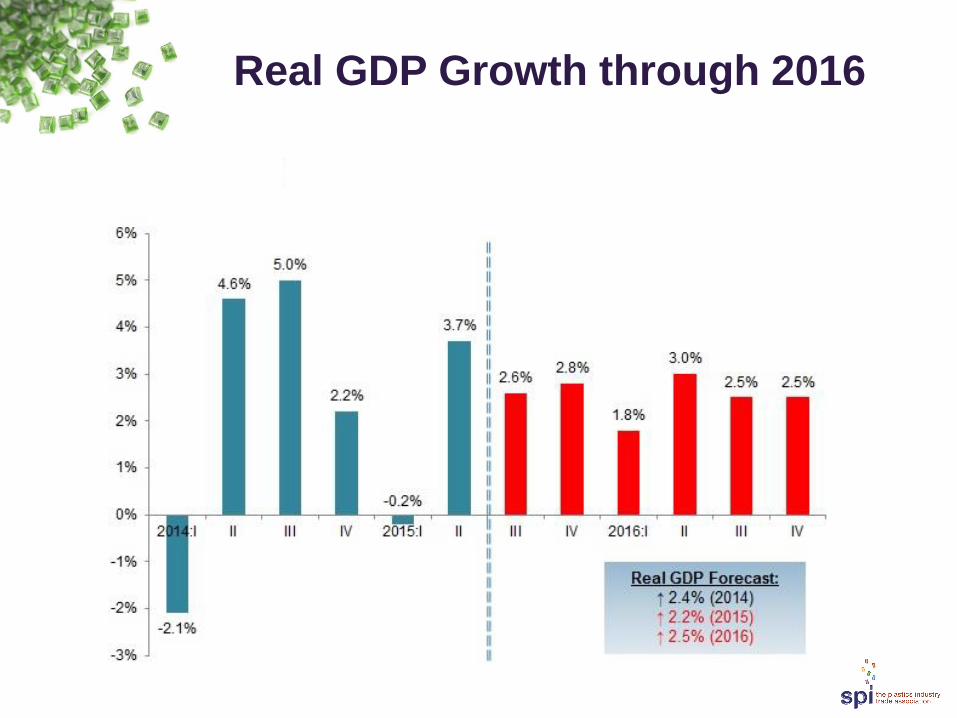
Real GDP Growth through 2016
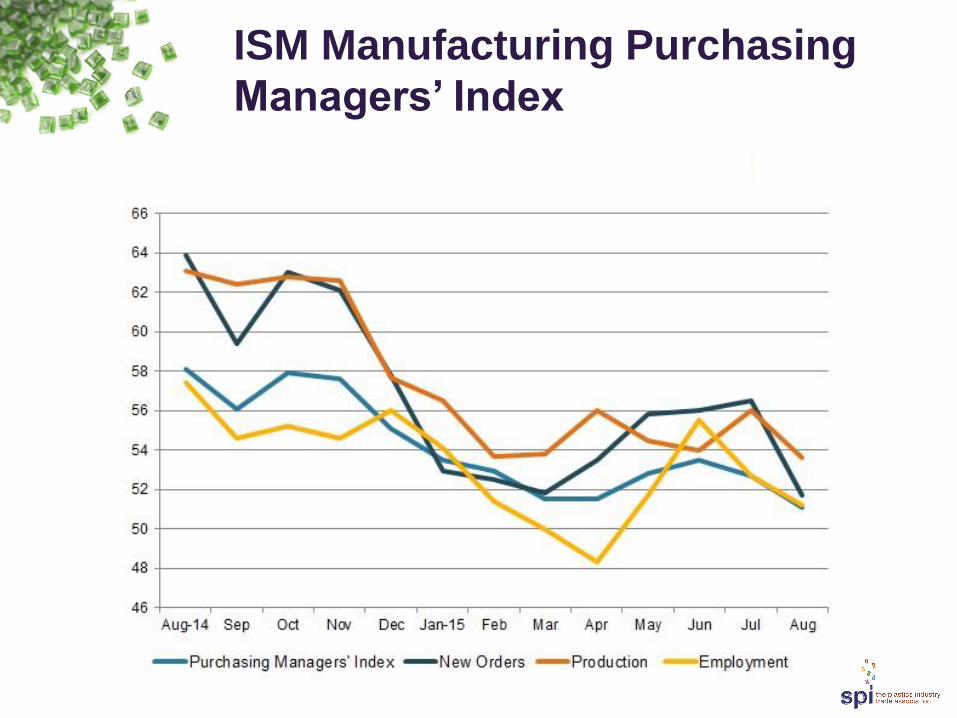
ISM Manufacturing Purchasing
Managers’ Index
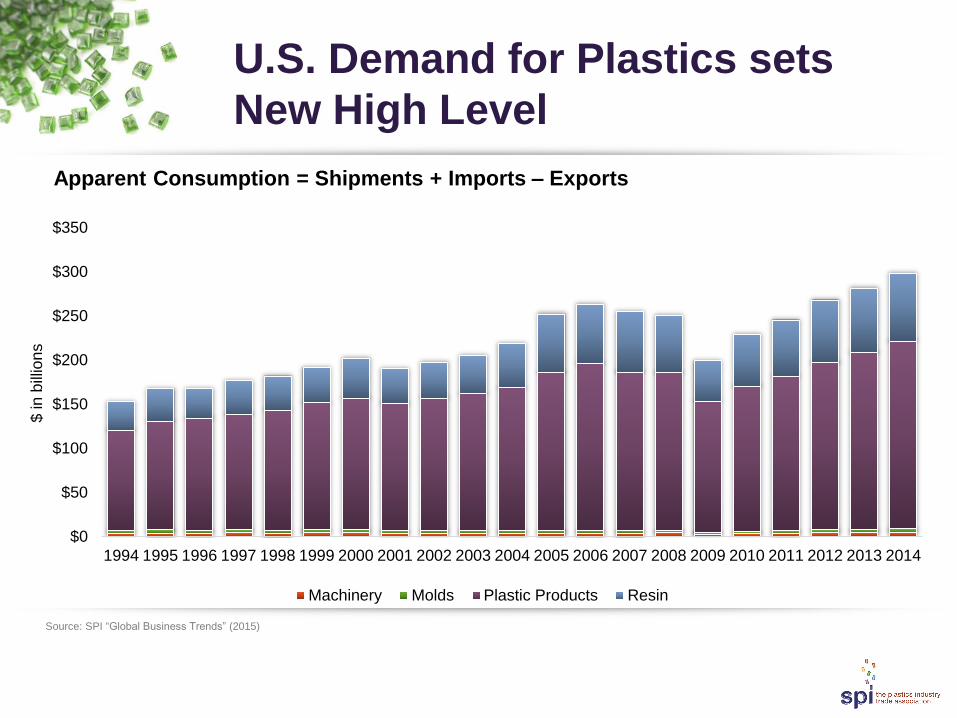
U.S. Demand for Plastics sets
New High Level
$0
$50
$100
$150
$200
$250
$300
$350
1994 1995 1996 1997 1998 1999 2000 2001 2002 2003 2004 2005 2006 2007 2008 2009 2010 2011 2012 2013 2014
$ in b
illio
ns
Machinery Molds Plastic Products Resin
Apparent Consumption = Shipments + Imports – Exports
Source: SPI “Global Business Trends” (2015)
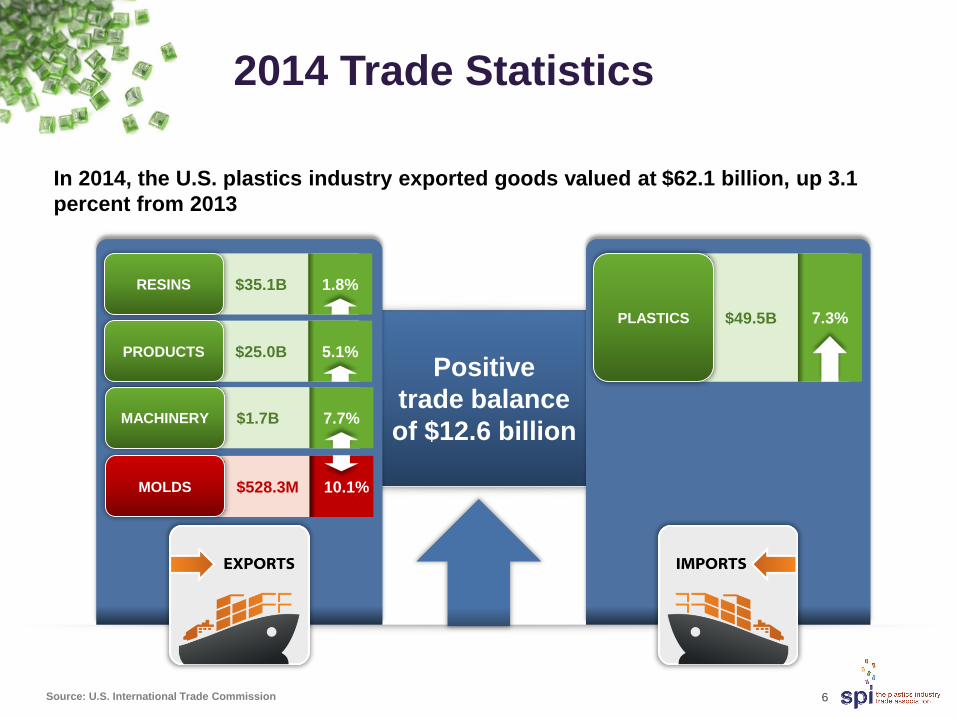
Positive
trade balance
of $12.6 billion
$49.5B PLASTICS 7.3%
2014 Trade Statistics
6
In 2014, the U.S. plastics industry exported goods valued at $62.1 billion, up 3.1
percent from 2013
$35.1B RESINS 1.8%
$25.0B PRODUCTS 5.1%
$528.3M MOLDS 10.1%
$1.7B MACHINERY 7.7%
Source: U.S. International Trade Commission
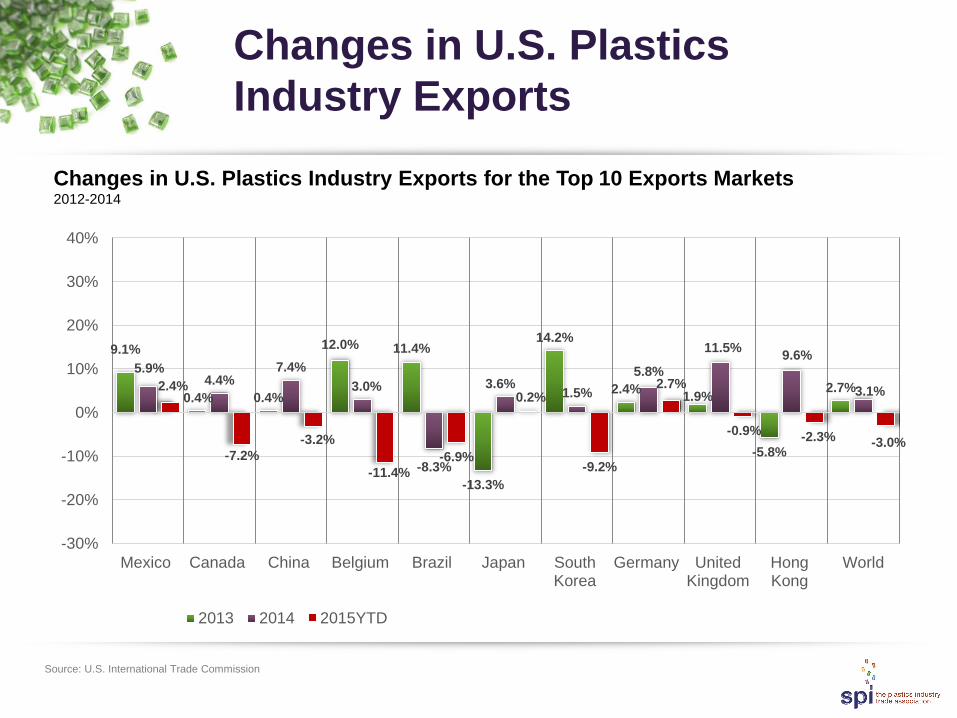
Changes in U.S. Plastics
Industry Exports
9.1%
0.4% 0.4%
12.0% 11.4%
-13.3%
14.2%
2.4% 1.9%
-5.8%
2.7%
5.9% 4.4%
7.4%
3.0%
-8.3%
3.6% 1.5%
5.8%
11.5% 9.6%
3.1% 2.4%
-7.2%
-3.2%
-11.4%
-6.9%
0.2%
-9.2%
2.7%
-0.9% -2.3% -3.0%
-30%
-20%
-10%
0%
10%
20%
30%
40%
Mexico Canada China Belgium Brazil Japan SouthKorea
Germany UnitedKingdom
HongKong
World
2013 2014 2015YTD
Changes in U.S. Plastics Industry Exports for the Top 10 Exports Markets 2012-2014
Source: U.S. International Trade Commission
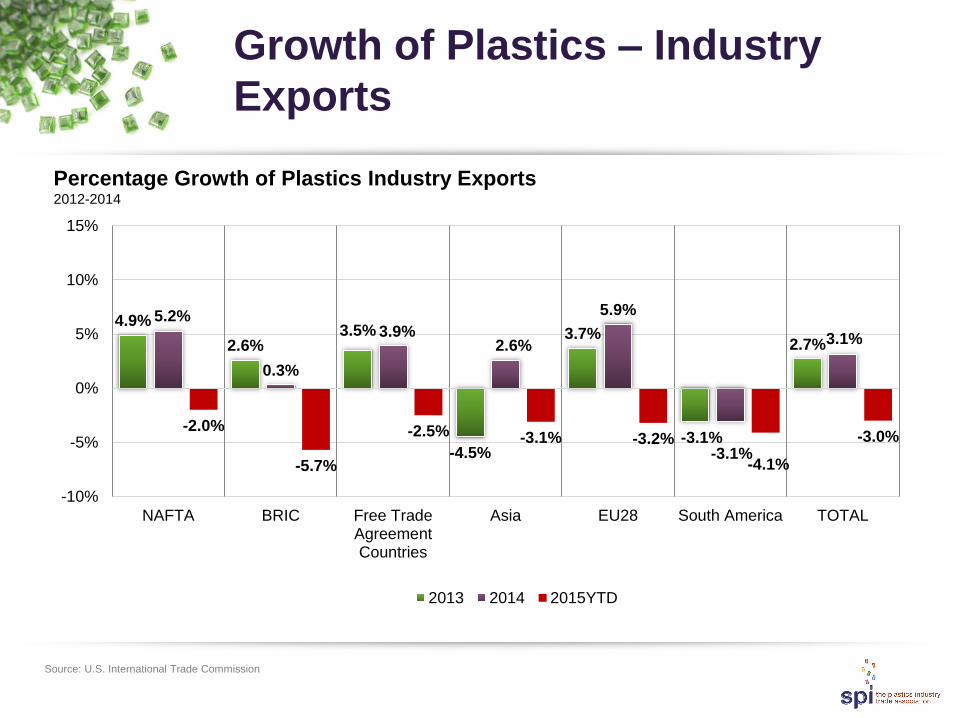
Growth of Plastics – Industry
Exports
4.9%
2.6% 3.5%
-4.5%
3.7%
-3.1%
2.7%
5.2%
0.3%
3.9% 2.6%
5.9%
-3.1%
3.1%
-2.0%
-5.7%
-2.5% -3.1% -3.2%
-4.1%
-3.0%
-10%
-5%
0%
5%
10%
15%
NAFTA BRIC Free TradeAgreementCountries
Asia EU28 South America TOTAL
2013 2014 2015YTD
Percentage Growth of Plastics Industry Exports 2012-2014
Source: U.S. International Trade Commission
Trans-Pacific Partnership Trans-Atlantic Trade &
Investment Partnership
Global Opportunities
9
• 2014: U.S. plastics
industry exports to the
11 TPP countries were
more than $34B
• Since 2000: plastics
exports to TPP
countries increased
more than 91%
• 2014: plastics industry
trade surplus with TPP
countries was $13.7B
• A high-standard TTIP
would advance trade
and investment
liberalization and
address regulatory and
other non-tariff barriers
• Based on 2011 trade
flows, the U.S. plastics
industry would be one
of the top benefiting
sectors with a total
potential tariff savings
of $465M
Trans-Pacific Partnership (TPP)
by the Numbers
• 698 – The U.S. exported $698 billion in goods to TPP markets in 2013.
• 97 – Small and medium-sized enterprises accounted for 97 percent of all
U.S. companies exporting goods to TPP countries in 2011.
• 45 – TPP markets accounted for 45 percent of all U.S. goods exports in
2012.
• 4 to 50 – America's share of imports into TPP countries varies considerably,
accounting for as little as 4 percent of Vietnam's total imports to as high as
50 percent of Mexico's total imports.
• 1.4 to 5.5 – TPP countries include both developed and developing
countries, with projected growth rates ranging from 1.5 percent (Japan) to
5.5 percent (Peru).
• 38.5 – The U.S. plastics industry exported goods worth more then
$38.5 billion to the TPP countries in 2014 up 4.6 percent from 2013.
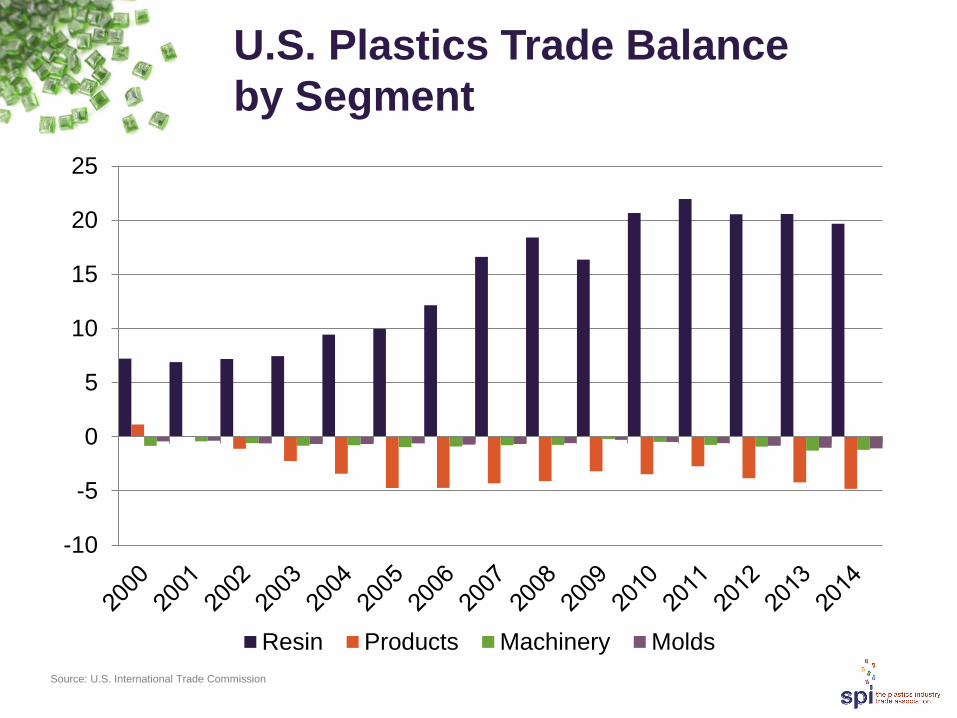
U.S. Plastics Trade Balance
by Segment
Source: U.S. International Trade Commission
-10
-5
0
5
10
15
20
25
Resin Products Machinery Molds
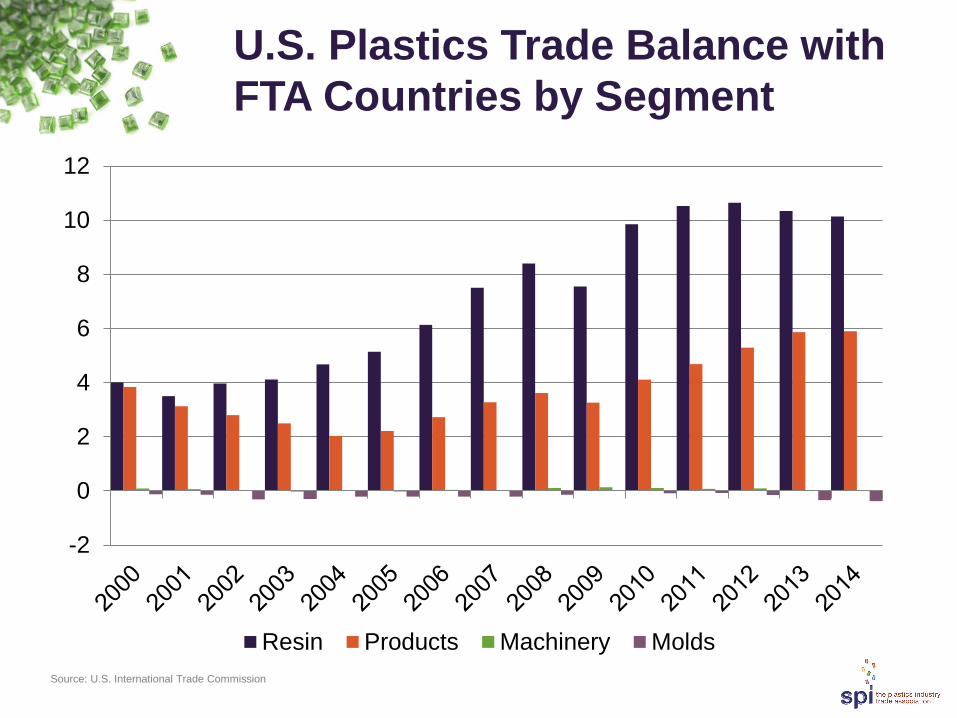
U.S. Plastics Trade Balance with
FTA Countries by Segment
Source: U.S. International Trade Commission
-2
0
2
4
6
8
10
12
Resin Products Machinery Molds
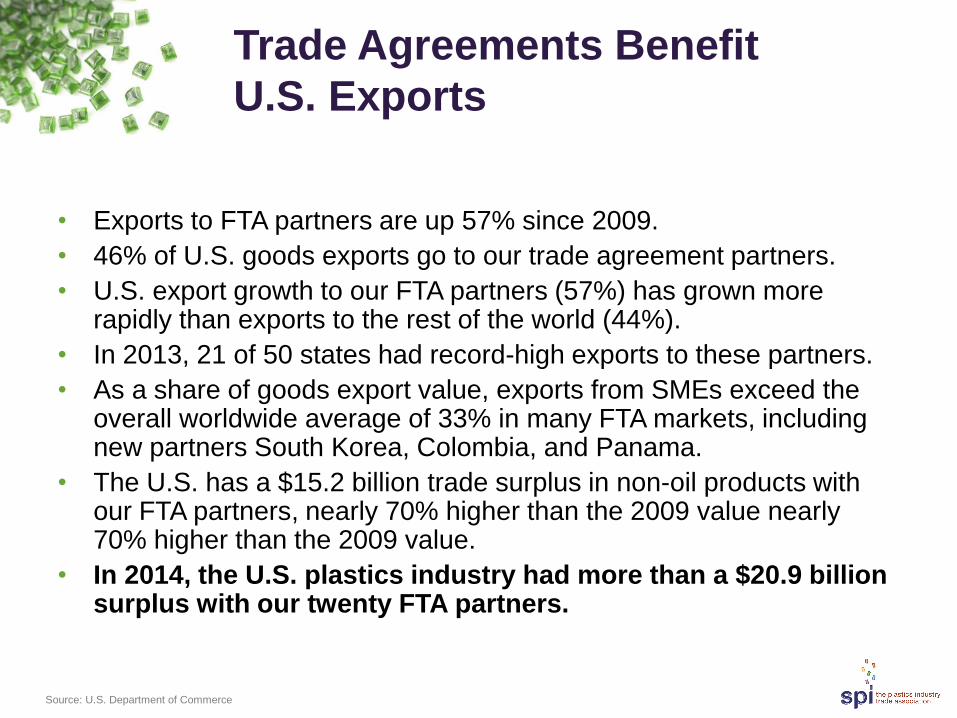
Trade Agreements Benefit
U.S. Exports
• Exports to FTA partners are up 57% since 2009.
• 46% of U.S. goods exports go to our trade agreement partners.
• U.S. export growth to our FTA partners (57%) has grown more rapidly than exports to the rest of the world (44%).
• In 2013, 21 of 50 states had record-high exports to these partners.
• As a share of goods export value, exports from SMEs exceed the overall worldwide average of 33% in many FTA markets, including new partners South Korea, Colombia, and Panama.
• The U.S. has a $15.2 billion trade surplus in non-oil products with our FTA partners, nearly 70% higher than the 2009 value nearly 70% higher than the 2009 value.
• In 2014, the U.S. plastics industry had more than a $20.9 billion surplus with our twenty FTA partners.
Source: U.S. Department of Commerce
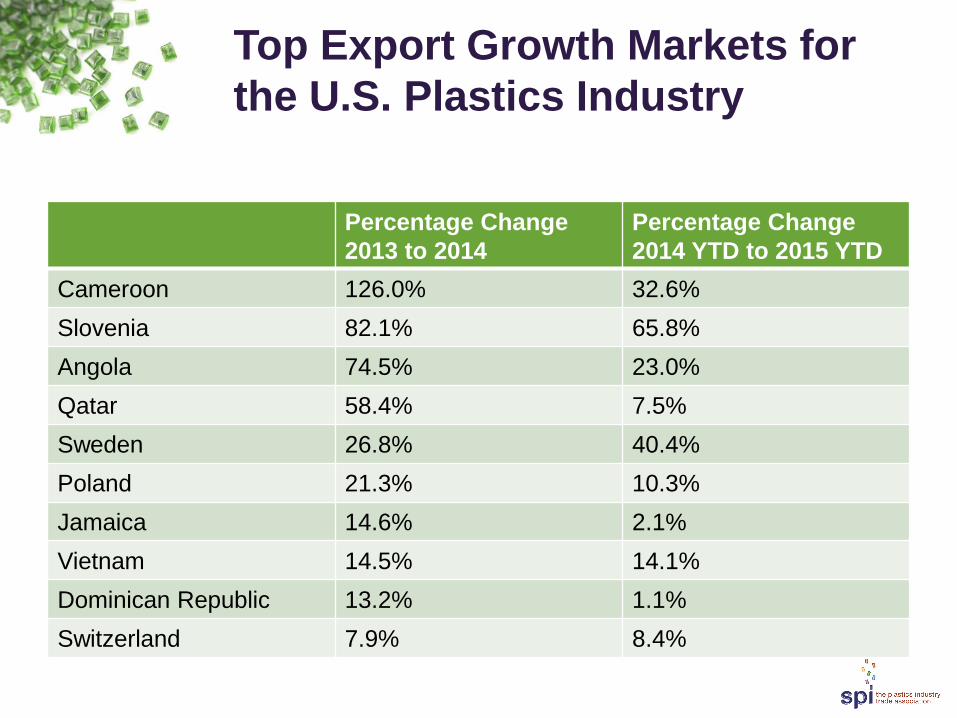
Top Export Growth Markets for
the U.S. Plastics Industry
Percentage Change
2013 to 2014
Percentage Change
2014 YTD to 2015 YTD
Cameroon 126.0% 32.6%
Slovenia 82.1% 65.8%
Angola 74.5% 23.0%
Qatar 58.4% 7.5%
Sweden 26.8% 40.4%
Poland 21.3% 10.3%
Jamaica 14.6% 2.1%
Vietnam 14.5% 14.1%
Dominican Republic 13.2% 1.1%
Switzerland 7.9% 8.4%
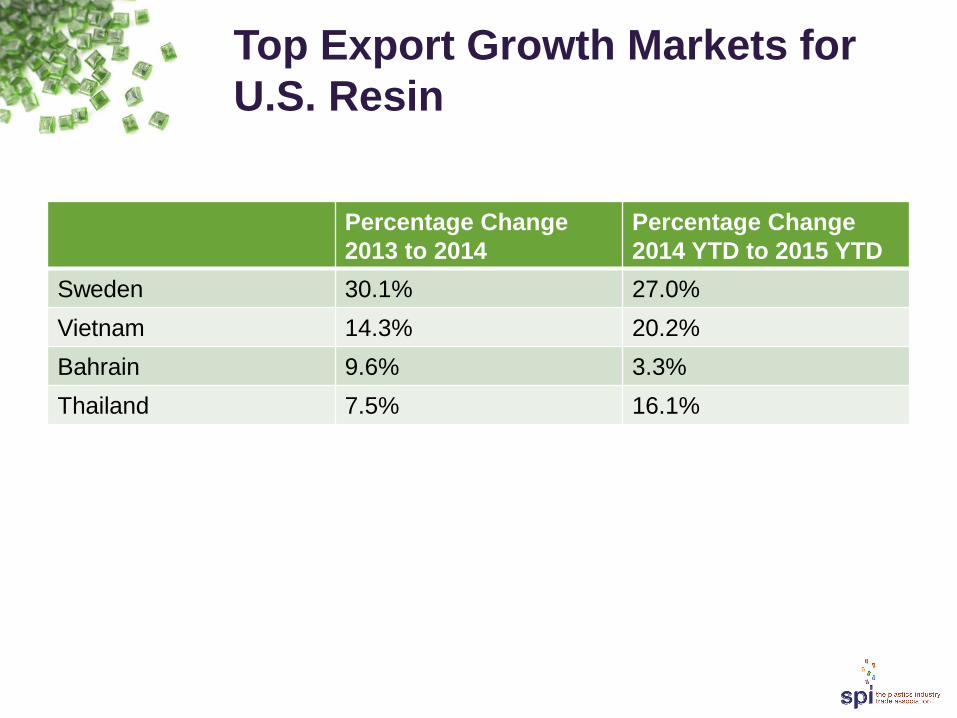
Top Export Growth Markets for
U.S. Resin
Percentage Change
2013 to 2014
Percentage Change
2014 YTD to 2015 YTD
Sweden 30.1% 27.0%
Vietnam 14.3% 20.2%
Bahrain 9.6% 3.3%
Thailand 7.5% 16.1%
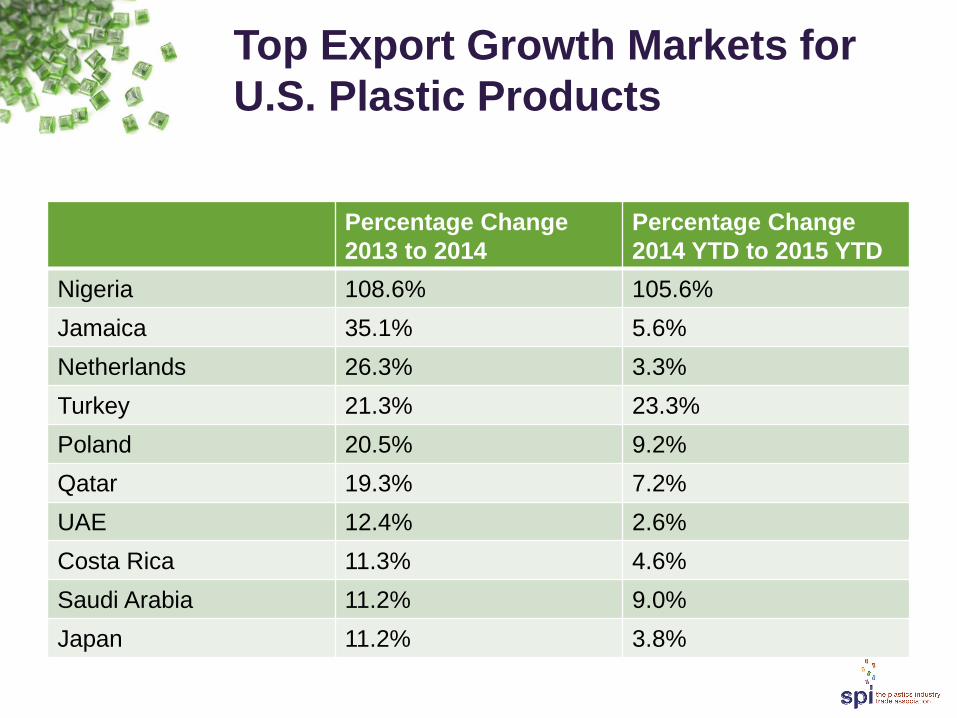
Top Export Growth Markets for
U.S. Plastic Products
Percentage Change
2013 to 2014
Percentage Change
2014 YTD to 2015 YTD
Nigeria 108.6% 105.6%
Jamaica 35.1% 5.6%
Netherlands 26.3% 3.3%
Turkey 21.3% 23.3%
Poland 20.5% 9.2%
Qatar 19.3% 7.2%
UAE 12.4% 2.6%
Costa Rica 11.3% 4.6%
Saudi Arabia 11.2% 9.0%
Japan 11.2% 3.8%
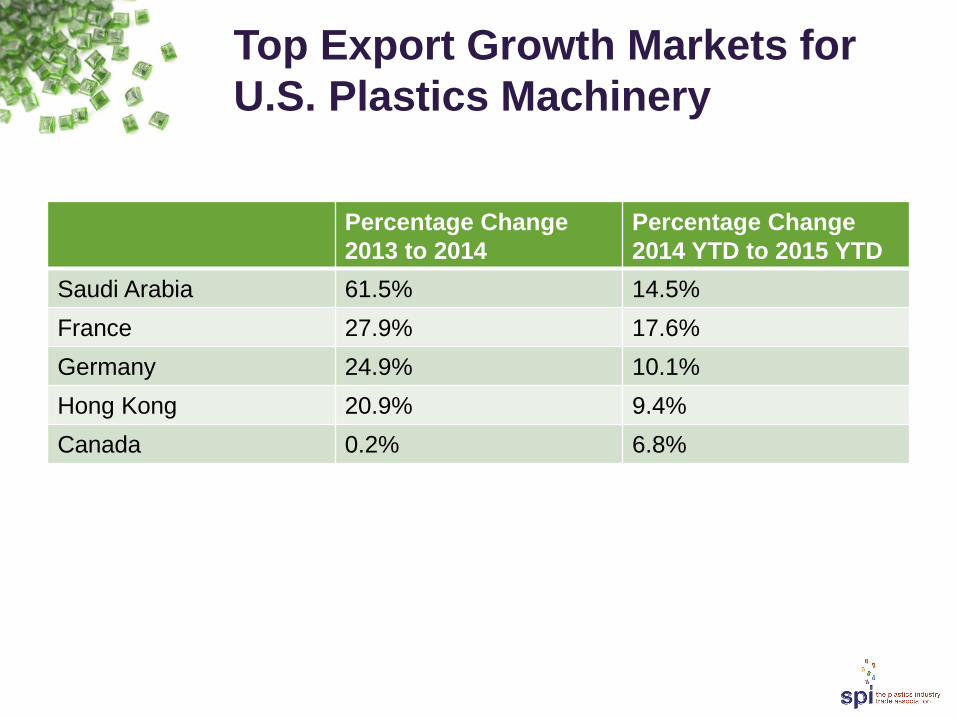
Top Export Growth Markets for
U.S. Plastics Machinery
Percentage Change
2013 to 2014
Percentage Change
2014 YTD to 2015 YTD
Saudi Arabia 61.5% 14.5%
France 27.9% 17.6%
Germany 24.9% 10.1%
Hong Kong 20.9% 9.4%
Canada 0.2% 6.8%
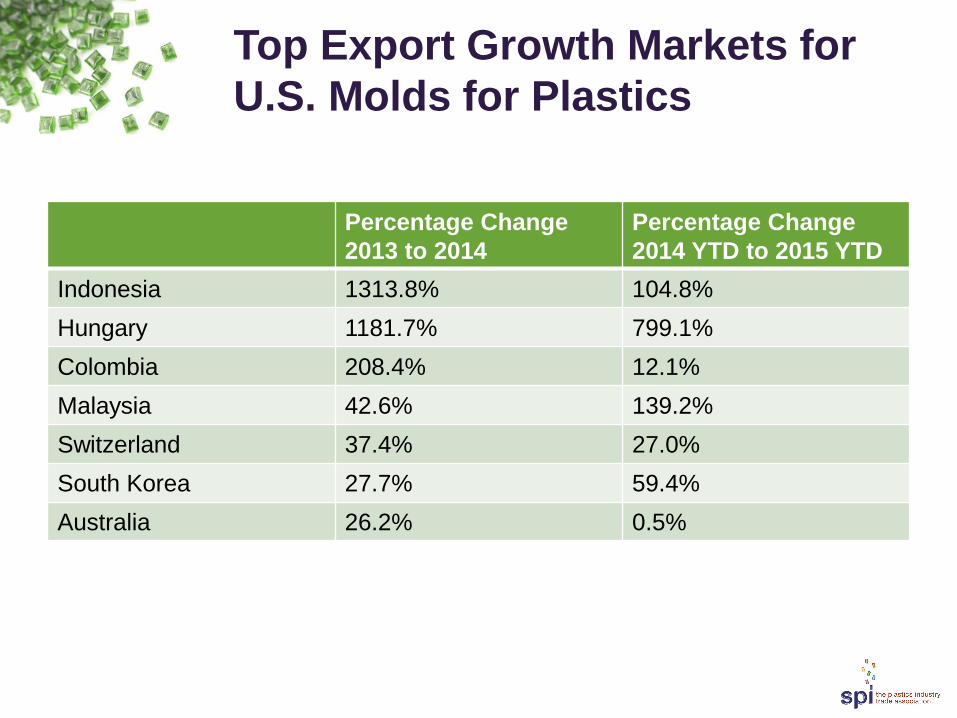
Top Export Growth Markets for
U.S. Molds for Plastics
Percentage Change
2013 to 2014
Percentage Change
2014 YTD to 2015 YTD
Indonesia 1313.8% 104.8%
Hungary 1181.7% 799.1%
Colombia 208.4% 12.1%
Malaysia 42.6% 139.2%
Switzerland 37.4% 27.0%
South Korea 27.7% 59.4%
Australia 26.2% 0.5%

SPI has launched a new series of reports looking at the
impact of the consumer on the business of plastics,
including demographics, economics, policy developments
and technological improvements for markets including:
Automotive & Transportation
Healthcare & Medical Devices
Packaging
Housing & Construction
This first publication under the SPI Market Watch series
explores the current state of plastics' role in the automotive
and transportation sector and looks into what the future
holds for the material.
Issue 1:
Automotive and
Transportation
Now Available for
Free!
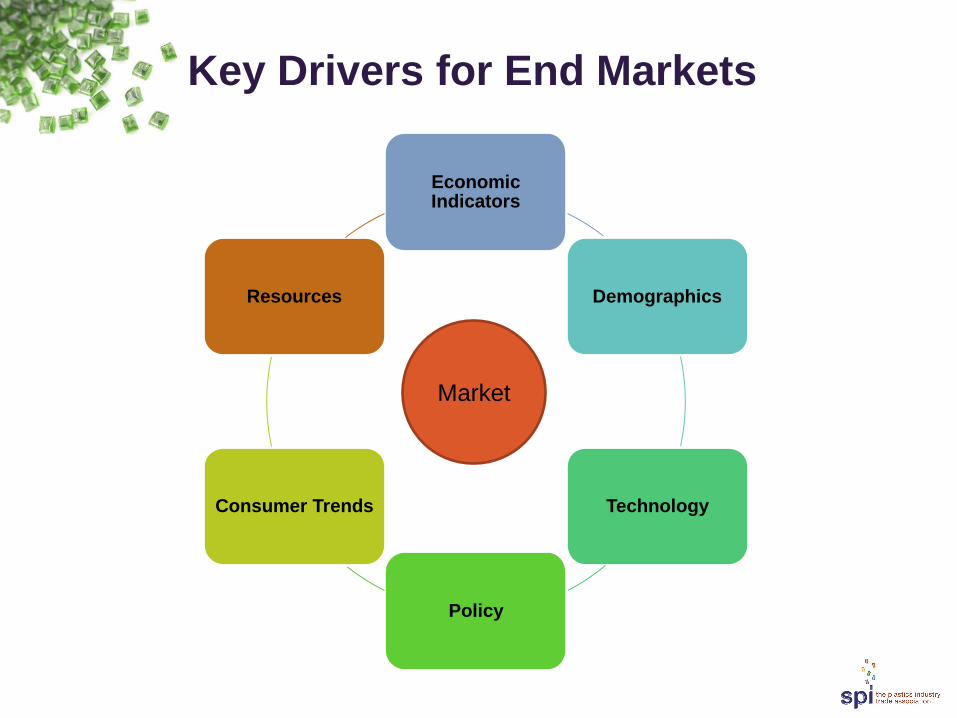
Key Drivers for End Markets
Economic Indicators
Demographics
Technology
Policy
Consumer Trends
Resources
Market
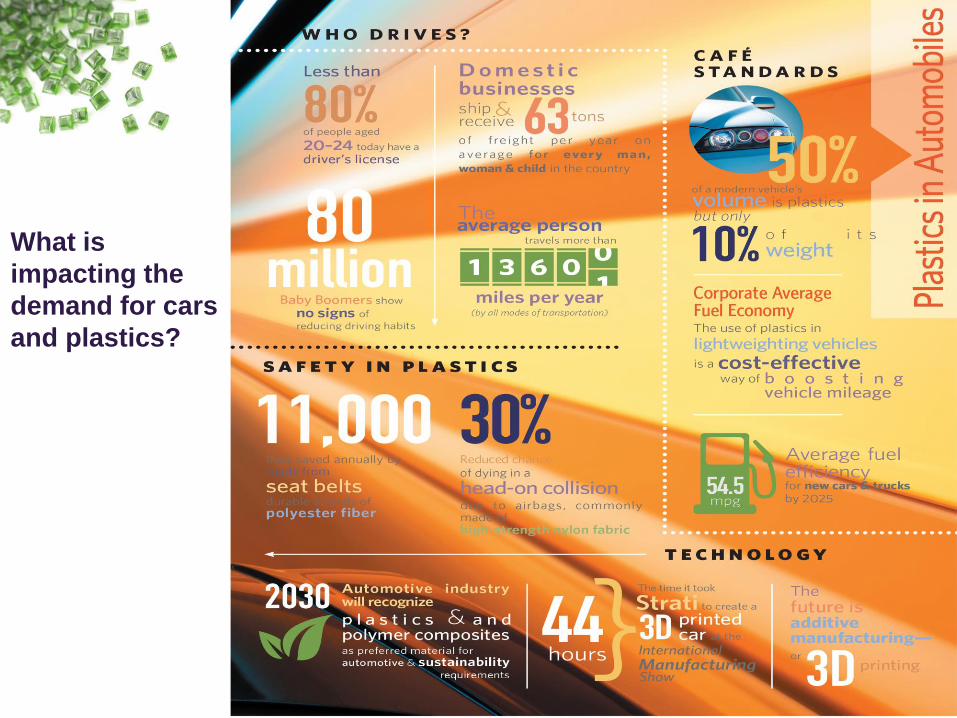
What is
impacting the
demand for cars
and plastics?
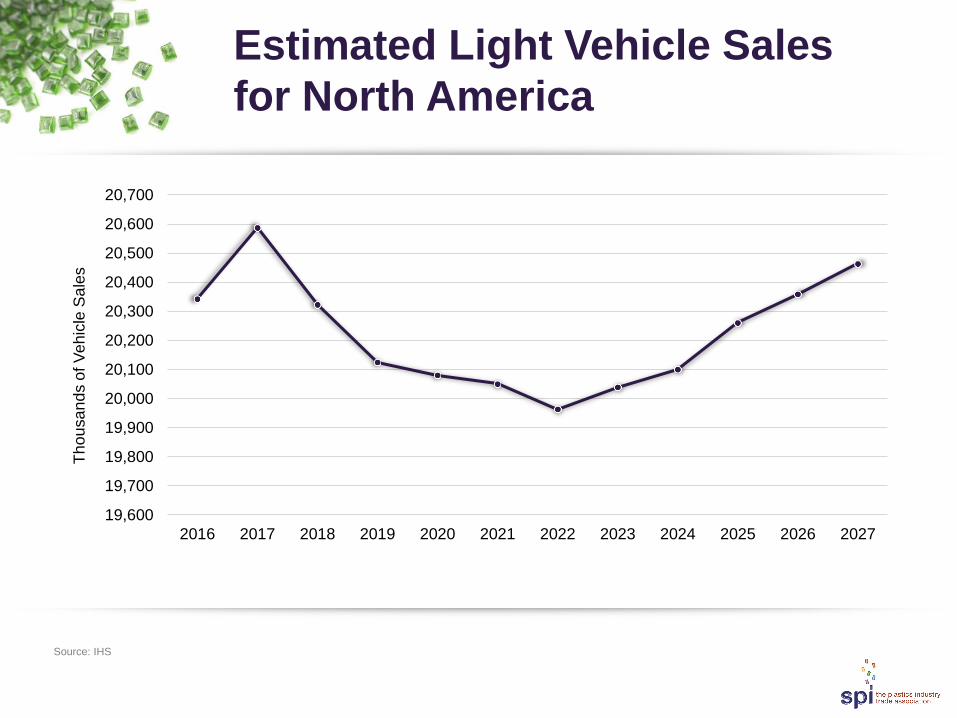
Estimated Light Vehicle Sales
for North America
19,600
19,700
19,800
19,900
20,000
20,100
20,200
20,300
20,400
20,500
20,600
20,700
2016 2017 2018 2019 2020 2021 2022 2023 2024 2025 2026 2027
Th
ou
sa
nd
s o
f V
eh
icle
Sa
les
Source: IHS

Trend Matrix for Medical End
Market
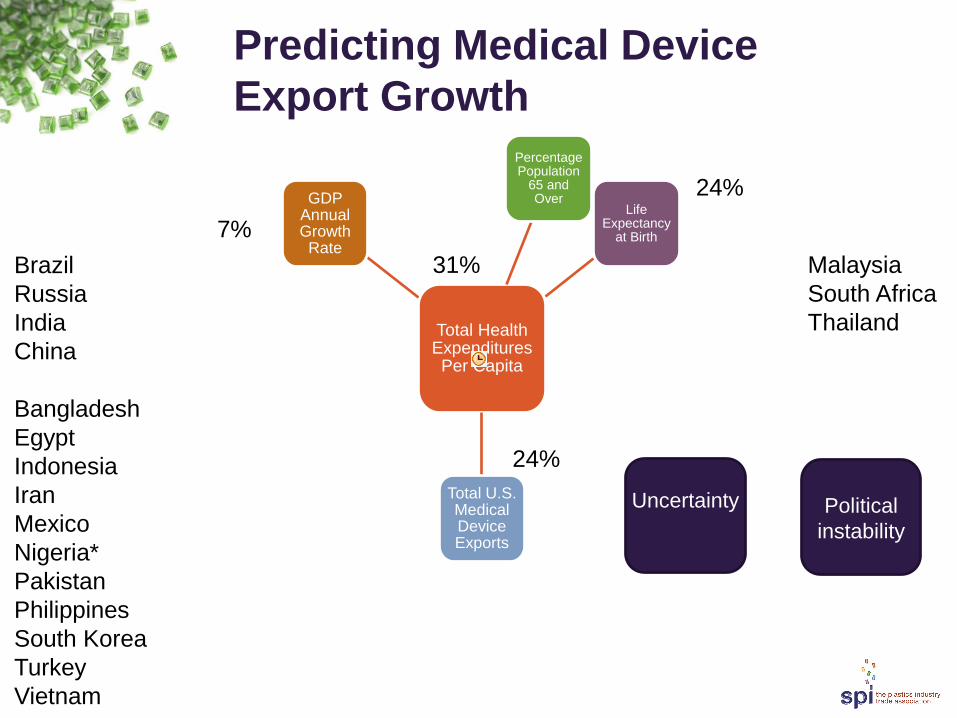
24%
31%
7%
24%
Total Health Expenditures Per Capita
Percentage Population
65 and Over
Life Expectancy
at Birth
Total U.S. Medical Device Exports
GDP Annual Growth Rate
Malaysia
South Africa
Thailand
Brazil
Russia
India
China
Bangladesh
Egypt
Indonesia
Iran
Mexico
Nigeria*
Pakistan
Philippines
South Korea
Turkey
Vietnam
Predicting Medical Device
Export Growth
Political
instability
Uncertainty
Global Plastic Packaging Market
Expected to Rise
• The global plastic packaging market was valued at US$259.65 billion in 2013 and is expected to reach US$370.25 billion by 2020.
• In terms of volume, the plastic packaging market was 78,400.2 kilo tons in 2013.
• Asia Pacific accounted for the highest demand for plastic packaging in 2013, which was over 35% of the market share.
• This trend is expected to continue over the forecast period on account of rapid economic development in this region resulting in the growth of industries such as food & beverages, personal care products and pharmaceuticals among others.
• Regions in the Rest of the World are expected to witness significant increase in consumption of packaging due to economic development in countries such as Brazil.
25
Key Factors Driving the Growth
of Plastic Packaging
• Increasing demand for plastic packaging in the healthcare industry is
expected to be one of the key factors driving the growth of this
market.
• In addition, expansion of the food & beverages market, which is the
largest application of plastic packaging, is expected to fuel growth.
• Furthermore, rising consumer preference towards light weight,
durable and highly aesthetic packaging is expected to significantly
encourage growth of the market over the next few years.
• Demand for plastic packaging was highest from the food &
beverages sector and accounted for over 65% of the market share
in 2013.
26

Thank You!
谢谢 Merci Vielen Dank
Grazie ありがとうございました 감사합니다
Obrigado Спасибо Gracias Teşekkürler
Questions & Answers
Michael Taylor
202-974-5232


![Uflex conferred with the Export Award for Metalized Polyester Film by 'The Plastics Export Promotion Council' [Company Update]](https://img.pdfslide.us/doc/110x75/577cb1411a28aba7118b9639/uflex-conferred-with-the-export-award-for-metalized-polyester-film-by-the.jpg)